Article

A Novel New Light Recipe Significantly Increases the Growth and Yield of Sweet Basil (Ocimum basilicum) Grown in a Plant Factory System

School of Biological and Marine Sciences, University of Plymouth, Plymouth PL4 8AA, UK
*
Author to whom correspondence should be addressed.
Agronomy 2020, 10(7), 934; https://doi.org/10.3390/agronomy10070934
Submission received: 5 June 2020 / Revised: 23 June 2020 / Accepted: 26 June 2020 / Published: 29 June 2020
(This article belongs to the Special Issue Control of LED Lighting Based on Plant Physiological Principles)

Abstract

:
Light is a crucial element for plant growth and production. High-pressure sodium (HPS) lamps are considered not very electrically efficient as they generate high radiant heat, and as a consequence, there has been a lot of interest in replacing HPS lamps with new more efficient lighting sources in the form of light-emitting diodes (LEDs). LEDs have a linear photon output with the electrical input current, and this great feature allows the design of lighting arrays that match the plant’s needs. In the current study, light spectrum absorbance of pigments extracted from 14 plant species was analyzed. Two absorbance peaks were observed in the Photosynthetically Active Radiation (PAR) region: one at 435 nm and the other at 665 nm. The light spectrum array was designed to produce the spectrum absorbed by basil pigments. This included the use of new wavelengths of 435 ± 5 nm to cover the blue region. Moreover, the ratio between blue and red was considered to match the absorbance of basil pigment. The use of a light spectrum that matches the plant absorbance significantly improved the investigated physiological parameters and increased the growth yield of basil. Moreover, this is the first to confirm the great positive impact of using 435 nm light spectrum in comparison with the commercially widely used 450 nm LED spectrum. This investigation has great scientific and commercial applications in the field of indoor faming and plant factory systems.

1. Introduction

Ocimum basilicum L. (basil) belongs to the Lamiaceae family and grows wild in tropical and subtropical climates [1]. Basil is an important culinary herb and essential oil crop grown and is used worldwide [2,3], and basil essential oil has been used widely in the food industry as a food flavour, in the medical industries [4] as a component of oral health and dental products and in the fragrance industry [5]. Moreover, basil has been claimed to be effective in treating several medical complaints such as anxiousness, stomach aches, pyrexia, kidney failure, arthropod stings, sickness, infections, headaches, coughs, acne and constipation [5,6,7,8,9]. Basil essential oils contain a wide array of chemical compounds, depending on genotype and growing conditions (light, temperature and irrigation) [10]. The main active organic biochemical components of basil essential oils are estragole, a phenylpropene used in perfume manufacturing and as a food additive for flavour [11,12], and Linalool, which is used widely as a scent in many hygiene products and cleaning agents [13,14].
Photosynthesis is a chemical process whereby light plays a major role in utilizing carbon dioxide and water in the chloroplast to produce glucose, which is the source of energy for plant growth and development. Wavelengths of light between 400–700 nm are the drivers of photosynthesis in plants and are typically referred to as Photosynthetically Active Radiation (PAR). However, plants do not respond uniformly to all wavelengths of PAR.
A new method of artificial grow light source, Light Emitting Diodes (LEDs) has been intensively developed in recent years [15] and, now, has potential for use in agricultural and horticultural production. LEDs have a linear photon output with electrical input current [16]. LEDs also have a substantial potential importance in plant development because LEDs can be constructed in arrays big enough to provide enough PAR but still small in size (few centimetres in diameter) and still emit less heat than “traditional” high-intensity discharge lighting lamps [17,18,19,20]. LEDs are also known for their durability and long operating lifetime [21]. LED arrays can be designed to have wavelength specificity [22], which is a key factor due to the fact that each plant species differentially responds to different light wavelengths due to specific differences in their photoreceptors [14]. Numerous research has investigated the role of LEDs to enhance plant shape, edible quality [23], biomass, number of leaves [24], growth rate and stem width [25]. Simultaneously, research has demonstrated the effects of LEDs on chemical compounds such as vitamin C content, soluble sugar content [26], chlorophyll level [27], antioxidant activity [28] and different protein levels of many plant species. Plants do not utilise all wavebands of white light (sunlight) equally, but those between 400–700 nm provide photons of the correct energy to drive photosynthesis and these wavelengths are typically referred to as Photosynthetically Active Radiation (PAR) [29,30,31]. Other wavebands are also important in photo-morphological development (above 700 nm) and in causing damage to plant cell DNA (below 400 nm) [14], as cited from [32].
Sweet basil cultivation using grow lights in indoor farming layouts has been and still is the focus of many researchers [33,34]. In choosing the right quality of light for the cultivation of any crop and, in this case, for sweet basil, many researchers refer to the McCree curve [29,35] in their work regarding the use of artificial lighting [36,37,38]. However, the McCree curve cannot be related to the individual illumination requirements of plants. The McCree curve sheds light on the importance of some light regions in the reaction of photosynthesis but does not look at the full spectrum of light absorption by plants. Furthermore, the McCree study was conducted under low light intensity (approx. 50 µmol m−2 s−1) which has a big limiting impact on the growth and development of plants, as demonstrated by [39,40]. The McCree curve does not give a full light requirement profile of plants, and there still exists the need for a full analysis to determine individual plant species light requirements.
In the current study, sweet basil was chosen as a model for this analysis. Sweet basil was cultivated under controlled environment conditions (temperature, humidity and light) in a plant factory system aimed at investigating whether the supply of a light regime that matches plant absorbance would improve the growth and quality of sweet basil. This included the use of a new wavelength which has not been used for agricultural application before.

2. Materials and Methods

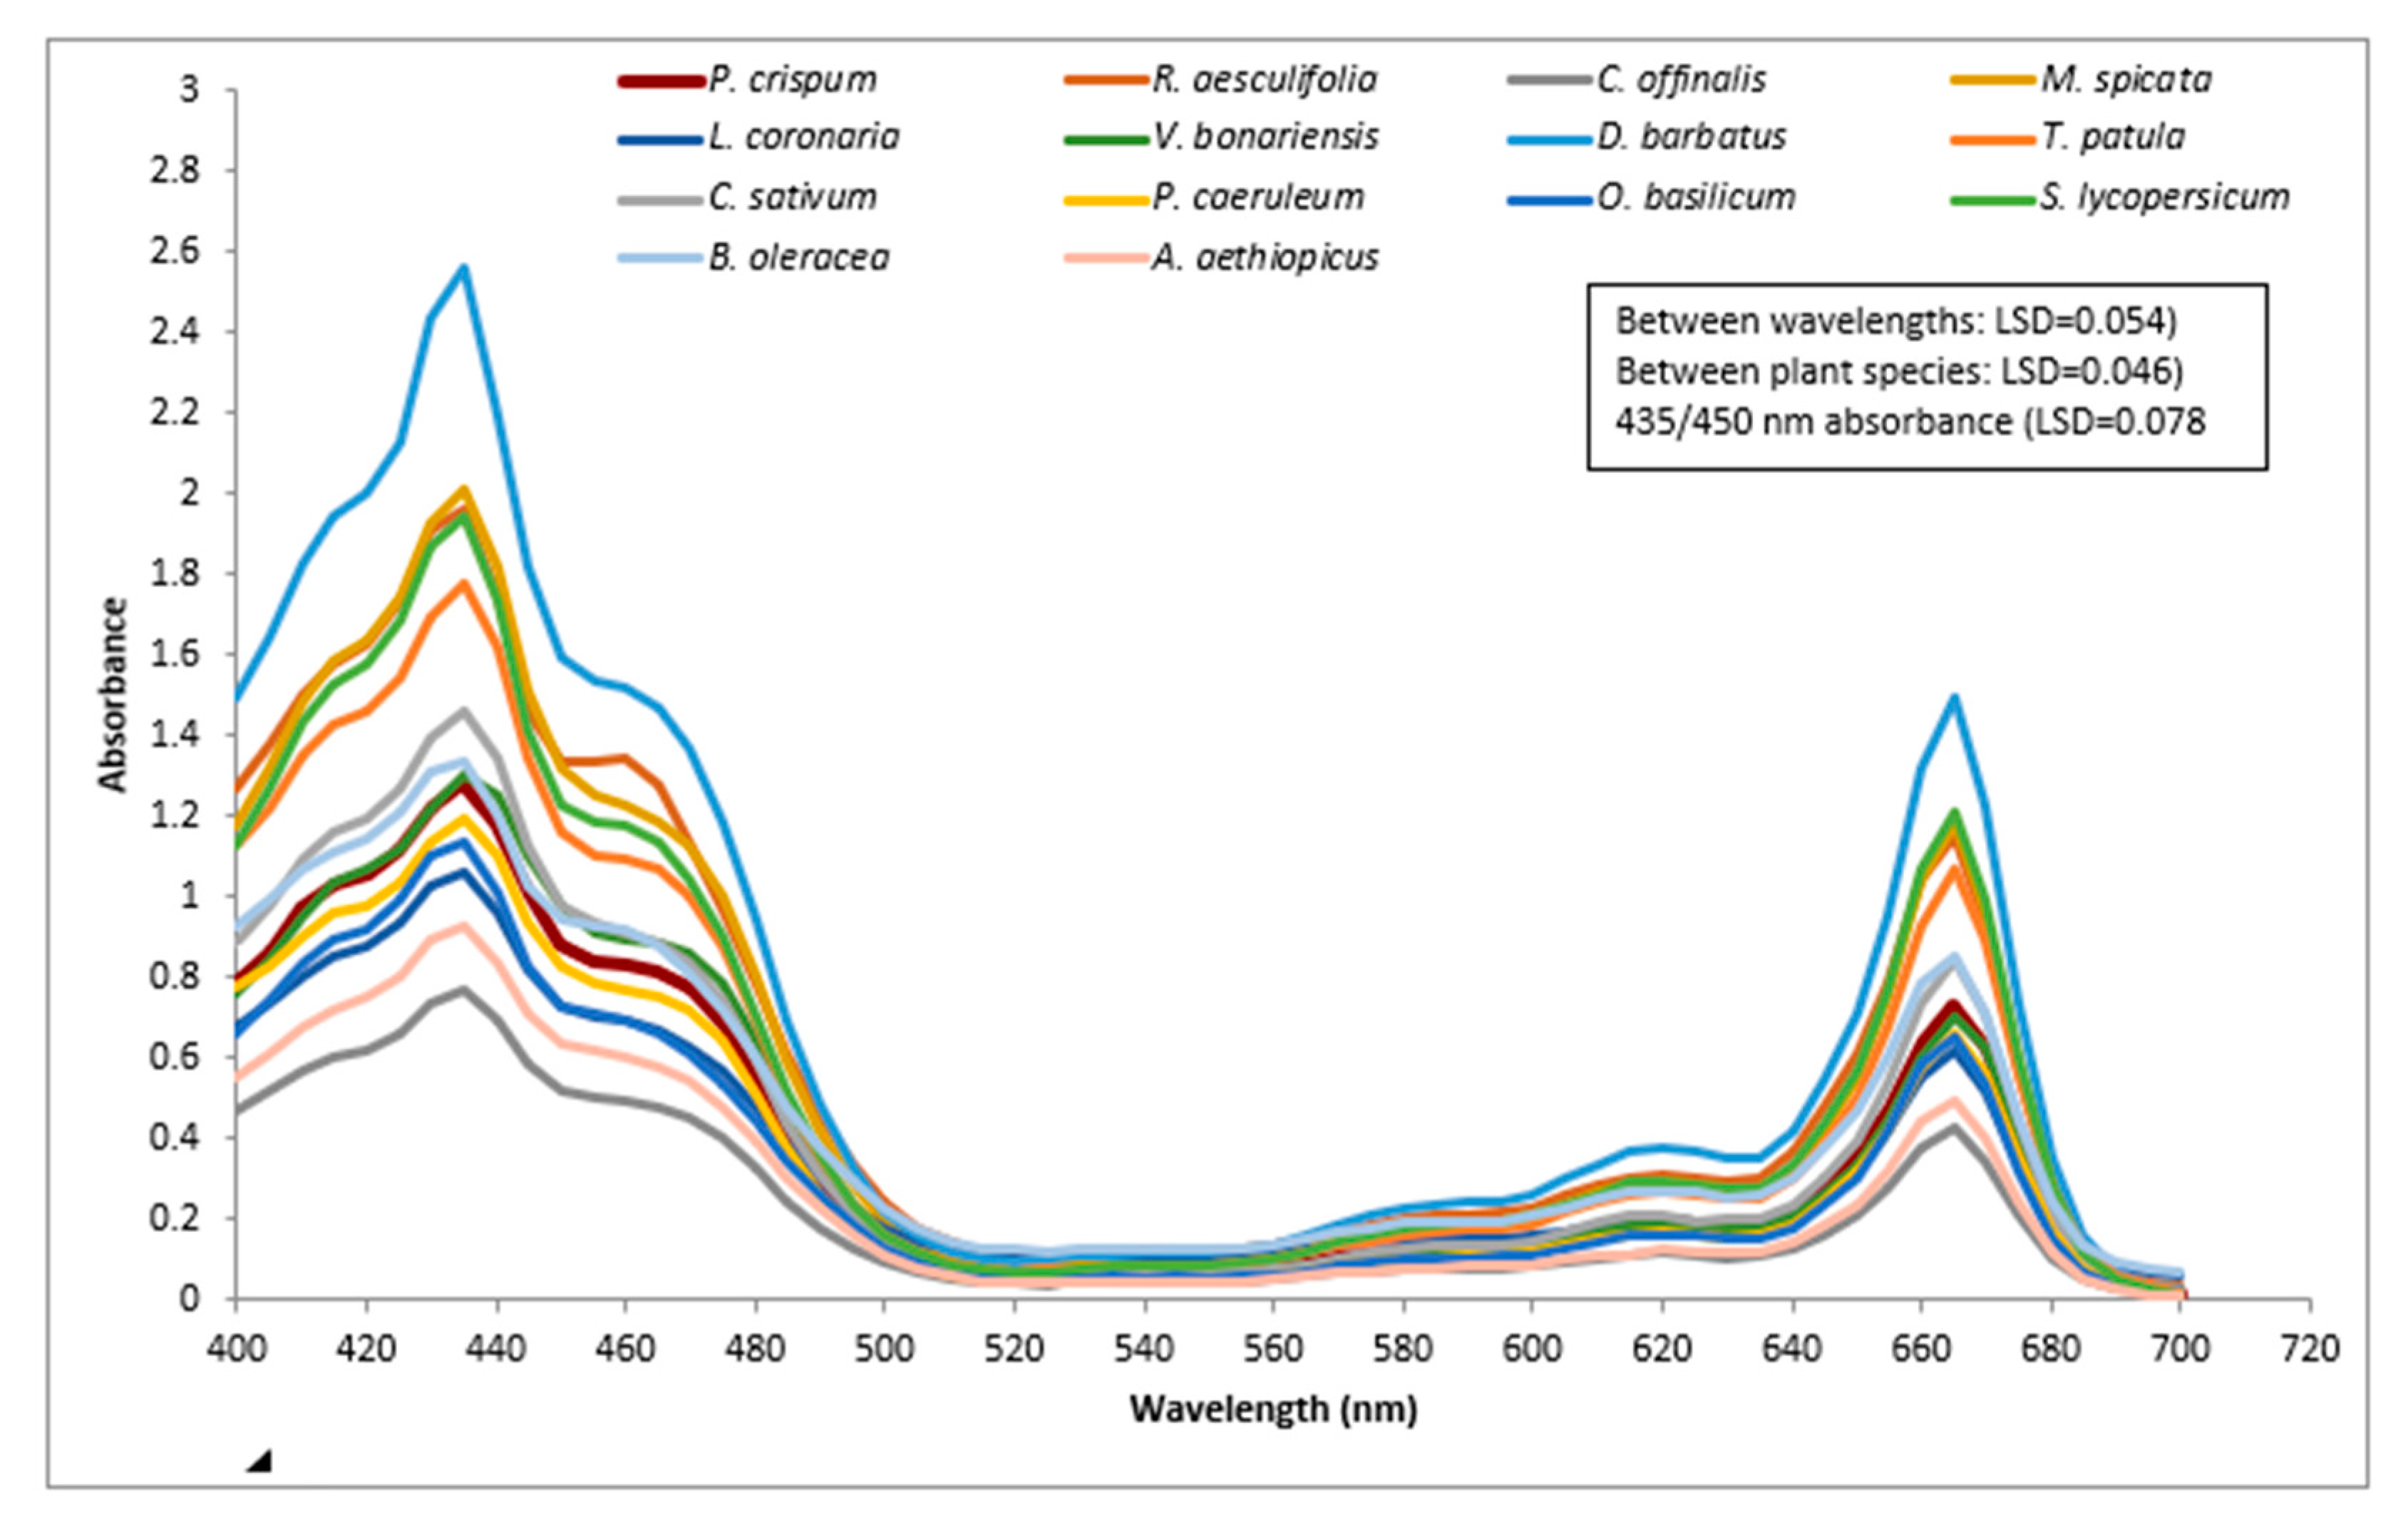
2.1. Absorption Spectra of 14 Plant Species between 400 and 700 nm

Several plant species were grown for pigment extraction viz Calendula officinalis (pot marigold “improved orange”), Mentha spicata (common mint), Lychnis coronaria (rose campion), Verbena bonariensis (purpletop vervain), Dianthus barbatus (“dash pink”), Tagetes patula (French marigold “durnago mix”), Coriandrum sativum (coriander), Polemonium caeruleum (Jacob’s ladder), Ocimum basilicum (basil) and Asparagus aethiopicus (Sprenger’s asparagus). Plants were grown in polytunnels for 8 weeks bespoke compost mixture: Brassica oleracea var. botrytis (cauliflower) and Solanum lycopersicum (tomato) at Skardon Garden at the University of Plymouth. Plant leaves (0.2 g) were ground in 10 mL of 80% acetone using a pestle and mortar. The volume was then made up to 25 mL using 80% acetone for each sample. Samples were then centrifuged for 2 min at 6000 RPM min−1 (max setting) in a ROTOFIX 32 (Tuttlingen, Germany). The supernatant (2 mL) was placed in a cuvette, and the absorbance was measured at 5 nm intervals between 400 and 700 nm using a Jenway 7315 (Staffordshire, UK) spectrophotometer (Figure 1). Three plants were grown for each species (biological replicates), and triplicate samples were taken from each plant (measurement replicates).

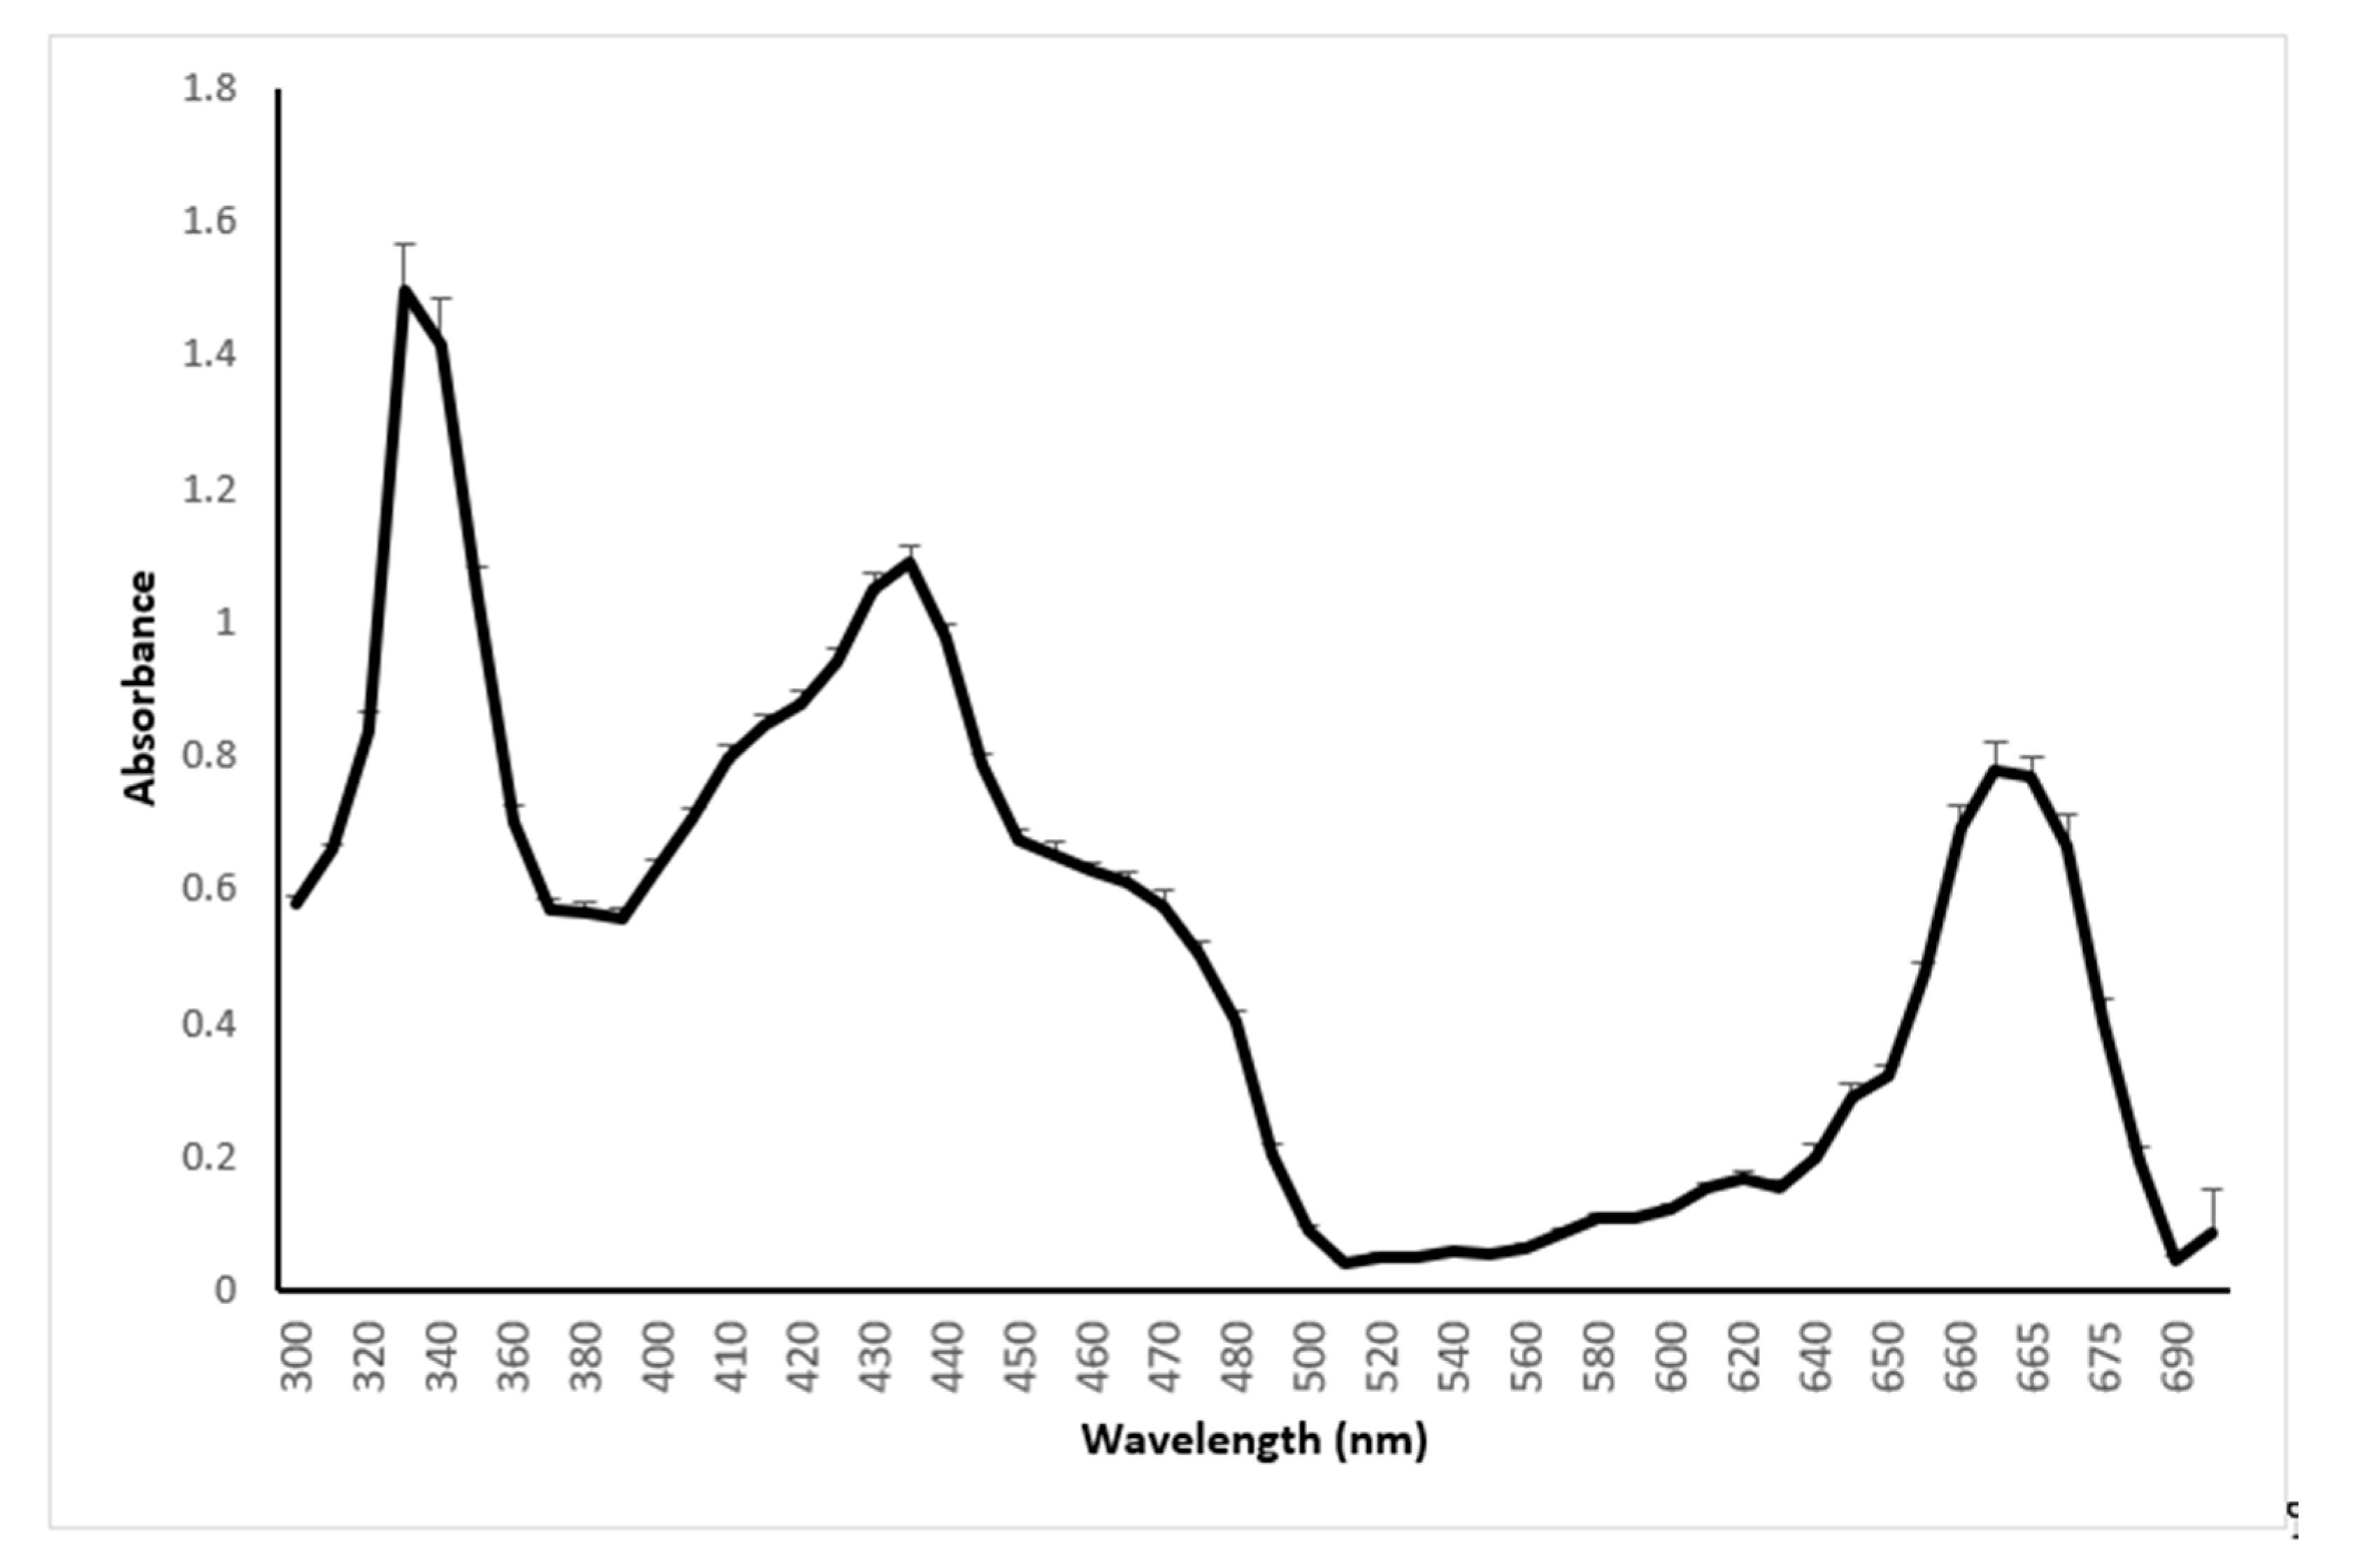
2.2. Absorption Spectrum of Sweet Basil between 300 and 700 nm

Sweet basil cv. Maggie seeds were obtained from CN seeds (CN Seeds, Pymoor, Ely, Cambridgeshire, UK), were sown and were germinated in a glasshouse at Skardon gardens. Growing conditions were applied as reported previously [41]. Plants were harvested at full vegetative growth, pre-flowering.
Two experimental replicates from three separate sweet basil plants were used (three biological replicates). Pigments were extracted following the methods described above, and the absorption was measured every 5 nm between 300 and 700 nm using a Jenway 7315 spectrophotometer.

2.3. Growth of Sweet Basil under Different Lighting Regimes

Sweet basil cv. Maggie seeds were obtained from CN seeds (CN Seeds, Pymoor, Ely, Cambridgeshire, UK), sown and germinated in the greenhouse at Skardon Gardens. When seedlings had their first pair of true leaves, they were then transferred to the Plant Factory facility at the University of Plymouth. The Plant Factory facility at the University of Plymouth is a converted insulated greenhouse where external light has been excluded and a multi-tier hydroponic growing system consists of gulleys for NFT (nutrient film technique) and is installed with interchangeable LED light units. The Plant Factory system was divided into several multi-shelf hydroponic units, each consisting of three tiers. The distance between tier is 50 cm, and 16 basil plants were planted in each tier at a spacing of 20 cm within a gully and 20 cm between gullies. The temperature and humidity were monitored using Gemini data loggers (Tinytag Plus (part No GP-1590)) and an instantaneous thermometer (Fisher Scientific) at 28 ± 2 °C. The dark/light period was set to 8/16 h. Three lighting treatments were designed and applied using Shy LED lighting systems (LED Hydroponic LTD., Reading, UK) in addition to ambient light in the greenhouse treatment. Light treatments were as follows:
An LED light treatment with a combination of red (663 nm) and blue (450 nm), with a ratio of red to blue LEDs of 1:1.5, was designated R/B450.
An LED light treatment with a combination of red (663 nm) and blue (435 nm), with a ratio of red to blue LEDs of 1:1.4 to mirror the absorption ratio from the sweet basil light absorption curve (Figure 2), was designated R/B435.
An LED light treatment with a combination of red (663 nm) LED and blue (450 nm), with a ratio of red to blue LEDs of 1:1 as found in many commercial lighting rigs, was designated R/B; 1:1.
A Glasshouse (GH) treatment with ambient light was supplemented with High Pressure Sodium (HPS) lights to extend the light period (daylength) to 16 h. Light intensity measured in the greenhouse at 11.30 am BST on 12 April on a sunny day was 1250 µmol m−2 s−1. The daily light integral was estimated to be 34.60 mol day−1 using mathematical models and included supplementary lighting to extend the lighting period.
Light intensity from the LED lighting treatments was measured using a Skye PAR (Photosynthetically Active Radiation) (Skye Instruments Ltd., Powys, UK) and adjusted to deliver 300 ± 20 µmol m−2 s−1 for each treatment. Daily light integral for the LED lighting treatment was calculated at 17.28 mol day−1. The emitted light spectrum of the lighting treatments was measured (relative light intensity) using a UPRtek spectrophotometer (UPRtek MK350N premium Standalone handheld spectral light meter, Taiwan) and corrected to show the radiant density at each wavelength (Figure 1).
Physiological and morphological responses of sweet basil to the lighting treatments were measured at three stages of development: at the initial vegetative stage when sweet basil plants had 4–5 pairs of leaves (Stage 1), at the end of the vegetative stage when flowering buds started to appear (Stage 2) and at the full flowering stage (Stage 3). The experiment was carried for a total of 40 days (final harvest on 30 April 2019).
Physiological measurements included light-saturated instantaneous maximum photosynthetic rate Amax (µg cm−2 s−1) measured using an LCi-SD Highly Portable Ambient Photosynthesis System (ADC BioScientific, Herts, UK), the chlorophyll fluorescence ratio (Fv/Fm) measured using a Hansatech Pocket PEA meter (Hansatech Ltd., Norfolk, UK) and stomatal conductance (cm s−1) measured using a Delta-T AP4 Leaf Porometer (Delta T Devices, Cambridge, UK).
Morphological measurements included plant height (cm); leaf area (LA mm2), using a leaf area image analyser HITACHI KP-D40 color digital camera with a lightbox and WinDias 1.5 software (Delta-T Devices Ltd., Cambridge, UK); fresh weight (FW); and dry weight (DW) (g) after removing the root system, using a sensitive Fisher Scientific SG-402 laboratory balance; for dry weight, plants were dried at 60 °C for 96 h [42].

2.4. Essential Oil Content

Dry plant material (stems and leaves) was used to extract the essential oil from sweet basil using a solvent extraction method [43] with some modifications. Dry plant material (20 g) was ground in a mortar and pestle with 10 mL of FISHER Scientific’s HPLC-grade C6H14 (Hexane) ≥ 95% (Thermos Fisher Scientific). The resultant mixture was then added to a sintered column with the addition of 60 mL of hexane. The mixture was drained, and the solution was collected. A significant amount of used hexane was evaporated using a BÜCHI R-124 Rotary Evaporator System. A blow-down technique using thermal Techne® Sample Concentrator and BOC nitrogen gas was applied to evaporate the rest of the hexane from the solution [44]. The essential oils of sweet basil were then collected in a vial. The vial was weighed after the blow-down to calculate the quantity of the essential oil obtained.

2.5. Light Use Efficiency (LUE)

The light use efficiency model is a model of net primary productivity (NPP); it predicts that NPP is directly proportional to absorbed photosynthetically active radiation (APAR):
NPP = e APAR,
where the parameter e (or LUE (light use efficiency)) represents all of the photosynthetic and respiratory processes [45]. In the current study, we used dry weight as an indication of the NPP and we used the provided PAR intensity as an indication of the APAR. A simple LUE was calculated using the above quotation by dividing the DW (g m2) by the sum of the PAR provided over 40 days (Mol).

2.6. Statistical Analysis

The main experiment consisted of 4 lighting treatments (3 in the plant factory and 1 in the glasshouse), with 16 plants per treatment (four replicates each consists of 4 plants). Treatments were randomized at each replication. Dataloggers (delta T devices) were placed in each treatment, and no significant differences in temperature regimes were noted. Results are presented as means ± standard error (S.E.). All data were subjected to analysis of variance (ANOVA) using Minitab software (version 17), and comparisons of means were made using the least significant difference (LSD) test at the 5% level of probability.

3. Results

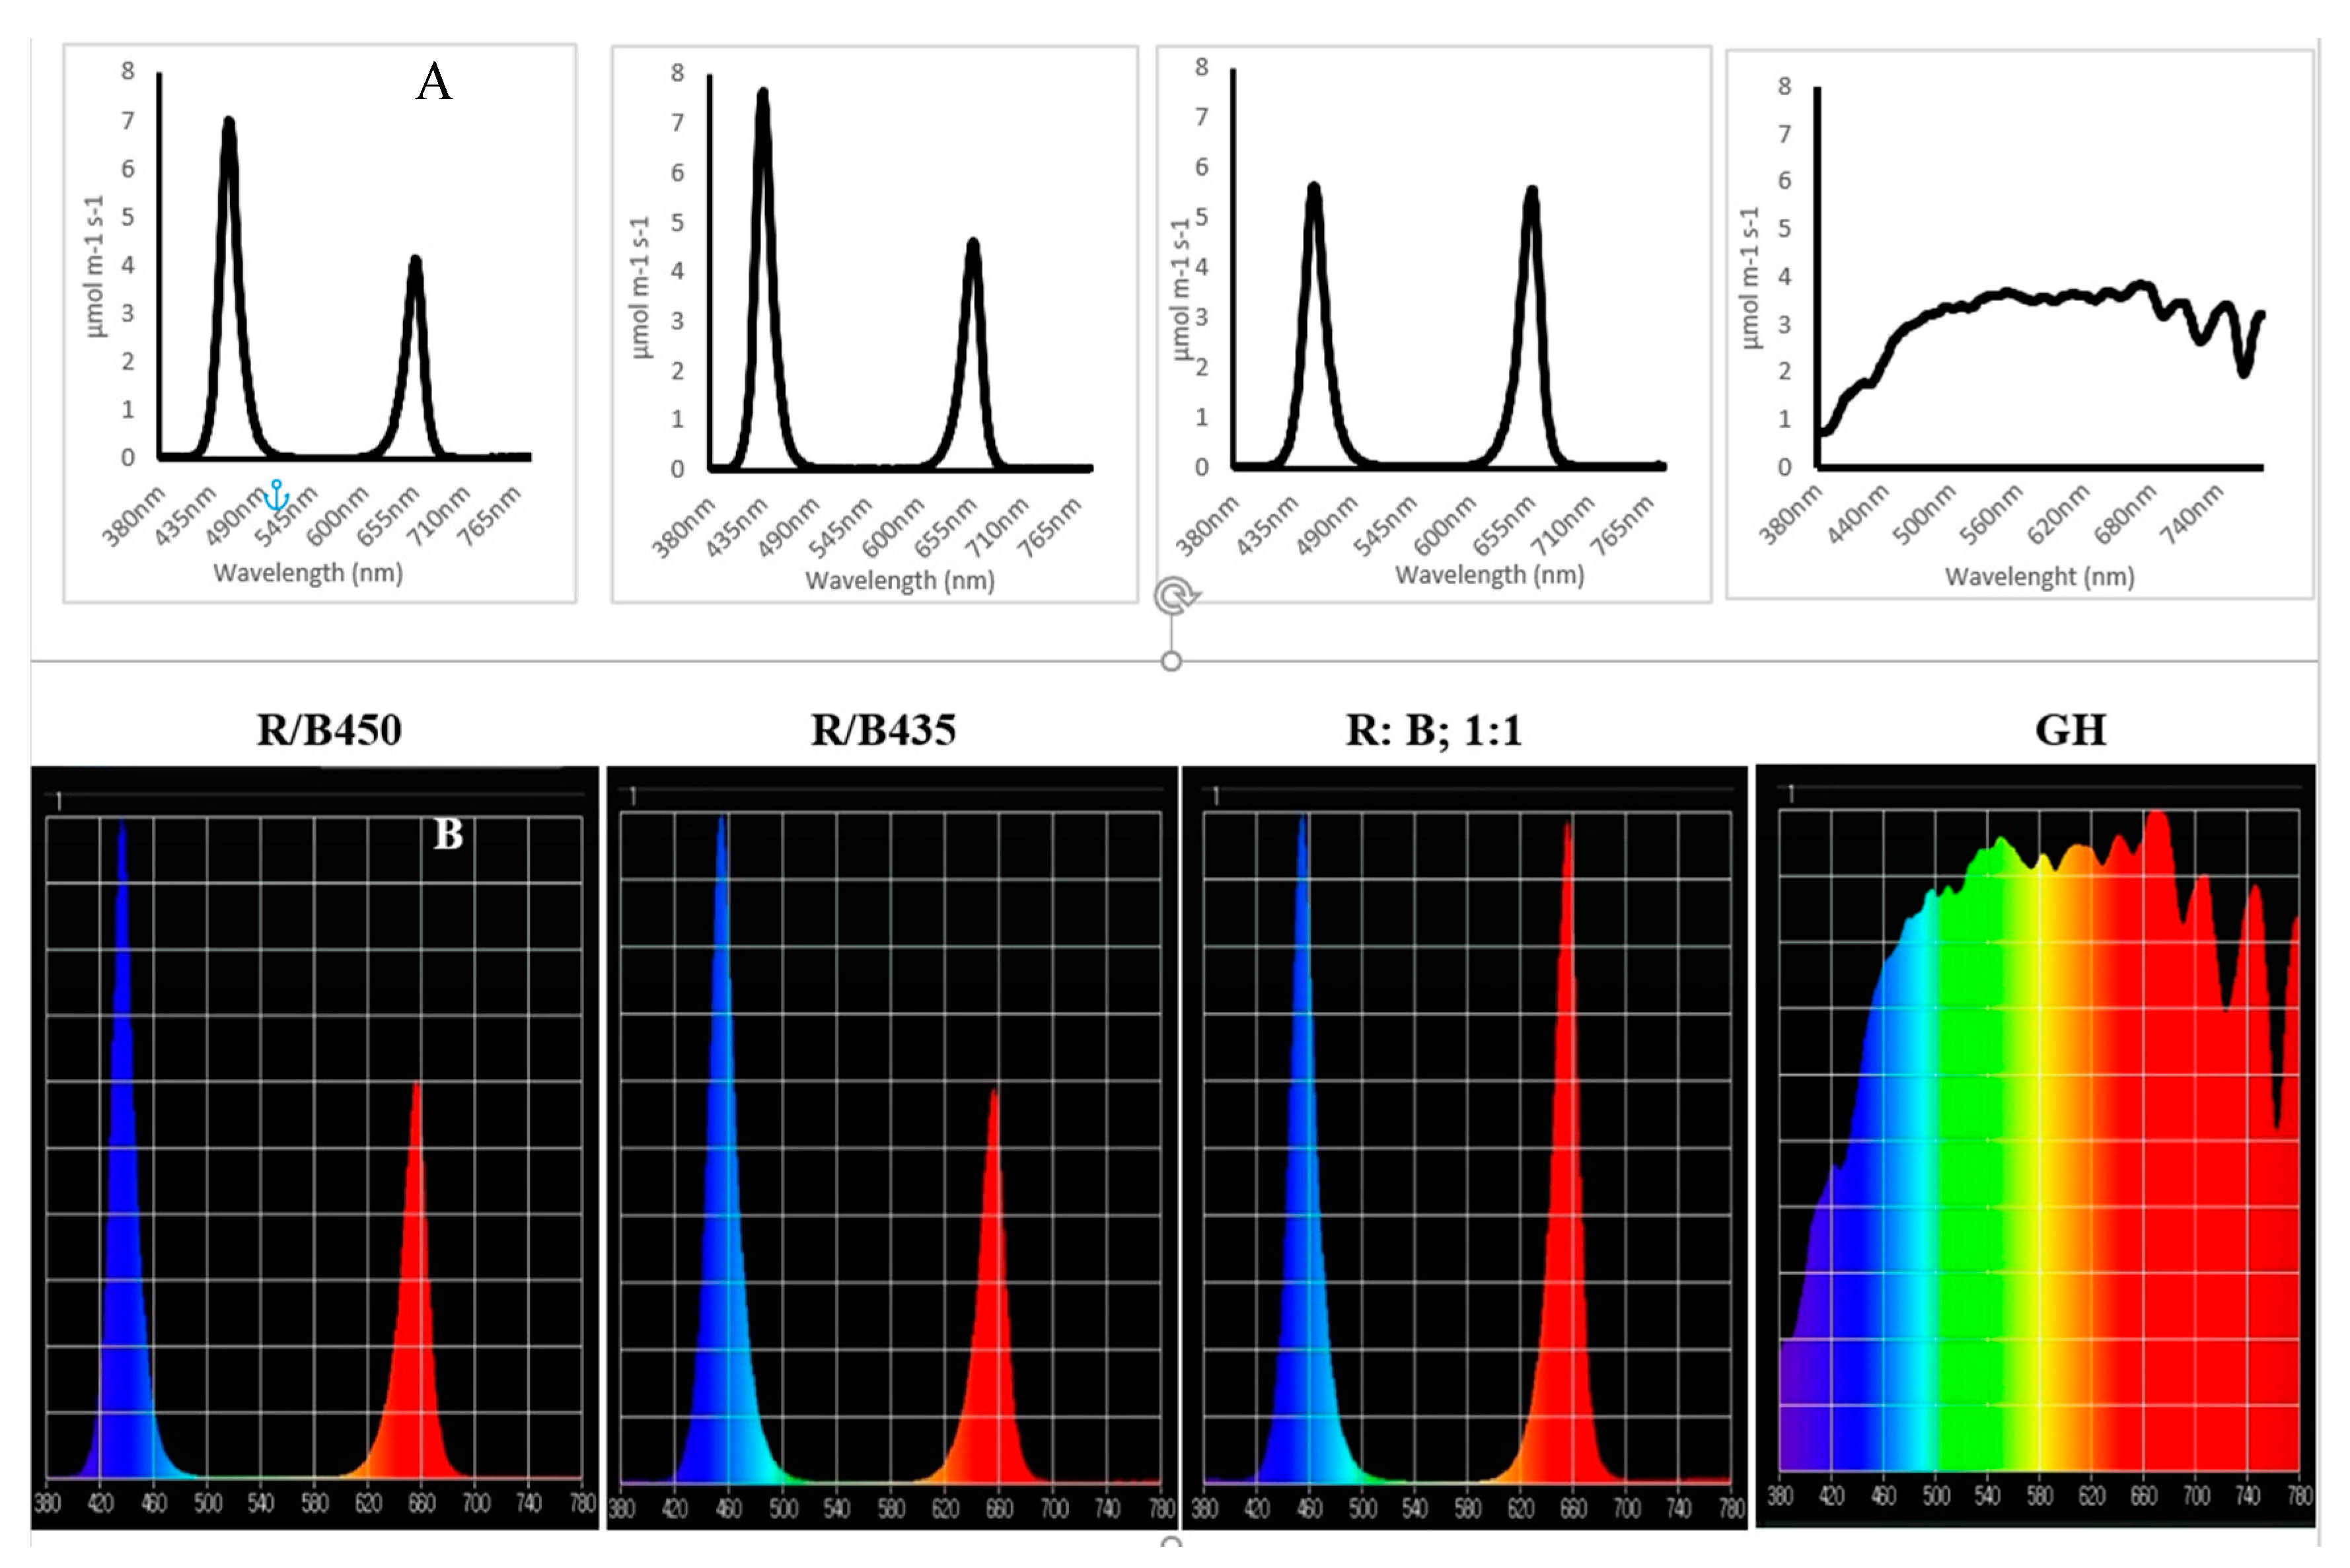
3.1. Light Spectrum Analyzed

3.1.1. Spectrum Analysis (between 400 and 700 nm) of 14 Plant Species

The absorption spectrum of the plant species tested showed similar curve shapes between species but varied significantly in their relative absorption (p ≤ 0.001) (Figure 2). There were two main absorbance peaks at 435 nm (blue) and at 665 nm (red). Whilst the red peak was a relatively narrow (from 640 to 690 nm), the blue peak was very broad (from 400 (or less) to 480 nm). The blue to red ratio was calculated for each species, and there were significant differences between plant species in terms of the ratios of peak sizes at 435 nm to 665 nm: p ≤ 0.001. The highest 435/665 absorbance ratio was observed in Solanum lycopersicum (1.867), and the lowest was observed in Brassica oleracea (1.532). There was also a significant impact of the plant species on the total light absorbance (area under the absorbance curve) (p ≤ 0.001) with Dianthus barbatus showing the highest level of absorbance and Calendula officinalis showing the lowest level of absorbance.

3.1.2. Spectrum Analysis (between 300 and 700 nm) of Sweet Basil (Ocimum basilicum)

The absorption curve for basil (Figure 3) showed three main absorption peaks, a blue (at 435 nm) and a red (at 665 nm) as found above and a third peak in the ultraviolet range at 330 nm (from 300 to 360 nm). The blue–red ratio between the absorbance peaks at 435 nm and 665 nm was 1.4 (Figure 3).

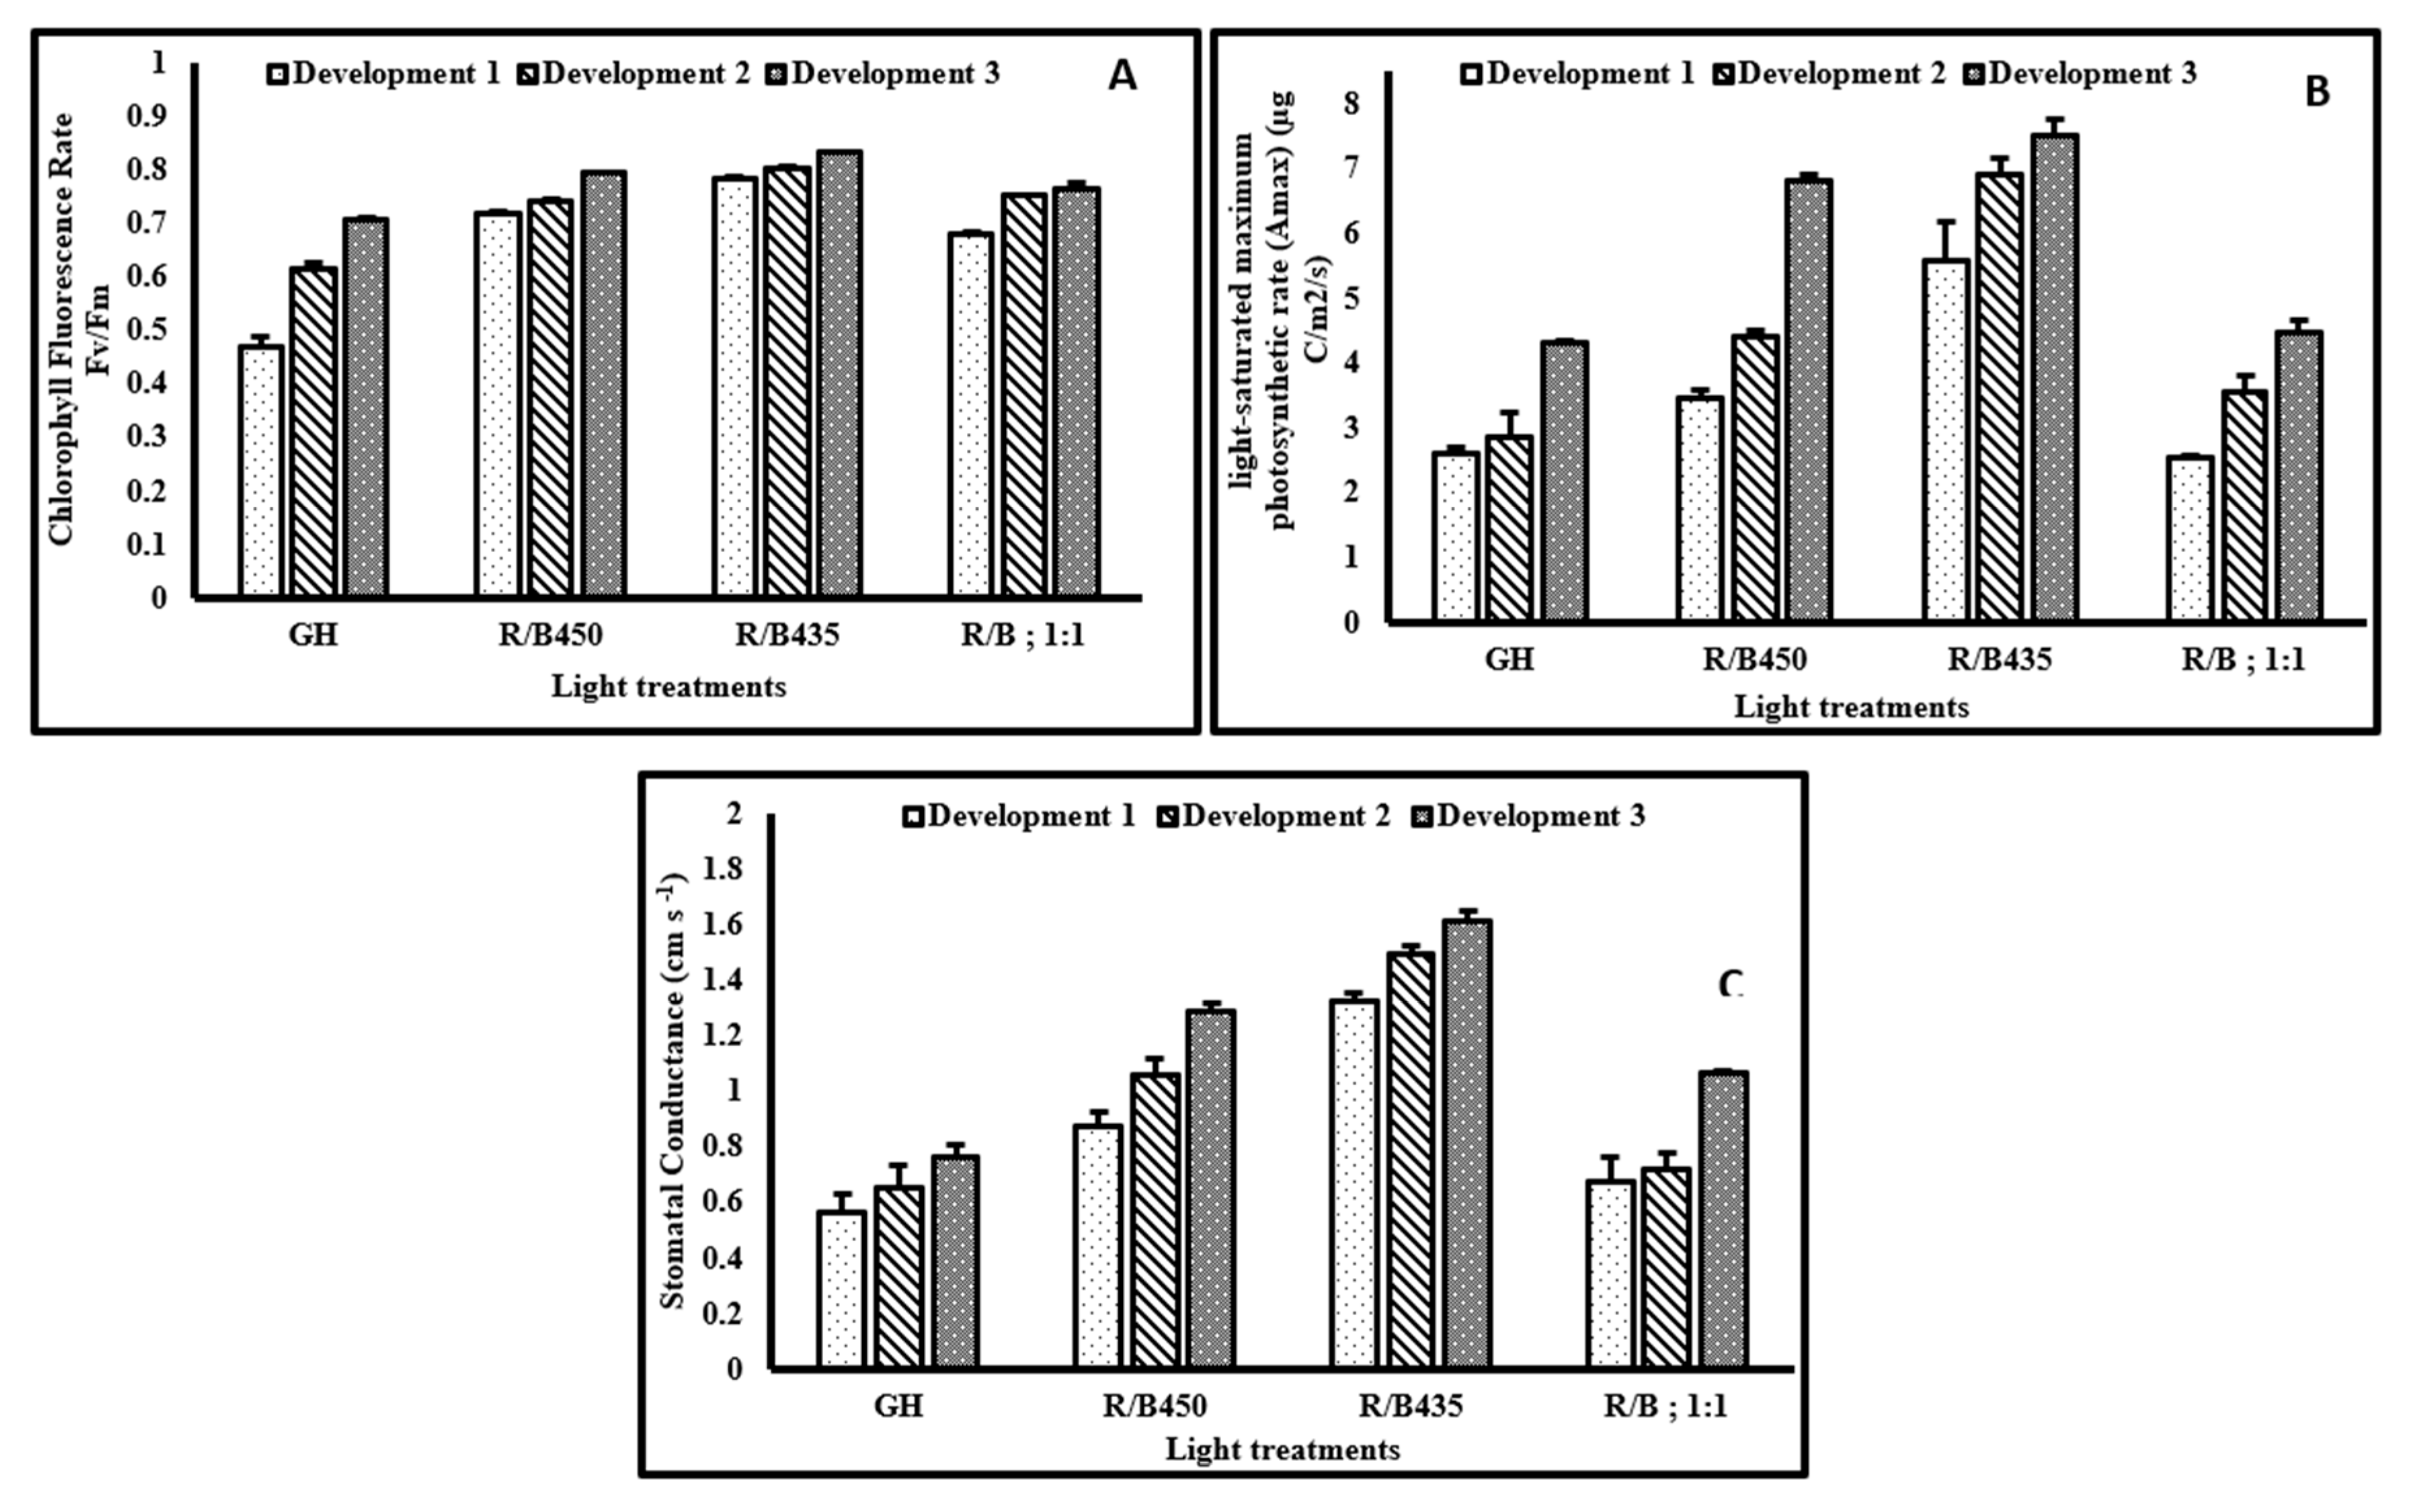
3.2. Physiological Responses

3.2.1. Chlorophyll Fluorescence Rate Fv/Fm

Light treatments had a significant impact on Fv/Fm. The plant factory light treatments had a significantly (p ≤ 0.001) higher value of Fv/Fm than the greenhouse grown plants at all developmental stages (Figure 4A), and the LED light treatment R/B435 had the highest Fv/Fm value. Plant development stage also had a significant effect (p ≤ 0.001), with Fv/Fm increasing as development progressed under all light regimes. There was an interaction between the development stages and the light treatments (p ≤ 0.001), with more variation under the glasshouse conditions and the B/R; 1:1 treatment than under the R/B450 and R/B435 treatments.

3.2.2. Light Saturated Maximum Photosynthetic Rate (Amax)

There was a significant effect (p ≤ 0.001) of the lighting treatments on Amax. LED lighting treatment R/B435 (Figure 4B) promoted the highest Amax, and the lowest was found in the glasshouse-grown plants. Development stage also had a big impact (p ≤ 0.001) on Amax and peaked when the plants were at the end of the vegetative stage. Furthermore, there was a significant interaction between the light treatments and the development stages on Amax (p = 0.007). Among the LED lighting treatments, the treatment R/B435 had the highest Amax at all developmental stages.

3.2.3. Stomatal Conductance (Gs)

There was a big effect of the lighting treatments (p ≤ 0.001) on Gs, with the R/B435 treatment showing the highest Gs values and the glasshouse treatment showing the lowest (Figure 4C). Developmental stage also had a significant effect (p ≤ 0.001) with Gs progressively increasing with the later development stages. There was no significant effect of the interaction between the light treatment and developmental stage (p = 0.18). Overall, the LED light treatments had a more positive impact on Gs than the glasshouse, and the R/B435 had the highest Gs (Figure 4C).

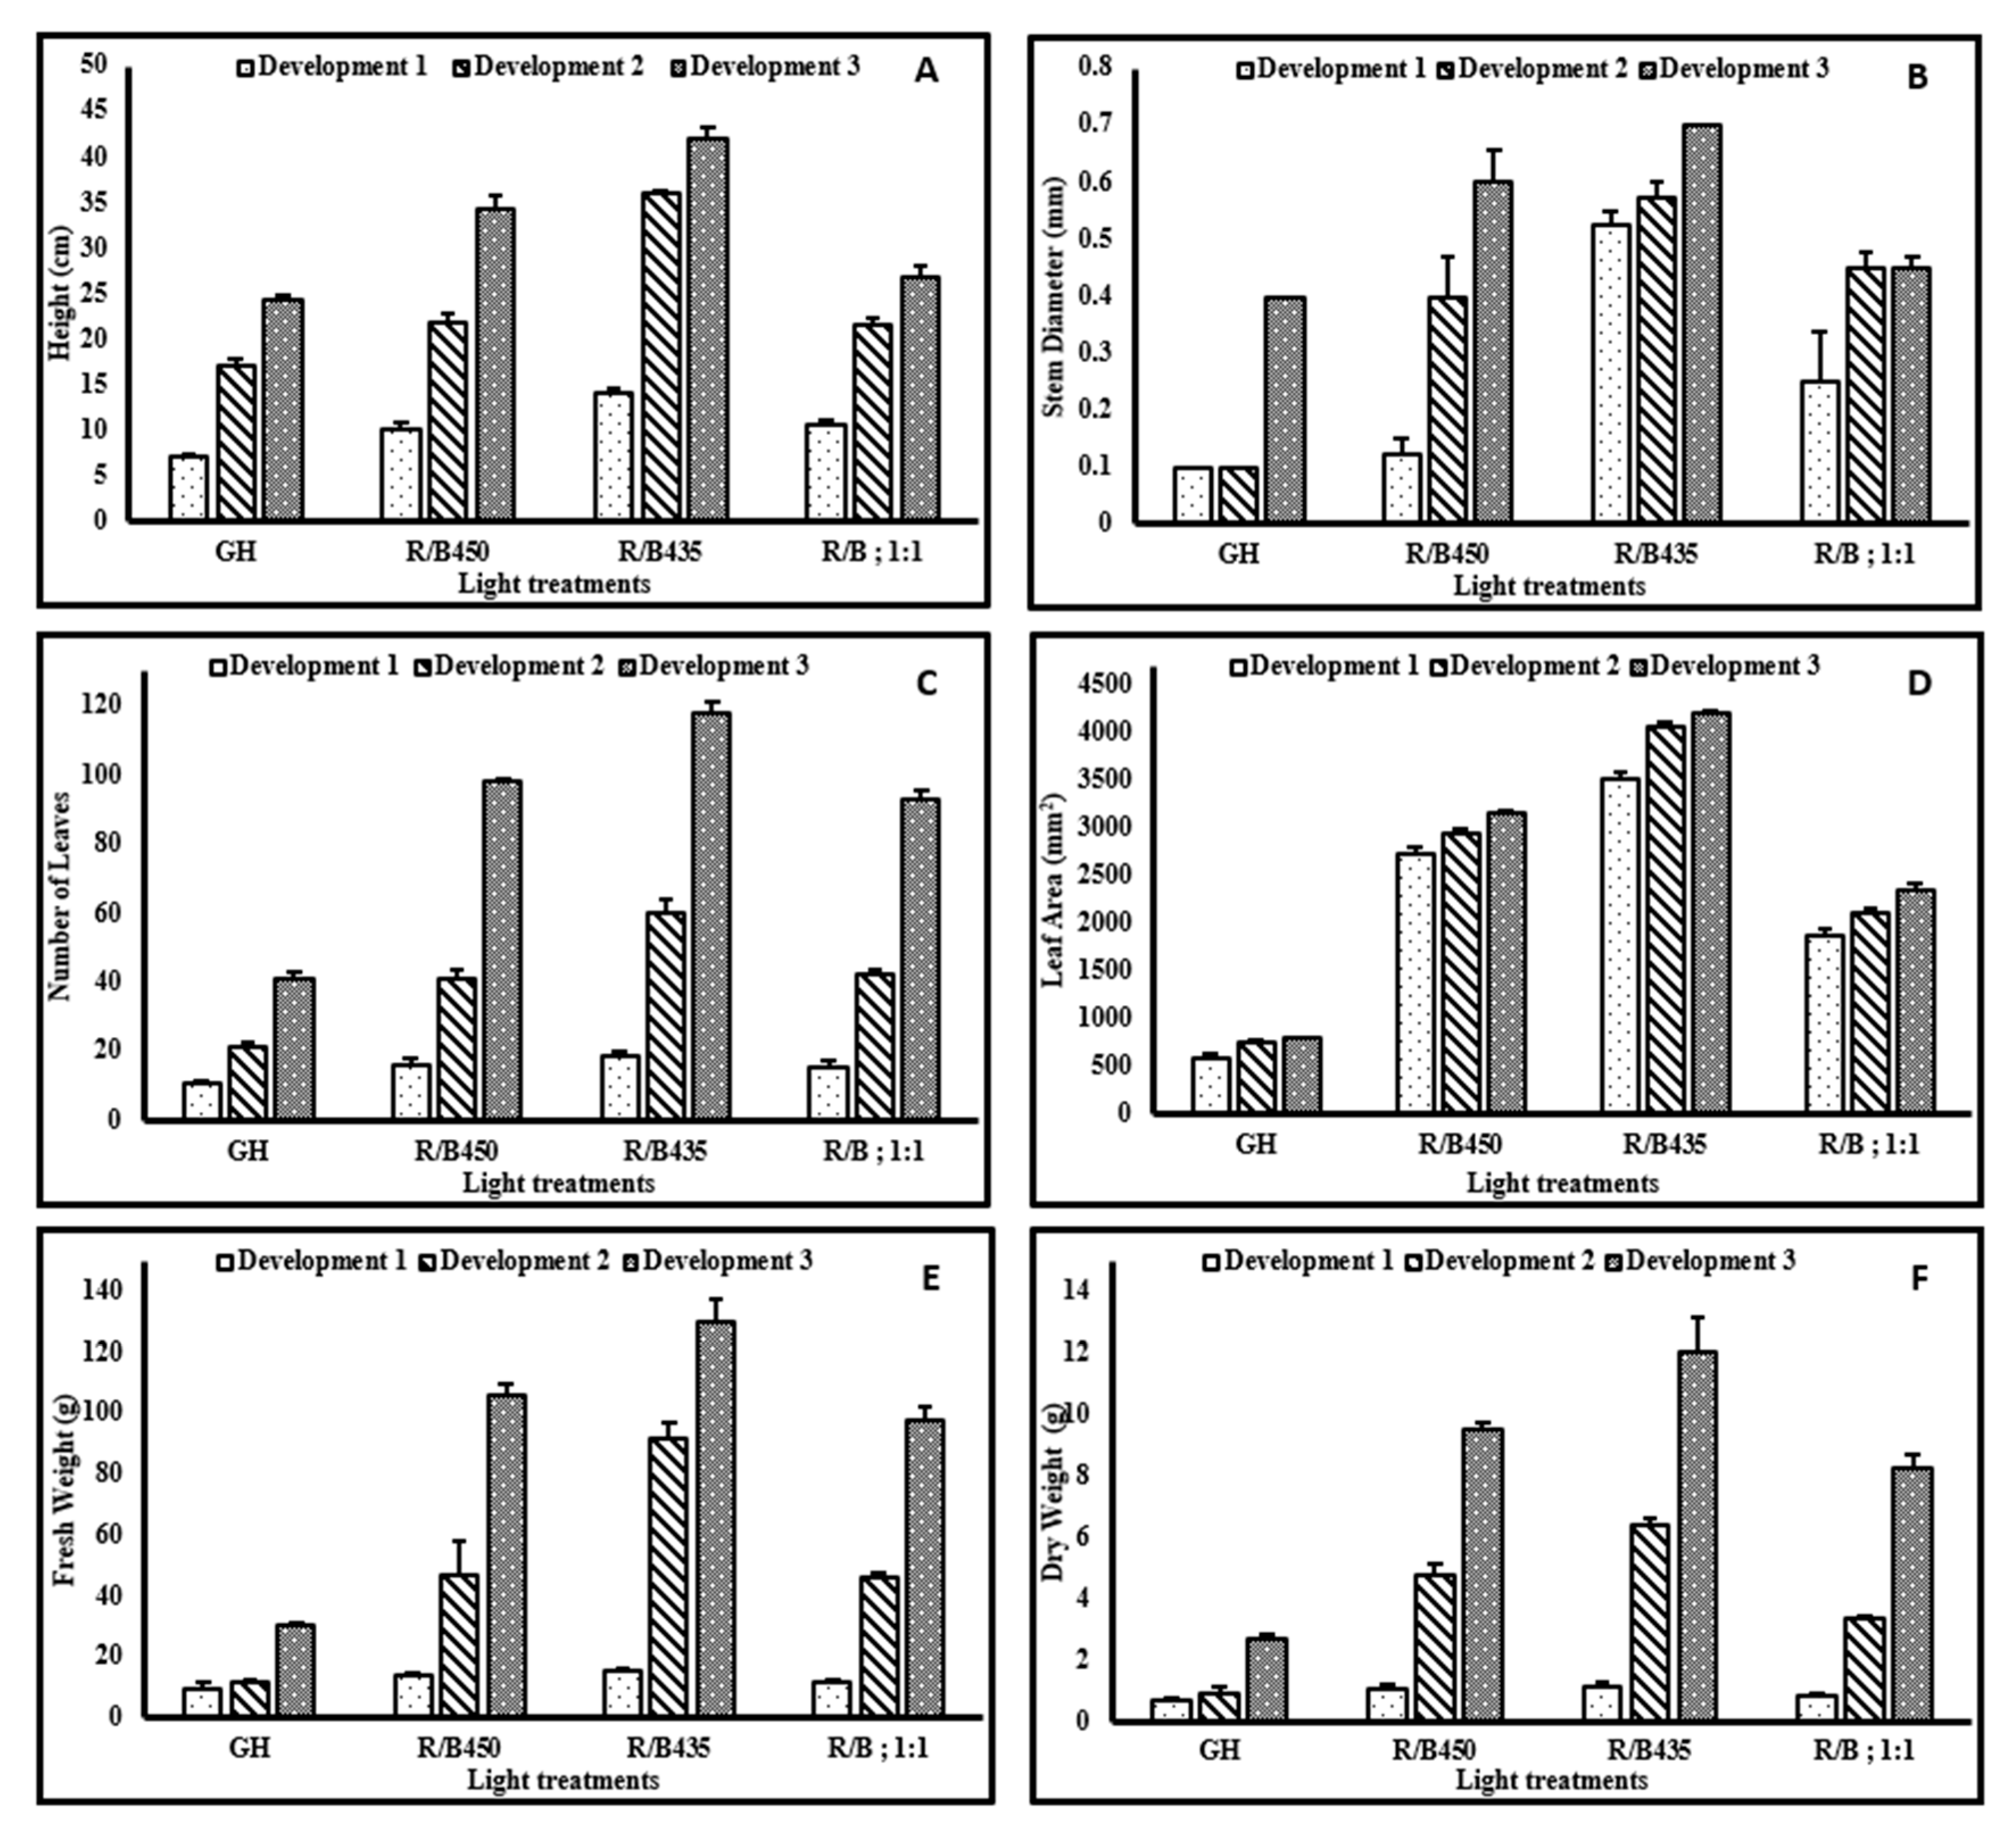
3.3. Growth Responses

There was a significant effect of the lighting treatments (p ≤ 0.001) on the height (Figure 5A), stem diameter (Figure 5B) and number of leaves (Figure 5C), with the R/B435 lighting treatment giving the biggest and more robust plants. Plant size also increased with the vegetative stage (p ≤ 0.001). Plants grown under the LED light treatments were overall bigger than those grown in the glasshouse, and amongst the LED lighting treatments, R/B435 gave the biggest plants at all developmental stages. There was a significant effect of the lighting treatments on the Leaf area (LA; p ≤ 0.001) (Figure 5D), with lighting treatment R/B 435 showing an almost seven-fold increase in LA compared with the plants grown in the glasshouse. Amongst the LED lighting treatments, R/B435 had the greatest LA. The pattern of results of the biomass yield, both Fresh weight (FW; Figure 5) and Dry weight (DW; Figure 5E,F respectively) were similar to all other parameters measured with the LED lighting treatment plants exceeding those grown in the glasshouse. The R/B435 lighting treatment was the highest amongst the LED treatments for both FW and DW (p ≤ 0.001).

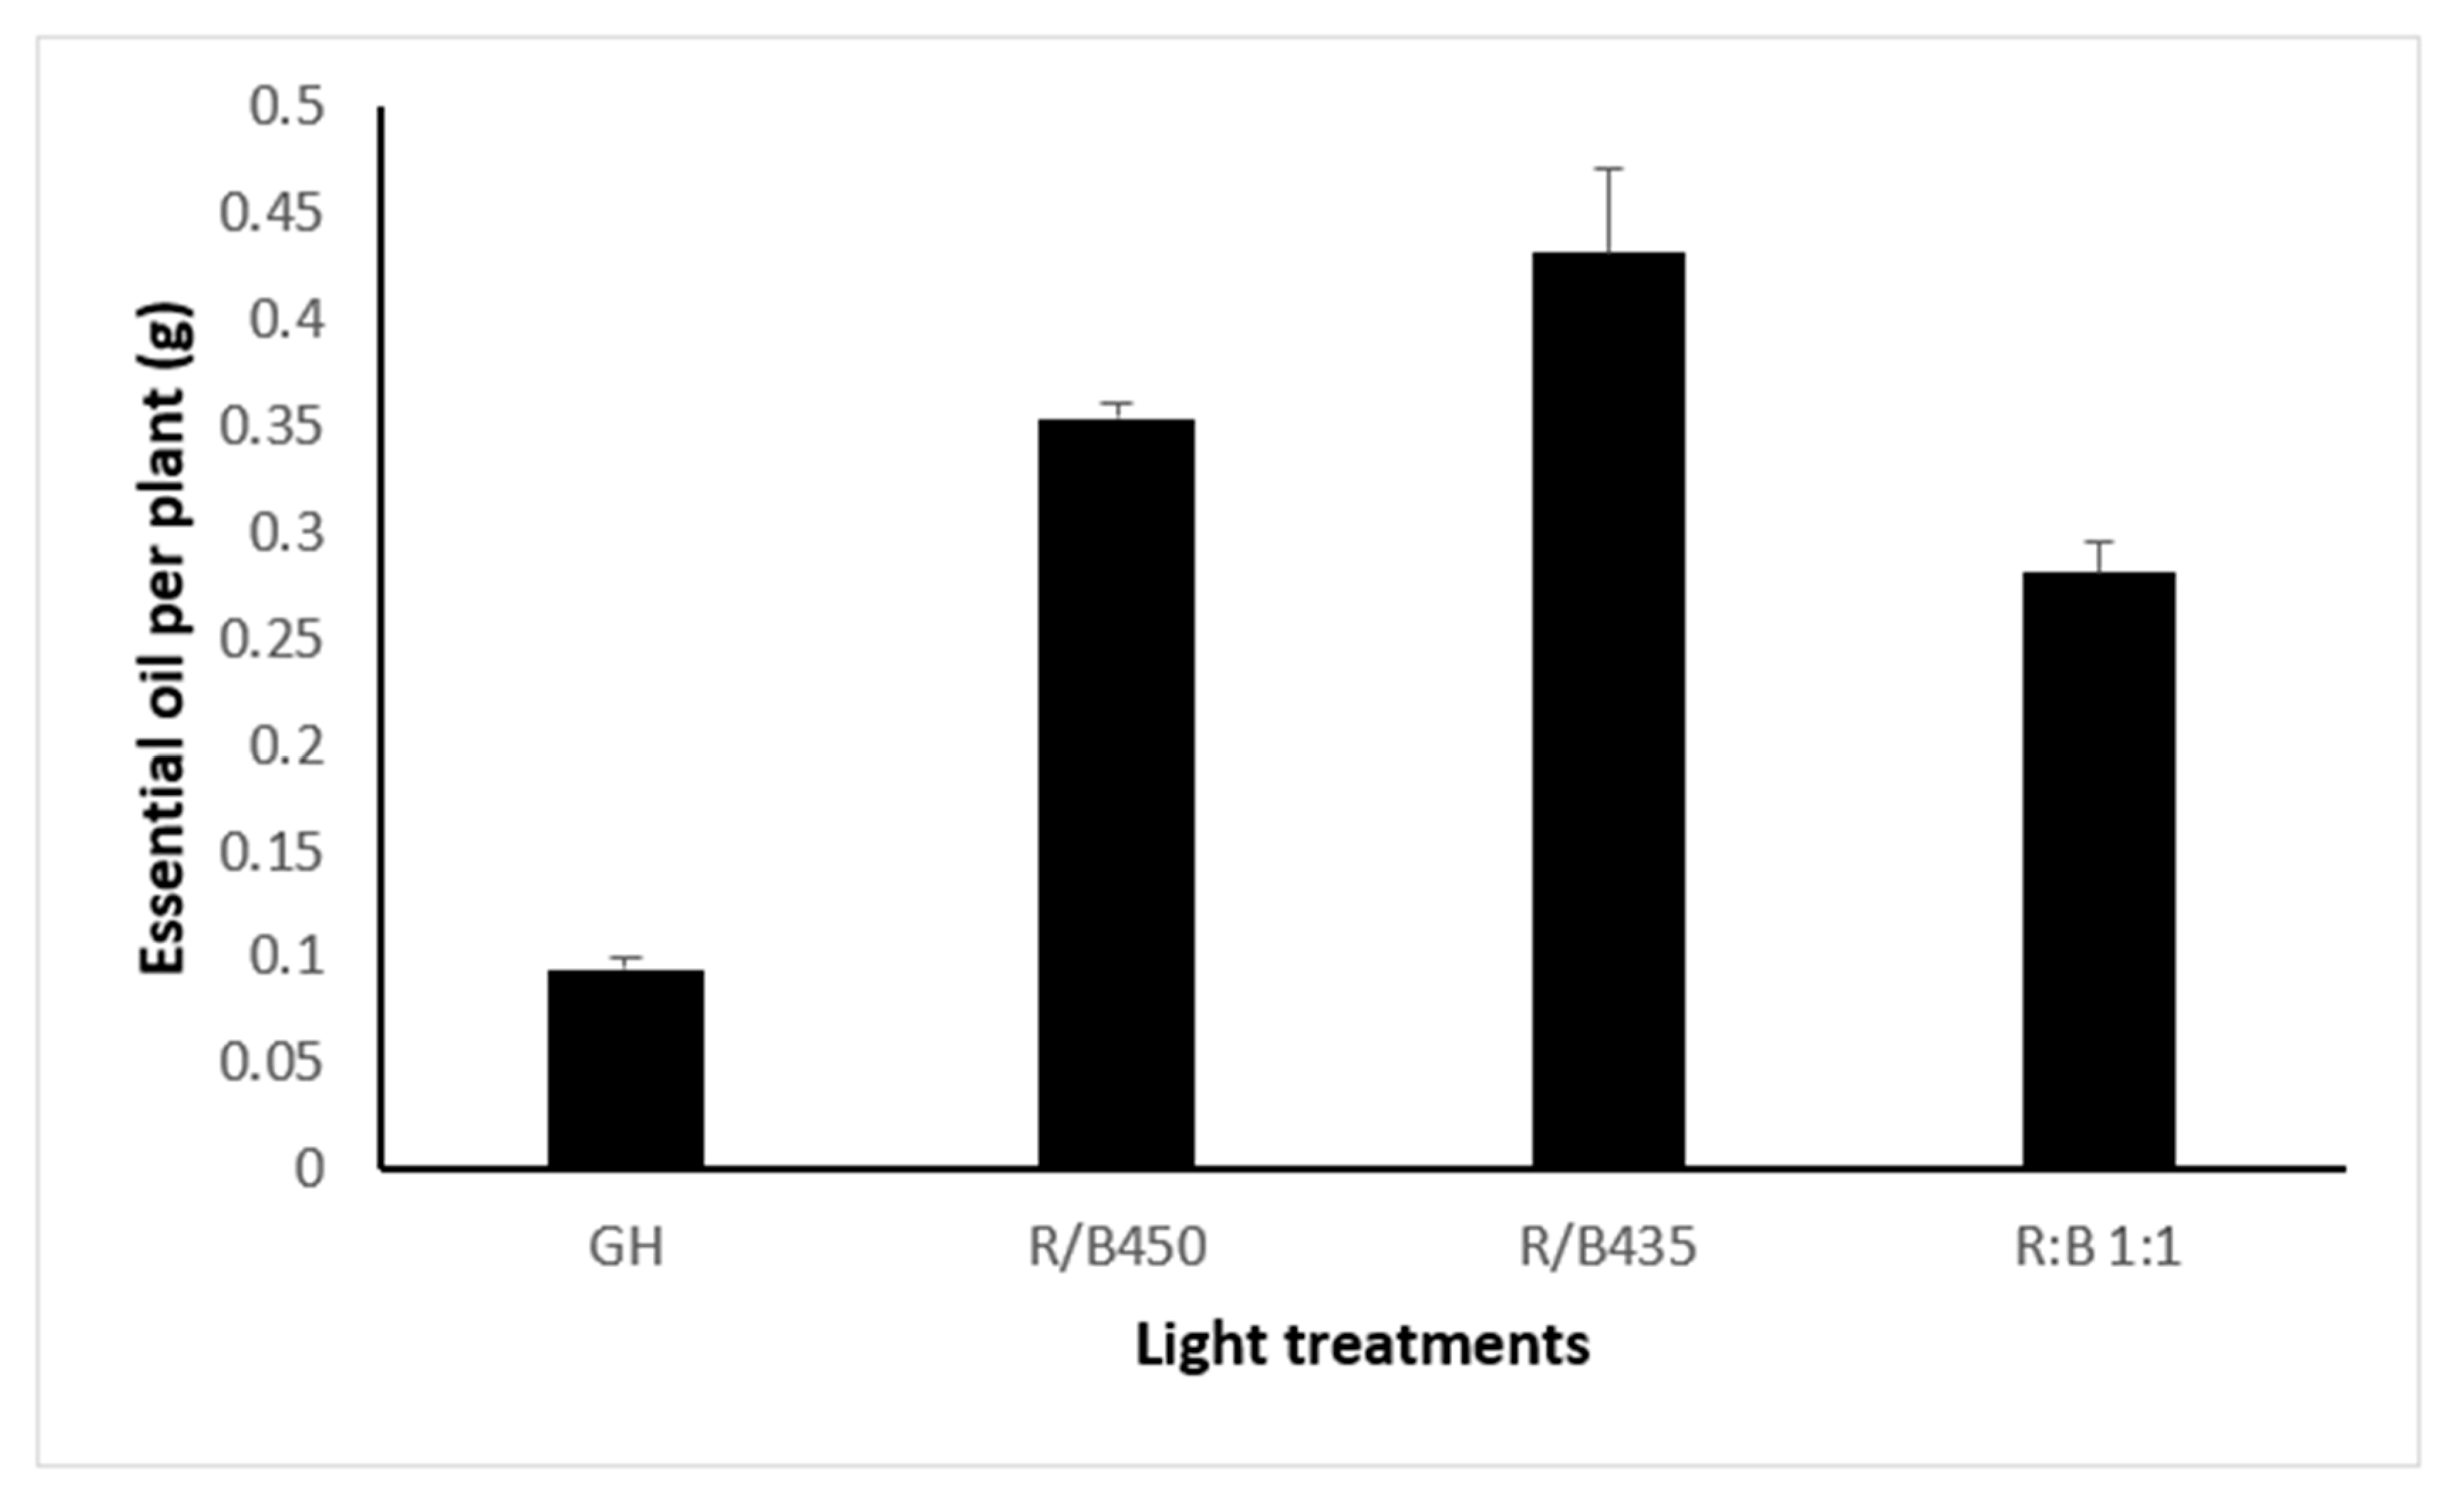
3.4. Essential Oil Yield

There were no significant impacts of lighting treatments of the proportion of essential oil (3.5–3.6%) (p = 0.625). However, due to the significant differences in dry matter yield, there was a consequent significant increase in overall oil yield, with lighting treatment R/B435 giving the highest yield (p ≤ 0.001) (Figure 6).

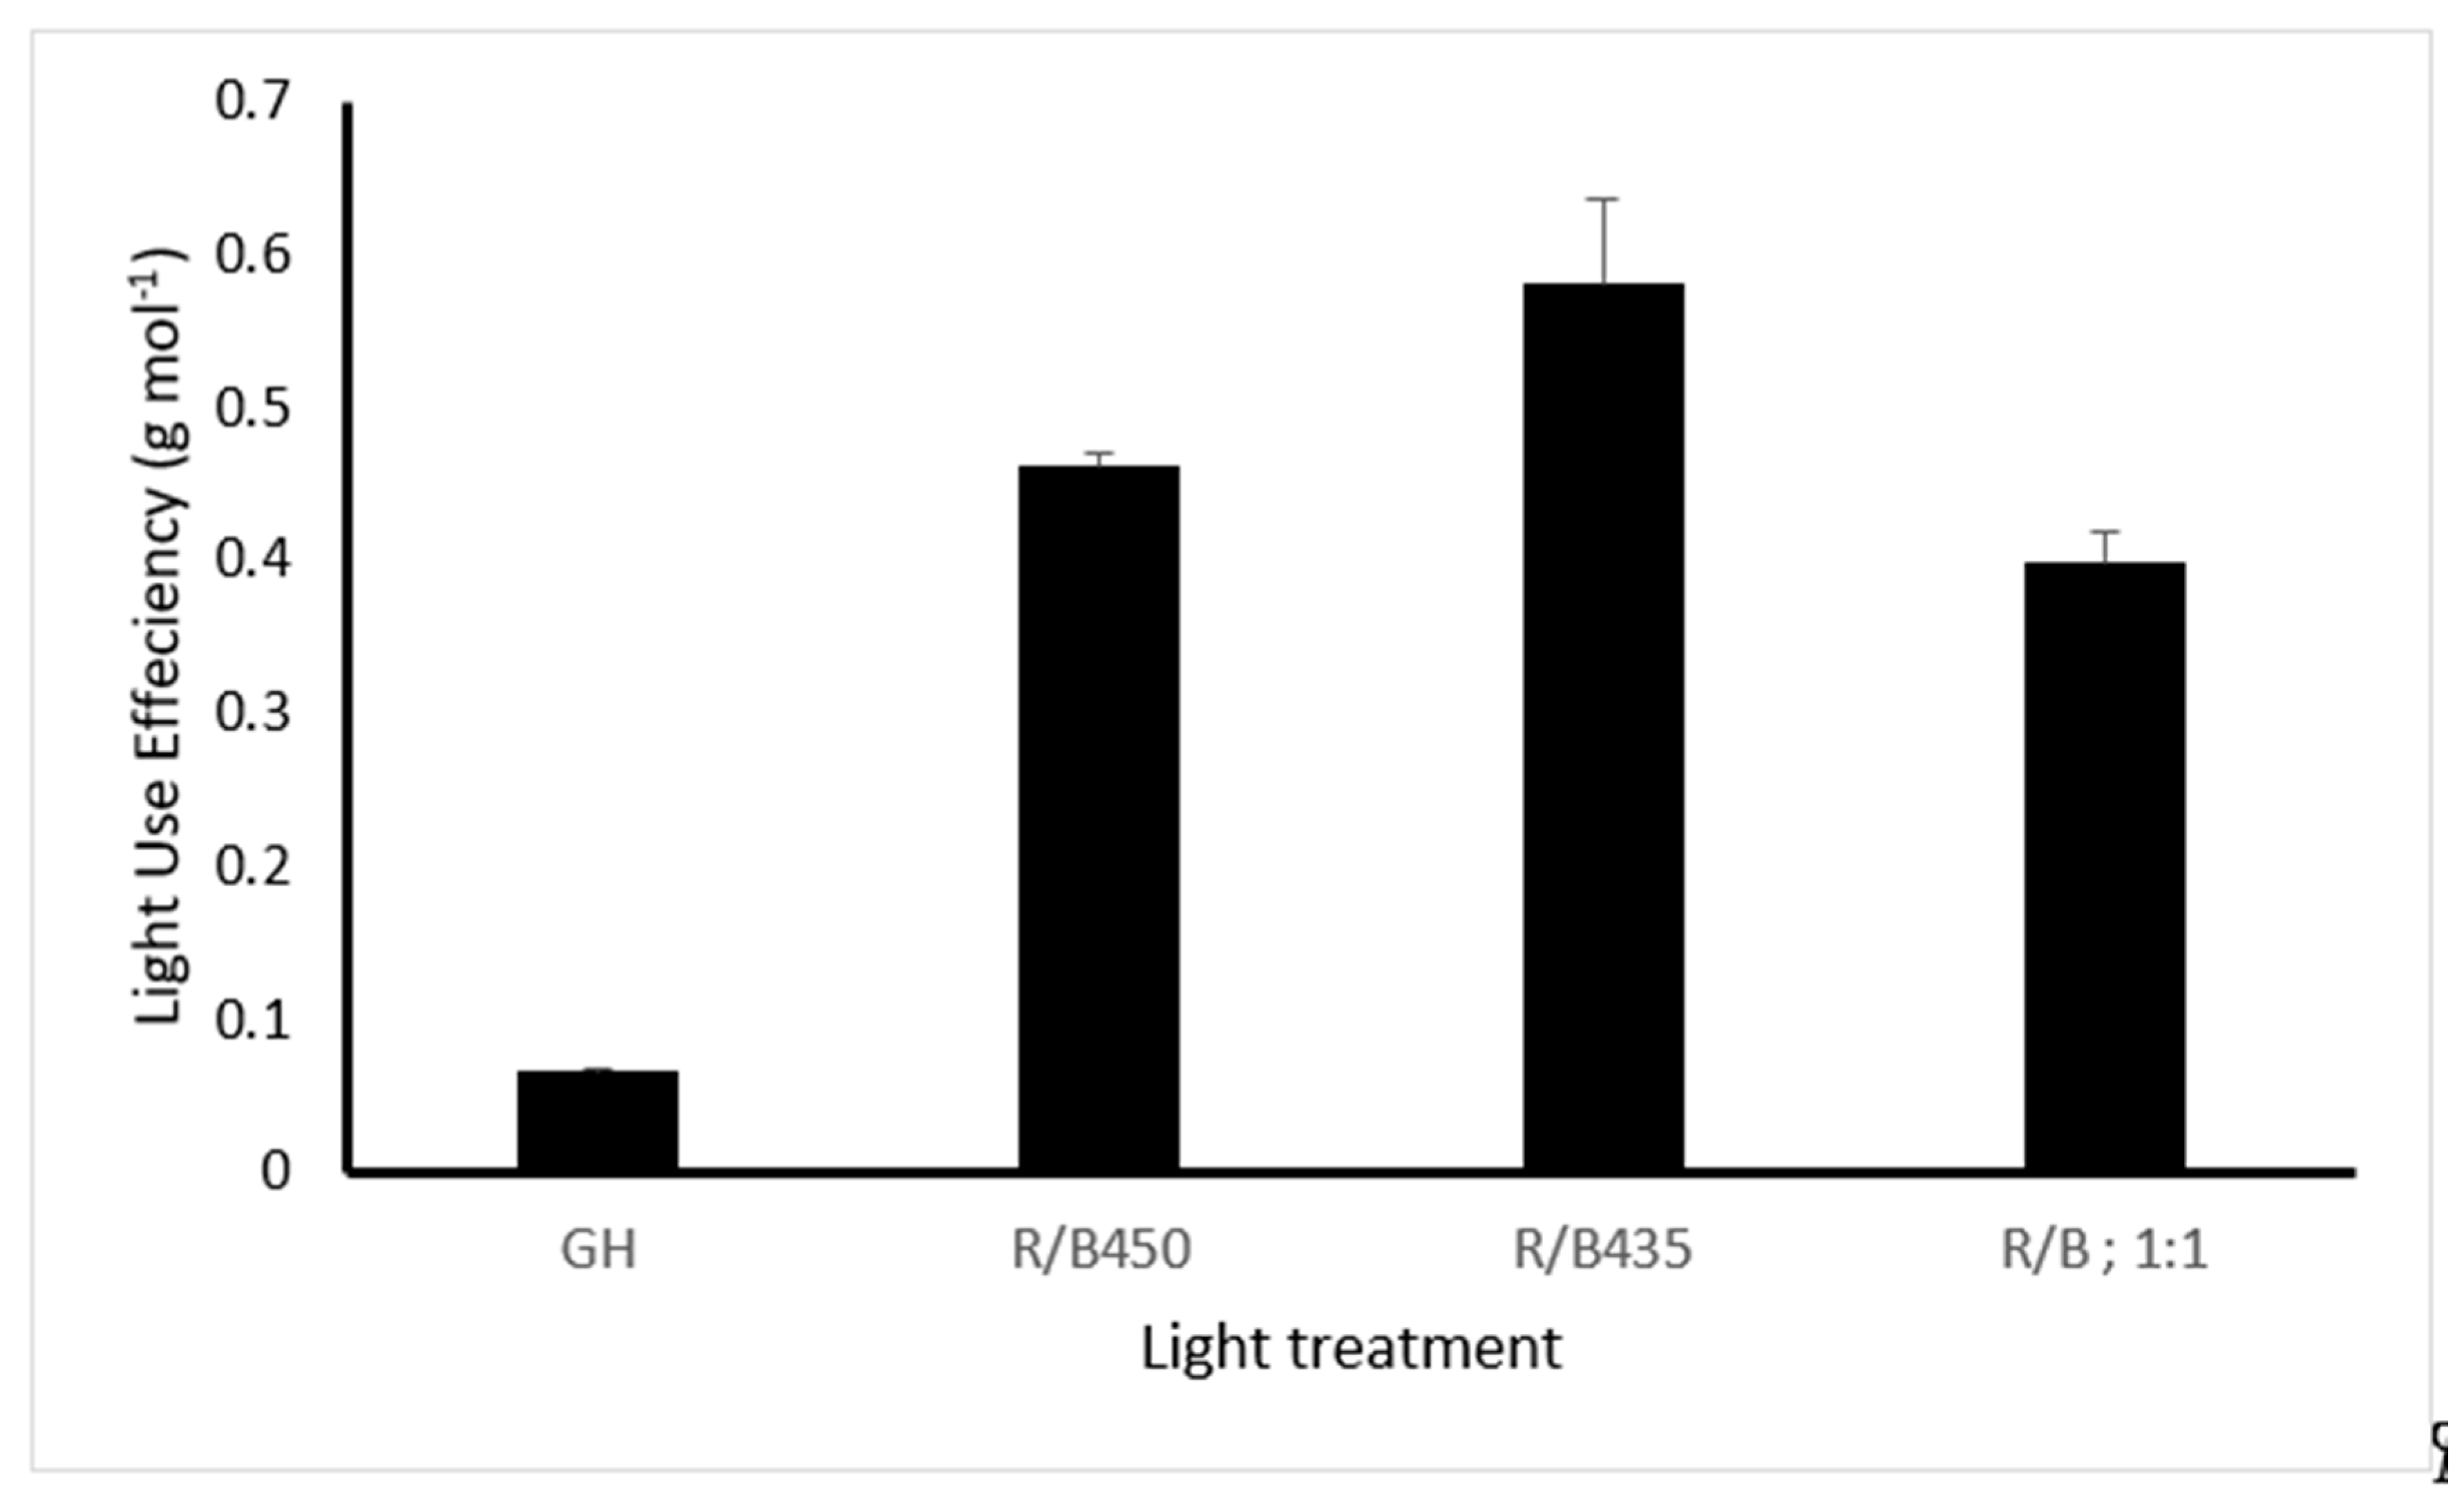
3.5. Light Use Efficiency (LUE)

The LUE was significantly higher when the LED lighting system was used in comparison with plants grown in the greenhouse. Moreover, the use of a 1:1.5 R/blue ratio significantly improved the LUE in comparison with the 1:1 red/blue ratio. The use of 435 nm light as a source of blue was found to produce the best LUE (p ≤ 0.001) (Figure 7).

4. Discussion

Plants grown in the plant factory system performed significantly better in comparison with those grown in the greenhouse in terms of both physiological and yield parameters. This was despite the fact that the daily light integral (DLI) (total PAR receipt) was significantly higher in the greenhouse. In agreement with our findings, Kozai [46] indicated that LEDs in plant factory systems increase Amax and LA by up to threefold, thus increasing yield and possibly enhancing quality. This highlights the importance of providing lights that match plant needs at an intensity which the photosynthetic apparatus can utilize efficiently. Therefore, it is probable that basil grown under red/blue LEDs absorbed a higher percentage of light (energy) because the light provided was focused in the region of high absorbance rate. Inada [47] reported that particular portions of the PAR spectrum are greatly important because the quantum yield curve presents two peaks in the red and blue wavelength ranges, demonstrating that these regions are the essential energy sources for photosynthetic assimilation [23]. Furthermore, Mitchell and Stutte [48] reemphasised that red and blue light have the best quantum efficiencies for driving photosynthesis.
In the current research, three lighting systems were compared with the same overall PAR delivery but with relatively small or subtle differences in the wavelengths supplied, but none-the-less, there were clearly significant differences between all three treatments. Two things were consistently revealed by the results: firstly, that a ratio of more blue over red increased growth and yield more and, secondly, that using blue light with a wavelength peak of 435 nm promoted growth up to 20% better than that of blue light at 450 nm. On the face of it, this is not surprising given that the measured plant absorption spectrum presented here for 14 plant species showed that the blue absorption peak is at 435 nm and not at 450 nm as predicted by the McCree curve [29]. This is a significant finding which could have implications for the future manufacture of red/blue grow-lights for horticulture. Currently, most current commercial LED grow-lights that are available use blue at 450 nm, and the industry appears to have broadly adopted this as the industry standard. A 20% yield increase for a shift of just 15 nm in the blue LED is remarkable. Currently, this finding is being cross-checked for other species, and early (unpublished) results indicate that it holds true. This also highlights the importance of chlorophyll A in the process of photosynthesis and its subsequent impact on the growth and yield of basil. Ustin et al. [49] reported that the absorption maxima of chlorophyll a when extracted in diethyl ether are at 430 and 662 nm and that chlorophyll b has peaks located at 453 and 642 nm. Most of the commercially available LED lighting systems produce a blue spectrum in the 450 nm region and ignore the high level of absorbance of chlorophyll a in the absorbance region of 435 nm. Blue light (400–500 nm) is absorbed by accessory pigments including carotenoids, and the absorbed energy is transferred via excited electrons to chlorophylls a and b and finally to the chlorophyll b photosynthetic reaction center with some energy loss [50]. Providing an LED light spectrum that matches the absorbance of chlorophyll a clearly facilitates the process of photosynthesis and minimizes energy loss.
Another significant finding was that the use of a ratio of 1.5 blue to 1.0 red in the balance of LEDs in an array increased growth and yield in comparison to a 1:1 ratio B/R. This is also unexpected since most commercial horticultural grow-lights have a much higher red component than blue. Moreover, the current findings support our approach of firstly studying plant pigment absorbance in order to provide the LED recipe requirement. The approach to LED array design that was used in the current experiments was to go back to the plant light absorption spectrum and to build an array that mirrored absorption, i.e., higher blue than red and a blue peak at 435 nm, and this approach has definitely been shown to be advantageous in plant performance under our Plant Factory conditions. This provides a significant body of evidence to the concept of “designer grow-lights” that need to be optimized on a species-by-species basis. Moreover, this highlights the importance for studying the light requirement for individual plant species as the optimum ratio between blue and red can vary quite substantially. Therefore, it is clear that the light requirement should be considered on a species-by-species basis. The determination of spectral balances is very important since there is no single red–blue ratio of light ideal for all species and since it also appears to vary for every stage of plant growth [48,51]. The use of our approach in determining the light requirement of plant species has several advantages in comparison with the widely used default McCree methods. This was evidenced by the significant improvement of both physiological and yield parameters of basil. Although McCree provided a wonderful piece of work in his most referenced article on plant lighting “The action spectrum, absorptance and quantum yield of photosynthesis in crop plants”, some drawbacks affect the use of this work to determine the spectral balance needs of plant species. For example, the light absorbance was measured by McCree at increments of 25 nm (5 nm was used in the current study) and the photosynthesis rate was determined at an incident light intensity of about 30 to 60 umol m−2 s−1 for different wavelengths, which is very low compared with most plant requirements and is around the compensation point for most plants.
The current finding concerning the significant impact of blue light on the growth and development of basil is in disagreement with Pennisi et al. [52], who reported a yield reduction associated with a higher fraction of blue light. Furthermore, other studies have reported that the presence of blue light did not alter basil plant height or fresh weight [33,53]. However, other works [54,55] reported that the tallest basil plants were obtained in the treatment where only blue light was applied in comparison with white or mixed (white + blue) light. From these mixed reports, it does seem that the growing environment such as light intensity, temperature and plant intensity has a clear impact on the response of basil to light treatment, but Massa et al. [32] indicated that one of the great challenges of the replicability of research results in LED lighting applications could be due to the high variability in the experimental setups. For example, while 300 μmol m−2 s−1 PPFD was applied in the current research, low PPFD values, e.g., 60–120 μmol m−2 s−1 were applied by [33,53]. The high positive impact of using a high level of blue lights on physiological parameters in basil reported here is in agreement with Jensen, Clausen and Kjaer [56], who reported that blue light increased Stomatal density (SD) in basil. It is well established that blue light activation of cryptochrome CRY promotes stomatal development and that this occurs through the regulation of transcriptional factors [57]. Darko et al. [58] indicated that red light in the region of 650–665 nm from LED lighting units matches the assimilation peak of the photoreceptors phytochrome and chlorophyll and that the combination of red–blue light for growing plants can enhance the maximum photosynthetic rate, Amax, as a consequence of the activation of cryptochromes, phytochromes and chlorophyll more than if a monochromatic light was used as a grow light. This increase in Amax was explained as a result of the increase in carbon dioxide levels when the blue light stimulated better stomatal gapping [59,60,61]. This also agrees with our findings concerning the higher Gs under blue dominant LED. This increase in Amax and Gs leads to a consequent improvement in DW with the addition of blue light. It has also been reported that the blue region of the light has more effect on the stomatal opening than the red region of light [62,63]. This also supports the current results concerning the significant impact of blue dominant treatment on stomatal conductance in basil. In an earlier publication (Aldarkazali et al. [41]), we reported the significant impact of a high blue to red ratio on the stomatal conductance, leaf area, photosynthesis efficiency and yield parameters of basil, and this has been upheld in the current paper.
One of the most significant findings of the current research is the high positive advantage of using 435 nm LEDs as the source of blue light. This has led to a significant improvement in the physiological and yield response of basil. The fact that 435 nm is only a 15 nm shift from the commonly commercially used 450 nm LED highlights the importance of using our approach of measuring plant light absorbance in order to design the light spectrum. In agreement with our finding, Lamb, Røkke and Hohmann-Marriott [64] reported the role of 435 nm stimulating Photosystem I (PS I) in the photosynthesis process in cyanobacteria and Arabidopsis thaliana. This could explain the significant increased chlorophyll fluorescence rate (Fv/Fm) and light-saturated maximum photosynthetic rate (Amax) observed in the current study. In bean plants, [65] showed that the action spectrum analysis curve showed a blue light peak at 437 nm. A fluorescence spectra analysis also showed that chamomile pollen has a peak at a blue light region of 435 nm [66]. However, to our knowledge, there have been no prior studies that tested the impact of 435 nm wavelength as the sole source of blue in comparison with the widely commercially used 450 nm wavelengths lights.
In our study, the developmental stage did not seem to interact with the light spectrum requirement and the high blue rate (especially at 435 nm) was essential for the investigated physiological and yield parameters throughout the growing period of basil. This could be due to the fact that the research focused on the light requirement of basil through the vegetative stage since vegetative parts and essential oil are the main desirable yield of basil. However, further research is required to investigate whether these requirements would change through the flowering and seeding stages.
Blue light has been reported to enhance the biosynthesis of the chemical composition of several plant species [67,68]. Amaki et al. [69] reported that blue light has a great impact on the level of essential oil in sweet basil. They indicated that the essential oil content of basil plants grown under blue light was between 1- and 4-fold higher than those grown without blue light. However, in our study, there was no significant impact of the lighting treatments on the percentage of essential oils of sweet basil. This could be due to the fact that all the applied treatments had a sufficient amount of blue required for the synthesis of essential oils in basil. The inconsistency of our finding with the literature could be to the difference in experimental setup [32]. Nevertheless, the total sweet basil essential oil was significantly increased under 435 nm blue light treatment because of the significant impact of this treatment on the dry weight of basil. Ongoing work is investigating the oil profile of plants grown under these lighting regimes.

5. Conclusions

In comparison to glasshouse-grown treatments, sweet basil can be cultivated more efficiently in a multi-tier hydroponic system under LEDs with a combination of blue light with a peak wavelength of 435 nm and red light with a peak wavelength of 663 nm. The combination of blue–red light is better when provided in a ratio of 1.5:1 to enhance yield. The use of 435 nm as a source of blue light LED significantly increased the yield in comparison with 450 nm blue light LEDs, which are commonly used in commercial horticultural LED arrays. To the best of our knowledge, this is the first report to confirm the significant advantages of using 435 nm blue LED light and to confirm the significant increase in yield as an output of this modification in the blue wavelength used. It is recommended that each plant species should be characterized for its light absorption spectrum prior to designing or programming specific LED arrays to maximize yield.

Author Contributions

H.Z.R.: Conceptualization, Methodology, Supervision, Writing—review & editing. M.A.: Investigation, Writing—original draft. S.J.M.: Investigation. N.B.M.: Investigation. M.H.J.: Investigation. M.P.F.: Conceptualization, Methodology, Supervision, Validation, Writing—review & editing, Project administration. All authors have read and agreed to the published version of the manuscript.

Funding

This research was partially funded by the European Regional Development Fund for Cornwall, UK under an AgriTech research grant, the Seale-Hayne Educational Trust (grant RR204307), and by the author (Mohammed Aldarkazali) as part of a self-funded research master’s course at the University of Plymouth, UK.

Acknowledgments

Technical and scientific assistance are gratefully acknowledged from Lynn McCallum (Plymouth University).

Conflicts of Interest

The authors declare no conflict of interest. The funders had no role in the design of the study; in the collection, analyses, or interpretation of data; in the writing of the manuscript; or in the decision to publish the results.

References

  1. Makri, O.; Kintzios, S. Ocimum sp. (Basil): Botany, Cultivation, Pharmaceutical Properties, and Biotechnology. J. Herbs Spices Med. Plants 2008, 13, 123–150. [Google Scholar] [CrossRef]
  2. Dube, S.; Upadhyay, P.; Tripathi, S. Antifungal, physicochemical, and insect-repelling activity of the essential oil of Ocimum basilicum. Can. J. Bot. 1989, 67, 2085–2087. [Google Scholar] [CrossRef]
  3. Hossain, M.A.; Kabir, M.; Salehuddin, S.; Rahman, S.M.; Das, A.; Singha, S.K.; Alam, M.K.; Rahman, A. Antibacterial properties of essential oils and methanol extracts of sweet basil Ocimum basilicum occurring in Bangladesh. Pharm. Biol. 2010, 48, 504–511. [Google Scholar] [CrossRef] [PubMed]
  4. Simon, J.E.; Quinn, J.; Murray, R.G. Basil: A source of essential oils. Adv. New Crop. imber Press Portland OR (1990). 1990, 484–489. [Google Scholar]
  5. Kathirvel, P.; Ravi, S. Chemical composition of the essential oil from basil (Ocimum basilicum Linn.) and its in vitro cytotoxicity against HeLa and HEp-2 human cancer cell lines and NIH 3T3 mouse embryonic fibroblasts. Nat. Prod. Res. 2012, 26, 1112–1118. [Google Scholar] [CrossRef]
  6. Dasgupta, T.; Rao, A.; Yadava, P. Chemomodulatory efficacy of basil leaf (Ocimum basilicum) on drug metabolizing and antioxidant enzymes, and on carcinogen-induced skin and forestomach papillomagenesis. Phytomedicine 2004, 11, 139–151. [Google Scholar] [CrossRef] [PubMed]
  7. Holm, Y. Bioactivity of Basil. In Basil; CRC Press: Boca Raton, FL, USA, 1999; pp. 117–139. [Google Scholar]
  8. Lee, S.-J.; Umano, K.; Shibamoto, T.; Lee, K.-G. Identification of volatile components in basil (Ocimum basilicum L.) and thyme leaves (Thymus vulgaris L.) and their antioxidant properties. Food Chem. 2005, 91, 131–137. [Google Scholar] [CrossRef]
  9. Murugan, K.; Murugan, P.; Noortheen, A. Larvicidal and repellent potential of Albizzia amara Boivin and Ocimum basilicum Linn against dengue vector, Aedes aegypti (Insecta: Diptera: Culicidae). Bioresour. Technol. 2007, 98, 198–201. [Google Scholar] [CrossRef] [PubMed]
  10. Sajjadi, S.E. Analysis of the essential oils of two cultivated basil (Ocimum basilicum L.) from Iran. DARU J. Pharm. Sci. 2006, 14, 128–130. [Google Scholar]
  11. Avetisyan, A.; Markosian, A.; Petrosyan, M.; Sahakyan, N.; Babayan, A.; Aloyan, S.; Trchounian, A. Chemical composition and some biological activities of the essential oils from basil Ocimum different cultivars. BMC Complement. Altern. Med. 2017, 17, 60. [Google Scholar] [CrossRef] [Green Version]
  12. Smith, R.; Adams, T.; Doull, J.; Feron, V.; Goodman, J.; Marnett, L.; Portoghese, P.; Waddell, W.; Wagner, B.; Rogers, A. Safety assessment of allylalkoxybenzene derivatives used as flavouring substances—Methyl eugenol and estragole. Food Chem. Toxicol. 2002, 40, 851–870. [Google Scholar] [CrossRef]
  13. Wallace, L.A.; Nelson, W.C.; Raymer, J.H.; Thomas, K.W. Identification of Polar Volatile Organic Compounds in Consumer Products and Common Microenvironments; US Environmental Protection Agency, Office of Research and Development: Washington, WA, USA, 1991.
  14. Sims, D.A.; Gamon, J.A. Relationships between leaf pigment content and spectral reflectance across a wide range of species, leaf structures and developmental stages. Remote Sens. Environ. 2002, 81, 337–354. [Google Scholar] [CrossRef]
  15. Nair, G.B.; Dhoble, S.J. A perspective perception on the applications of light-emitting diodes. Luminescence. 2015, 30, 1167–1175. [Google Scholar] [CrossRef]
  16. Green, M.A.; Zhao, J.; Wang, A.; Reece, P.J.; Gal, M. Efficient silicon light-emitting diodes. Nature 2001, 412, 805. [Google Scholar] [CrossRef]
  17. Van Ieperen, W.; Trouwborst, G. The application of LEDs as assimilation light source in greenhouse horticulture: A simulation study. In Proceedings of the International Symposium on High Technology for Greenhouse System Management, Naples, Italy, 4–6 October 2007; pp. 1407–1414. [Google Scholar]
  18. Tonzani, S. Lighting technology: Time to change the bulb. Nat. News 2009, 459, 312–314. [Google Scholar] [CrossRef] [Green Version]
  19. Singh, D.; Basu, C.; Meinhardt-Wollweber, M.; Roth, B. LEDs for energy efficient greenhouse lighting. Renew. Sustain. Energy Rev. 2015, 49, 139–147. [Google Scholar] [CrossRef] [Green Version]
  20. Bosma, R.H.; Lacambra, L.; Landstra, Y.; Perini, C.; Poulie, J.; Schwaner, M.J.; Yin, Y. The financial feasibility of producing fish and vegetables through aquaponics. Aquac. Eng. 2017, 78, 146–154. [Google Scholar] [CrossRef]
  21. Dickinson, J. Inventory of New York City Greenhouse Gas Emissions; DIANE Publishing: Collindale, PA, USA, 2007. [Google Scholar]
  22. Brown, C.S.; Schuerger, A.C.; Sager, J.C. Growth and photomorphogenesis of pepper plants under red light-emitting diodes with supplemental blue or far-red lighting. J. Am. Soc. Hortic. Sci. 1995, 120, 808–813. [Google Scholar] [CrossRef] [PubMed] [Green Version]
  23. Lin, K.-H.; Huang, M.-Y.; Huang, W.-D.; Hsu, M.-H.; Yang, Z.-W.; Yang, C.-M. The effects of red, blue, and white light-emitting diodes on the growth, development, and edible quality of hydroponically grown lettuce (Lactuca sativa L. var. capitata). Sci. Hortic. 2013, 150, 86–91. [Google Scholar] [CrossRef]
  24. Goins, G.D.; Yorio, N.; Sanwo, M.; Brown, C. Photomorphogenesis, photosynthesis, and seed yield of wheat plants grown under red light-emitting diodes (LEDs) with and without supplemental blue lighting. J. Exp. Bot. 1997, 48, 1407–1413. [Google Scholar] [CrossRef] [Green Version]
  25. Kim, H.-H.; Goins, G.D.; Wheeler, R.M.; Sager, J.C. Green-light supplementation for enhanced lettuce growth under red-and blue-light-emitting diodes. HortScience 2004, 39, 1617–1622. [Google Scholar] [CrossRef] [Green Version]
  26. Ohashi-Kaneko, K.; Takase, M.; Kon, N.; Fujiwara, K.; Kurata, K. Effect of light quality on growth and vegetable quality in leaf lettuce, spinach and komatsuna. Environ. Control Biol. 2007, 45, 189–198. [Google Scholar] [CrossRef] [Green Version]
  27. Kook, K.K.H.-S.; Kim, H.-S.K.K. The Effect of Blue-light-emitting Diodes on Antioxidant Properties and Resistance to Botrytis cinerea in Tomato. J. Plant Pathol. Microbiol. 2013, 4. [Google Scholar] [CrossRef] [Green Version]
  28. Wu, M.-C.; Hou, C.-Y.; Jiang, C.-M.; Wang, Y.-T.; Wang, C.-Y.; Chen, H.-H.; Chang, H.-M. A novel approach of LED light radiation improves the antioxidant activity of pea seedlings. Food Chem. 2007, 101, 1753–1758. [Google Scholar] [CrossRef]
  29. McCree, K.J. Test of current definitions of photosynthetically active radiation against leaf photosynthesis data. Agric. Meteorol. 1972, 10, 443–453. [Google Scholar] [CrossRef]
  30. Gallo, K.; Daughtry, C. Techniques for Measuring Intercepted and Absorbed Photosynthetically Active Radiation in Corn Canopies 1. Agron. J. 1986, 78, 752–756. [Google Scholar] [CrossRef]
  31. Britton, C.; Dodd, J. Relationships of photosynthetically active radiation and shortwave irradiance. Agric. Meteorol. 1976, 17, 1–7. [Google Scholar] [CrossRef]
  32. Massa, G.D.; Kim, H.-H.; Wheeler, R.M.; Mitchell, C.A. Plant productivity in response to LED lighting. HortScience 2008, 43, 1951–1956. [Google Scholar] [CrossRef]
  33. Carvalho, S.D.; Schwieterman, M.L.; Abrahan, C.E.; Colquhoun, T.A.; Folta, K.M. Light quality dependent changes in morphology, antioxidant capacity, and volatile production in sweet basil (Ocimum basilicum). Front. Plant Sci. 2016, 7, 1328. [Google Scholar] [CrossRef] [Green Version]
  34. Goto, E. Plant production in a closed plant factory with artificial lighting. In Proceedings of the VII International Symposium on Light in Horticultural Systems 956, Wageningen, The Netherlands, 14 October 2012; pp. 37–49. [Google Scholar]
  35. Eye Hortilux. The McCree Curve | EYE Hortilux. Available online: https://eyehortilux.com/grower-education/how-light-affects-plants/the-mccree-curve/ (accessed on 4 October 2019).
  36. Ögren, E.; Evans, J. Photosynthetic light-response curves. Planta 1993, 189, 182–190. [Google Scholar] [CrossRef]
  37. Gross, L.J. Photosynthetic dynamics in varying light environments: A model and its application to whole leaf carbon gain. Ecology 1982, 63, 84–93. [Google Scholar] [CrossRef]
  38. Terashima, I.; Fujita, T.; Inoue, T.; Chow, W.S.; Oguchi, R. Green light drives leaf photosynthesis more efficiently than red light in strong white light: Revisiting the enigmatic question of why leaves are green. Plant Cell Physiol. 2009, 50, 684–697. [Google Scholar] [CrossRef] [PubMed] [Green Version]
  39. Fan, X.-X.; Xu, Z.-G.; Liu, X.-Y.; Tang, C.-M.; Wang, L.-W.; Han, X.-l. Effects of light intensity on the growth and leaf development of young tomato plants grown under a combination of red and blue light. Sci. Hortic. 2013, 153, 50–55. [Google Scholar] [CrossRef]
  40. Lichtenthaler, H.; Buschmann, C.; Döll, M.; Fietz, H.-J.; Bach, T.; Kozel, U.; Meier, D.; Rahmsdorf, U. Photosynthetic activity, chloroplast ultrastructure, and leaf characteristics of high-light and low-light plants and of sun and shade leaves. Photosynth. Res. 1981, 2, 115–141. [Google Scholar] [CrossRef] [PubMed]
  41. Aldarkazali, M.; Rihan, H.Z.; Carne, D.; Fuller, M.P. The Growth and Development of Sweet Basil (Ocimum basilicum) and Bush Basil (Ocimum minimum) Grown under Three Light Regimes in a Controlled Environment. Agronomy 2019, 9, 743. [Google Scholar] [CrossRef] [Green Version]
  42. Saha, S.; Monroe, A.; Day, M.R. Growth, yield, plant quality and nutrition of basil (Ocimum basilicum L.) under soilless agricultural systems. Ann. Agric. Sci. 2016, 61, 181–186. [Google Scholar] [CrossRef]
  43. Burbott, A.J.; Loomis, W.D. Effects of light and temperature on the monoterpenes of peppermint. Plant Physiol. 1967, 42, 20–28. [Google Scholar] [CrossRef] [Green Version]
  44. Zhao, L. Steam Alternating Solvent Process. SPE Reserv. Eval. Eng. 2007, 10, 185–190. [Google Scholar] [CrossRef]
  45. Medlyn, B.E. Physiological basis of the light use efficiency model. Tree Physiol. 1998, 18, 167–176. [Google Scholar] [CrossRef] [PubMed]
  46. Kozai, T. Resource use efficiency of closed plant production system with artificial light: Concept, estimation and application to plant factory. Proc. Jpn. Acad. Ser. B 2013, 89, 447–461. [Google Scholar] [CrossRef] [PubMed] [Green Version]
  47. Inada, K. Action spectra for photosynthesis in higher plants. Plant Cell Physiol. 1976, 17, 355–365. [Google Scholar]
  48. Mitchell, C.; Stutte, G. Sole-source lighting for controlled-environment agriculture. In Lighting up Profits Understanding Greenhouse Lighting, 2nd ed.; Meister Media Worldwide: Willoughby, OH, USA, 2004. [Google Scholar]
  49. Ustin, S.L.; Gitelson, A.A.; Jacquemoud, S.; Schaepman, M.; Asner, G.P.; Gamon, J.A.; Zarco-Tejada, P. Retrieval of foliar information about plant pigment systems from high resolution spectroscopy. Remote Sens. Environ. 2009, 113, S67–S77. [Google Scholar] [CrossRef] [Green Version]
  50. Kozai, T. Smart Plant Factory: The Next Generation Indoor Vertical Farms; Springer: Berlin, Germany, 2018. [Google Scholar]
  51. Kim, H.-H.; Wheeler, R.M.; Sager, J.C.; Yorio, N.C.; Goins, G.D. Light-emitting diodes as an illumination source for plants: A review of research at Kennedy Space Center. Habitation 2005, 10, 71–78. [Google Scholar] [CrossRef] [PubMed]
  52. Pennisi, G.; Blasioli, S.; Cellini, A.; Maia, L.; Crepaldi, A.; Braschi, I.; Spinelli, F.; Nicola, S.; Fernandez, J.A.; Stanghellini, C. Unravelling the role of red: Blue LED lights on resource use efficiency and nutritional properties of indoor grown sweet basil. Front. Plant Sci. 2019, 10, 305. [Google Scholar] [CrossRef] [PubMed] [Green Version]
  53. Schwend, T.; Prucker, D.; Peisl, S.; Nitsopoulos, A.; Mempel, H. The rosmarinic acid content of basil and borage correlates with the ratio of red and far-red light. Eur. J. Hortic. Sci. 2016, 81, 243–247. [Google Scholar] [CrossRef]
  54. Frąszczak, B.; Golcz, A.; Zawirska-Wojtasiak, R.; Janowska, B. Growth rate of sweet basil and lemon balm plants grown under fluorescent lamps and LED modules. Acta Sci. Pol. Hortorum Cultus 2014, 13, 3–13. [Google Scholar]
  55. Glowacka, B. Wpływ składu spektralnego światłana wzrost rozsady bazylii pospolitej (Ocimum basilicum L.), melisy lekarskiej (Melissa officinalis L.) i ogórecznika lekarskiego (Borago officinalis L.). Zesz. Probl. Postępów Nauk Rol. 2008, 527, 131–138. [Google Scholar]
  56. Jensen, N.B.; Clausen, M.R.; Kjaer, K.H. Spectral quality of supplemental LED grow light permanently alters stomatal functioning and chilling tolerance in basil (Ocimum basilicum L.). Sci. Hortic. 2018, 227, 38–47. [Google Scholar] [CrossRef]
  57. Kang, C.-Y.; Lian, H.-L.; Wang, F.-F.; Huang, J.-R.; Yang, H.-Q. Cryptochromes, phytochromes, and COP1 regulate light-controlled stomatal development in Arabidopsis. Plant Cell 2009, 21, 2624–2641. [Google Scholar] [CrossRef] [PubMed] [Green Version]
  58. Darko, E.; Heydarizadeh, P.; Schoefs, B.; Sabzalian, M.R. Photosynthesis under artificial light: The shift in primary and secondary metabolism. Philos. Trans. R. Soc. B Biol. Sci. 2014, 369, 20130243. [Google Scholar] [CrossRef] [PubMed]
  59. Assmann, S.M.; Shimazaki, K. The multisensory guard cell. Stomatal responses to blue light and abscisic acid. Plant Physiol. 1999, 119, 809–816. [Google Scholar] [CrossRef] [PubMed] [Green Version]
  60. Doi, M.; Kitagawa, Y.; Shimazaki, K.-i. Stomatal blue light response is present in early vascular plants. Plant Physiol. 2015, 169, 1205–1213. [Google Scholar] [CrossRef] [Green Version]
  61. Inoue, S.-I.; Kinoshita, T. Blue Light Regulation of Stomatal Opening and the Plasma Membrane H+-ATPase. Plant Physiol. 2017, 174, 531–538. [Google Scholar] [CrossRef] [Green Version]
  62. Lurie, S. The effect of wavelength of light on stomatal opening. Planta 1978, 140, 245–249. [Google Scholar] [CrossRef] [PubMed]
  63. Sharkey, T.D.; Raschke, K. Effect of light quality on stomatal opening in leaves of Xanthium strumarium L. Plant Physiol. 1981, 68, 1170–1174. [Google Scholar] [CrossRef] [PubMed] [Green Version]
  64. Lamb, J.J.; Røkke, G.; Hohmann-Marriott, M.F. Chlorophyll fluorescence emission spectroscopy of oxygenic organisms at 77 K. Photosynthetica 2018, 56, 105–124. [Google Scholar] [CrossRef] [Green Version]
  65. Balegh, S.; Biddulph, O. The photosynthetic action spectrum of the bean plant. Plant Physiol. 1970, 46, 1–5. [Google Scholar] [CrossRef] [Green Version]
  66. Roshchina, V.a.V. Fluorescing World of Plant Secreting Cells; Science Publishers: Rawalpindi, Pakistan, 2008. [Google Scholar]
  67. Hoffmann, A.M.; Noga, G.; Hunsche, M. High blue light improves acclimation and photosynthetic recovery of pepper plants exposed to UV stress. Environ. Exp. Bot. 2015, 109, 254–263. [Google Scholar] [CrossRef]
  68. Taulavuori, K.; Julkunen-Tiitto, R.; Hyöky, V.; Taulavuori, E. Blue Mood for Superfood. Nat. Prod. Commun. 2013, 8. [Google Scholar] [CrossRef] [Green Version]
  69. Amaki, W.; Yamazaki, N.; Ichimura, M.; Watanabe, H. Effects of Light Quality on the Growth and Essential Oil Content in Sweet Basil. Acta Hortic. 2011, 907, 91–94. [Google Scholar] [CrossRef]
Figure 1. Spectra of the lighting treatments used as measured by a UPRtek spectrophotometer: (A) the radiant density of the light spectrum intensity and (B) the relative light intensity.
Agronomy 10 00934 g001
Figure 2. Spectrometric analysis of Calendula officinalis, Mentha spicata, Lychnis coronaria, Verbena bonariensis, Dianthus barbatus, Tagetes patula, Coriandrum sativum (Coriander), Polemonium caeruleum, Ocimum basilicum, Brassica oleracea, Solanum lycopersicum and Asparagus aethiopicus pigment absorption using Jenway 7315 spectrophotometer: Results presented as means (between wavelengths: p ≤ 0.001, least significant difference (LSD) = 0.054; between plant species: p ≤ 0.001, LSD = 0.164).
Agronomy 10 00934 g002
Figure 3. Spectrometric analysis of sweet basil (Ocimum basilicum) pigment absorption using a Jenway 7315 spectrophotometer: Results are presented as means + standard error (S.E.).
Agronomy 10 00934 g003
Figure 4. The effect of lighting treatment and development stage on various physiological aspects in sweet basil: (A) chlorophyll fluorescence rate (Fv/Fm) (LSD = 0.02), (B) light-saturated maximum photosynthetic rate (Amax) (LSD = 0.6) and (C) stomatal conductance (LSD = 0.064 for the lighting treatments, LSD = 0.074 for the development stage).
Agronomy 10 00934 g004
Figure 5. The effect of light treatment and development stage on the (A) height (H) (LSD = 1.96), (B) stem diameter (SD) (LSD = 0.09), (C) number of leaves (NL) (LSD = 5.01), (D) leaf area (LA) (LSD = 133.3), (E) fresh weight (FW) (LSD = 10.8) and (F) dry weight (DW) (LSD = 0.9) of sweet basil (Ocimum basilicum) in a plant factory and glasshouse cultivation.
Agronomy 10 00934 g005
Figure 6. The effect of light treatments on the yield of essential oil per plant of sweet basil (LSD = 0.0554).
Agronomy 10 00934 g006
Figure 7. The effect of light treatments on the light used efficiency (LSD = 0.0745).
Agronomy 10 00934 g007

