Deciphering the Role of Stay-Green Trait to Mitigate Terminal Heat Stress in Bread Wheat

 ,
, 
Abstract
1. Introduction
2. Materials and Methods
2.1. Phenotyping
2.1.1. Field Experiment
2.1.2. Greenhouse Experiment
2.2. Genotyping
2.2.1. Sample Preparation
2.2.2. DNA Extraction and Gel Electrophoresis
2.2.3. Identification of CaO, Cab, SGR, and RCCR Genes in the Wheat Genome
2.2.4. Phylogenetic Analysis
2.2.5. Primer Designing
2.2.6. Amplification and Sequencing
2.2.7. RNA Extraction, Gel Electrophoresis, and Qubit Assay
2.2.8. cDNA Synthesis and Quantification
2.2.9. Transcript Abundance by Reverse Transcription Quantitative PCR (RT-qPCR)
2.3. Statistical Analysis
3. Results
3.1. Phenotyping
3.1.1. Field Experiment
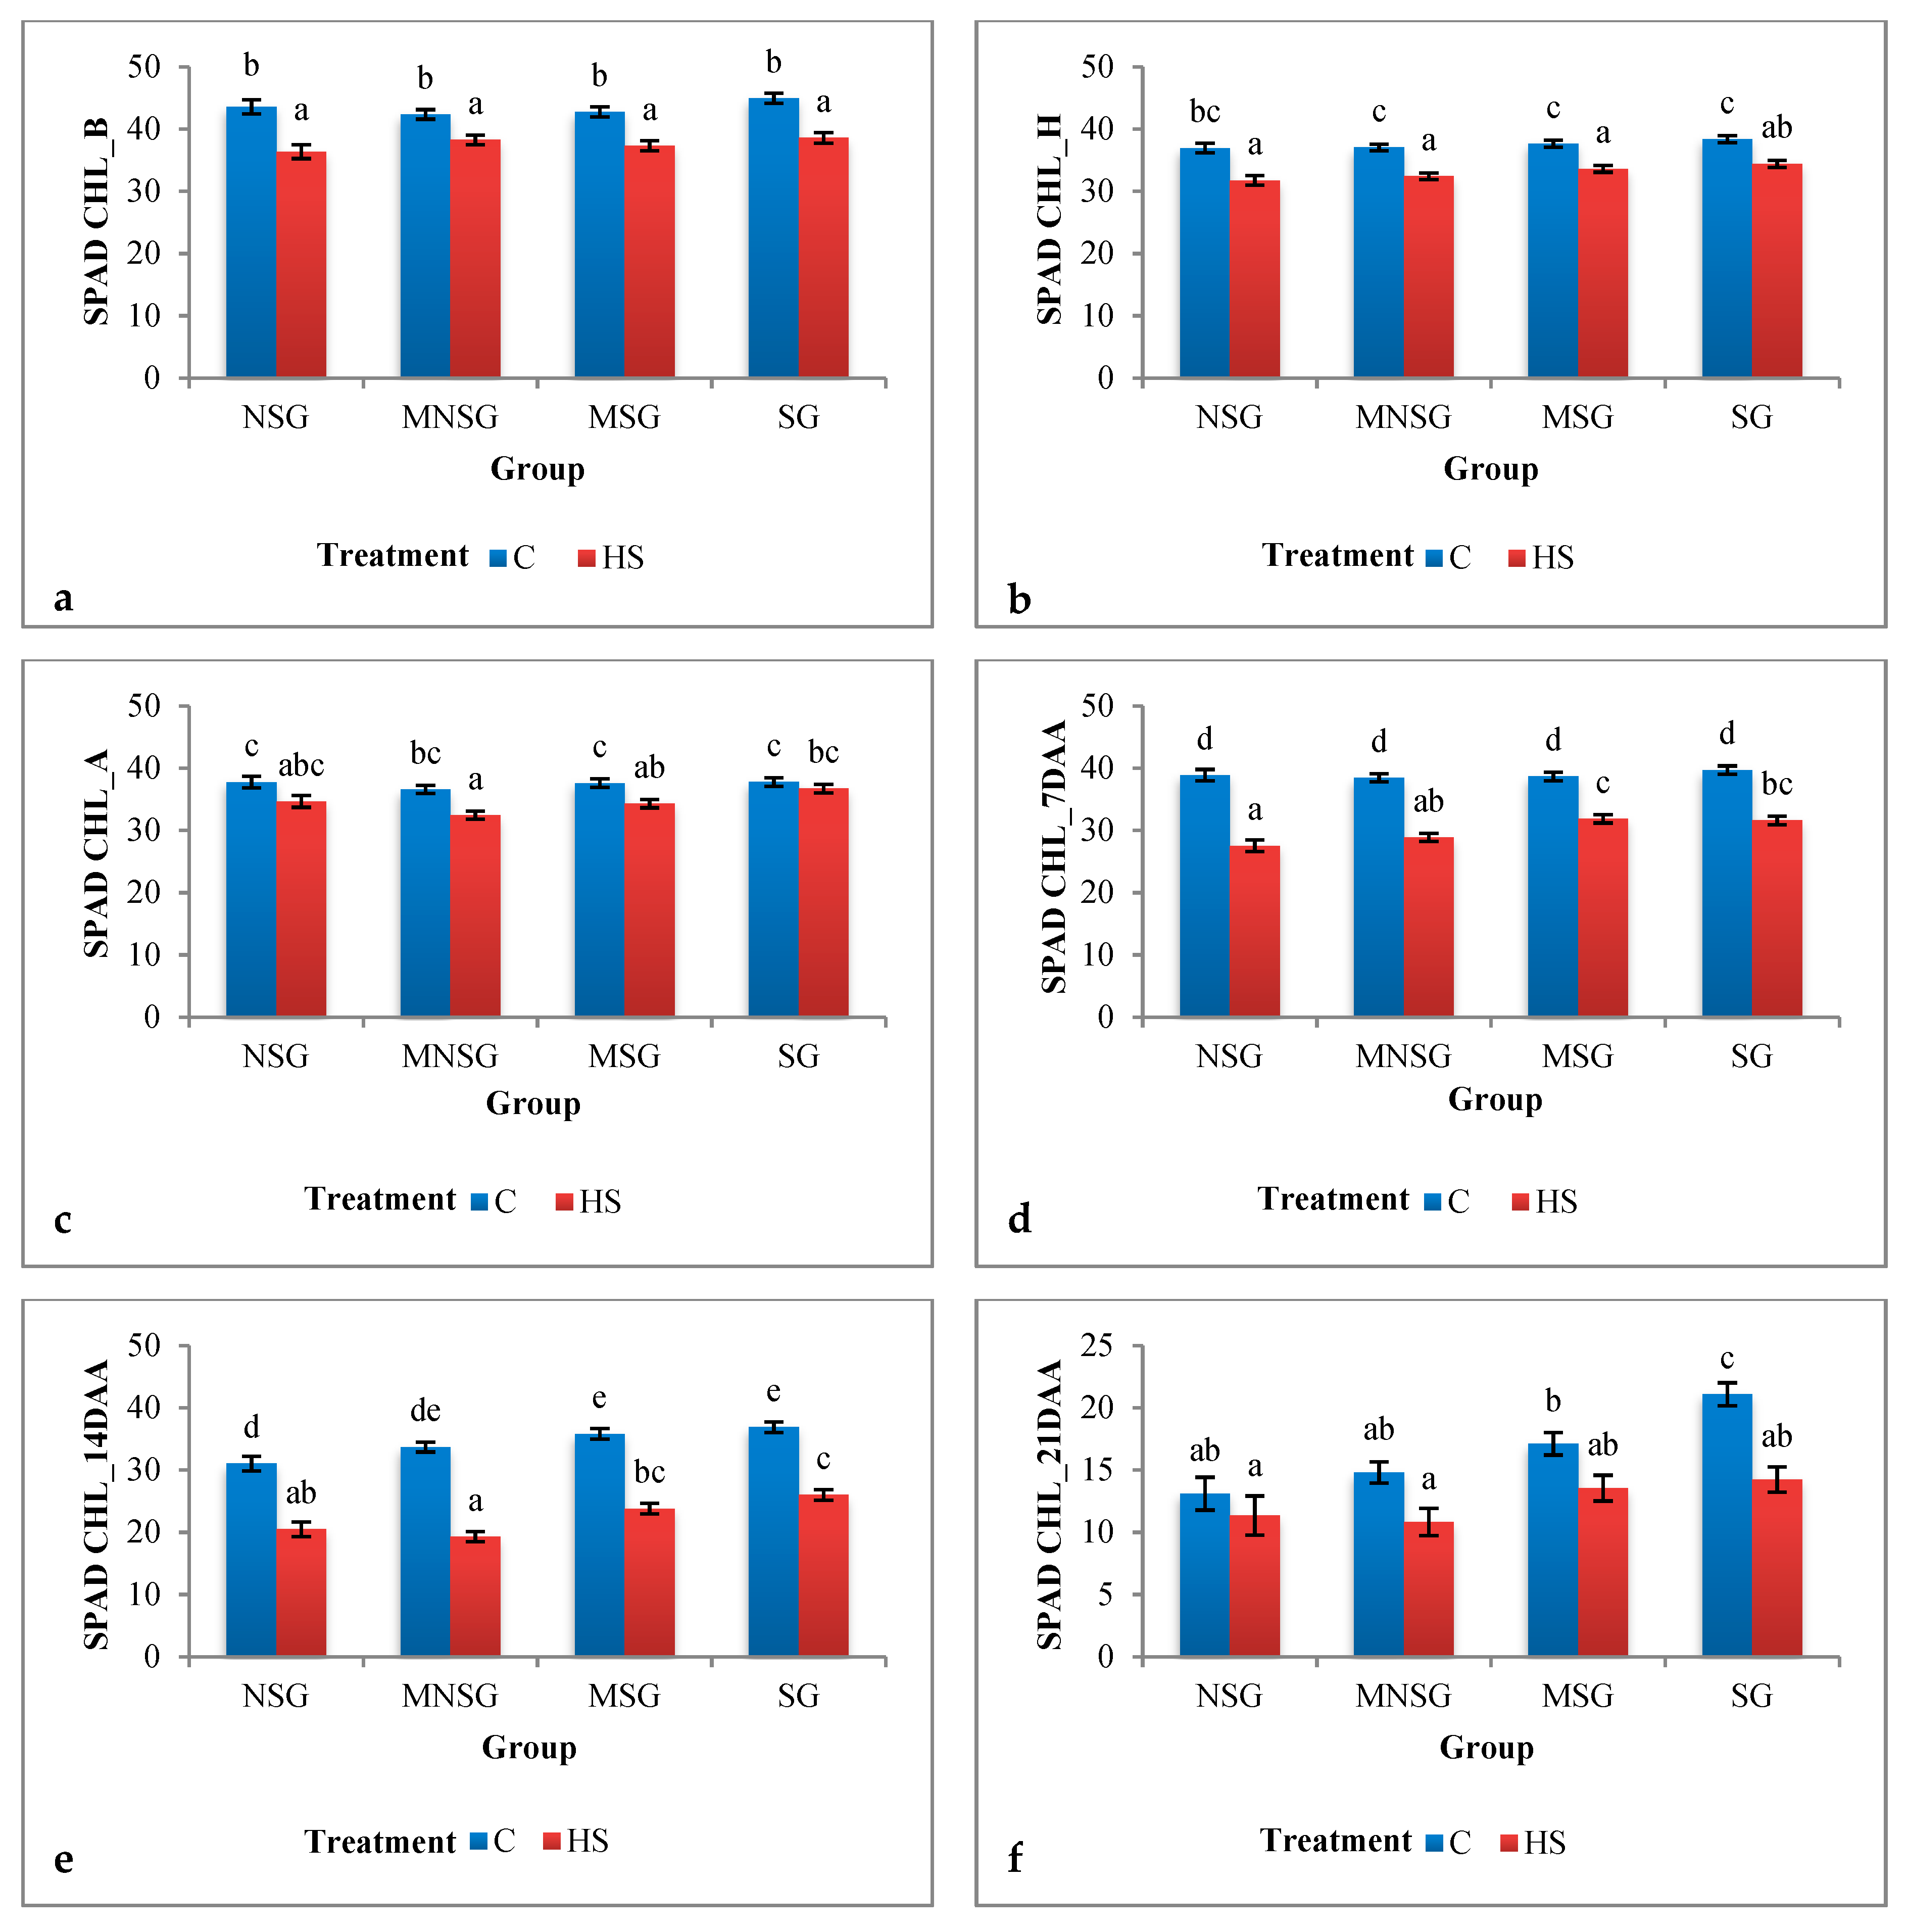
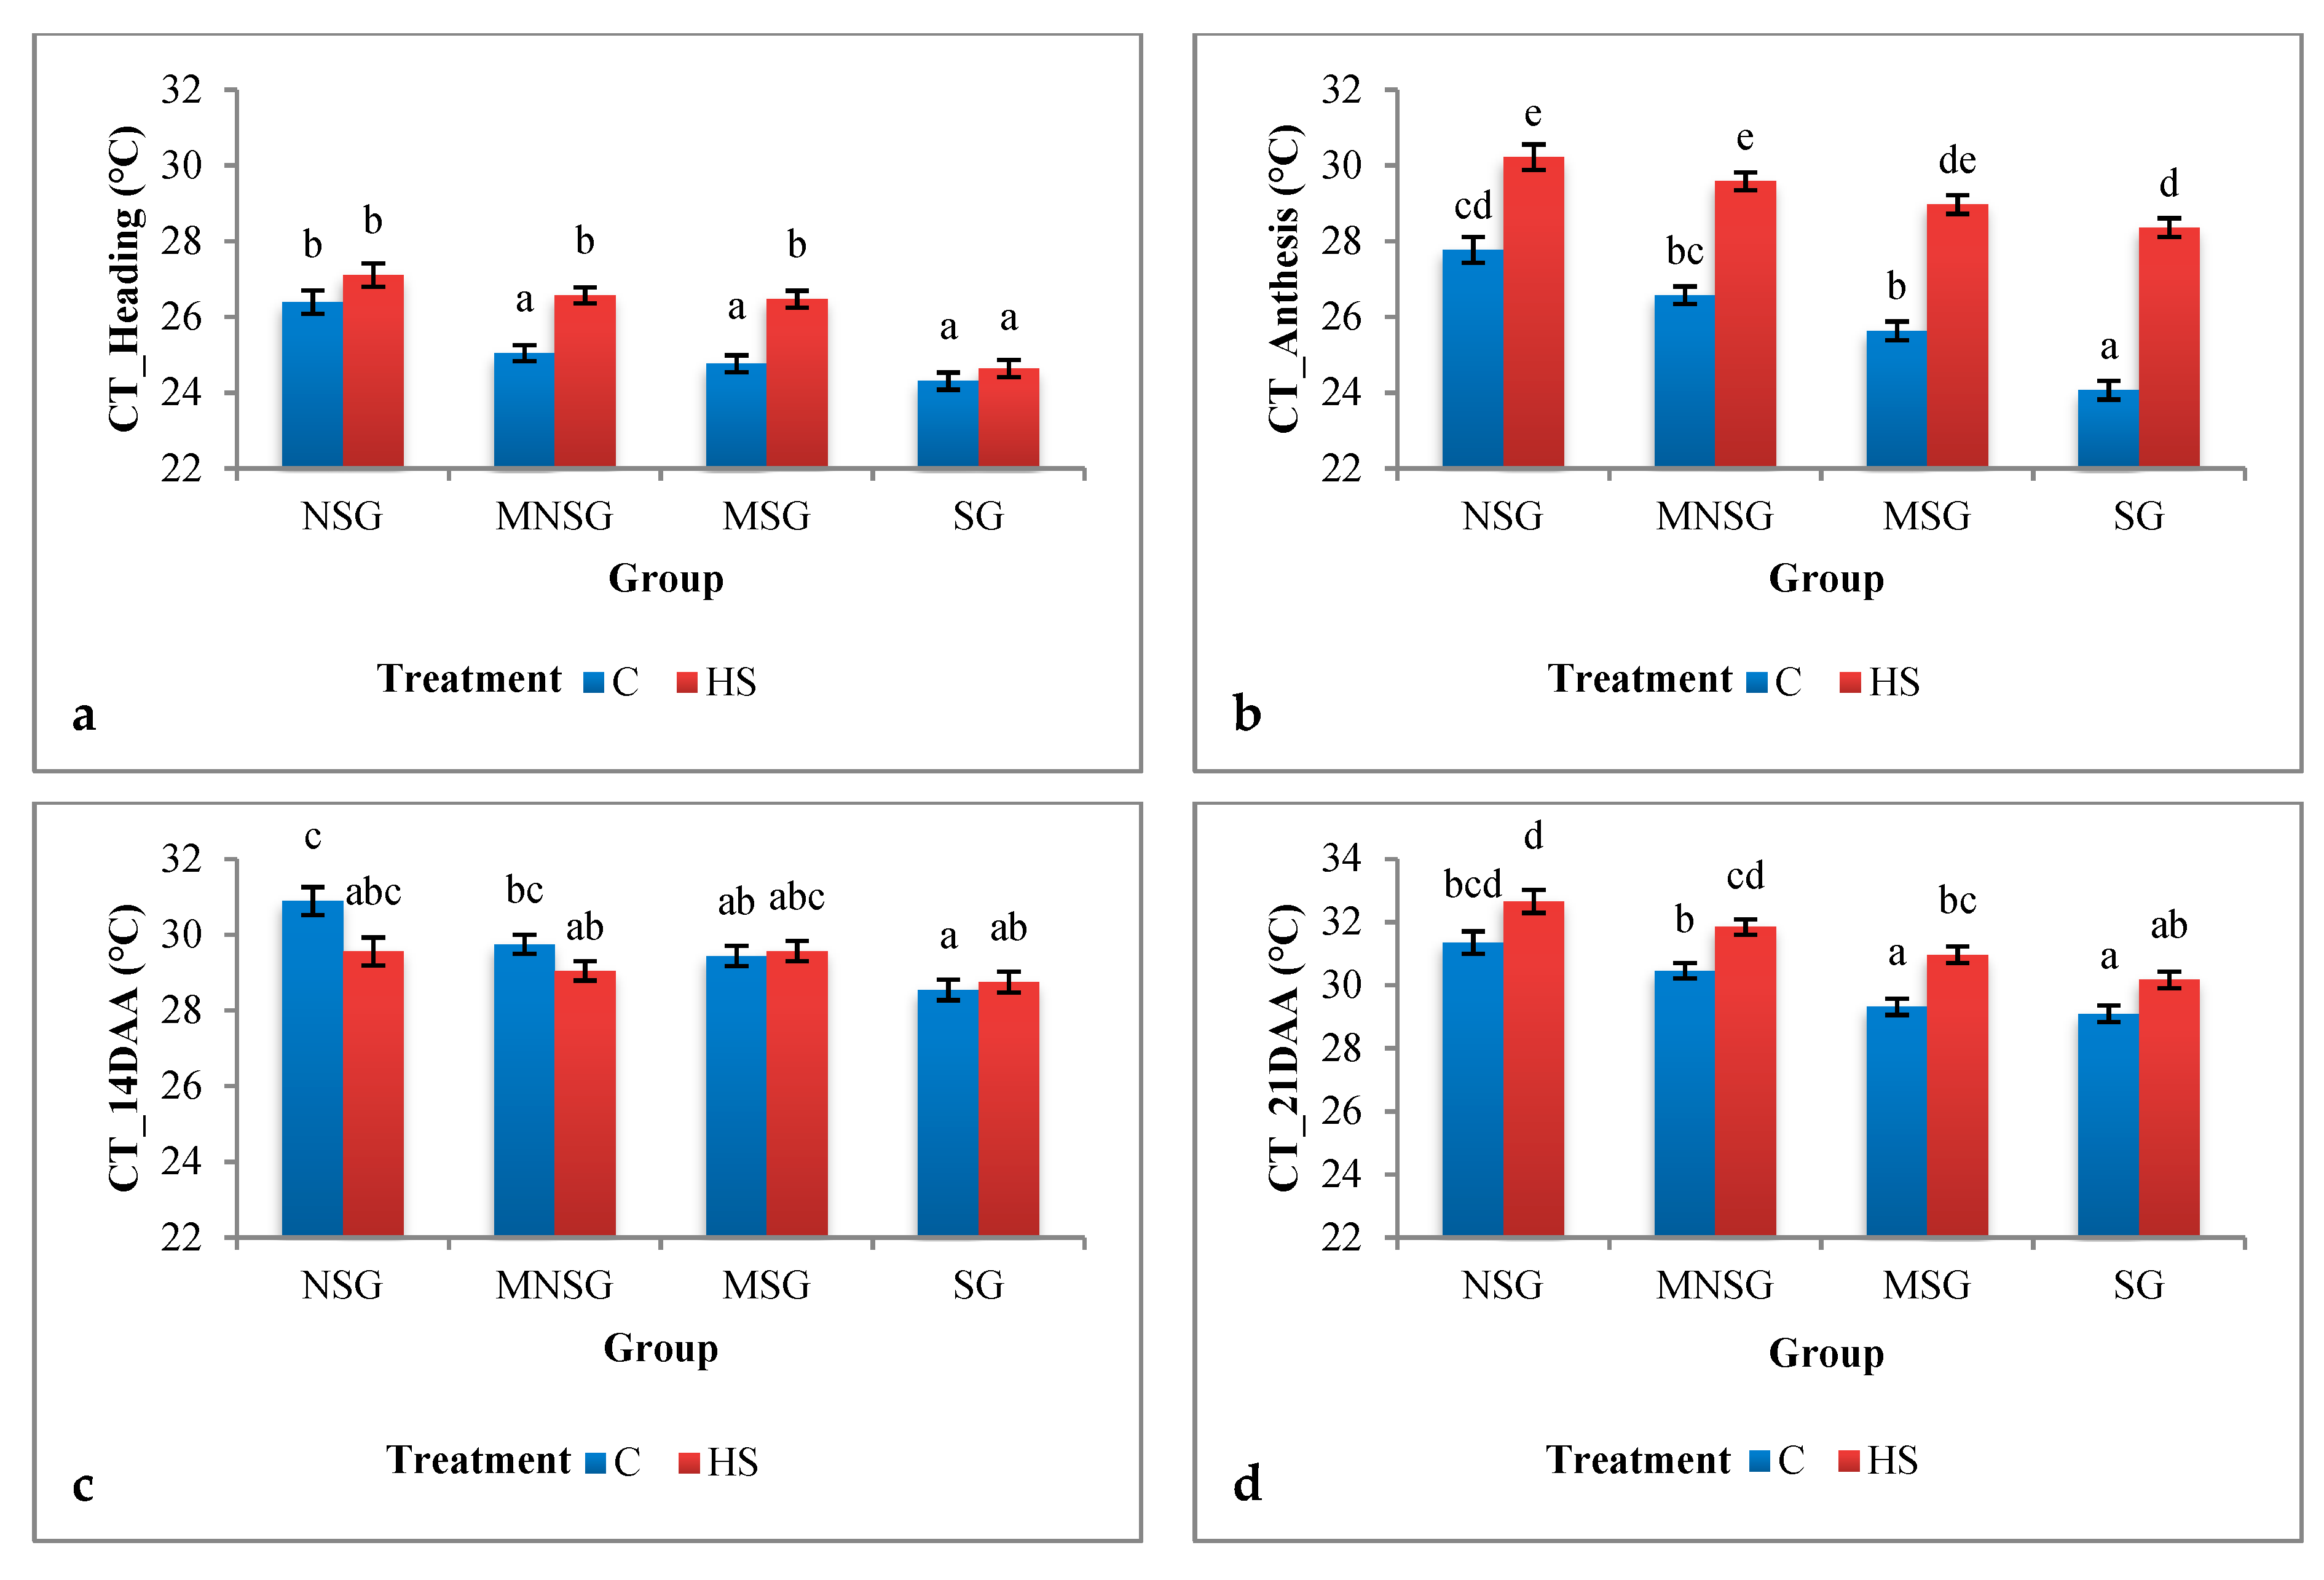
Physiological Traits
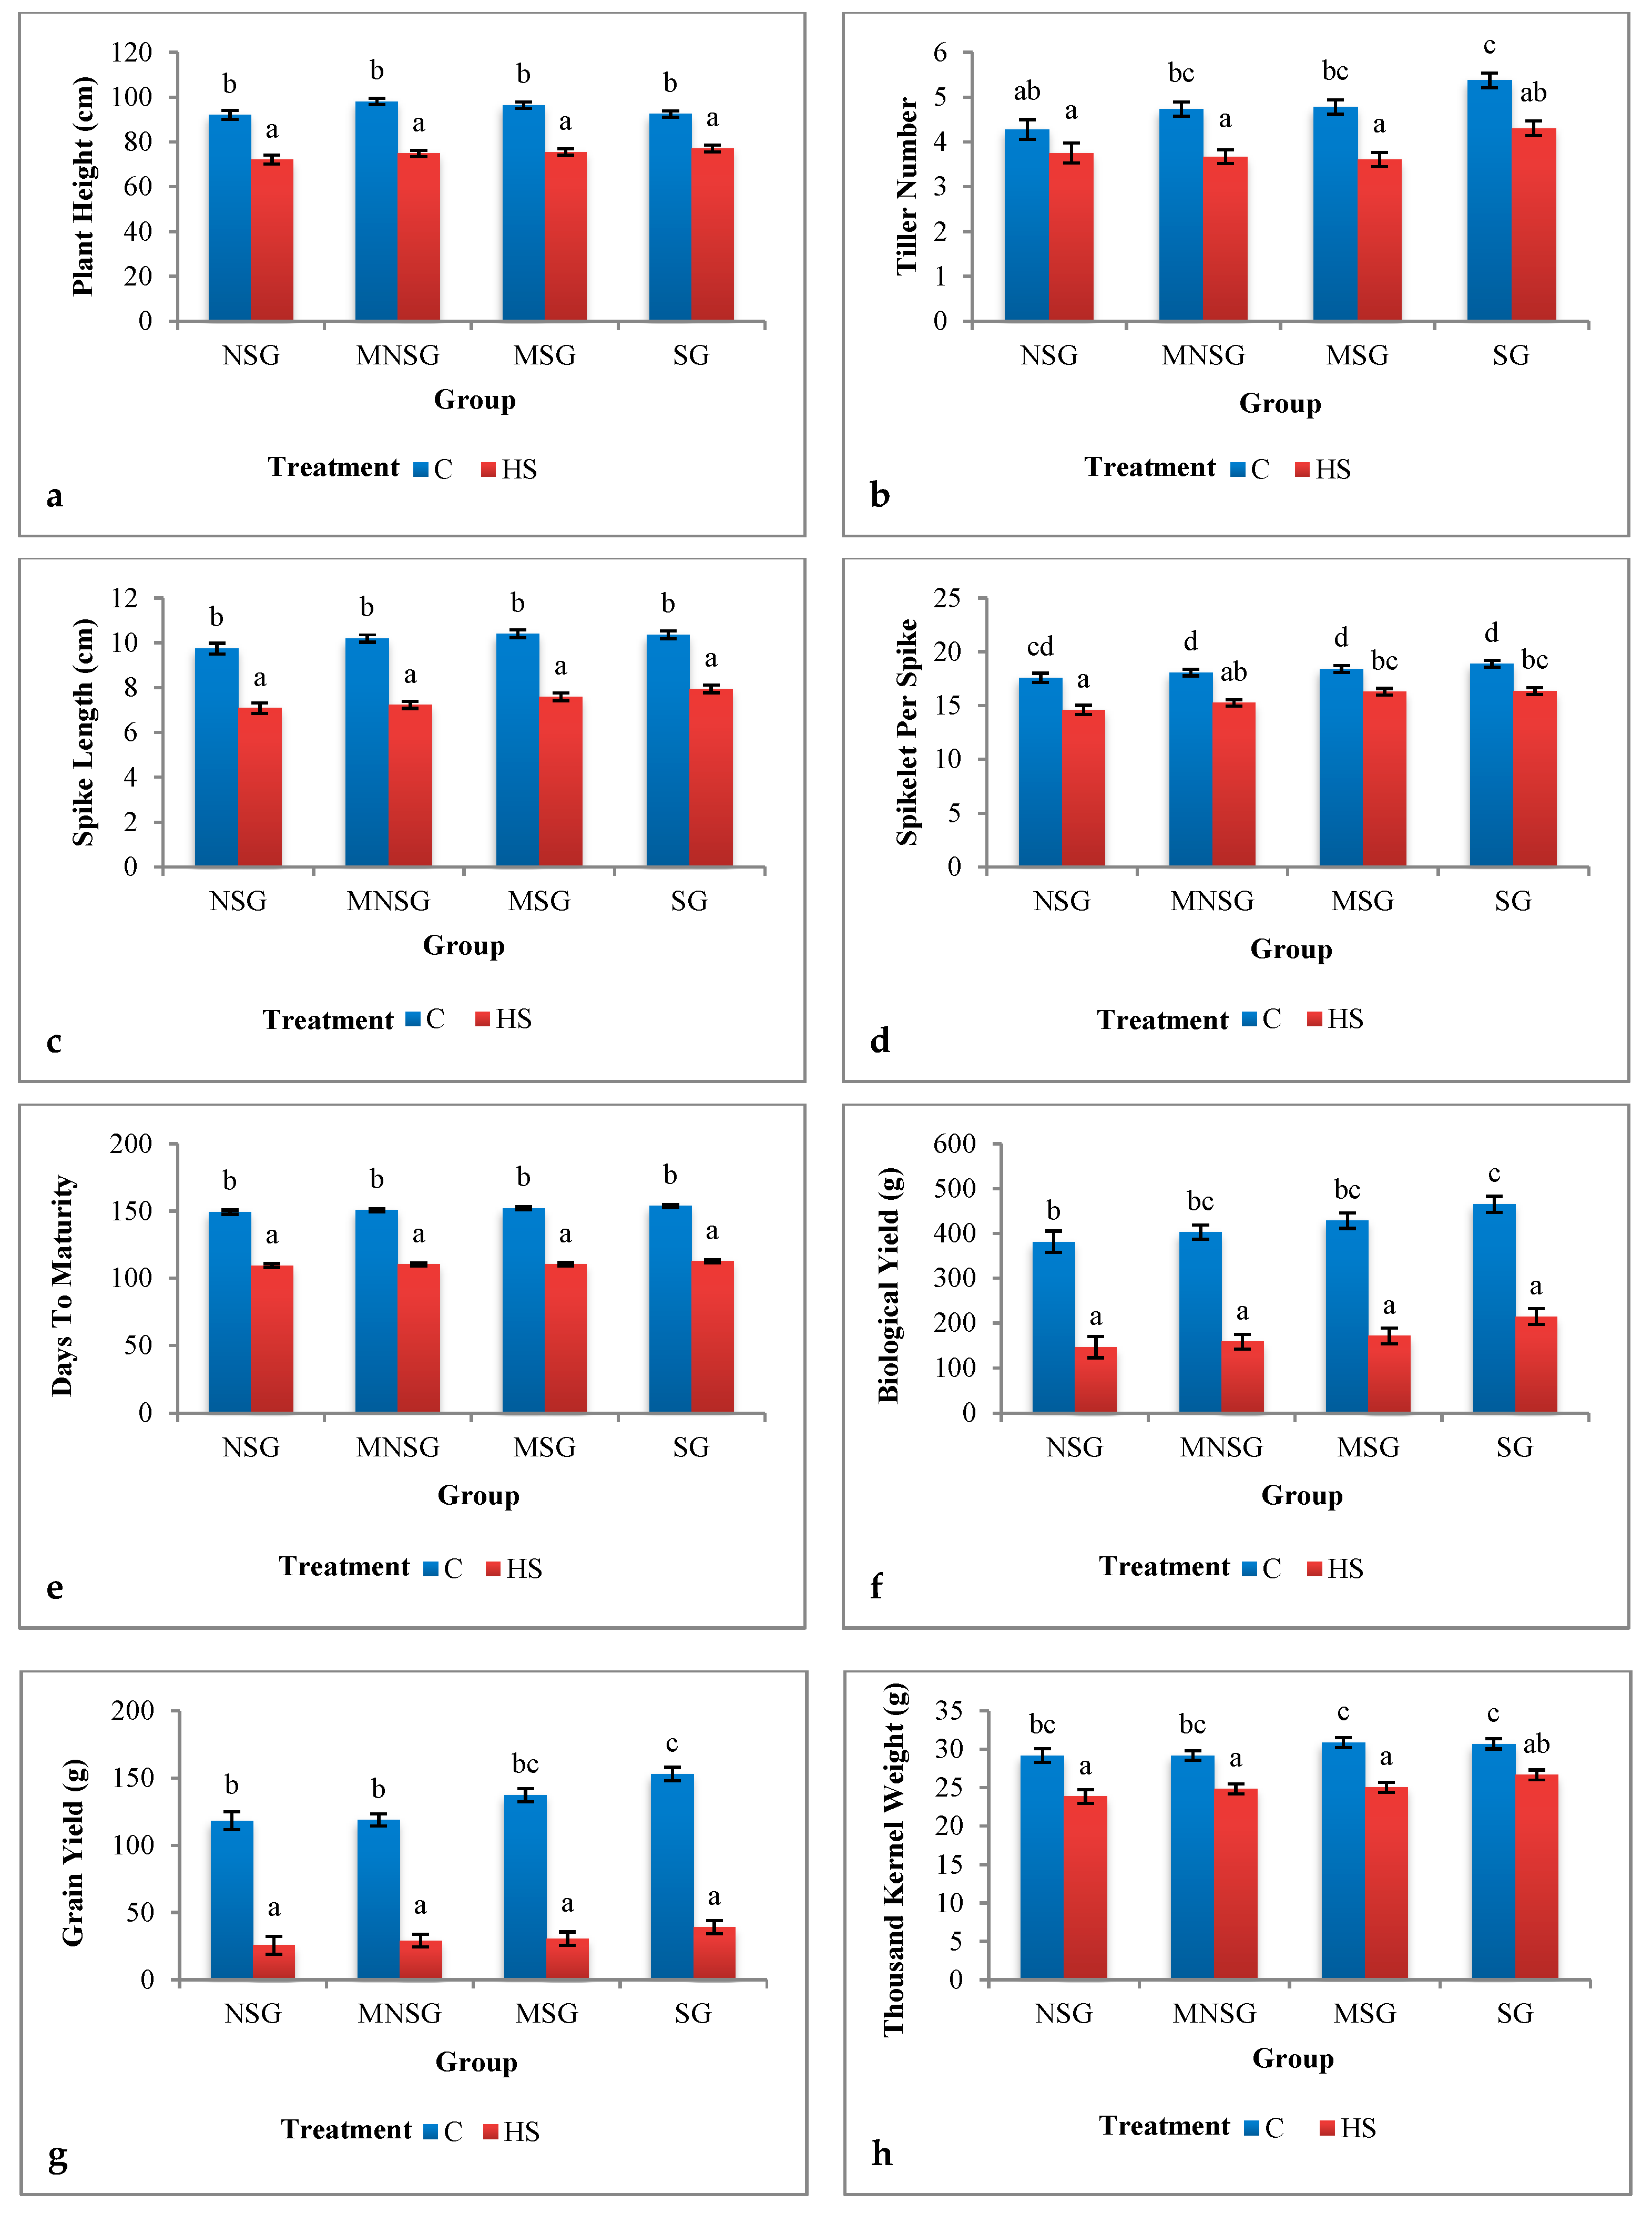
Morphological Traits
3.1.2. Greenhouse Experiment
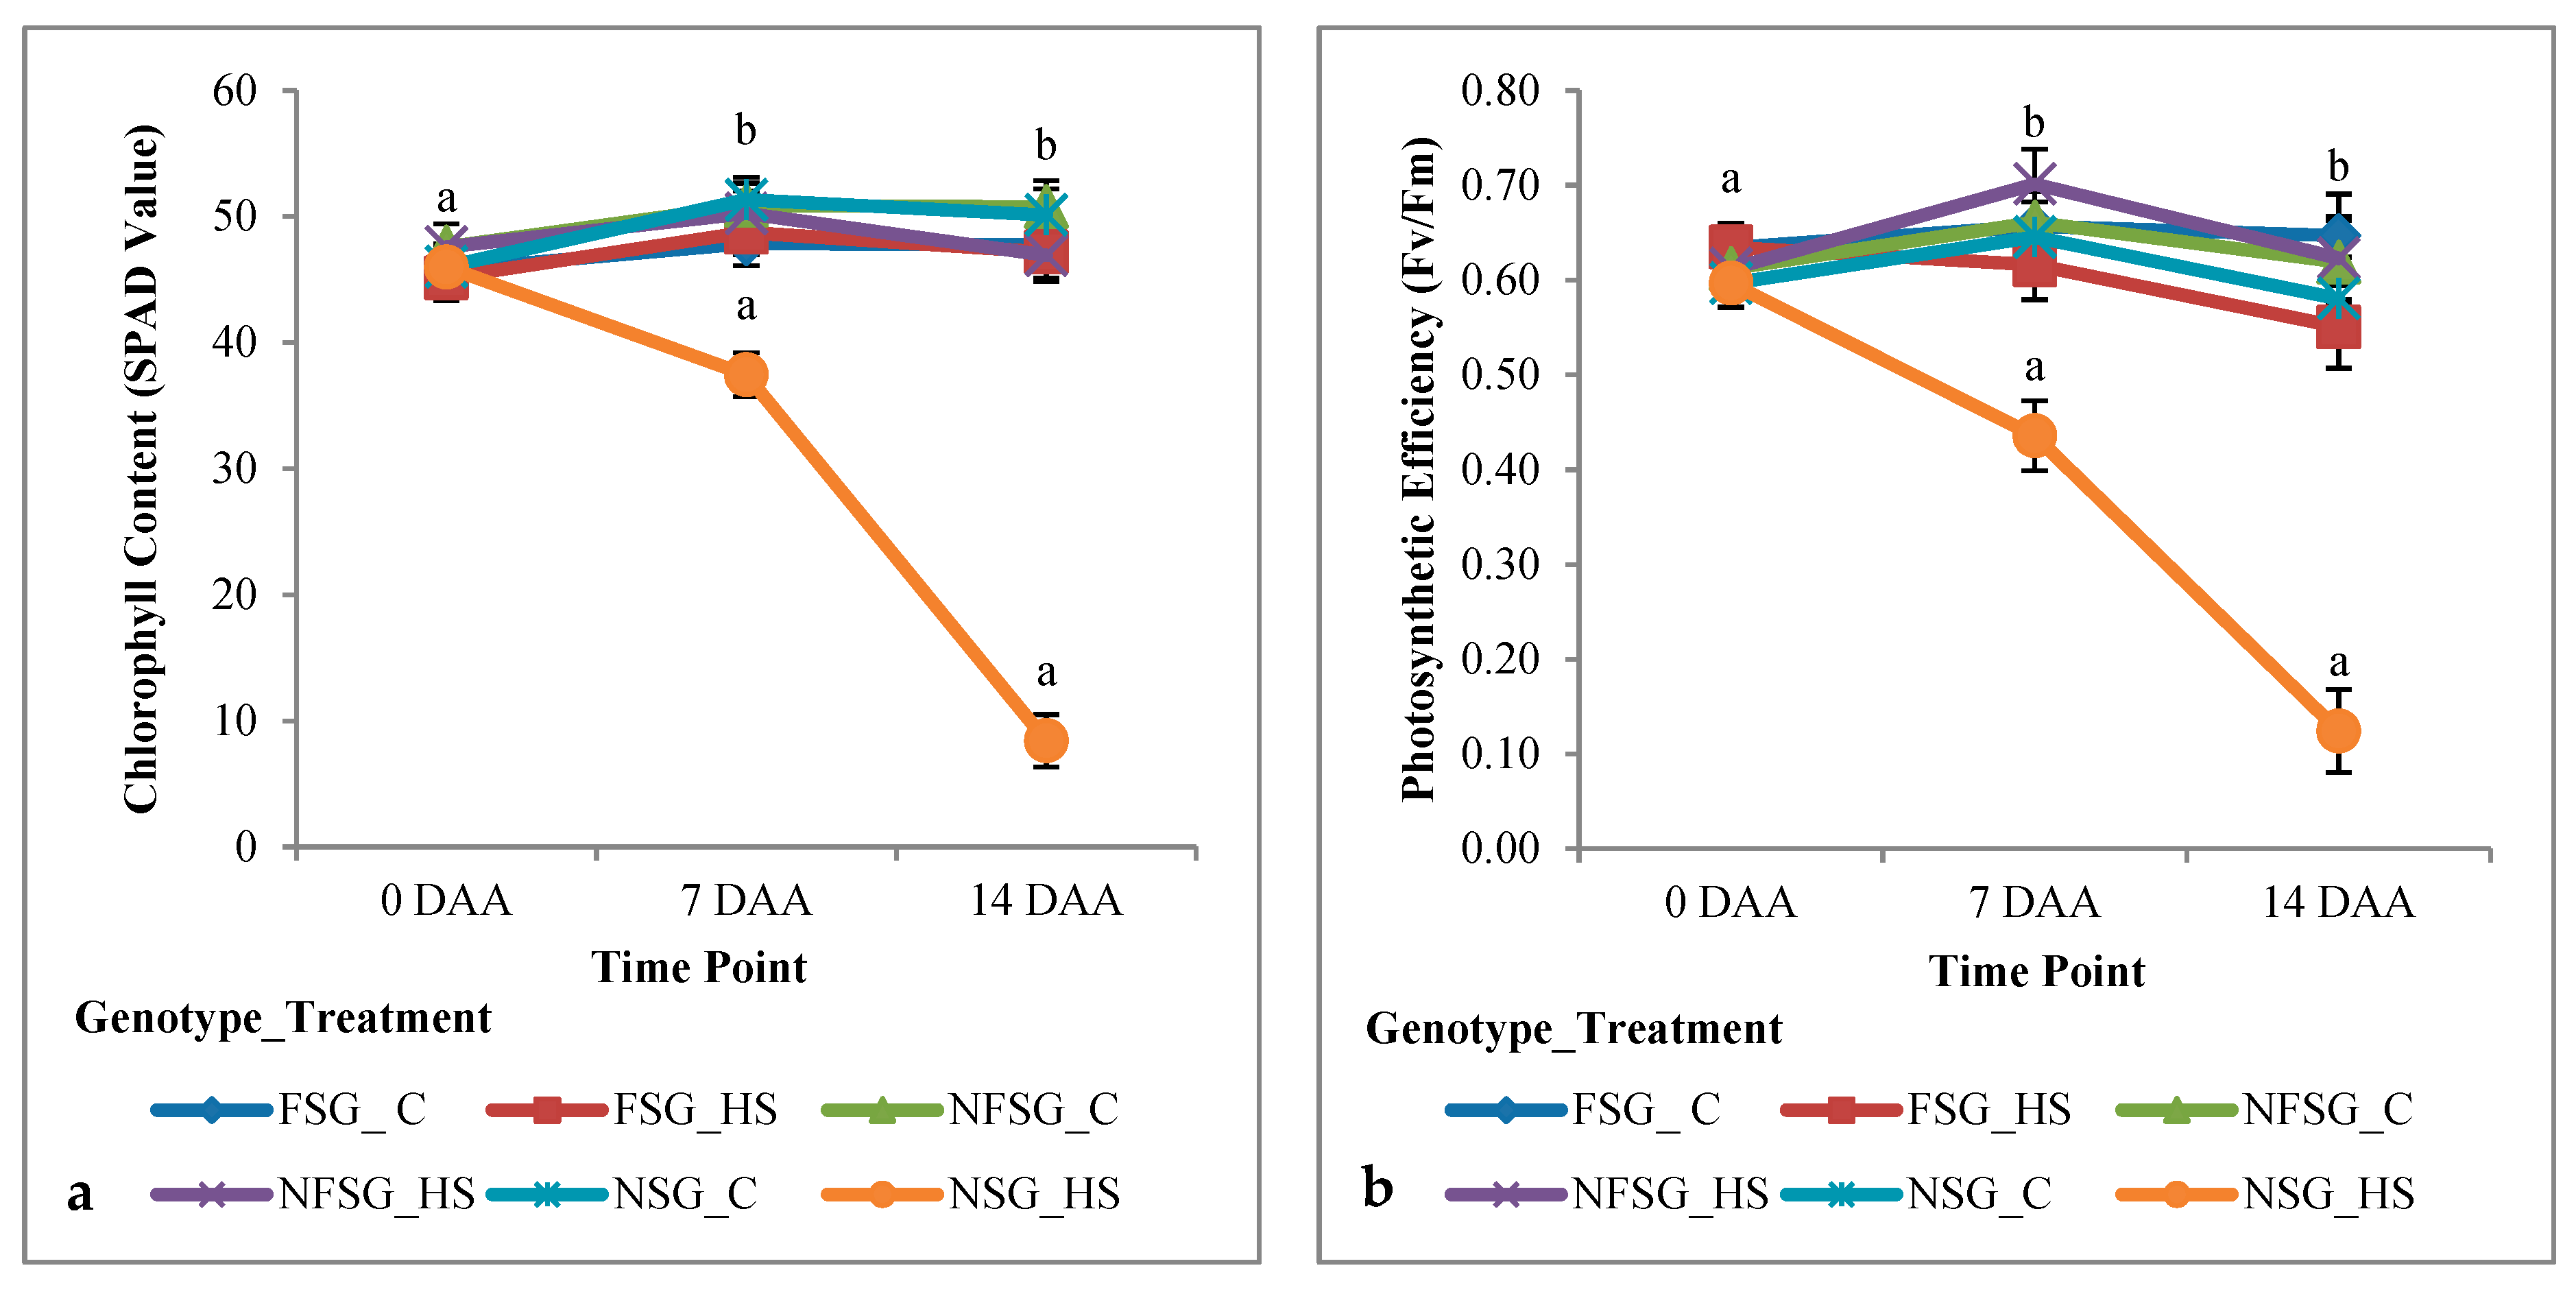
Physiological Traits
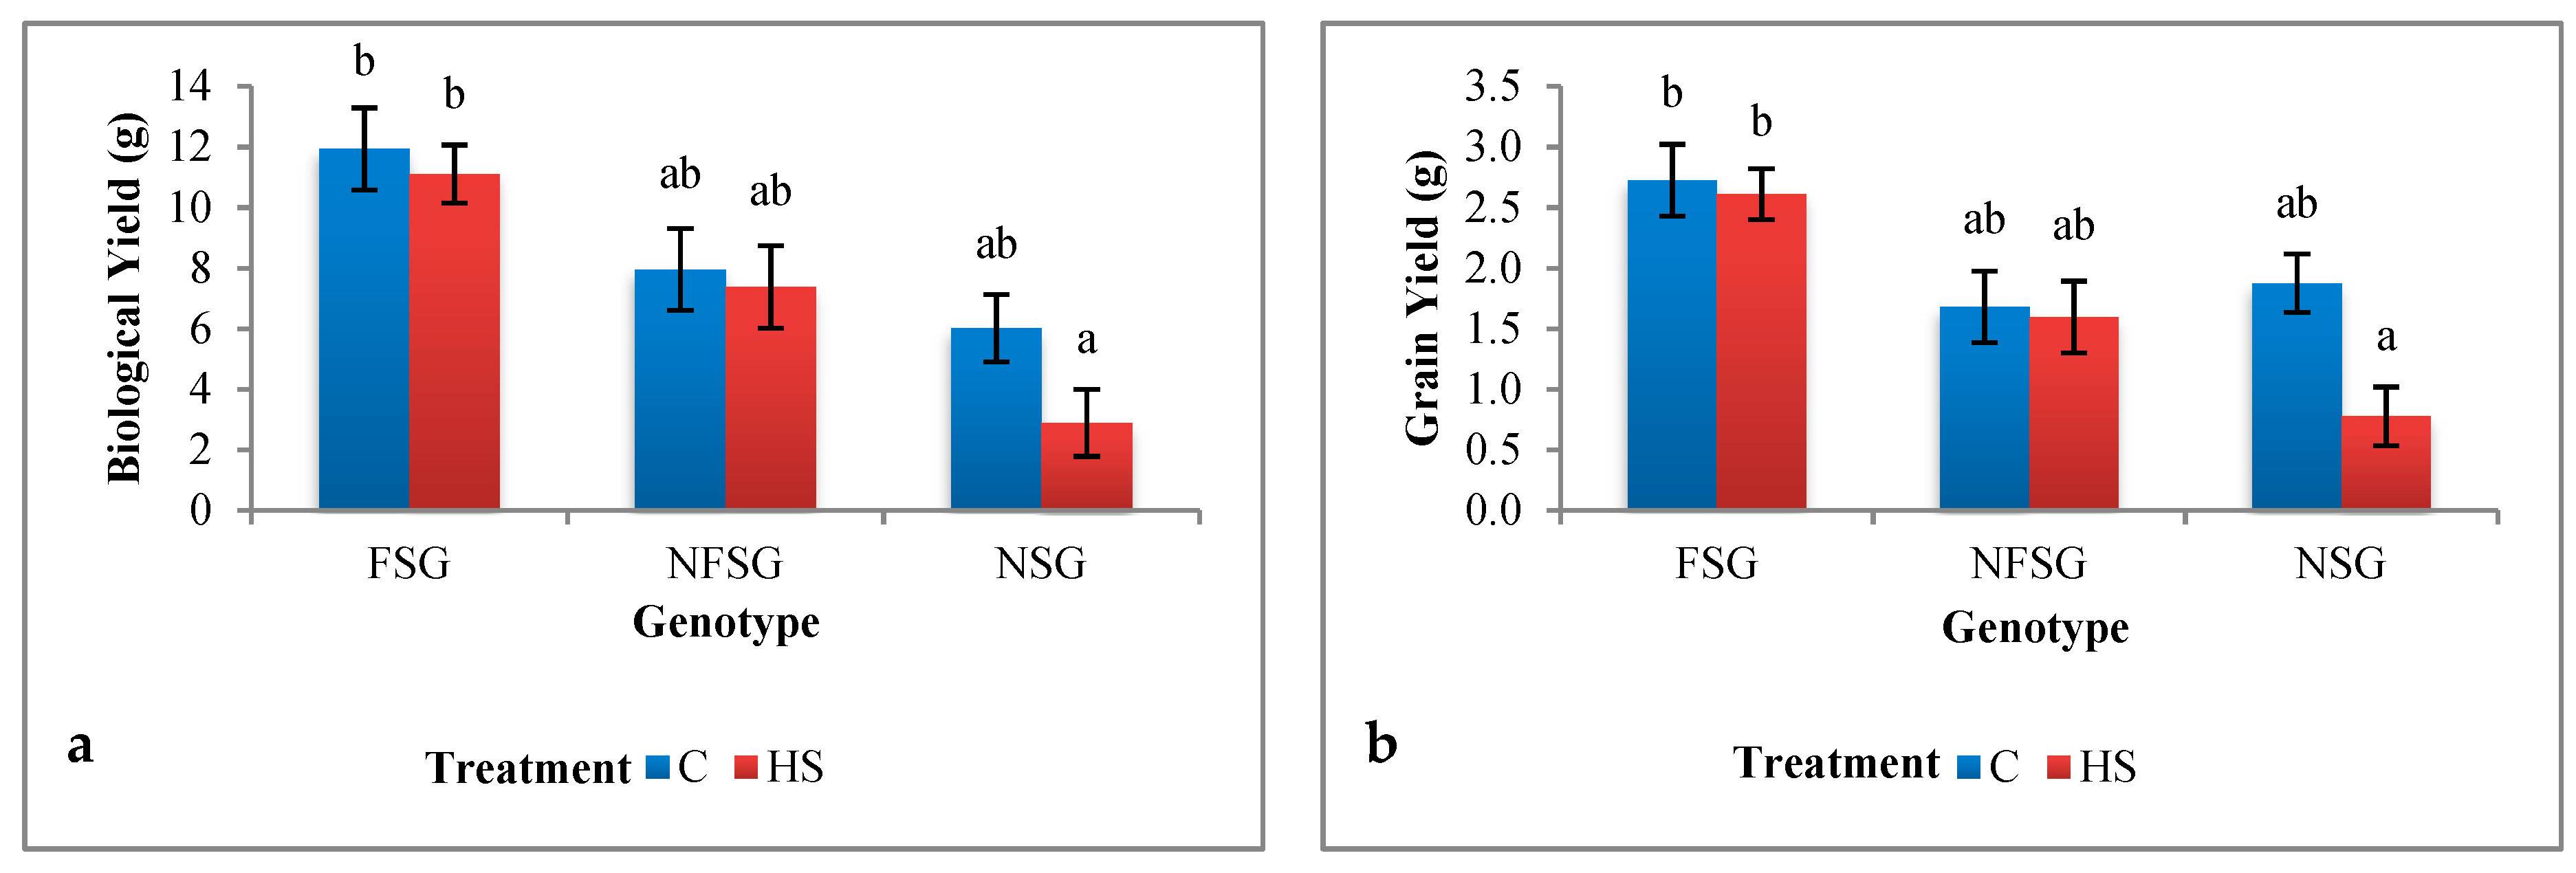
Biological Yield and Grain Yield
3.2. Genotyping
3.2.1. Identification of CaO, Cab, SGR, and RCCR in the Wheat Genome
3.2.2. Phylogenetics of CaO, Cab, SGR, and RCCR
3.2.3. Amplification and Sequencing of CaO, Cab, SGR, and RCCR
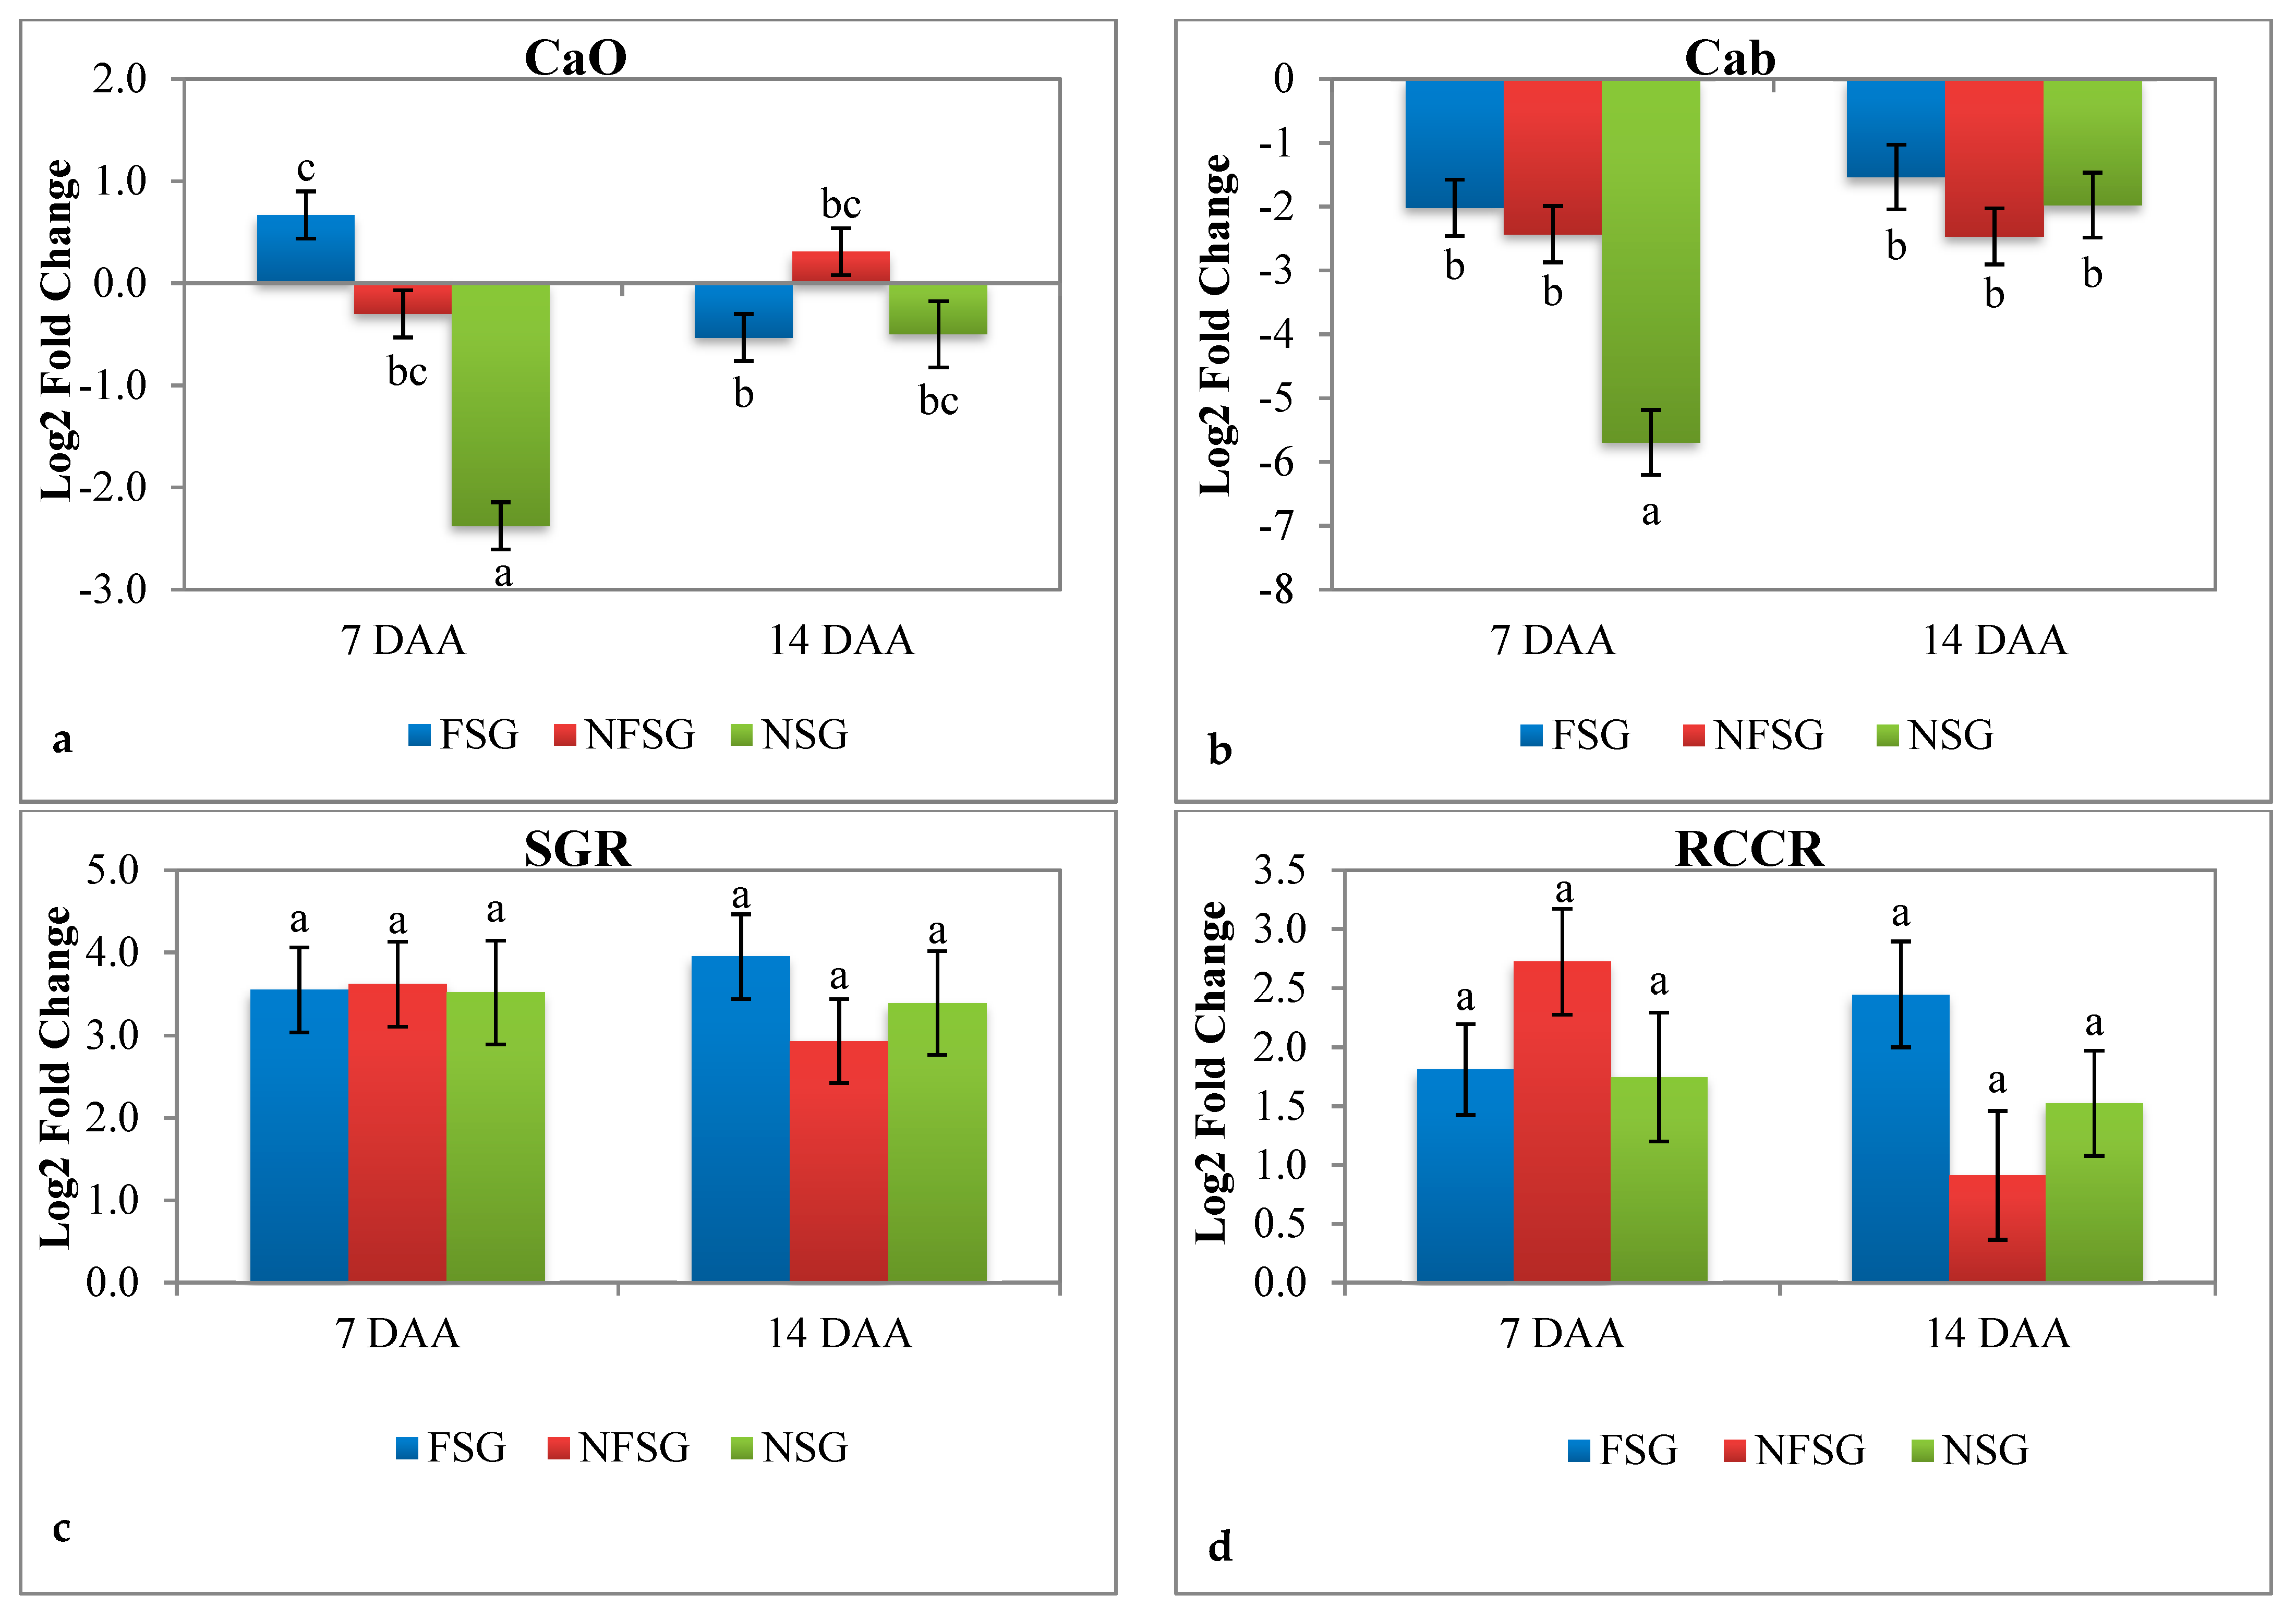
3.2.4. Expression Analysis of CaO, Cab, SGR, and RCCR under Terminal Heat Stress
4. Discussion
5. Conclusions
Supplementary Materials
Author Contributions
Funding
Acknowledgments
Conflicts of Interest
References
- Arunanondchai, P.; Fei, C.; Fisher, A.; McCarl, B.A.; Wang, W.; Yang, Y. How does climate change affect agriculture. In The Routledge Handbook of Agricultural Economics, 1st ed.; Cramer, G.L., Paudel, K.P., Schmitz, A., Eds.; Routledge: Abingdon-on-Thames, UK, 2018; pp. 191–210. [Google Scholar]
- Noya, I.; González-García, S.; Bacenetti, J.; Fiala, M.; Moreira, M.T. Environmental impacts of the cultivation-phase associated with agricultural crops for feed production. J. Clean. Prod. 2018, 172, 3721–3733. [Google Scholar] [CrossRef]
- Raza, A.; Razzaq, A.; Mehmood, S.S.; Zou, X.; Zhang, X.; Lv, Y.; Xu, J. Impact of climate change on crops adaptation and strategies to tackle its outcome: A review. Plants 2019, 8, 34. [Google Scholar] [CrossRef] [PubMed]
- Fontana, G.; Toreti, A.; Ceglar, A.; De Sanctis, G. Early heat waves over Italy and their impacts on durum wheat yields. Nat. Hazard. Earth Syst. 2015, 15, 1631–1637. [Google Scholar] [CrossRef]
- Mueller, B.; Hauser, M.; Iles, C.; Rimi, R.H.; Zwiers, F.W.; Wan, H. Lengthening of the growing season in wheat and maize producing regions. Weather Clim. Extrem. 2015, 9, 47–56. [Google Scholar] [CrossRef]
- Hays, D.; Mason, E.; Do, J.H.; Menz, M.; Reynolds, M. Expression Quantitative Trait Loci Mapping Heat Tolerance During Reproductive Development in Wheat (Triticum Aestivum). In Wheat Production in Stressed Environments, Proceedings of the 7th International Wheat Conference, Mar del Plata, Argentina, 27 November–2 December 2005; Buck, H.T., Nisi, J.E., Salomon, N., Eds.; Springer: Dordrecht, The Netherlands, 2007; pp. 373–382. [Google Scholar]
- Wollenweber, B.; Porter, J.; Schellberg, J. Lack of Interaction between Extreme High-Temperature Events at Vegetative and Reproductive Growth Stages in Wheat. J. Agron. Crop Sci. 2003, 189, 142–150. [Google Scholar] [CrossRef]
- Siebert, S.; Ewert, F.; Eyshi Rezaei, E.; Kage, H.; Graß, R. Impact of heat stress on crop yield—On the importance of considering canopy temperature. Environ. Res. Lett. 2014, 9, 044012. [Google Scholar] [CrossRef]
- Sharma, I.; Tyagi, B.; Singh, G.; Venkatesh, K.; Gupta, O. Enhancing wheat production—A global perspective. Indian J. Agric. Sci. 2015, 85, 3–13. [Google Scholar]
- Akter, N.; Islam, M.R. Heat stress effects and management in wheat. A review. Agron. Sustain. Dev. 2017, 37, 37. [Google Scholar] [CrossRef]
- Challinor, A.J.; Watson, J.; Lobell, D.B.; Howden, S.; Smith, D.; Chhetri, N. A meta-analysis of crop yield under climate change and adaptation. Nat. Clim. Chang. 2014, 4, 287–291. [Google Scholar] [CrossRef]
- Sairam, R.K.; Srivastava, G.C.; Saxena, D.C. Increased Antioxidant Activity under Elevated Temperatures: A Mechanism of Heat Stress Tolerance in Wheat Genotypes. Biol. Plant. 2000, 43, 245–251. [Google Scholar] [CrossRef]
- Dias, A.; Lidon, F. Evaluation of grain filling rate and duration in bread and durum wheat, under heat stress after anthesis. J. Agron. Crop Sci. 2009, 195, 137–147. [Google Scholar] [CrossRef]
- Wilkinson, S.; Davies, W.J. ABA-based chemical signalling: The co-ordination of responses to stress in plants. Plant Cell Environ. 2002, 25, 195–210. [Google Scholar] [CrossRef] [PubMed]
- Balla, K.; Karsai, I.; Bencze, S.; Veisz, O. Germination ability and seedling vigour in the progeny of heat-stressed wheat plants. Acta Agron. Hung. 2012, 60, 299–308. [Google Scholar] [CrossRef]
- Sharma, D.; Singh, R.; Tiwari, R.; Kumar, R.; Gupta, V.K. Wheat Responses and Tolerance to Terminal Heat Stress: A Review. In Wheat Production in Changing Environments; Hasanuzzaman, M., Nahar, K., Hossain, M., Eds.; Springer: Singapore, 2019; pp. 149–173. [Google Scholar] [CrossRef]
- Kumari, M.; Singh, V.P.; Tripathi, R.; Joshi, A.K. Variation for Staygreen Trait and its Association with Canopy Temperature Depression and Yield Traits Under Terminal Heat Stress in Wheat. In Wheat Production in Stressed Environments. Developments in Plant Breeding; Buck, H.T., Nisi, J.E., Salomón, N., Eds.; Springer: Dordrecht, The Netherlands, 2007; Volume 12, pp. 357–363. [Google Scholar] [CrossRef]
- Pinto, R.S.; Lopes, M.S.; Collins, N.C.; Reynolds, M.P. Modelling and genetic dissection of staygreen under heat stress. Theor. Appl. Genet. 2016, 129, 2055–2074. [Google Scholar] [CrossRef] [PubMed]
- Thomas, H.; Ougham, H. The stay-green trait. J. Exp. Bot. 2014, 65, 3889–3900. [Google Scholar] [CrossRef] [PubMed]
- Hortensteiner, S. Stay-green regulates chlorophyll and chlorophyll-binding protein degradation during senescence. Trends Plant Sci. 2009, 14, 155–162. [Google Scholar] [CrossRef]
- Armstead, I.; Donnison, I.; Aubry, S.; Harper, J.; Hörtensteiner, S.; James, C.; Mani, J.; Moffet, M.; Ougham, H.; Roberts, L. From crop to model to crop: Identifying the genetic basis of the staygreen mutation in the Lolium/Festuca forage and amenity grasses. New Phytol. 2006, 172, 592–597. [Google Scholar] [CrossRef]
- Barry, C.S.; McQuinn, R.P.; Chung, M.Y.; Besuden, A.; Giovannoni, J.J. Amino acid substitutions in homologs of the STAY-GREEN protein are responsible for the green-flesh and chlorophyll retainer mutations of tomato and pepper. Plant Physiol. 2008, 147, 179–187. [Google Scholar] [CrossRef]
- Cha, K.W.; Lee, Y.J.; Koh, H.J.; Lee, B.M.; Nam, Y.W.; Paek, N.C. Isolation, characterization, and mapping of the stay green mutant in rice. Theor. Appl. Genet. 2002, 104, 526–532. [Google Scholar] [CrossRef]
- Duvick, D.; Smith, J.; Cooper, M. Long-term selection in a commercial hybrid maize breeding program. Plant Breed. Rev. 2004, 24, 109–152. [Google Scholar] [CrossRef]
- Fang, C.; Li, C.; Li, W.; Wang, Z.; Zhou, Z.; Shen, Y.; Wu, M.; Wu, Y.; Li, G.; Kong, L.A.; et al. Concerted evolution of D1 and D2 to regulate chlorophyll degradation in soybean. Plant J. 2014, 77, 700–712. [Google Scholar] [CrossRef] [PubMed]
- Grbić, V.; Bleecker, A.B. Ethylene regulates the timing of leaf senescence in Arabidopsis. Plant J. 1995, 8, 595–602. [Google Scholar] [CrossRef]
- Rampino, P.; Spano, G.; Pataleo, S.; Mita, G.; Napier, J.A.; Di Fonzo, N.; Shewry, P.R.; Perrotta, C. Molecular analysis of a durum wheat ‘stay green’ mutant: Expression pattern of photosynthesis-related genes. J. Cereal Sci. 2006, 43, 160–168. [Google Scholar] [CrossRef]
- Wei, Q.; Guo, Y.; Kuai, B. Isolation and characterization of a chlorophyll degradation regulatory gene from tall fescue. Plant Cell Rep. 2011, 30, 1201–1207. [Google Scholar] [CrossRef]
- Sakuraba, Y.; Schelbert, S.; Park, S.Y.; Han, S.H.; Lee, B.D.; Andrès, C.B.; Kessler, F.; Hörtensteiner, S.; Paek, N.C. STAY-GREEN and chlorophyll catabolic enzymes interact at light-harvesting complex II for chlorophyll detoxification during leaf senescence in Arabidopsis. Plant Cell 2012, 24, 507–518. [Google Scholar] [CrossRef]
- Takamiya, K.; Tsuchiya, T.; Ohta, H. Degradation pathway (s) of chlorophyll: What has gene cloning revealed? Trends Plant Sci. 2000, 5, 426–431. [Google Scholar] [CrossRef]
- Christ, B.; Hörtensteiner, S. Mechanism and significance of chlorophyll breakdown. J. Plant Growth Regul. 2014, 33, 4–20. [Google Scholar] [CrossRef]
- Shimoda, Y.; Ito, H.; Tanaka, A. Arabidopsis STAY-GREEN, Mendel’s Green Cotyledon Gene, Encodes Magnesium-Dechelatase. Plant Cell 2016, 28, 2147–2160. [Google Scholar] [CrossRef]
- Suzuki, Y.; Doi, M.; Shioi, Y. Two enzymatic reaction pathways in the formation of pyropheophorbide a. Photosynth. Res. 2002, 74, 225. [Google Scholar] [CrossRef]
- Hortensteiner, S.; Vicentini, F.; Matile, P. Chlorophyll breakdown in senescent cotyledons of rape, Brassica napus L.: Enzymatic cleavage of phaeophorbide a in vitro. New Phytol. 1995, 129, 237–246. [Google Scholar] [CrossRef]
- Hortensteiner, S.; Krautler, B. Chlorophyll breakdown in higher plants. Biochim. Biophys. Acta 2011, 1807, 977–988. [Google Scholar] [CrossRef] [PubMed]
- Kuai, B.; Chen, J.; Hörtensteiner, S. The biochemistry and molecular biology of chlorophyll breakdown. J. Exp. Bot. 2017, 69, 751–767. [Google Scholar] [CrossRef] [PubMed]
- Bellafiore, S.; Barneche, F.; Peltier, G.; Rochaix, J.D. State transitions and light adaptation require chloroplast thylakoid protein kinase STN7. Nature 2005, 433, 892–895. [Google Scholar] [CrossRef] [PubMed]
- Niyogi, K.K.; Li, X.P.; Rosenberg, V.; Jung, H.S. Is PsbS the site of non-photochemical quenching in photosynthesis? J. Exp. Bot. 2004, 56, 375–382. [Google Scholar] [CrossRef]
- Paulsen, H.; Dockter, C.; Volkov, A.; Jeschke, G. Folding and pigment binding of light-harvesting chlorophyll a/b protein (LHCIIb). In The Chloroplast; Rebeiz, C.A., Benning, C., Bohnert, H.J., Daniell, H., Hoober, J.K., Lichtenthaler, H.K., Portis, A.R., Tripathy, B.C., Eds.; Springer: Dordrecht, The Netherlands, 2010; Volume 31, pp. 231–244. [Google Scholar] [CrossRef]
- Szabó, I.; Bergantino, E.; Giacometti, G.M. Light and oxygenic photosynthesis: Energy dissipation as a protection mechanism against photo-oxidation. EMBO Rep. 2005, 6, 629–634. [Google Scholar] [CrossRef]
- Espineda, C.E.; Linford, A.S.; Devine, D.; Brusslan, J.A. The AtCAO gene, encoding chlorophyll a oxygenase, is required for chlorophyll b synthesis in Arabidopsis thaliana. Proc. Natl. Acad. Sci. USA 1999, 96, 10507–10511. [Google Scholar] [CrossRef]
- Nagata, N.; Satoh, S.; Tanaka, R.; Tanaka, A. Domain structures of chlorophyllide a oxygenase of green plants and Prochlorothrix hollandica in relation to catalytic functions. Planta 2004, 218, 1019–1025. [Google Scholar] [CrossRef]
- Oster, U.; Tanaka, R.; Tanaka, A.; Rüdiger, W. Cloning and functional expression of the gene encoding the key enzyme for chlorophyll b biosynthesis (CAO) from Arabidopsis thaliana. Plant J. 2000, 21, 305–310. [Google Scholar] [CrossRef]
- Tanaka, A.; Ito, H.; Tanaka, R.; Tanaka, N.K.; Yoshida, K.; Okada, K. Chlorophyll a oxygenase (CAO) is involved in chlorophyll b formation from chlorophyll a. Proc. Natl. Acad. Sci. USA 1998, 95, 12719–12723. [Google Scholar] [CrossRef]
- Biswal, A.K.; Pattanayak, G.K.; Pandey, S.S.; Leelavathi, S.; Reddy, V.S.; Tripathy, B.C. Light intensity-dependent modulation of chlorophyll b biosynthesis and photosynthesis by overexpression of chlorophyllide a oxygenase in tobacco. Plant Physiol. 2012, 159, 433–449. [Google Scholar] [CrossRef]
- Guo, P.; Baum, M.; Grando, S.; Ceccarelli, S.; Bai, G.; Li, R.; Von-Korff, M.; Varshney, R.K.; Graner, A.; Valkoun, J. Differentially expressed genes between drought-tolerant and drought-sensitive barley genotypes in response to drought stress during the reproductive stage. J. Exp. Bot. 2009, 60, 3531–3544. [Google Scholar] [CrossRef] [PubMed]
- Hazen, S.P.; Pathan, M.S.; Sanchez, A.; Baxter, I.; Dunn, M.; Estes, B.; Chang, H.S.; Zhu, T.; Kreps, J.A.; Nguyen, H.T. Expression profiling of rice segregating for drought tolerance QTLs using a rice genome array. Funct. Integr. Genom. 2005, 5, 104–116. [Google Scholar] [CrossRef] [PubMed]
- Manickavelu, A.; Kawaura, K.; Oishi, K.; Shin-I, T.; Kohara, Y.; Yahiaoui, N.; Keller, B.; Suzuki, A.; Yano, K.; Ogihara, Y. Comparative gene expression analysis of susceptible and resistant near-isogenic lines in common wheat infected by Puccinia triticina. DNA Res. 2010, 17, 211–222. [Google Scholar] [CrossRef] [PubMed]
- Seki, M.; Narusaka, M.; Ishida, J.; Nanjo, T.; Fujita, M.; Oono, Y.; Kamiya, A.; Nakajima, M.; Enju, A.; Sakurai, T. Monitoring the expression profiles of 7000 Arabidopsis genes under drought, cold and high-salinity stresses using a full-length cDNA microarray. Plant J. 2002, 31, 279–292. [Google Scholar] [CrossRef] [PubMed]
- Jiang, H.; Li, M.; Liang, N.; Yan, H.; Wei, Y.; Xu, X.; Liu, J.; Xu, Z.; Chen, F.; Wu, G. Molecular cloning and function analysis of the stay green gene in rice. Plant J. 2007, 52, 197–209. [Google Scholar] [CrossRef] [PubMed]
- Hörtensteiner, S. Chlorophyll degradation during senescence. Annu. Rev. Plant Biol. 2006, 57, 55–77. [Google Scholar] [CrossRef]
- Sugishima, M.; Kitamori, Y.; Noguchi, M.; Kohchi, T.; Fukuyama, K. Crystal structure of red chlorophyll catabolite reductase: Enlargement of the ferredoxin-dependent bilin reductase family. J. Mol. Biol. 2009, 389, 376–387. [Google Scholar] [CrossRef]
- Mach, J.M.; Castillo, A.R.; Hoogstraten, R.; Greenberg, J.T. The Arabidopsis-accelerated cell death gene ACD2 encodes red chlorophyll catabolite reductase and suppresses the spread of disease symptoms. Proc. Natl. Acad. Sci. USA 2001, 98, 771–776. [Google Scholar] [CrossRef]
- Pruzinska, A.; Anders, I.; Aubry, S.; Schenk, N.; Tapernoux-Luthi, E.; Muller, T.; Krautler, B.; Hortensteiner, S. In vivo participation of red chlorophyll catabolite reductase in chlorophyll breakdown. Plant Cell 2007, 19, 369–387. [Google Scholar] [CrossRef]
- Cheng, Y.; Dong, Y.; Yan, H.; Ge, W.; Shen, C.; Guan, J.; Liu, L.; Zhang, Y. Effects of 1-MCP on chlorophyll degradation pathway-associated genes expression and chloroplast ultrastructure during the peel yellowing of Chinese pear fruits in storage. Food Chem. 2012, 135, 415–422. [Google Scholar] [CrossRef]
- Tang, Y.; Li, M.; Chen, Y.; Wu, P.; Wu, G.; Jiang, H. Knockdown of OsPAO and OsRCCR1 cause different plant death phenotypes in rice. J. Plant Physiol. 2011, 168, 1952–1959. [Google Scholar] [CrossRef] [PubMed]
- Yao, N.; Greenberg, J.T. Arabidopsis ACCELERATED CELL DEATH2 modulates programmed cell death. Plant Cell 2006, 18, 397–411. [Google Scholar] [CrossRef] [PubMed]
- Zhang, X.; Zhang, Z.; Li, J.; Wu, L.; Guo, J.; Ouyang, L.; Xia, Y.; Huang, X.; Pang, X. Correlation of leaf senescence and gene expression/activities of chlorophyll degradation enzymes in harvested Chinese flowering cabbage (Brassica rapa var. parachinensis). J. Plant Physiol. 2011, 168, 2081–2087. [Google Scholar] [CrossRef] [PubMed]
- Kumari, M.; Pudake, R.; Singh, V.; Joshi, A.K. Association of staygreen trait with canopy temperature depression and yield traits under terminal heat stress in wheat (Triticum aestivum L.). Euphytica 2013, 190, 87–97. [Google Scholar] [CrossRef]
- Reynolds, M.P.; Gutiérrez-Rodríguez, M.; Larqué-Saavedra, A. Photosynthesis of wheat in a warm, irrigated environment: I: Genetic diversity and crop productivity. Field Crops Res. 2000, 66, 37–50. [Google Scholar] [CrossRef]
- Pask, A.; Pietragalla, J.; Mullan, D.; Reynolds, M. Physiological Breeding II: A Field Guide to Wheat Phenotyping; Cimmyt: Mexico City, Mexico, 2012. [Google Scholar]
- Tamura, K.; Stecher, G.; Peterson, D.; Filipski, A.; Kumar, S. MEGA6: Molecular evolutionary genetics analysis version 6.0. Mol. Biol. Evol. 2013, 30, 2725–2729. [Google Scholar] [CrossRef]
- Nei, M.; Kumar, S. Molecular Evolution and Phylogenetics; Oxford University Press: Oxford, UK, 2000. [Google Scholar]
- Buchner, P.; Tausz, M.; Ford, R.; Leo, A.; Fitzgerald, G.J.; Hawkesford, M.J.; Tausz-Posch, S. Expression patterns of C-and N-metabolism related genes in wheat are changed during senescence under elevated CO2 in dry-land agriculture. Plant Sci. 2015, 236, 239–249. [Google Scholar] [CrossRef]
- Livak, K.J.; Schmittgen, T.D. Analysis of relative gene expression data using real-time quantitative PCR and the 2−ΔΔCT method. Methods 2001, 25, 402–408. [Google Scholar] [CrossRef]
- Miles, T.; Liffey, K. Global temperatures on track for 3–5 degree rise by 2100: UN; Reuters: Geneva, Switzerland, 2018; Available online: https://www.reuters.com/article/us-climate-change-un/global-temperatures-on-track-for-3-5-degree-rise-by-2100-u-n-idUSKCN1NY186 (accessed on 29 November 2018).
- Farooq, M.; Bramley, H.; Palta, J.A.; Siddique, K.H. Heat stress in wheat during reproductive and grain-filling phases. Crit. Rev. Plant Sci. 2011, 30, 491–507. [Google Scholar] [CrossRef]
- Christopher, M.; Chenu, K.; Jennings, R.; Fletcher, S.; Butler, D.; Borrell, A.; Christopher, J. QTL for stay-green traits in wheat in well-watered and water-limited environments. Field Crops Res. 2018, 217, 32–44. [Google Scholar] [CrossRef]
- Lopes, M.S.; Reynolds, M.P. Stay-green in spring wheat can be determined by spectral reflectance measurements (normalized difference vegetation index) independently from phenology. J. Exp. Bot. 2012, 63, 3789–3798. [Google Scholar] [CrossRef] [PubMed]
- Harris, K.; Subudhi, P.; Borrell, A.; Jordan, D.; Rosenow, D.; Nguyen, H.; Klein, P.; Klein, R.; Mullet, J. Sorghum stay-green QTL individually reduce post-flowering drought-induced leaf senescence. J. Exp. Bot. 2006, 58, 327–338. [Google Scholar] [CrossRef] [PubMed]
- Kumar, U.; Joshi, A.K.; Kumari, M.; Paliwal, R.; Kumar, S.; Röder, M.S. Identification of QTLs for stay green trait in wheat (Triticum aestivum L.) in the ‘Chirya 3’בSonalika’population. Euphytica 2010, 174, 437–445. [Google Scholar] [CrossRef]
- Mohammadi, V.; Qannadha, M.; Zali, A.; Yazdi-Samadi, B. Effect of post anthesis heat stress on head traits of wheat. Int. J. Agric. Biol. 2004, 6, 42–44. [Google Scholar]
- Shah, N.H.; Paulsen, G.M. Injury to photosynthesis and productivity from interaction between high temperature and drought during maturation of wheat. Asian J. Plant Sci. 2005, 4, 67–74. [Google Scholar] [CrossRef]
- Viswanathan, C.; Khanna-Chopra, R. Effect of heat stress on grain growth, starch synthesis and protein synthesis in grains of wheat (Triticum aestivum L.) varieties differing in grain weight stability. J. Agron. Crop Sci. 2001, 186, 1–7. [Google Scholar] [CrossRef]
- Christopher, J.T.; Manschadi, A.M.; Hammer, G.L.; Borrell, A.K. Stay-green wheat for Australia’s changing, dry environment. In Proceedings of the 11th International Wheat Genetics Symposium, Brisbane, Australia, 24–29 August 2018; Volume 1, p. 119. [Google Scholar]
- Mueller, A.H.; Dockter, C.; Gough, S.P.; Lundqvist, U.; von Wettstein, D.; Hansson, M. Characterization of mutations in barley fch2 encoding chlorophyllide a oxygenase. Plant Cell Physiol. 2012, 53, 1232–1246. [Google Scholar] [CrossRef]
- Xiao, H.J.; Jin, J.H.; Chai, W.G.; Gong, Z.H. Cloning and expression analysis of pepper chlorophyll catabolite reductase gene CaRCCR. Genet. Mol. Res. 2015, 14, 368–379. [Google Scholar] [CrossRef]
- Park, S.Y.; Yu, J.W.; Park, J.S.; Li, J.; Yoo, S.C.; Lee, N.Y.; Lee, S.K.; Jeong, S.W.; Seo, H.S.; Koh, H.J.; et al. The senescence-induced staygreen protein regulates chlorophyll degradation. Plant Cell 2007, 19, 1649–1664. [Google Scholar] [CrossRef]
- Kusaba, M.; Ito, H.; Morita, R.; Iida, S.; Sato, Y.; Fujimoto, M.; Kawasaki, S.; Tanaka, R.; Hirochika, H.; Nishimura, M. Rice NON-YELLOW COLORING1 is involved in light-harvesting complex II and grana degradation during leaf senescence. Plant Cell 2007, 19, 1362–1375. [Google Scholar] [CrossRef]
- Tanaka, R.; Koshino, Y.; Sawa, S.; Ishiguro, S.; Okada, K.; Tanaka, A. Overexpression of chlorophyllide a oxygenase (CAO) enlarges the antenna size of photosystem II in Arabidopsis thaliana. Plant J. 2001, 26, 365–373. [Google Scholar] [CrossRef]
- Yang, Y.; Xu, J.; Huang, L.; Leng, Y.; Dai, L.; Rao, Y.; Chen, L.; Wang, Y.; Tu, Z.; Hu, J.; et al. PGL, encoding chlorophyllide a oxygenase 1, impacts leaf senescence and indirectly affects grain yield and quality in rice. J. Exp. Bot. 2016, 67, 1297–1310. [Google Scholar] [CrossRef]
- Wang, X.; Cai, J.; Jiang, D.; Liu, F.; Dai, T.; Cao, W. Pre-anthesis high-temperature acclimation alleviates damage to the flag leaf caused by post-anthesis heat stress in wheat. J. Plant Physiol. 2011, 168, 585–593. [Google Scholar] [CrossRef] [PubMed]
- Fan, Y.; Tian, Z.; Yan, Y.; Hu, C.; Abid, M.; Jiang, D.; Ma, C.; Huang, Z.; Dai, T. Winter Night-Warming Improves Post-anthesis Physiological Activities and Sink Strength in Relation to Grain Filling in Winter Wheat (Triticum aestivum L.). Front. Plant Sci. 2017, 8, 992. [Google Scholar] [CrossRef] [PubMed]
- Sakuraba, Y.; Park, S.Y.; Paek, N.C. The divergent roles of STAYGREEN (SGR) homologs in chlorophyll degradation. Mol. Cells 2015, 38, 390–395. [Google Scholar] [CrossRef] [PubMed]


| Gene | Plant | Triticum aestivum | Brachypodium distachyon | Hordeum vulgare | Oryza sativa | Sorghum bicolor | Zea mays | ||||||
|---|---|---|---|---|---|---|---|---|---|---|---|---|---|
| cDNA | Protein | cDNA | Protein | cDNA | Protein | cDNA | Protein | cDNA | Protein | cDNA | Protein | ||
| CaO | Triticum aestivum | 100 | 100 | 89.53 | 94.73 | 96.98 | 99.45 | 82.24 | 86.85 | 81.67 | 85.4 | 81.3 | 85.03 |
| Brachypodium distachyon | 89.53 | 94.73 | 100 | 100 | 89.66 | 94.55 | 84.65 | 88.15 | 82.35 | 87.06 | 81.92 | 86.32 | |
| Hordeum vulgare | 96.98 | 99.45 | 89.66 | 94.55 | 100 | 100 | 82.31 | 87.04 | 81.55 | 85.58 | 81.06 | 85.21 | |
| Oryza sativa | 82.24 | 86.85 | 84.65 | 88.15 | 82.31 | 87.04 | 100 | 100 | 84.98 | 90.74 | 84.31 | 90.74 | |
| Sorghum bicolor | 81.67 | 85.4 | 82.35 | 87.06 | 81.55 | 85.58 | 84.98 | 90.74 | 100 | 100 | 93.49 | 95.57 | |
| Zea mays | 81.3 | 85.03 | 81.92 | 86.32 | 81.06 | 85.21 | 84.31 | 90.74 | 93.49 | 95.57 | 100 | 100 | |
| Cab | Triticum aestivum | 100 | 100 | 92.04 | 95.82 | 94.88 | 98.87 | 90.18 | 90.15 | 91.81 | 91.29 | 90.93 | 91.67 |
| Brachypodium distachyon | 92.04 | 95.82 | 100 | 100 | 91.16 | 96.2 | 86.51 | 91.19 | 88.04 | 91.95 | 87.28 | 91.95 | |
| Hordeum vulgare | 94.88 | 98.87 | 91.16 | 96.2 | 100 | 100 | 87.3 | 90.53 | 89.56 | 91.67 | 87.92 | 92.05 | |
| Oryza sativa | 90.18 | 90.15 | 86.51 | 91.19 | 87.3 | 90.53 | 100 | 100 | 90.15 | 92.83 | 89.14 | 92.08 | |
| Sorghum bicolor | 91.81 | 91.29 | 88.04 | 91.95 | 89.56 | 91.67 | 90.15 | 92.83 | 100 | 100 | 95.61 | 98.49 | |
| Zea mays | 90.93 | 91.67 | 87.28 | 91.95 | 87.92 | 92.05 | 89.14 | 92.08 | 95.61 | 98.49 | 100 | 100 | |
| SGR | Triticum aestivum | 100 | 100 | 82.21 | 76.43 | 94.55 | 93.07 | 80.54 | 77.69 | 77.96 | 74.62 | 79.49 | 73.83 |
| Brachypodium distachyon | 82.21 | 76.43 | 100 | 100 | 83.21 | 77.42 | 80.58 | 77.82 | 76 | 75 | 77.72 | 76.52 | |
| Hordeum vulgare | 94.55 | 93.07 | 83.21 | 77.42 | 100 | 100 | 81.68 | 77.01 | 78.47 | 73.31 | 79.1 | 72.41 | |
| Oryza sativa | 80.54 | 77.69 | 80.58 | 77.82 | 81.68 | 77.01 | 100 | 100 | 80.1 | 77.44 | 78.97 | 75.29 | |
| Sorghum bicolor | 77.96 | 74.62 | 76 | 75 | 78.47 | 73.31 | 80.1 | 77.44 | 100 | 100 | 87.61 | 82.97 | |
| Zea mays | 79.49 | 73.83 | 77.72 | 76.52 | 79.1 | 72.41 | 78.97 | 75.29 | 87.61 | 82.97 | 100 | 100 | |
| RCCR | Triticum aestivum | 100 | 100 | 79.61 | 73.93 | 91.75 | 92.68 | 79.9 | 79.92 | 73.29 | 69.6 | 72.71 | 67.38 |
| Brachypodium distachyon | 79.61 | 73.93 | 100 | 100 | 80.23 | 77.83 | 78.3 | 76.19 | 74.64 | 69.44 | 73.31 | 68.83 | |
| Hordeum vulgare | 91.75 | 92.68 | 80.23 | 77.83 | 100 | 100 | 79.45 | 79.51 | 75.73 | 73.17 | 74.92 | 73.66 | |
| Oryza sativa | 79.9 | 79.92 | 78.3 | 76.19 | 79.45 | 79.51 | 100 | 100 | 74.32 | 74.41 | 73.67 | 73.23 | |
| Sorghum bicolor | 73.29 | 69.6 | 74.64 | 69.44 | 75.73 | 73.17 | 74.32 | 74.41 | 100 | 100 | 90.59 | 90.66 | |
| Zea mays | 72.71 | 67.38 | 73.31 | 68.83 | 74.92 | 73.66 | 73.67 | 73.23 | 90.59 | 90.66 | 100 | 100 | |
© 2020 by the authors. Licensee MDPI, Basel, Switzerland. This article is an open access article distributed under the terms and conditions of the Creative Commons Attribution (CC BY) license (http://creativecommons.org/licenses/by/4.0/).
Share and Cite
Latif, S.; Wang, L.; Khan, J.; Ali, Z.; Sehgal, S.K.; Babar, M.A.; Wang, J.; Quraishi, U.M. Deciphering the Role of Stay-Green Trait to Mitigate Terminal Heat Stress in Bread Wheat. Agronomy 2020, 10, 1001. https://doi.org/10.3390/agronomy10071001
Latif S, Wang L, Khan J, Ali Z, Sehgal SK, Babar MA, Wang J, Quraishi UM. Deciphering the Role of Stay-Green Trait to Mitigate Terminal Heat Stress in Bread Wheat. Agronomy. 2020; 10(7):1001. https://doi.org/10.3390/agronomy10071001
Chicago/Turabian StyleLatif, Sadia, Liping Wang, Jahangir Khan, Zeshan Ali, Sunish Kumar Sehgal, Md Ali Babar, Jianping Wang, and Umar Masood Quraishi. 2020. "Deciphering the Role of Stay-Green Trait to Mitigate Terminal Heat Stress in Bread Wheat" Agronomy 10, no. 7: 1001. https://doi.org/10.3390/agronomy10071001
APA StyleLatif, S., Wang, L., Khan, J., Ali, Z., Sehgal, S. K., Babar, M. A., Wang, J., & Quraishi, U. M. (2020). Deciphering the Role of Stay-Green Trait to Mitigate Terminal Heat Stress in Bread Wheat. Agronomy, 10(7), 1001. https://doi.org/10.3390/agronomy10071001