Article

Integrating Biochar and Inorganic Fertilizer Improves Productivity and Profitability of Irrigated Rice in Ghana, West Africa

1
Soil and Irrigation Research Centre, University of Ghana, P. O. Box LG 68, Kpong EL-0633-5197, Ghana
2
Department of Soil Science, University of Ghana, Legon, Accra GA-489-9979, Ghana
*
Author to whom correspondence should be addressed.
Agronomy 2020, 10(6), 904; https://doi.org/10.3390/agronomy10060904
Submission received: 27 April 2020 / Revised: 22 June 2020 / Accepted: 23 June 2020 / Published: 25 June 2020

Abstract

:
The efficiency of mineral fertilizer use in most soils in Sub-saharan Africa is low. Prominent among the reasons for this is low soil carbon stock. In this study, we hypothesized that in the short term, combined use of biochar and inorganic fertilizer in irrigated rice (Oryza sativa var KRC Baika) cropping systems will increase soil organic carbon storage, N recovery and agronomic efficiency of N use (above world average of 55% and 20 kg grain·kg−1·N respectively) and improved economic returns compared to the sole use of inorganic fertilizer. A two-year (4‒cropping cycles) field trial was, thus, conducted on a Vertisol. The experiments were designed as split–plot with two (0 and 10 t·ha−1) biochar and four (0, 45, 90, 120 kg·ha−1·N) nitrogen application rates. Additionally, the effect of biochar on the chemical properties of the soil was investigated using standard protocols. Biochar application improved the soil organic carbon storage in the topsoil. There were significant interactions between the application of biochar and nitrogen fertilizer on yield parameters. Introducing biochar significantly increased root volume and nutrient (N, P and K) uptake, resulting in increased grain and straw yield. Grain yields under biochar amended plots were higher than sole fertilizer amended plots in 14 out of 16 instances (cropping cycles × N rates). The increase in grain yield was between 12 to 29% across N rates. Biochar amendment also enhanced agronomic N use and apparent N recovery efficiencies in 3 out of the 4 cropping cycles. Gross margin indicated that biochar application under irrigated rice cropping systems is economically feasible in all cropping cycles and N rates. However, the value cost ratio of biochar application was higher than for sole inorganic fertilizer in three out of the four cropping cycles (each cropping cycle has three N rates). The soil organic carbon storage of biochar amended soil increased by 17% under unfertilized condition and by 32% under fertilized condition. To enable the promotion and efficient use of the biochar technology in enhancing productivity and profitability in irrigated rice, extension officers and farmers will need to be trained on how to char the rice husk to reduce emissions prior to upscaling the technology to farmers.

1. Introduction

Low soil organic carbon and water constraints are two major limitations to crop productivity in the tropics. For irrigated rice systems, though the problem of water constraint is non-existent, farmers still need to apply adequate quantities of fertilizers in order to obtain appreciable yields. However, because the cost of fertilizers is high, [1,2] application rates are low. Data by [3] show that on the average, fertilizer (NPK) application in Sub–Saharan Africa is about 10 kg·ha–1, which is far below the rate applied in many developed countries. The challenge of low application is aggravated by the low uptake of applied nutrients, culminating in low nutrient use efficiency [4]. This phenomenon is attributed to low soil organic carbon storage [5]. Thus, the remedy for low soil productivity in the tropics is through integrated soil fertility management [4,6,7]. The application of organic matter to soils helps to improve overall soil fertility and, hence, productivity [8], via improved soil structure as well as water and nutrient holding capacity [9], leading to increased crop yields.
Attempts at improving upon the physical properties of the soils by incorporating organic matter have not been successful because of inadequate quantities of organic materials required. Additionally, the prevailing high temperatures in the tropics promote fast decomposition and hence the effect of organic matter addition is short lived. Any material that could be added to the soil to improve the physical properties must be readily available in the locality and persist in the soil for a long time [10]. Under flooded rice conditions, addition of easily decomposable organic materials may pose environmental risk since the materials would decompose to release primarily the greenhouse gas methane [11,12]. Therefore, the direct application of fresh organic residues to augment the productivity of wetland rice systems may not be advisable.
Biochar is a porous carbonaceous solid produced by thermo-chemical conversion of organic materials in an oxygen depleted environment [13,14]. Traditionally, biochar production involves the use of wood, thus, resulting in the destruction of tree plantations and/or native forests [15]. Thus, its production is expensive and comes at a cost to the environment and hence to the society [15]. Rice husks abounds in rice growing areas of Ghana, but they are rarely used as organic matter because of their high C:N ratio [16]. They are treated as waste materials and disposed of aerobically through burning, causing environmental pollution. However, if these husks were anaerobically charred, they could serve as a valuable soil conditioner to improve upon the productivity of the soils. In Asia and some developed countries, rice husk and straw are pyrolyzed into biochar and added to the soil to improve upon the physical and chemical properties [17,18].
Recent studies have shown that biochar has a high proportion of stable carbon [14] and some nutrients such as Phosphorus [19]. The usefulness of biochar in enhancing soil productivity largely for upland crops had been proved through research [14,20,21]. Research has proved that the addition of biochar had a beneficial effect on highly weathered, infertile tropical soils because it improved the cation exchange capacity, and improved soil organic carbon as well as plant nutrient supply [19,20]. This reduced soil acidity [22] and Al toxicity [23]. It also reduced nutrient leaching, which invariably improved on fertilizer efficiency [24,25]. Studies in Ghana on acidic soils have shown that the addition of 5 t·ha−1 of rice straw biochar increased maize yields from 3.6 to 5.2 t·ha−1 [22].
Other studies have reported on the potential of using biochar to manage greenhouse gas emissions [26,27]. This notwithstanding, the results from studies conducted on the impact of rice husk biochar on the productivity of paddy soils have varied. For instance, [14] reported both positive and insignificant effects when rice husk biochar was applied in three different environments in Asia. Others [28] in their study on the short-term effect of rice straw biochar indicated that no noticeable effects were observed in grain and biomass yields. Differences in the impact of biochar have been attributed to differences in biochar feedstock type and the environment [29], among others. In Sub–Saharan Africa, studies on the use of biochar are very limited. Even on the global level, most biochar studies have been restricted to acid soils [20]. Its use on neutral to alkaline soils remains very limited [30]. Additionally, most biochar studies are conducted on upland crops with the few on rice [28], conducted either under controlled environment [30] or acidic soils on upland condition [14,28]. In this study, we use rice husk which is an agricultural waste, to produce biochar with a view of sequestering carbon and sustainably recycling waste [31]. To our knowledge, this study is the first of its kind, where biochar and N fertilizer are applied in lowland or irrigated rice cropping systems on an alkaline soil in sub-Sahara Africa. To date, very limited studies in Sub–Saharan Africa have examined the interactive effects of biochar and mineral fertilizers in improving soil organic carbon storage, the productivity and profitability of irrigated rice. Additionally, to our knowledge, literature on the economic feasibility of biochar use under rice production systems within the sub region are scanty. Thus, our study hypothesized that: in the short term, combined use of biochar and inorganic fertilizer in irrigated rice (Oryza sativa var KRC Baika) cropping systems will increase soil organic carbon storage, N recovery and agronomic efficiency of N use (above world average of 55% and 20 kg/kg) leading to improved economic returns compared to the sole use of inorganic fertilizer.

2. Materials and Methods

2.1. Experimental Site

The study was conducted at the University of Ghana, Soil and Irrigation Research Centre (SIREC), Kpong in the Eastern Region of Ghana from 2012–2014. The site, which lies in the coastal savannah agro-ecological zone of Ghana, (latitude 6°09′ N and longitude 00°04′ E) at an altitude of 22 m above mean sea level has bi–modal rainfall pattern with mean annual rainfall of 1200 mm. There are two sowing times: the sowing I from April to July and the sowing II from August to November. The mean annual temperature is 27.2 °C. The minimum and maximum annual temperatures are 22.1 °C and 33.3 °C respectively. The land is gentle sloping with a gradient between 1% and 5%. The vegetation is savanna grassland with scattered coppice shrubs and trees. The soil is clayey and is classified as a Typic Calcicustert [32], a Vertisol, deriving from garnetic—Ferrous hornblende gneiss parent material.

2.2. Biochar Production and Characterization

Rice husk is a major waste product from the rice production activity at SIREC. At the end of each cropping cycle, about 40 tons of rice husk is disposed of by burning at SIREC. For the current study, we used rice husk as a feedstock to produce biochar with a Japanese retort kiln [33] at a pyrolysis temperature range of between 336 and 394 °C (average 360 °C). An infrared thermometer with laser marker (Digi-Sense Infrared thermometer, Model 20250-05, Melrose, MA, USA) was used to measure the temperature at 10 min intervals from 5 different directions during the pyrolysis (65 min). A small fire was lit inside a perforated conical barrel with a chimney and allowed to burn for about 15 min and about 130 kg rice husk was heaped around the perforated barrel. This allows the use of the thermal energy from combustion gases to sustain the pyrolysis process. The pyrolysis advanced from the barrel to the heap. The husk is turned every 10 min until all husks are evenly charred. The charring resulted in 61% weight loss (biochar yield of 39%). The charred husk (biochar) was spread out and water sprayed and allowed to be sun dried. Further details on the kiln can be found in [14]. The biochar was ground and sieved with a 0.5 mm size sieve and was characterized. The pH of the biochar in water was measured in 1:10 w/v biochar–water extracts. Its organic carbon content was determined according to the wet combustion method according to the procedure of [34] after carbonates were destroyed through addition of HCl. Total carbon and nitrogen content were determined by dry combustion method using a NC analyzer (Model Sumigraph NC—22 Analyzer, Tokyo, Japan). Available phosphorus content of the biochar was determined according to the procedure of [35]. The cation exchange capacity (CEC) and exchangeable bases (Ca, Mg, K and Na) were determined by extraction with 1 M ammonium acetate (NH4OAc, pH 7). The Perkin Elmer Analyst 800 Atomic Absorption Spectrometer was used to determine Ca and Mg from the extract while flame photometer (Jenway Model PFP7; Essex, England, UK) was used to determine Na and K. The rice husk was also ground (Fritsch mill Pulverisette 15, Idar-Oberstein, Germany) and analyzed for the same parameters stated above. To determine bulk density, an amount of the air-dried biochar sample was carefully packed amidst intermittent tapping on the laboratory bench (to ensure good packing) into a measuring cylinder to a predetermined volume. The quantity of sample packed was then transferred into a moisture can and put in an oven to dry at 105 °C for 48 h after which its mass was recorded. The bulk density of the biochar was then calculated by dividing the dry weight by volume.

2.3. Experimental Design and Treatments

The field studies were conducted over a two–year period from (2012–2014). The first cropping cycle was from July to November 2012, the second cropping cycle span from December 2012 to March/April 2013, the third cropping cycle from July to November 2013, and the fourth cropping cycle was from December 2013-March/April 2014. Thus, there were 4 cropping cycles in all. A split plot design was used in each cropping cycle with biochar rates (0 and 10 t·ha−1 applied only at the beginning of the first cropping) as main plot treatments. Different levels of nitrogen (0, 45, 90 and 120 kg·N·ha−1) were applied in each cropping cycle as subplot treatments. The rate of biochar used was based on an earlier preliminary study to determine the appropriate quantity to apply (Figure S1).
Biochar rate at 10 t·ha−1 produced yields significantly higher than the yields at 0 and 5 t·ha−1 rate but similar to those obtained under 15 and 20 t·ha−1 (Figure S1). The biochar was spread and incorporated into a depth of 10 cm of the topsoil. The subplots were replicated three times and completely randomized in each main plot. Each subplot measured 3.5 m × 4.5 m (15.75 m2) with 1 m border space between plots. Each of the plots was banded to limit movement of water and nutrients between plots. After the biochar application, the plots were allowed to stabilize for a week after which they were flooded a day prior to rice transplanting. Rice (cv KRC Baika) was transplanted at a spacing of 20 cm × 20 cm with four seedlings and later thinned to two per stand at 10 days after transplanting. Two weeks after transplanting, half of the N rate were applied as N P K with P and K being their oxide forms (P2O5 and K2O, respectively) to each of the N treatments. The remaining of the aforementioned N rates were applied as urea top up at 5 weeks after transplanting on the respective plots. Data was collected on daily temperature (minimum and maximum) from the SIREC automatic recording weather station located about 800 m from the experiments over the four cropping cycles. During the 3rd and 4th cropping cycles, we gathered data on the number of days 50% of the crops under each treatment took from emergence to flowering and to attain physiological maturity.

2.4. Plant and Soil Sampling and Analysis

Data on plant development (duration from transplanting to flowering and maturity), root volume, final grain yield and biomass were collected during 1st and 2nd cropping cycles. At flowering, plants were sampled on an area of 0.56 m2. The plants were separated into shoots and roots, for the determination of root volume. The root volume was determined by using the water displacement method after carefully washing away the soil. At maturity, an area of 1.6 m × 1.6 m in the middle of each plot was harvested and the above ground biomass was separated into the grains and straw. Plant material (straw and grain) were dried at ≈ 70 °C to a constant weight and milled (Fritsch mill Pulverisette 15). Tissue N, P and K concentrations in the rice straw and grain were determined. Plant samples were digested in H2SO4 and subsequently steam-distilled into boric acid to determine N concentration according to a Kjeldahl-method [36] using a distillation unit (VELP Scientifica, Inc, UDK 129, New York, USA). Murphy and Riley [37] method was used to determine P from the extracts and K determined using Flame photometer (Jenway Model: PFP7). The nutrient uptake was calculated by multiplying the nutrient concentration with dry matter weight.
Soil samples were collected at three depths (0–15, 15–30, 30–45 cm) prior to the first cropping cycle and at the topsoil (0–15 cm) from each plot at the end of the 4th cropping cycle. The soils were air dried, ground and sieved (2 mm mesh size) for analysis. The pH, soil organic carbon (SOC), total N, available P, total P, CEC and exchangeable bases (Na, Ca, Mg and K) were determined as described in Section 2.2. Particle size distribution was determined using Bouyoucos Hydrometer method as modified by Day [38]. For the bulk density, undisturbed soils were collected using a core sampler with known volume. The soils were then oven dried at 105 °C for 48 h. The bulk density was then determined by dividing the mass of soil by the volume.
The soil carbon stocks (SOCst; kg·ha−1) were estimated for the top 15 cm for initial soil and the soil at the end of the 4th cropping cycle using the equation:
SOCst = A × BD × Z × SOC
where A is the land area (1 ha = 104 m2), Z is the soil depth (m), and BD is the soil bulk density (Mg/m3).

2.5. Nitrogen Use Efficiency

Agronomic Efficiency of N (AEN) was estimated as:
AEN   ( kg   grain   kg 1   N ) = G Y N G Y 0 F N
where FN is fertilizer rate, while GYN and GY0 are grain yield under fertilized condition and grain yield under control plots. The Apparent Recovery Efficiency of Nitrogen (ARE) was estimated as:
ARE   ( % ) = ( N f N 0   F N ) × 100  
Nf is total N uptake in above ground biomass under fertilized condition, N0 is N uptake under controlled condition and FN is quantity of N applied.

2.6. Economic Analysis

The economic analysis of the different treatments was assessed, based on gross margin (GM) and value cost ratio (VCR). Gross margin was defined as GM (US$ ha–1) = (Grain yield × Selling price) − Variable cost. Gross returns were defined as GR (US$ ha–1) = (Grain yield × Selling price) − (Variable + Fixed cost). The variable costs constitute cost items that result in variable yield output while the remaining cost items were treated as fixed cost (over the short term). The selling price of rice over the period were obtained from the records of Ministry of Food and Agriculture (MoFA) [39] while the variable cost (fertilizers, biochar cost and labor cost in applying fertilizer and biochar) and the fixed costs items; labor (for transplanting, herbicide, irrigation, scaring and drying) cost of renting land, ploughing, harvesting, seed, herbicides were obtained from the study site by the authors (Table 1). The value cost ratio (VCR) was calculated as:
V C R = ( G r a i n   y i e l d c o n t r o l G r a i n   y i e l d t r e a t m e n t )   ×   p r i c e   o f   g r a i n C o s t   o f   a p p l i e d   t r e a t m e n t
Given that there is currently no market for biochar, the total cost of labor in conveying the feedstock and preparing it and cost of renting the retort kiln used in preparing the biochar were used as biochar cost.

2.7. Statistical Analysis

Data was checked for normal distribution and homogeneity of variance, using Anderson-Darling and Levene’s tests respectively. AEN and ARE were log transformed to conform to normal distribution prior to further statistical analysis. Analysis of variance was carried out on the entire data set (straw yield, grain yield, percentage grain filled, nutrient uptake, AEN, ARE, GM and VCR) over the 4 cropping cycles using mixed model repeated measures analysis of variance. Data on root volume at flowering stage was for 2 cropping cycles. The fixed effects used were cropping cycle (as a repeated variable), biochar and nitrogen fertilizer and cropping cycle by treatments interactions while replicates were included as a random effect. Subsequently, due to the significant effect of the cropping cycle and its interaction with the treatments, an ANOVA was conducted for each cropping cycle to enable ease of interpretation. Tukey’s test was used for mean separation at p ≤ 0.05. To determine the effect of the biochar amendment on soil properties, a two-way ANOVA was conducted on the soil data (initial and final soil parameters). To determine the relationship between AEN or ARE and SOC and grain N uptake, a simple linear regression analysis was conducted. Analysis was conducted using Genstat 12.1 edition Statistical Software, VSN International, England, UK.

3. Results

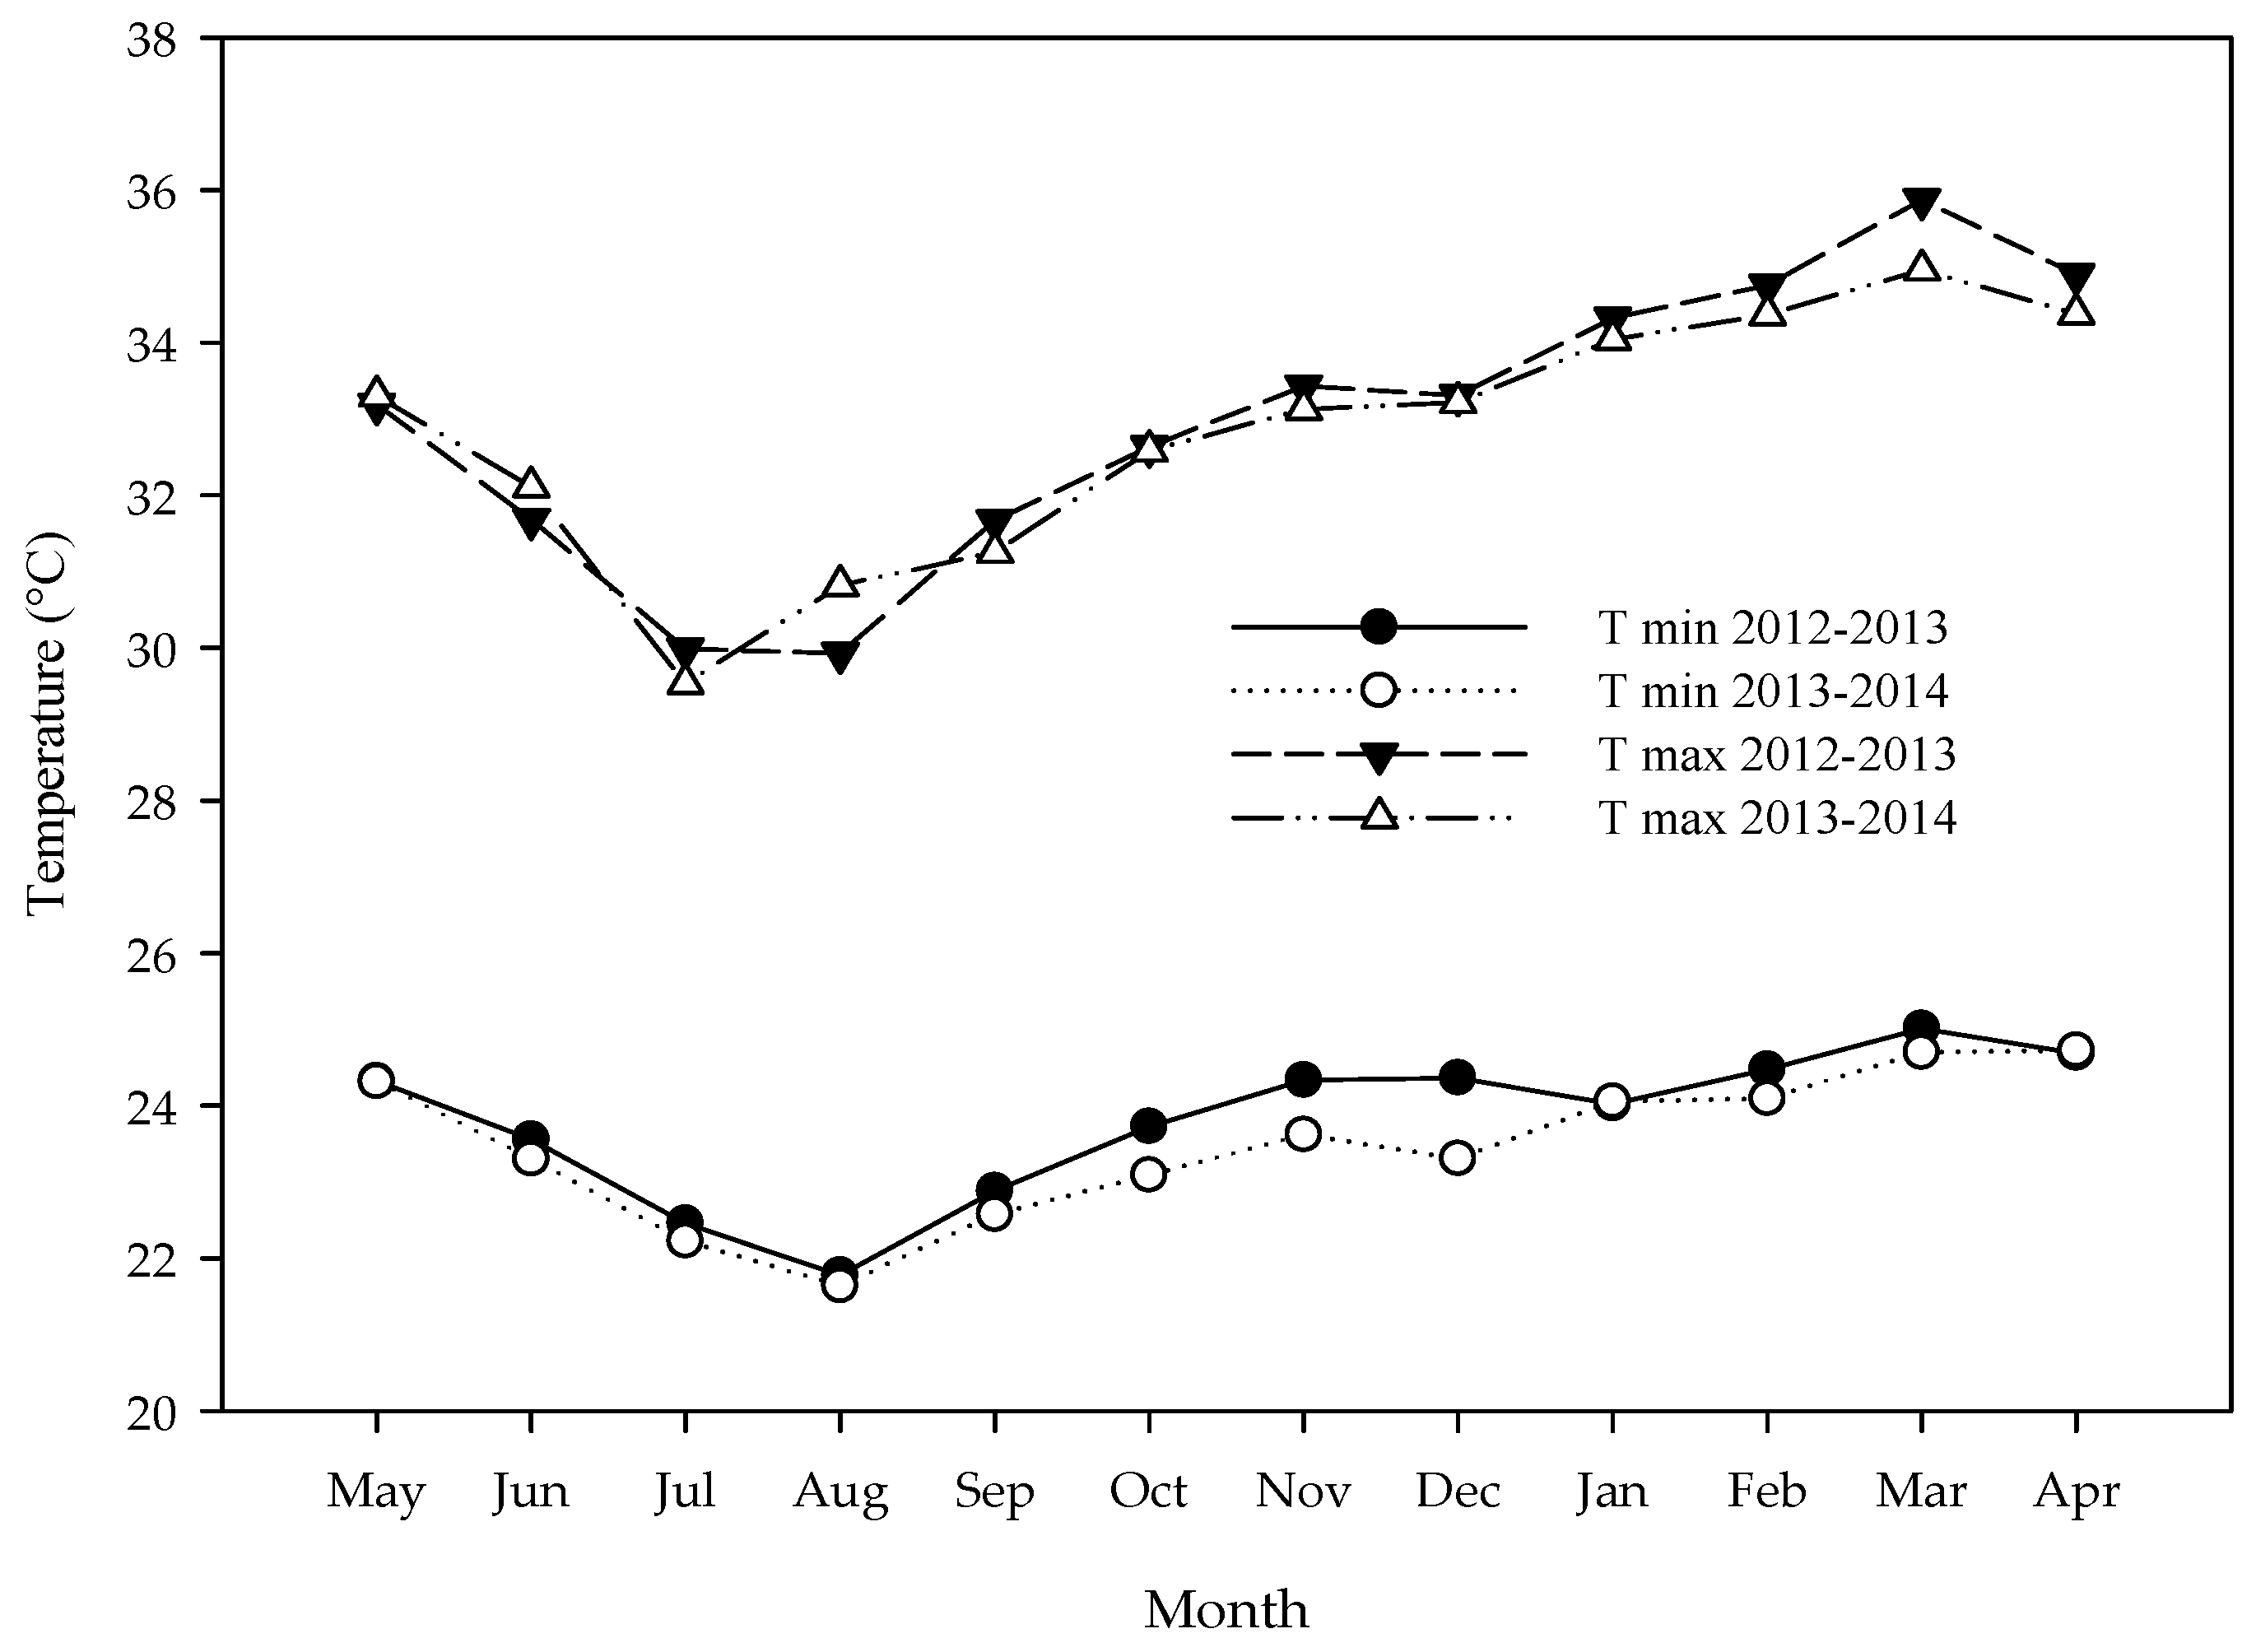
3.1. Temperatures during Cropping Cycles

The weather patterns varied with sowing time. In particular, the temperatures were lower during the 1st and 3rd cropping cycles than the 2nd and 4th cropping cycles (Figure 1). For example, the minimum temperatures over the first cropping cycle ranged from 21.8 °C in August to 24.3 °C in November while maximum temperatures ranged from 29.9 °C to 33.4 °C. During the 2nd cropping cycle, the minimum temperature was between 24 °C in January and 25 °C in March whereas maximum temperatures ranged from 33.3 °C in December to 35.9 °C in March. The trend of minimum and maximum temperatures in the 2nd and 4th cropping cycles were similar to those of the 1st and 3rd cropping cycles respectively. Thus, temperatures were generally higher in the 2nd and 4th cropping cycles than those in the 1st and 3rd cropping cycles.

3.2. Biochar and Soil Properties

3.2.1. Biochar Properties

The chemical and physical properties of the raw rice husk and biochar used for the experiment are as shown in Table 2. The rice husk biochar had a bulk density almost twice as much as the raw feedstock. The organic carbon and nitrogen contents of the biochar were low. The exchangeable bases content, however, generally increased upon charring the rice husk feedstock.

3.2.2. Soil Properties

The chemical and physical properties of the soil used for the experiment are as shown in Table 3. The soil had a high clay content of 580 g·kg−1 within the top 15 cm depth which increased by 7% at a depth of 45 cm. The sand content decreased from 298 g·kg−1 at the 15 cm depth by 17% at a depth of 45 cm. The bulk density of the soil at 45 cm depth was 20% higher than that in the plough layer (15 cm). The soil was generally near neutral in reaction with pH in H2O being close to 7.0 at both soil depths.
The organic carbon content of the soil was characteristically low and decreased in depth with the value at 45 cm depth being about 33% lower than that in the plough layer at 15 cm. Total P and available P contents were also low. The total N and P concentrations averaged 0.5 g·kg−1 and 230 mg·kg–1, respectively within 45 cm depth with average available P levels of approximately 4.1 mg·kg–1. The exchangeable calcium and magnesium contents of the soils were very high, which is characteristic of most Vertisols. The Ca and Mg contents within the 45 cm depth, accounted for between 46% and 56% and between 27 and 32%, respectively of the soil’s CEC. The cation exchange capacity of the soil was very high, and values increased with depth.

3.3. Crop Growth

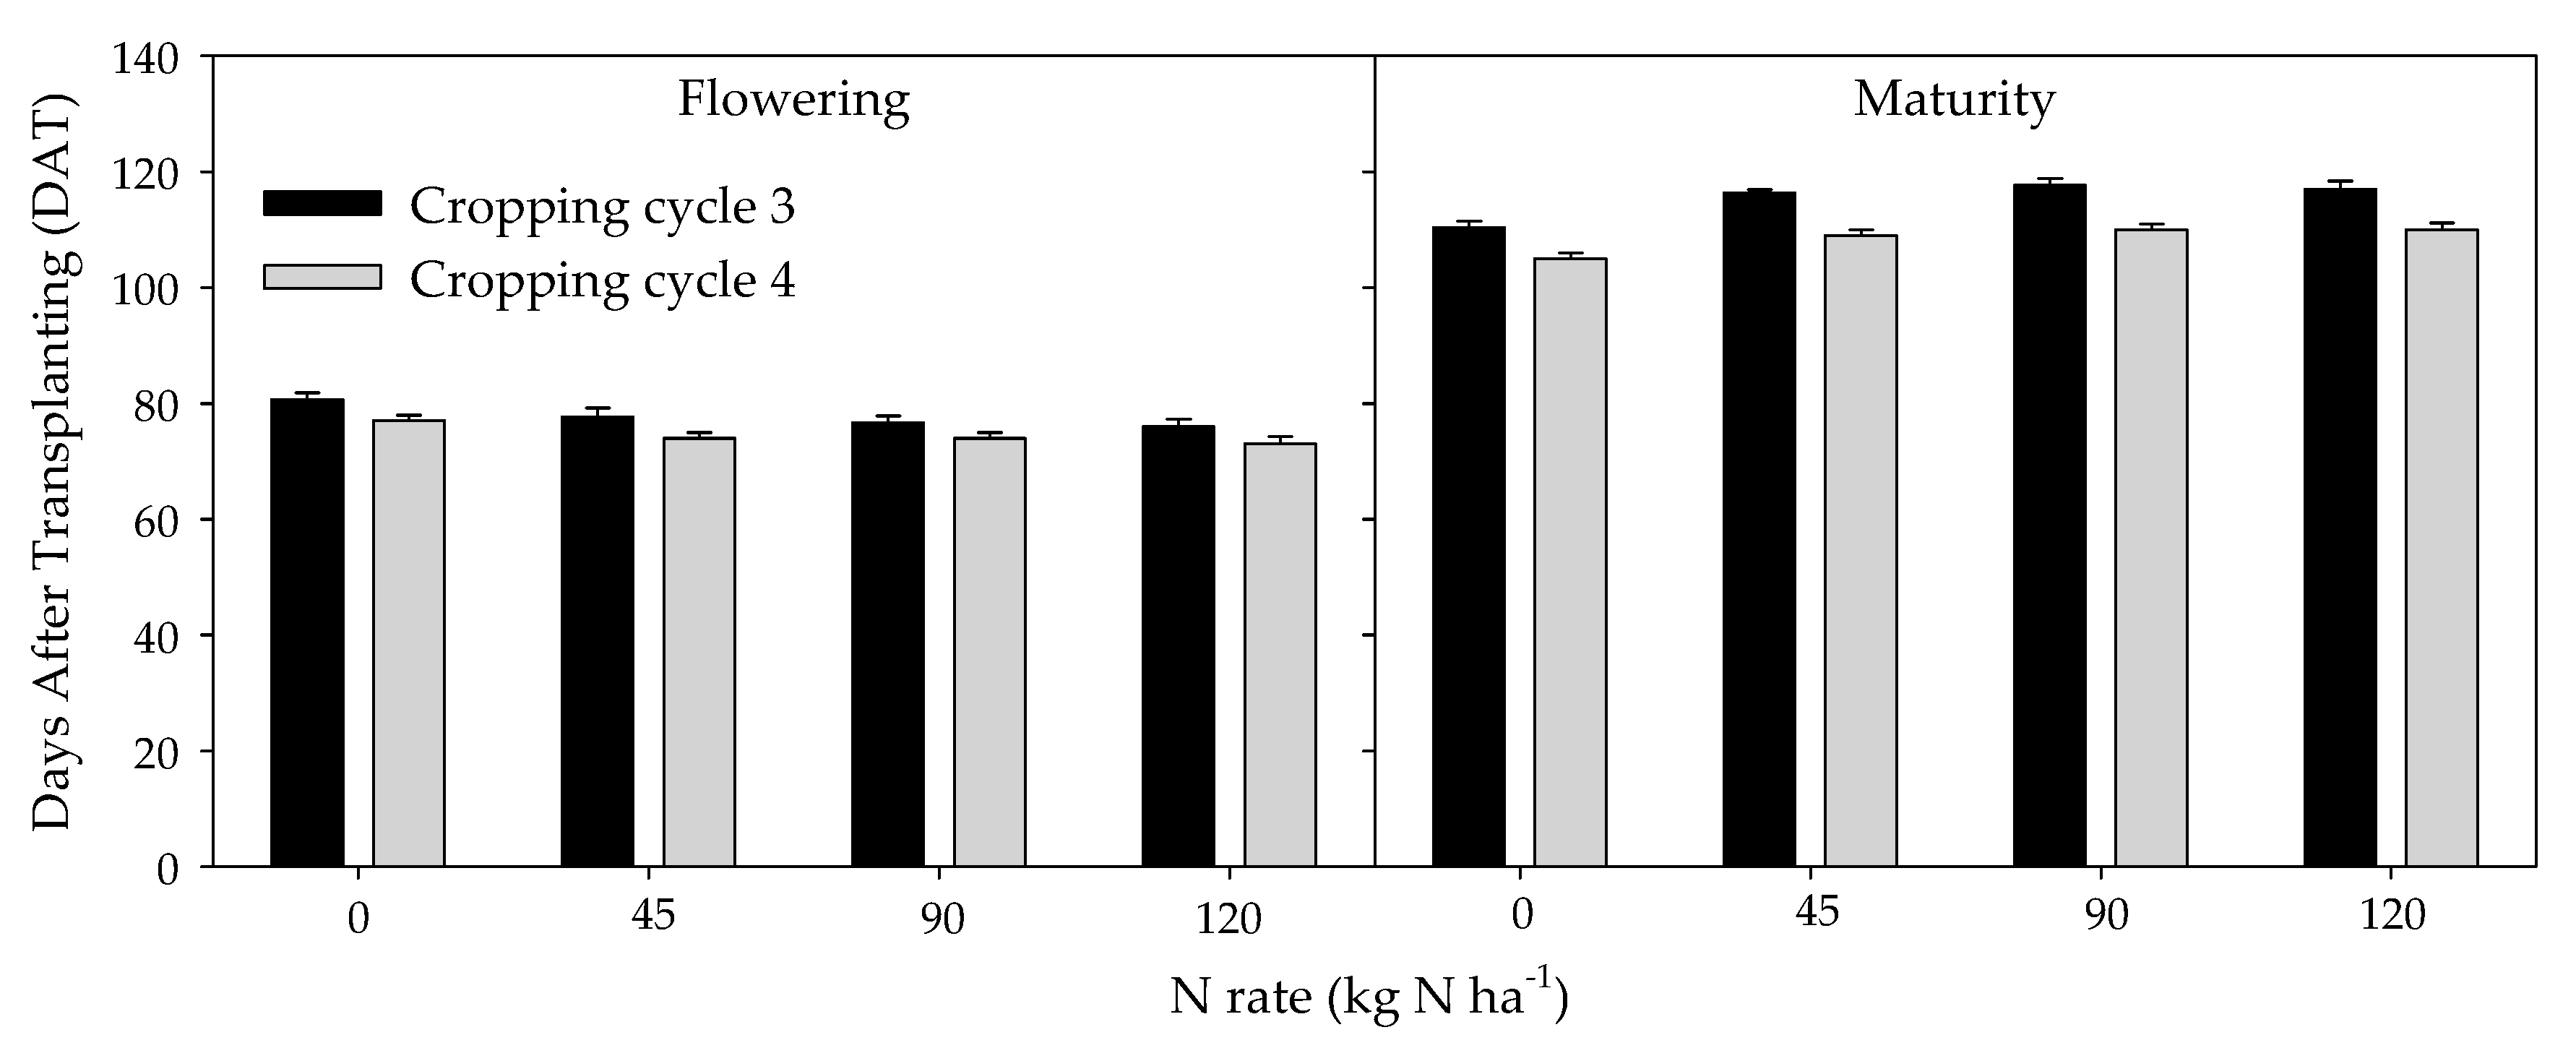
3.3.1. Crop Development

Treatments that received no fertilizer nor biochar application delayed flowering by three days compared to the fertilized plots (Figure 2). Also, the non–fertilized treatments matured on the average five days earlier than the fertilized plots. Biochar application did not affect the phenology of irrigated rice hence, only data on N effect is presented in Figure 2. Rice plants flowered at 77 days after transplanting (DAT) and matured on the 117 DAT in the 3rd cropping cycle (July to November), while in 4th cropping cycle (December to March), the average number of days to flowering and to maturity were 74 and 110 DAT, respectively.

3.3.2. Root Volume

Root growth of rice at flowering was significantly (p < 0.05) influenced by interaction among cropping cycle × biochar × nitrogen (Table 4). At the level of cropping cycle, biochar and Nitrogen fertilizer interaction positively (p < 0.05) influenced root growth. In general, the root volumes from the biochar amended plots in the 2nd cropping cycle were higher than those obtained during the 1st cropping cycle (Table 5).

3.4. Straw and Grain Yield

The results indicate significant interactive effect among cropping cycle × biochar × nitrogen on the yield of rice straw (Table 4). At the level of cropping cycle, Biochar × nitrogen interactions influenced (p ≤ 0.05) straw yields in the 1st to 3rd copping cycles (Table 6). In the 4th cropping cycle, straw yield was influenced by nitrogen fertilizer only. Generally, changes in straw yield due to the interaction between biochar and N ranged between −9 to 38%. The average straw yield increased across the nitrogen rates ranging between 4 and 13% with 2nd and 4th cropping cycles recording lower yield increases compared to those obtained in the 1st and 3rd cycles.
Grain yield was significantly influenced by the interactions between cropping cycle × biochar, cropping cycle × nitrogen and biochar × nitrogen (Table 4). As with straw yields, grain yields generally varied among cropping cycles with the 2nd and 4th cropping cycles being lower than those obtained in the 1st and 3rd cropping cycles. The average yield gains across treatments in response to nitrogen and biochar amendments compared to their respective controls were 102, 70, 104 and 67%, respectively higher for the 1st, 2nd, 3rd and 4th cropping cycles. Grain yield was also significantly influenced by nitrogen and biochar applications (Table 6) across cropping cycles. In the 1st cropping cycle, under sole nitrogen fertilization, grain yield increased between 43 and 81% compared to the control (when no fertilizer was used). When biochar was used, grain yields increased between 71 and 134% compared to the control in the 1st cropping cycle (Table 6). Applying biochar resulted in yield increases of between 16 and 29% (average 20%) across the various N rates. Similar trends in yield increases in biochar treated plots were observed in the other 3 cropping cycles with average yield increases (across N rates) ranging between 14 and 17%. Interaction between nitrogen fertilizer and biochar was only significant in the first cropping cycle.

3.5. Proportion of Grain Filled

The proportion of filled grains was influenced (p ≤ 0.05) by the interaction between cropping cycle × biochar, cropping cycle × nitrogen and biochar × nitrogen fertilizer. Considering the data at the level of cropping cycle, the proportion of filled grains varied among the cycles with average filled grains being 86, 78, 85 and 76% for the 1st to 4th cropping cycles, respectively. Nitrogen fertilizer significantly influenced the proportion of filled grains in the 1st, 2nd and 4th cropping cycles. The proportion of filled grains declined with increased fertilizer application in each cropping cycle (Table 6). The interaction between biochar and N fertilizer on filled grains was only significant in the 3rd cropping cycle. The proportion of filled grains were lower in the 2nd and 4th cropping cycles by an average of 10% compared to those obtained in the 1st and 3rd cropping cycles.

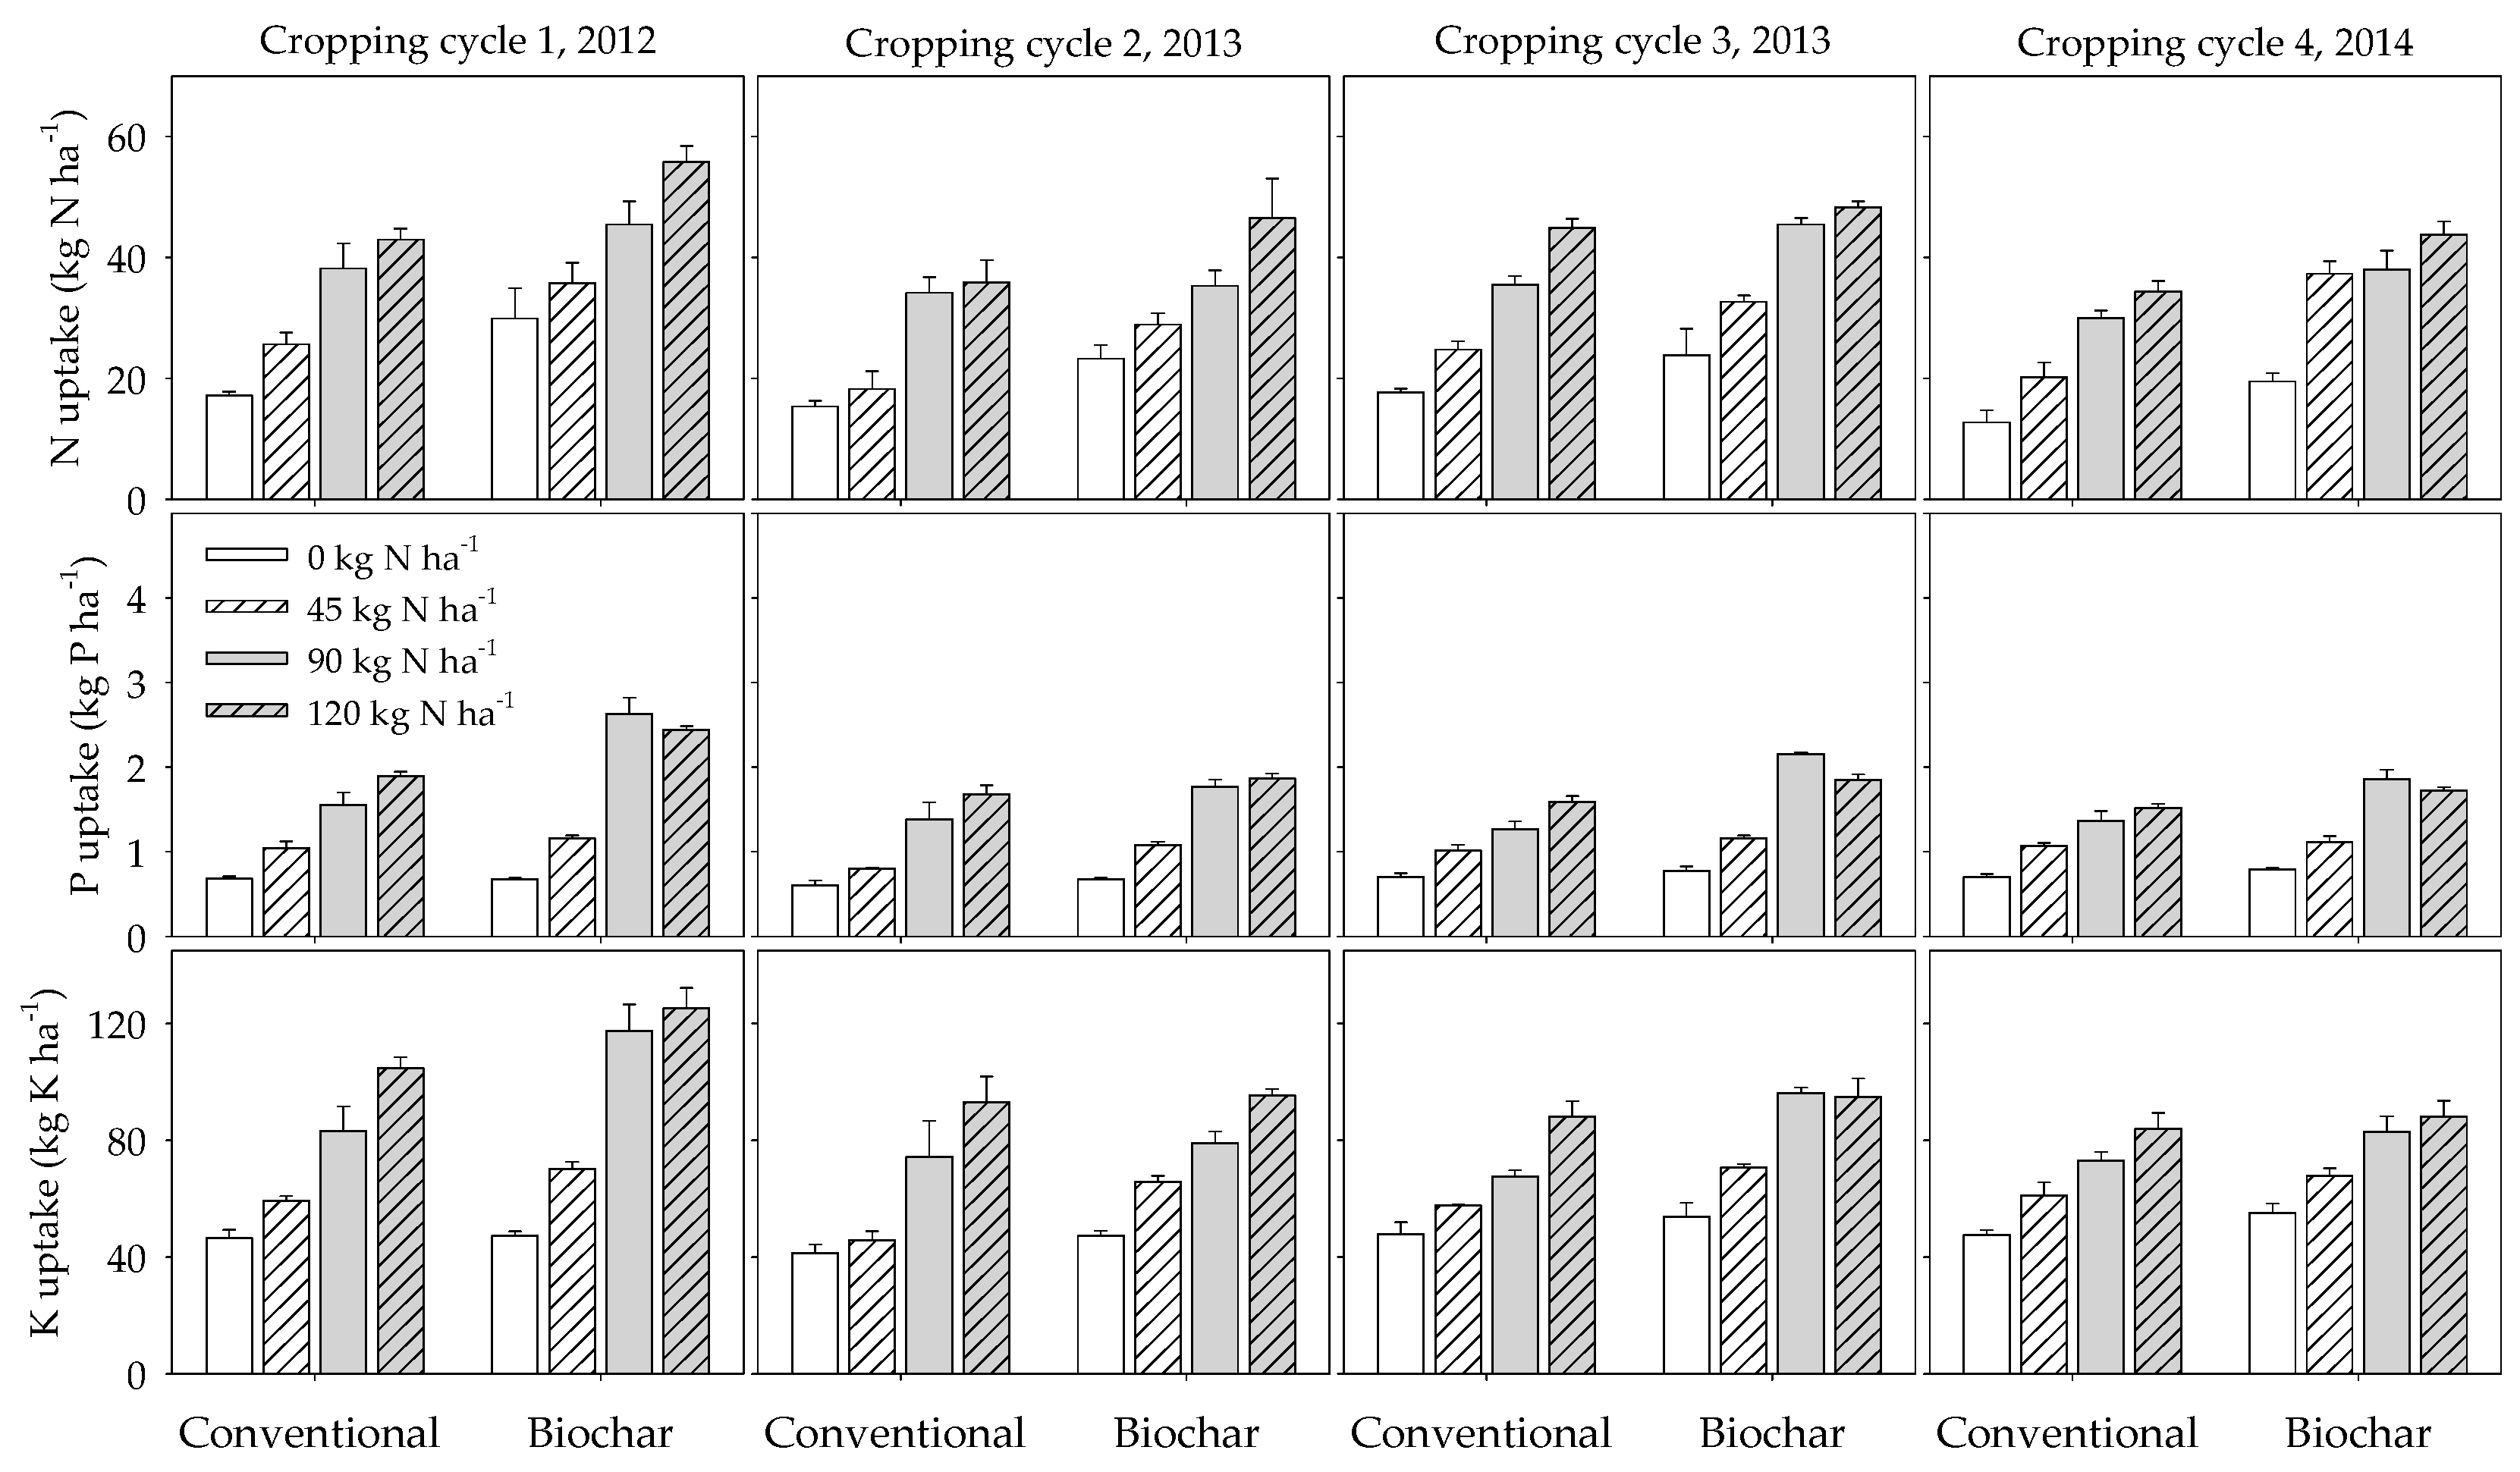
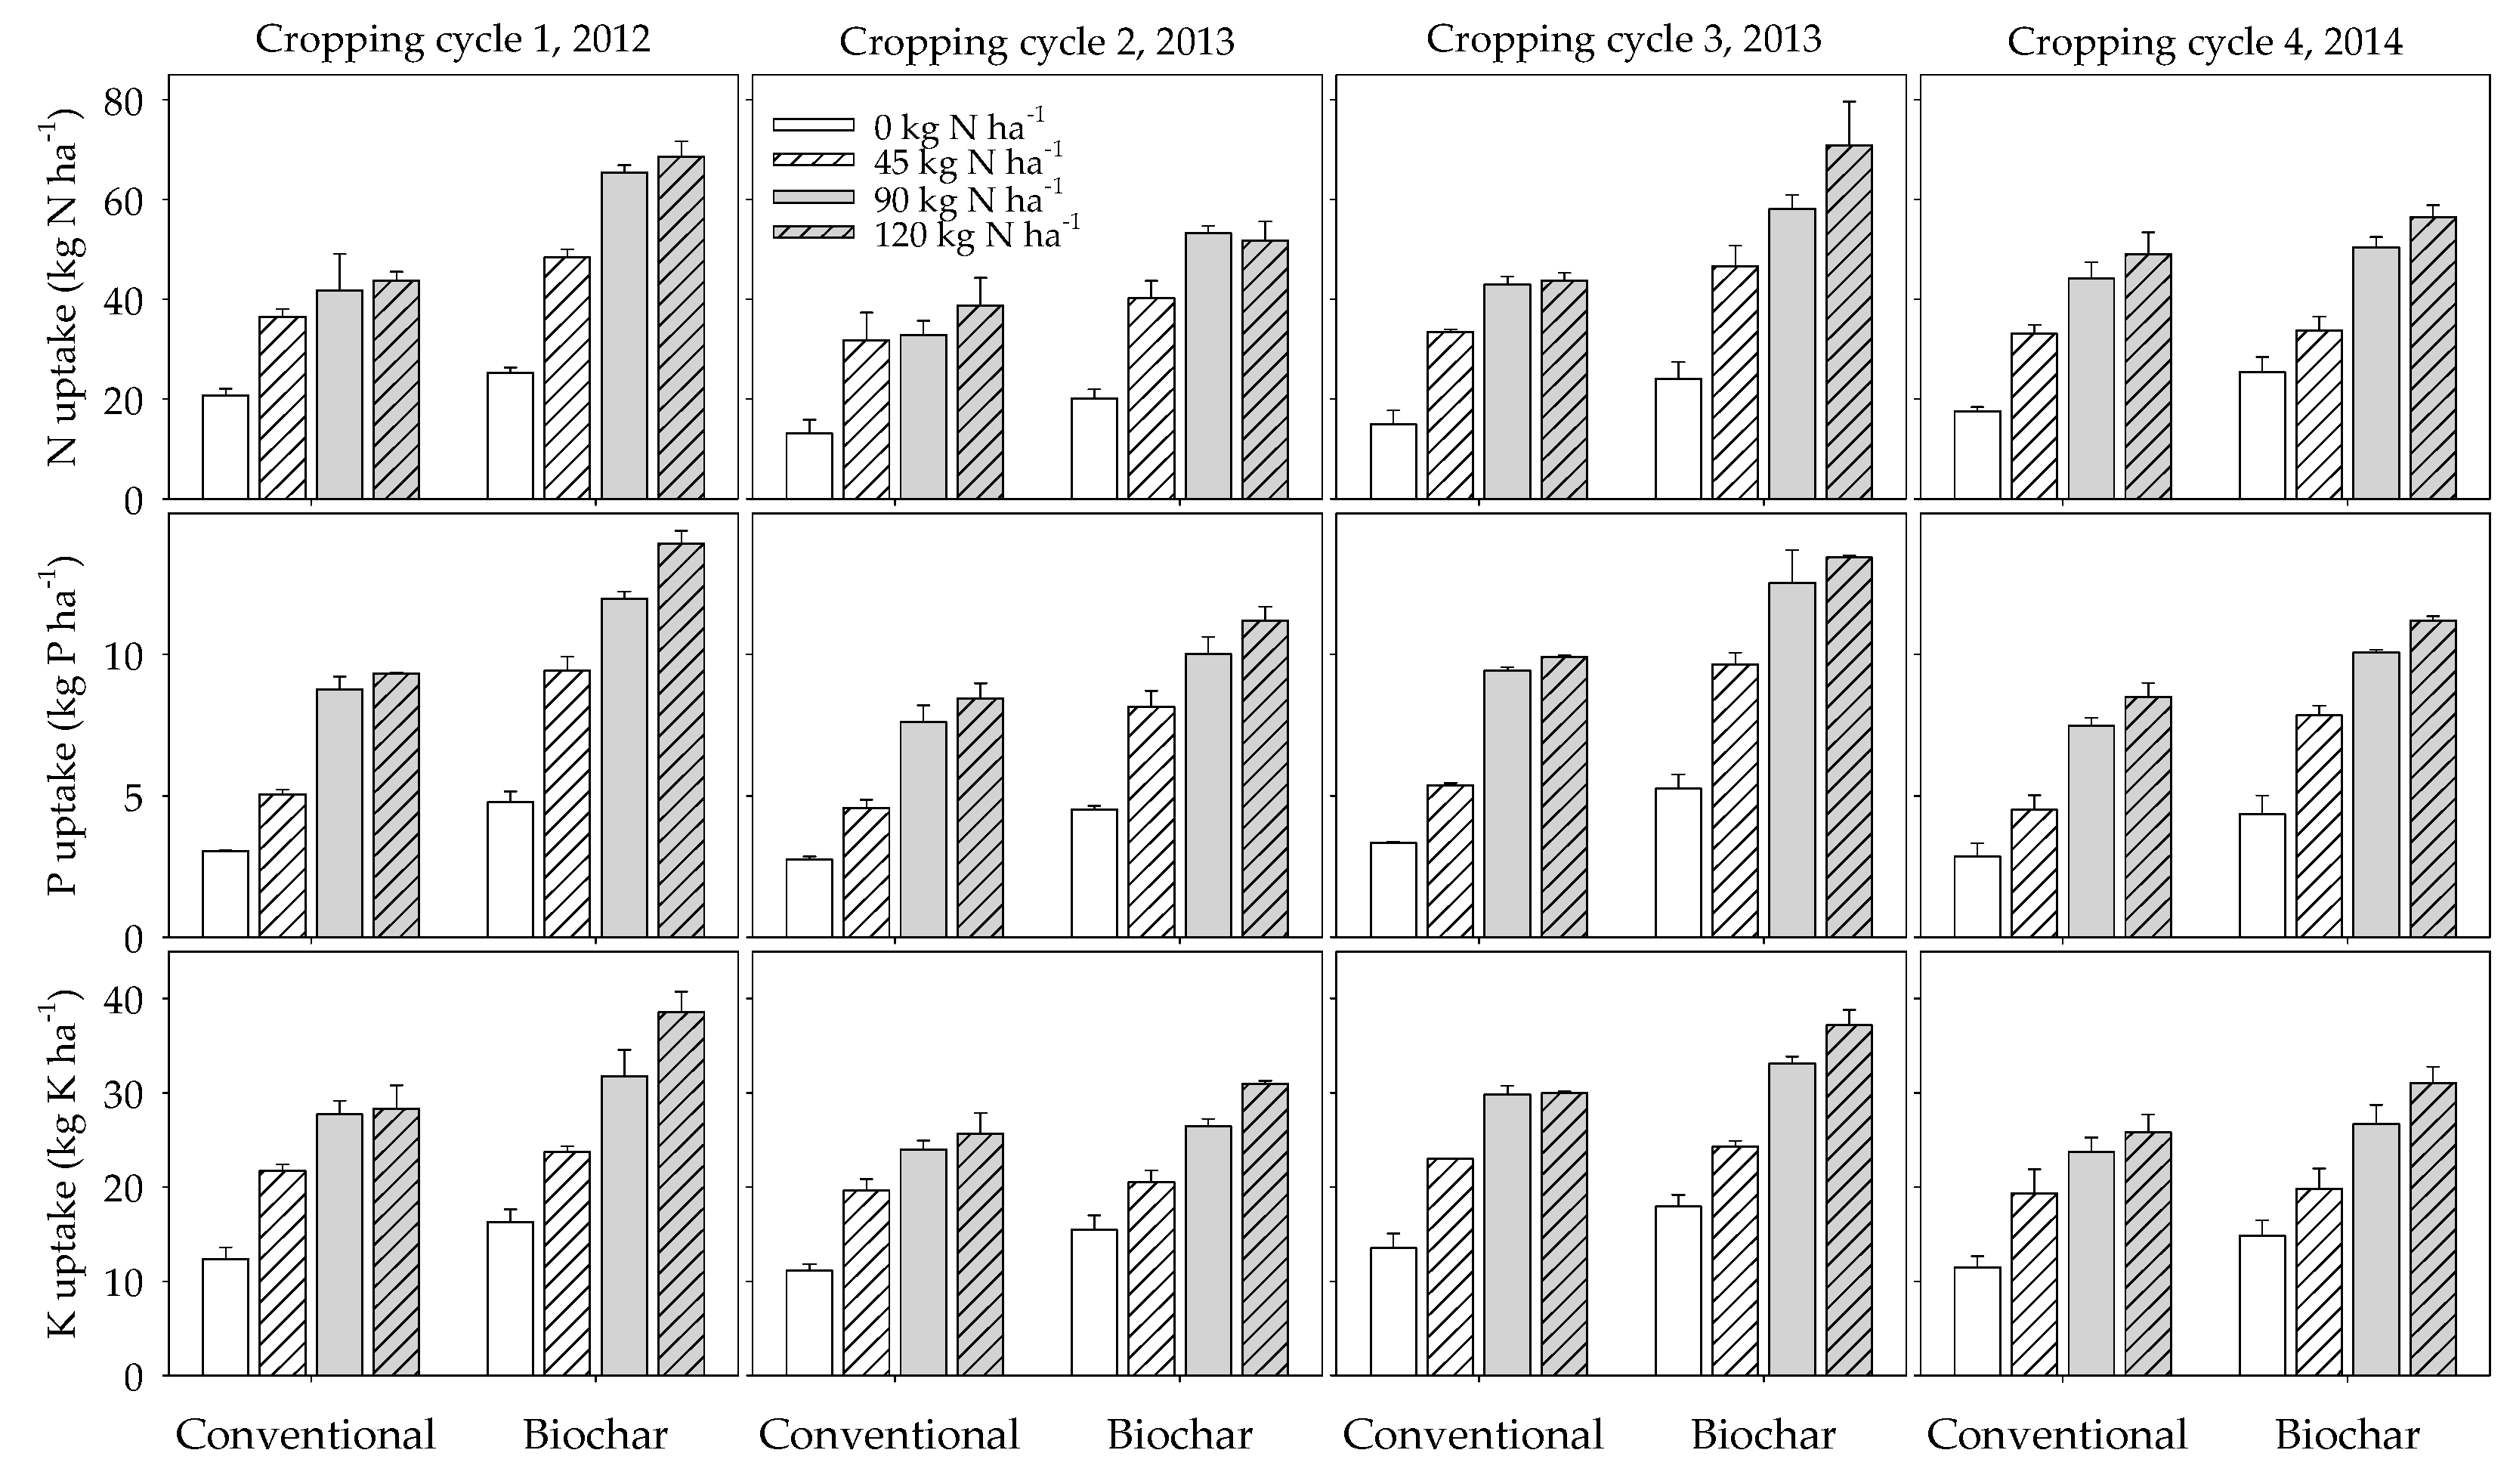
3.6. Nutrient Uptake in Straw and Grain

The interactions among cropping cycle × biochar × N fertilizer influenced (p ≤ 0.05) uptake of all nutrients in straw except for the case of K (Table 4). At the level of the cropping cycle, except for the 2nd cropping cycle, the interaction between biochar × nitrogen influenced the uptake of all three nutrients. In all, rice straws under biochar-amended plots recorded higher (p ≤ 0.05) nutrient uptake than those in the un-amended soils (Figure 3) in each of the cropping cycles. Nitrogen uptake in the straw was 38% more under biochar-amended plots compared to the sole fertilizer plots over the four cropping cycles. Similar trends were observed for P and K with average increases in uptake of 23 and 17% respectively. However, the magnitude of increases in P and K uptake in the straw was lower than that obtained for N. Additionally, uptake of nutrients during 1st and 3rd cropping cycles were generally higher than those in the 2nd and 4th cropping cycles.
The uptake of N in grain was influenced by the interactions among cropping cycle × biochar × nitrogen fertilizer. The interactions between cropping cycles × nitrogen fertilizer and biochar × nitrogen fertilizer influenced (p ≤ 0.05) the uptake of N, P and K in grain. Additionally, the interaction between cropping cycle × biochar influenced (p ≤ 0.05) the uptake of N and P. At the cropping cycle level, the interaction between biochar × N fertilizer influenced (p ≤ 0.05) nutrient uptake in all cropping cycles except for the uptake of K and N in the 4th cropping cycle. Figure 4 illustrates the nutrient uptake in response to biochar and nitrogen fertilization per each cropping cycle. The average uptake of N, P and K in grains were higher under the biochar amendment by 39, 52 and 19%, respectively compared to those obtained under sole fertilizer application. The trend in nutrients uptake in grain were generally similar to those observed with nutrients uptake in straw. Except for K, uptake of nutrients was higher in the grains than in the straw. The uptake of nutrients in grain generally increased with increasing rates of N fertilizer.

3.7. Agronomic Efficiency of Nitrogen and Apparent Recovery Efficiency of Nitrogen Applied

The efficiency of fertilizer applied was assessed by the agronomic efficiency of nitrogen (AEN) fertilizer and the apparent recovery efficiency (ARE) of nitrogen fertilizer used. The AEN was influenced (p ≤ 0.05) by the single effects of cropping cycle, nitrogen fertilizer, and biochar (Table 4). At the level of individual cropping cycle, biochar and nitrogen influenced AEN positively (Table 7). There was a general trend of AENs decreasing with increasing N fertilizer applied except for the 4th cropping cycle. Increasing nitrogen use from 45 to 90 kg·N·ha−1 resulted in AEA decline of between 17 and 29% under sole nitrogen fertilizer and between 28 and 42% under biochar amendment across cropping cycles. AENs on biochar amended plots were between 37 to 60% higher than those obtained under sole fertilizer application. The magnitude of AENs were generally higher in the 1st and 4th cropping cycles. Except for the 4th cropping cycle, the highest (p ≤ 0.05) AEN in each cropping cycle was obtained under biochar amendment that received 45 kg·N·ha−1. AEN was influenced by SOC content of the soil and grain N uptake (Table S1).
The sole effects of cropping cycle, biochar and nitrogen influenced apparent recovery efficiency of nitrogen (ARE) (Table 4). At the level of the individual cropping cycle, the sole effects of biochar influenced (p ≤ 0.05) ARE except for the 4th cropping cycle. Biochar amendment resulted in increased average ARE per cycle ranging between 19 and 31% compared to the use of sole nitrogen fertilizer. Generally, ARE decreased with increasing N rates irrespective of biochar amendment (Table 7). ARE were lower in the 2nd and 4th cropping cycles compared with those from the 1st and 3rd cropping cycles. ARE also declined across cropping cycles as the N rate increased from 45 kg·ha−1 to 120 kg·ha−1 by between 15 to 24% while those obtained under biochar amendment were between 3 to 21%. The ARE was significantly influenced by N uptake in the grain (Table S1).

3.8. Soil-Biochar Interactions

Table 8 shows the residual soil chemical analysis (topsoil) after four rice cropping cycles. The soil chemical properties increased significantly by 22, 42 and 11% for soil organic carbon, available P and CEC, respectively (Table 8). The afore-mentioned indices of fertility were even more enhanced upon N fertilization at 120 kg·N·ha–1. The impact of biochar amendment on bulk density and SOC stock are shown in Figure S2. Application of biochar resulted in the reduction of bulk density of topsoil (0–15 cm) from 1.37 g·cm−3 to 1.33 g·cm−3 in the topsoil. Application of biochar also resulted in a 17% increase in SOC stock from 13,864 to 16,183 kg·ha−1 under no nitrogen fertilization. Under 120 kg·N·ha−1 fertilization under biochar amendment, SOC stock increased to 18,278 kg·ha−1 representing an increase of 32% compared to the initial value.

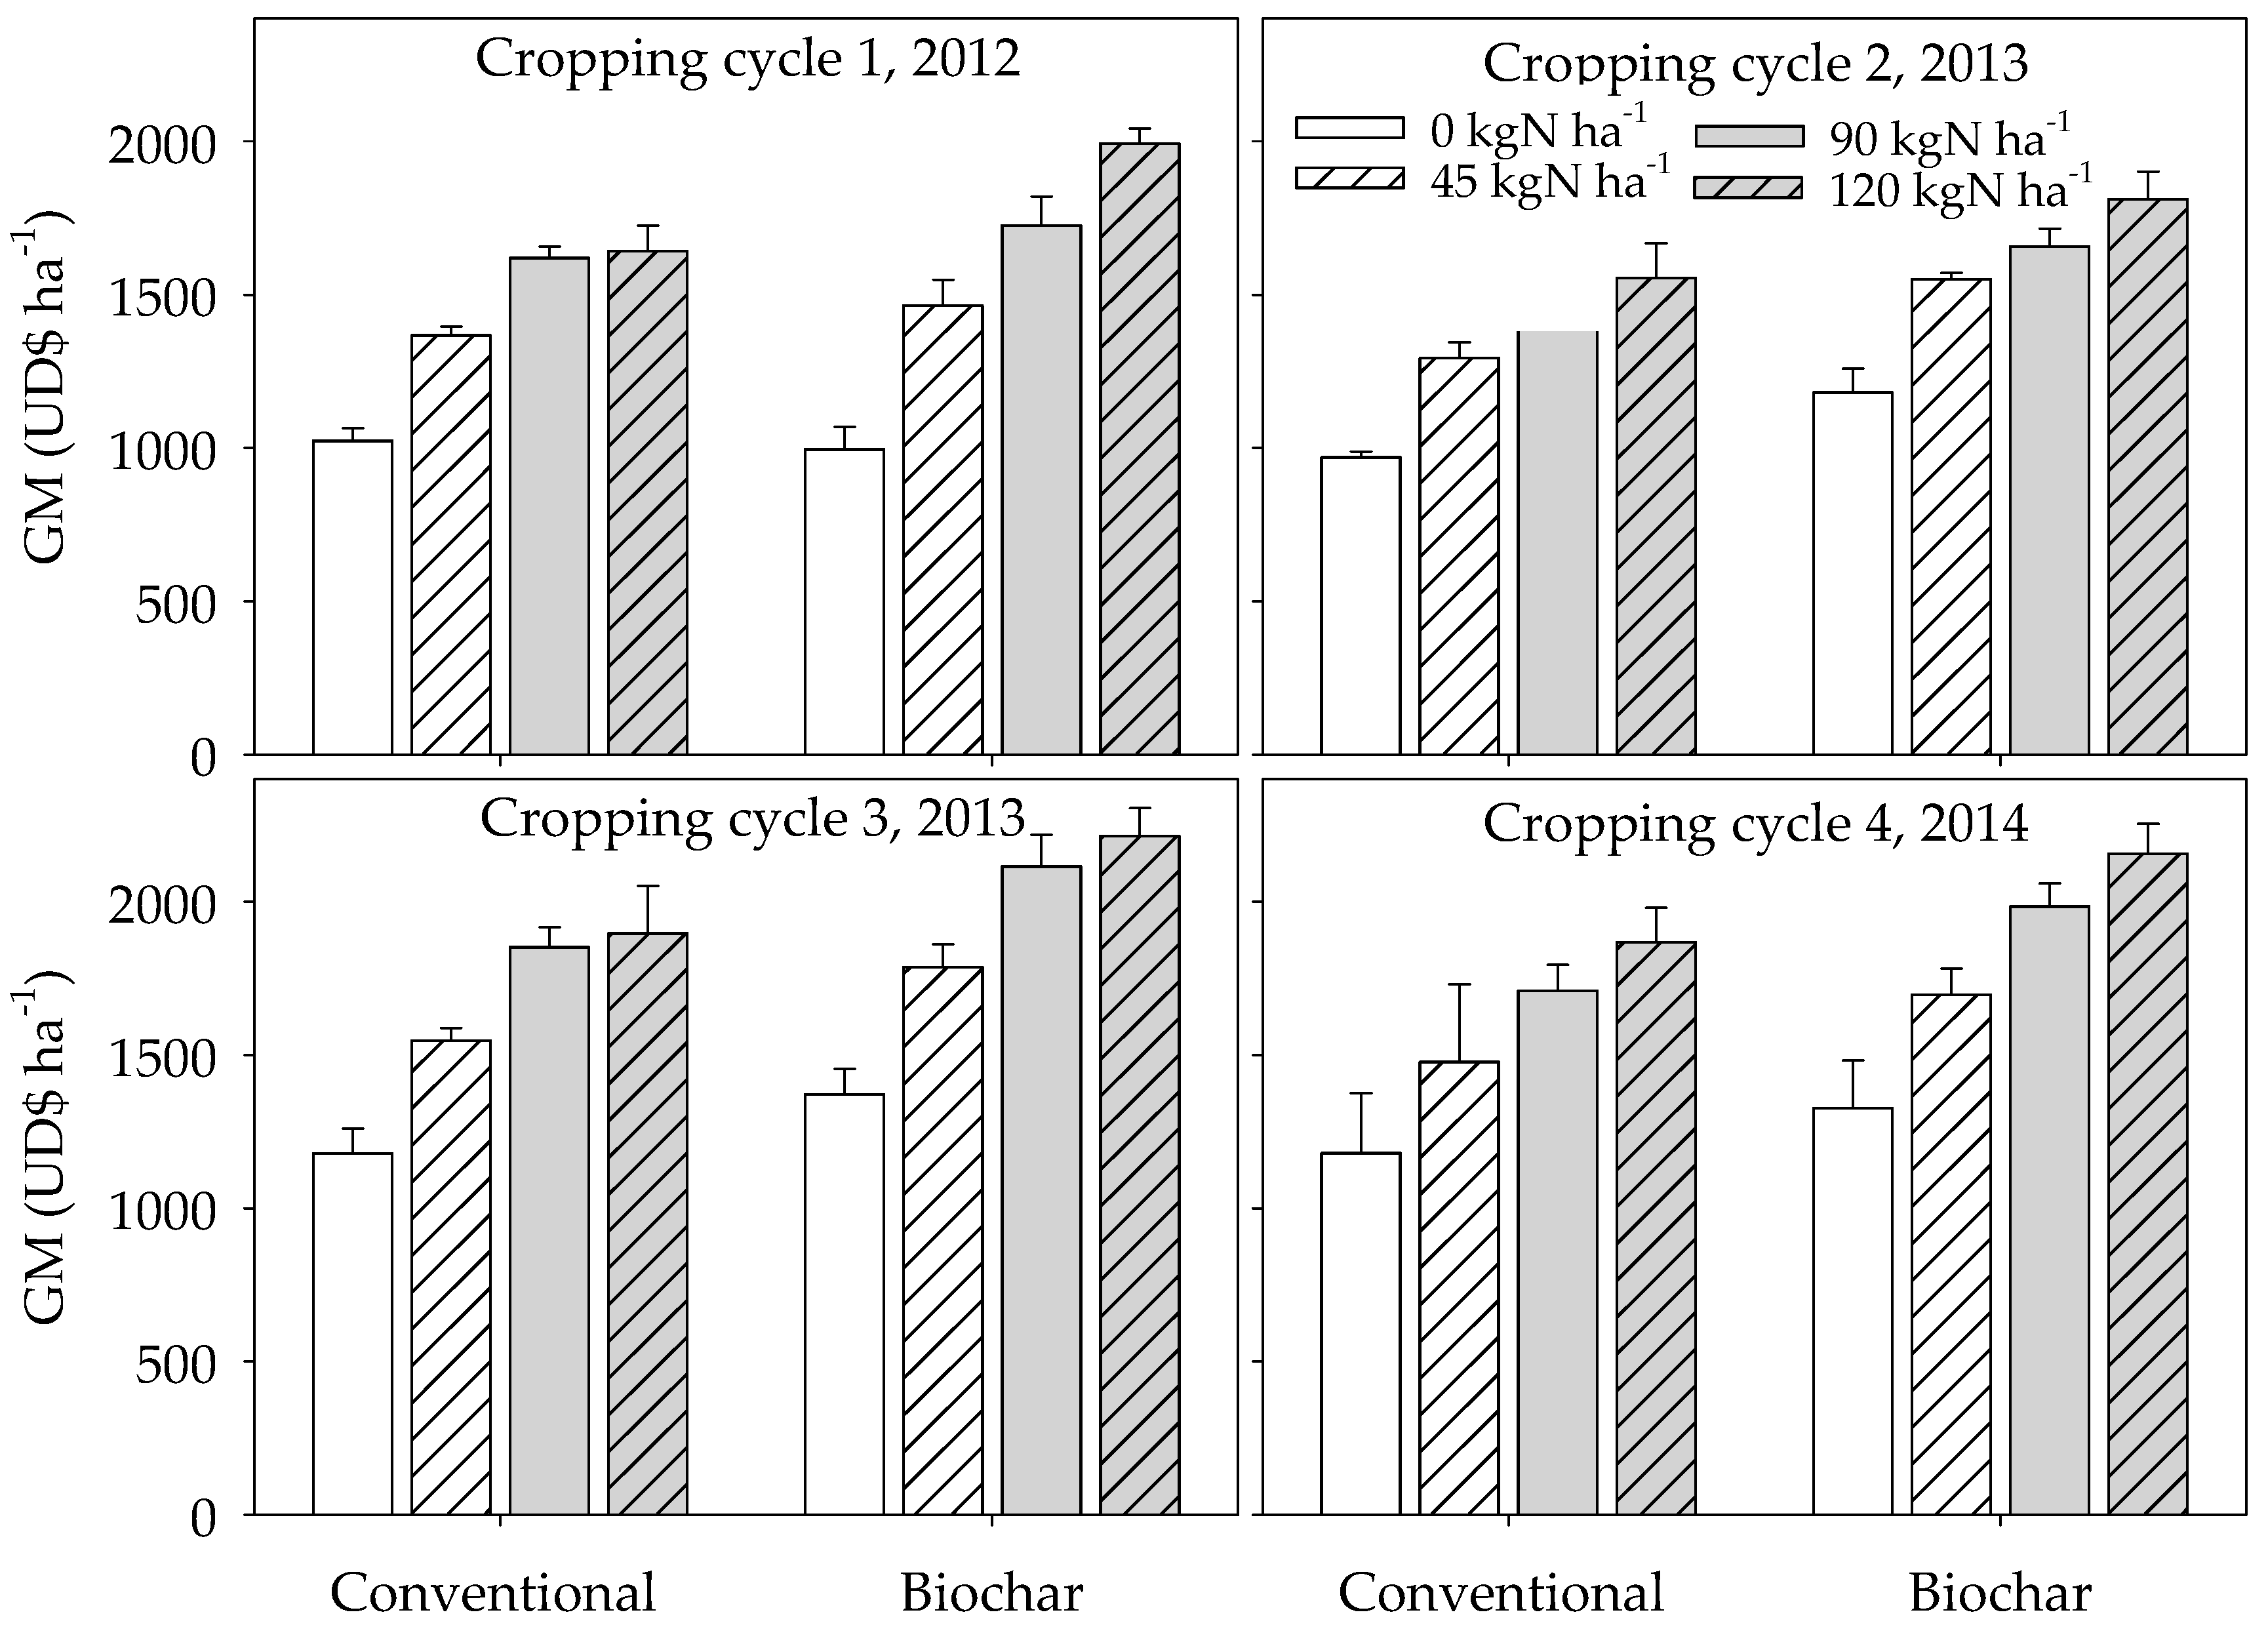
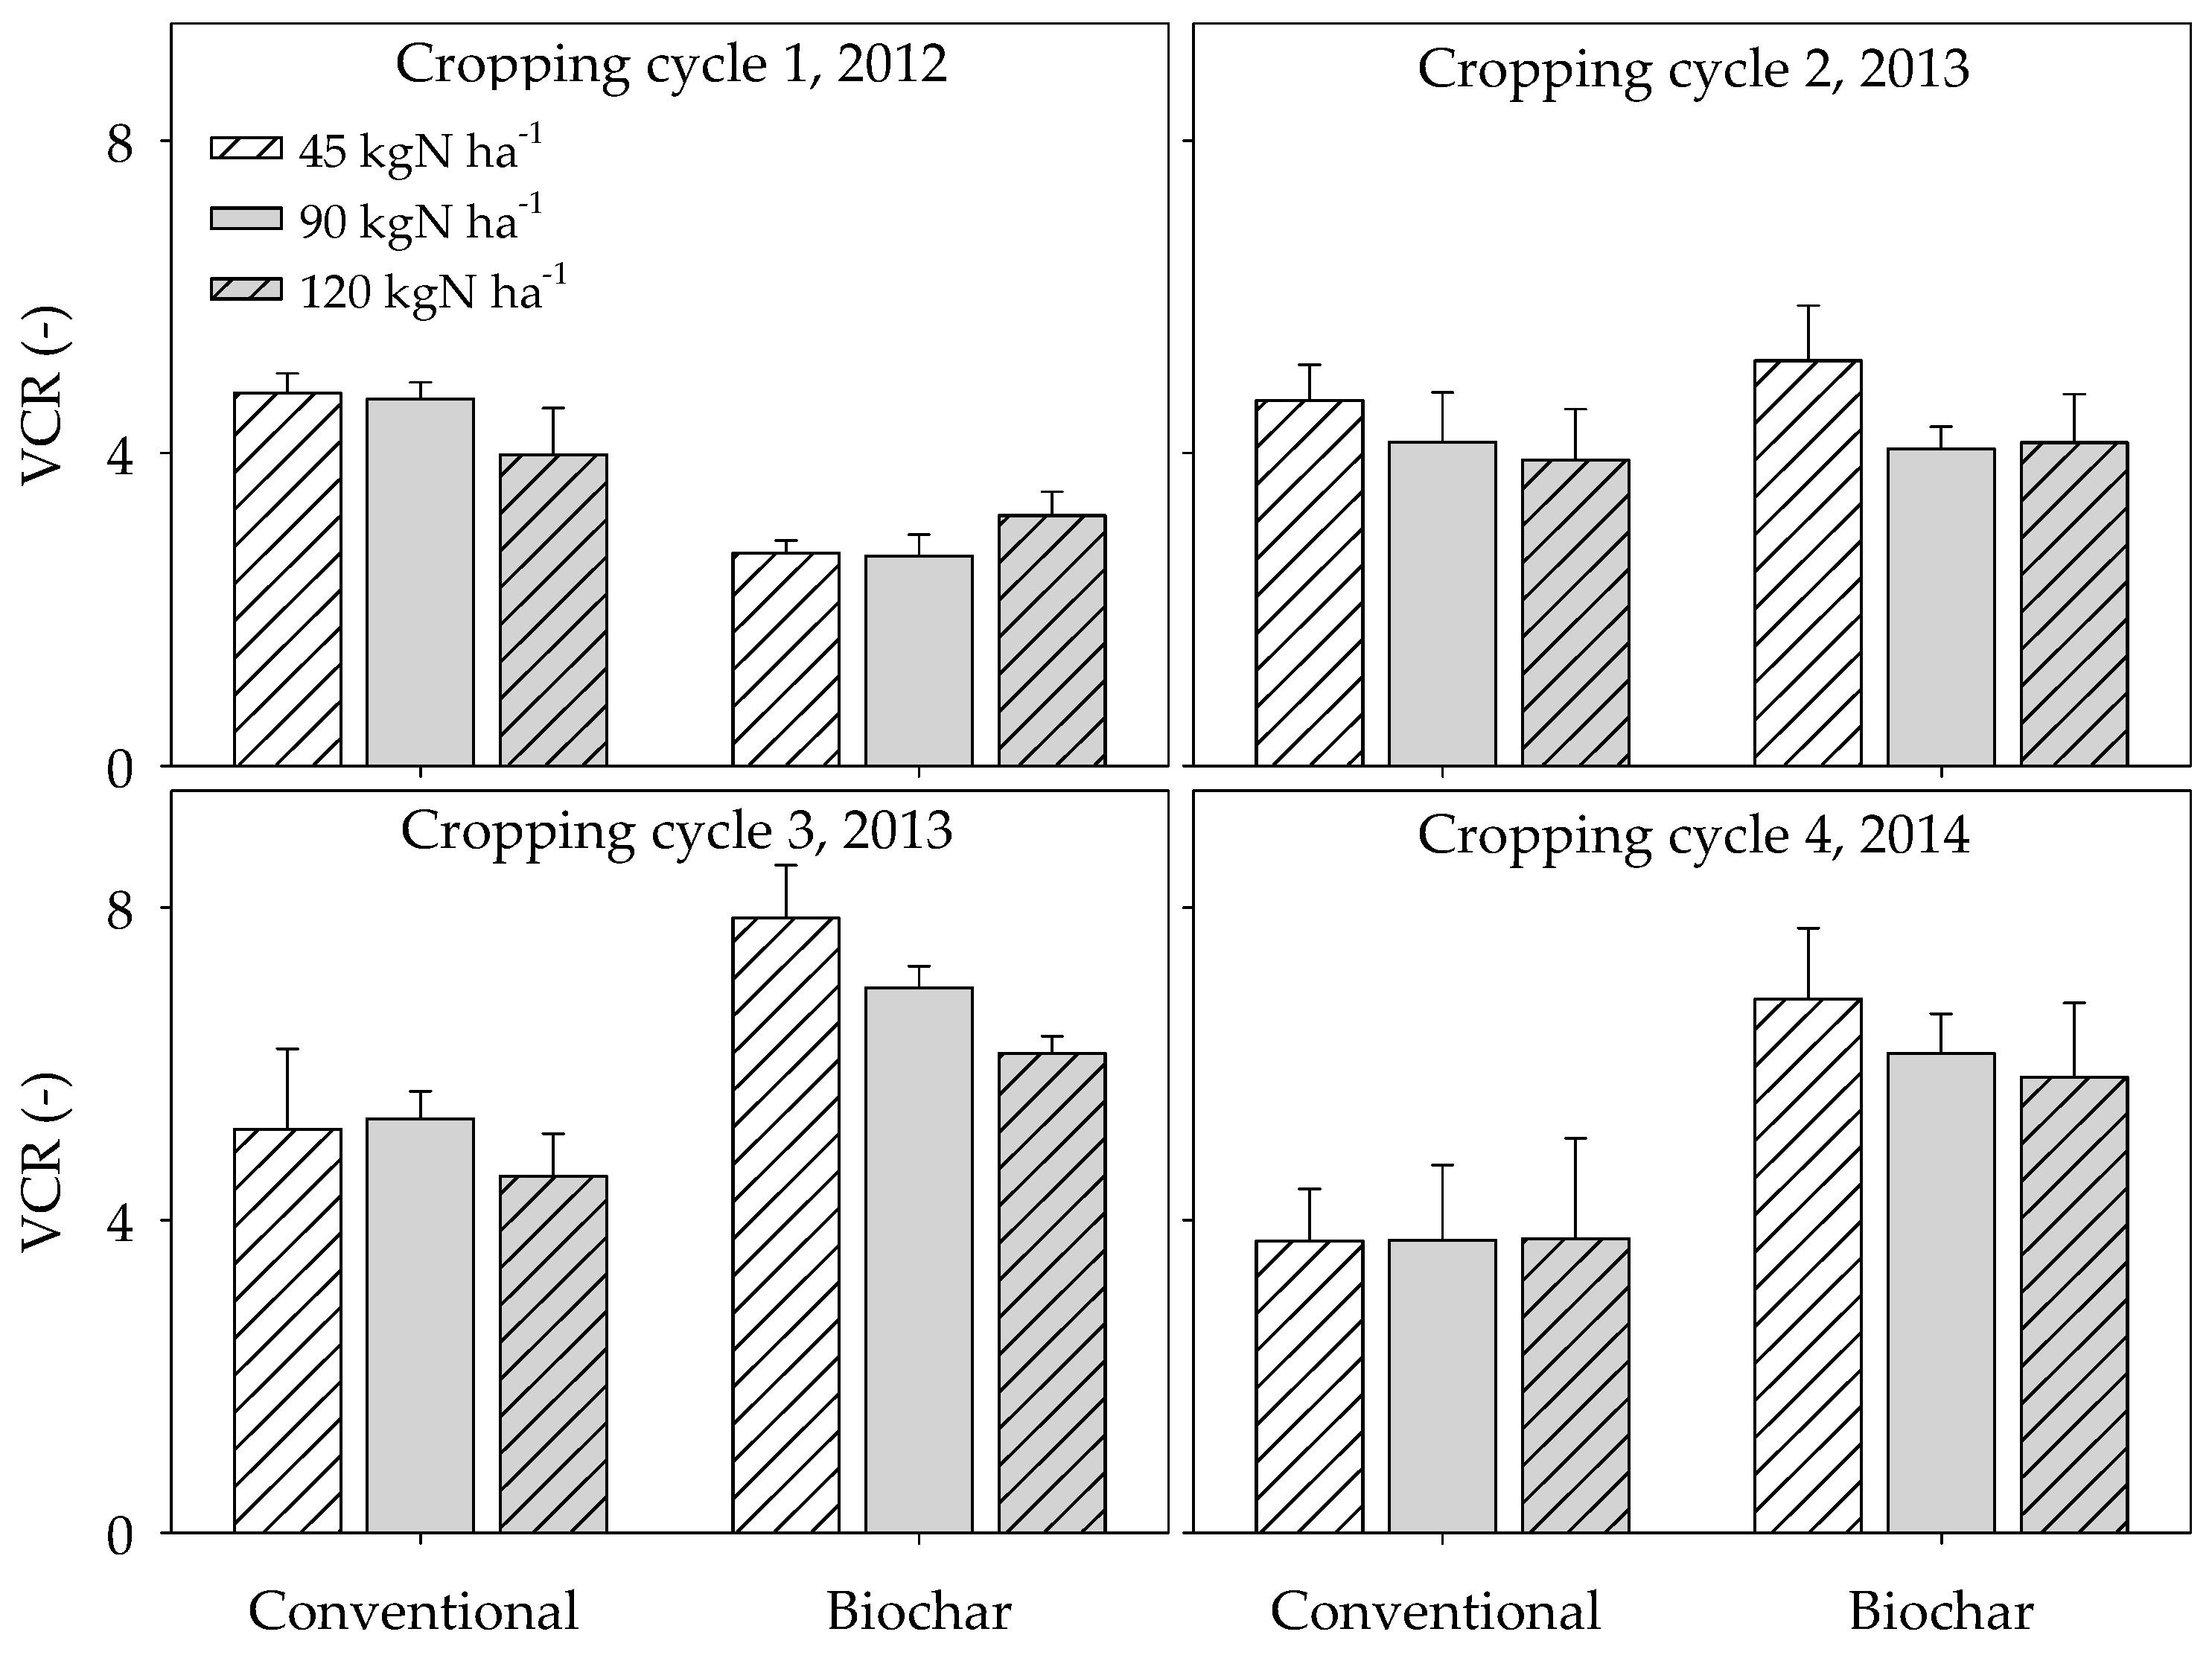
3.9. Economic Performance Indicators

The gross margin (GM) was influenced (p ≤ 0.05) by the interaction between cropping cycle × biochar, cropping cycle × nitrogen and cropping cycle × biochar × nitrogen (Table 4). At the level of the individual cropping cycle, interaction between biochar × nitrogen influenced GM only in the 1st cropping cycle. The sole effects of biochar and nitrogen influenced (p ≤ 0.05) GM in the remaining cropping cycles. Average increase in GM due to biochar amendments over the cropping cycles range between 132 and 351 US$ha−1 across N rates. Nitrogen fertilization also significantly increased GM under both conventional and biochar amended plots with GM being generally higher under biochar amended plots (Figure 5). Increase in GM under biochar amendment over the control ranged between 516 and 1036 US$ha−1 compared to those obtained under sole fertilizer application which ranged between 324 and 718 US$ha−1 across the four cropping cycles. As with grain yield, GM in the 2nd and 4th cropping cycles were generally lower than those in the 1st and 3rd cropping cycles. Similarly, biochar amended plots generally obtained higher gross returns (GR) than those under sole fertilizer amendment (Table S2). The trends in GM due to biochar and nitrogen fertilizer application were similar for GR across cropping cycles.
Unlike GM and GR, VCR generally decreased with increasing N application (Figure 6). The value cost ratio (VCR) was influenced by the interaction among cropping cycle × biochar × nitrogen fertilizer as per the mixed-model repeated measures. At the level of cropping cycle, biochar × nitrogen interaction influenced VCR in the 1st cropping cycle.
The trend in VCR varied across the cropping cycles. In the 1st cropping cycle, VCRs were lower under biochar amended plots compared to plots where no biochar was applied. Except for when biochar was applied in the 1st cropping cycle, VCR were generally higher in the 1st and 3rd cropping cycles compared to those in the 2nd and 4th cropping cycles. The VCRs from biochar amended plots in the 1st cropping cycle were between 19 to 43% less than those from the un-amended plots. However, with the remaining cropping cycles, the VCR of biochar amended plots were between 6 to 83% higher than those obtained on un-amended plots.

4. Discussion

4.1. Soil-Biochar Interactions

The interaction between biochar and the soil in several ways may have influenced the subsequent growth and yield of the paddy rice. Increase in the organic carbon, coupled with the rise in available P and an increase in CEC under biochar application improved the general soil productivity. The CEC of the soil increased upon biochar amendment irrespective of N application and this could be attributed to the relatively higher inherent CEC of the biochar. There was no change in pH due to the fact that the inherent pH of the biochar was similar to that of the initial soil. The increase in organic content due to the application of biochar probably contributed to an increase in CEC, reported in this study. The total carbon content of the biochar and the corresponding high available P and CEC may have, in part, played a role in increasing the fertility status of the biochar- amended soil as has been explained elsewhere by [25] and [41]. Soil organic carbon storage is an important function that determines the ability of a soil to retain nutrients and water resulting in enhanced productivity [42]. In essence, soil management practices such as the use of biochar in combination with fertilizer that lead to increased SOC storage as observed in this study has the potential to contribute to crop yield increase and also climate regulation.

4.2. Biochar Crop Development and Root Volume

Generally, stress factors are known to affect the phenology of crops. In the current study, flowering delayed while maturity was hastened under low N. In a study evaluating the performance of drought tolerant rice varieties in low fertility environments in Thailand, [43] reported that the time to flowering was reduced in most cultivars when manure was applied. In essence, adequate N hastened flowering while N deficit delayed flowering. Phenology is also sensitive to differences in ambient temperatures. Thus, higher temperatures in the 2nd and 4th cropping cycles resulted in a 5–day reduction in the phenology of rice plants by accelerating physiological processes to complete the crop life cycle. A study by [44] reported shortening in the duration of grain filling in Basmati rice by 6 days, as a result of temperature rise above 32 °C. Shortening life cycle reduces the uptake of resources such as nutrients, solar radiation and water thereby culminating in the plants not performing at their genetic potential [45,46].
The increase in root volume of rice observed in this study is consistent with other studies such as [47] who attributed prolific root growth of wheat on a Vertisol to biochar addition. The increased root volume observed in this study can also be explained by the increased P availability associated with biochar amendments. Enhanced P availability would lead to enhanced root proliferation and thus higher root volume which will lead to better exploitation for nutrients in the soil. Reduced soil bulk density associated with biochar [48] also probably contributed to increased root growth on the soils amended with biochar. Thus, improving bulk density promoted root growth resulting in higher root volumes under biochar amended plots thereby allowing for more nutrient uptake as evident in nutrient uptake of the rice plants grown on soil amended with both biochar and the inorganic fertilizer.

4.3. Straw and Grain Yield

The use of biochar resulted in increased straw (4 and 13%) yields across cropping cycles which agrees with the report by [49] where a 14% increase in rice straw was observed on an Andosol in Japan when 20 t·ha−1 rice husk biochar was applied. The consistently higher response to nitrogen when biochar was applied, suggests that the material is an effective soil amendment. The significant interactions between biochar and N fertilizer implied synergistic effects between the two amendments in influencing straw yield.
Although biochar contributed significantly to increased grain yield, its sole influence lags well behind that for N fertilizer. This trend was reported by [21] when maize cob biochar was used on maize cropping systems on an Alfisol in Nigeria. Biochar can therefore not substitute for N fertilizer in the quest to improve crop yields as the nutrient in the amendment is low because it volatilizes during charring. Nonetheless, it can be used to increase the efficiency of applied N fertilizer and improve soil physicochemical properties as well as SOC storage. The magnitude of the impact of biochar use on grain yield observed in the current study is corroborated by reports of other studies. A study by [29] attributed grain yield increases of between 9 to 11% to the use of rice straw biochar in cold waterlogged paddy in China. Another study by [50] also reported rice grain increase of between 10 and 29% in a two–cycle cropping. This study also explained that the mechanism of grain yield increase in rice on a calcareous clayey soil is due to the improved soil physicochemical properties that resulted from influence of biochar application, increased SOC storage, increased root volume for enhanced nutrient exploitation, better nutrient uptake and consequently increased productivity as well as enhanced profitability.
Both straw and grain yields were lower for the second and fourth cropping cycle experiments due to higher temperatures (particularly during the reproductive stage). The high temperature (above 34 °C) during the flowering stage could have increased spikelet sterility with a consequential decrease in yield [51]. Another study [52] also reported reduced rice grain weight due to temperature stress. Thus, the higher temperatures observed in the 2nd and 4th cropping cycle experiments probably contributed to the lower yields recorded during those cropping cycles. An earlier study in Asia [53] had reported air temperature range of 33–35 °C as threshold beyond which most rice grain filling period is shortened, resulting in loosely packed starch granules. Addressing grain yield losses due to increased temperature, will require adjusting planting dates to ensure that the reproductive stages do not coincide with the periods of high temperatures.

4.4. Nutrient Uptake and Use Efficiency

The general increase in the uptake of nutrients (N, P and K) observed on plots amended with both biochar and the inorganic fertilizer in this study can be explained in part by the increased root volume associated with biochar amendment, which allowed for more nutrient exploration and uptake. The higher N uptake on plots amended with biochar compared with their counterparts from the sole fertilizer plots was similar to the trend in N uptake reported by [54]. Increased uptake in P can in part be attributed to high available P content of biochar and its influence on increased root growth. The higher uptake of P and K in the biochar amended soils could also be as a result of the biochar serving as an additional source of the two macro nutrients as evident in the chemical composition of the material.
The higher AEN under biochar amended plots observed in this study can be attributed to higher SOC content of the soil and grain N uptake. This is consistent with a study by [55] who attributed higher values to higher SOC content. In a review on improving N use efficiency for rice production systems in Sub-Saharan Africa, [56] reported on AEN values ranging between 10 and 27 kg grains per kilogram N for irrigated rice production systems in West Africa under good agronomic practices. In essence, the AENs under the conventional practice (sole inorganic fertilizer) as observed in this study falls within the values obtained in irrigated rice cropping systems in West Africa. The combined use of biochar and inorganic fertilizer resulted in average AEN values above the world average of 20 kg·grain·kg−1 N [57]. A high AEN closely reflects better economic returns, environmental efficiency and an effective agro-ecosystem management practice [58]. Thus, the use of biochar in irrigated rice cropping systems as in ours can be described as an effective agro-ecosystem management practice. The ARE values reported under the conventional practices compare well with those reported for rice by [59,60] in their review of nutrient capture and recovery efficiencies in rice cropping systems in SSA. The ARE values obtained under biochar use were well above world average value [57]. As with AEN, ARE in this study was influenced by higher grain N uptake from biochar amended plots. Increased recovery of nitrogen implies decreased loss which is desirable to maintain environmental quality. Additionally, farmers will have an increase in economic returns which is a prerequisite for adoption. The results of biochar impact studies are usually difficult to compare, as response to yield varies depending on the type of crop, soil, the characteristics of feedstock used and the charring temperature among others [14,29,49]. The result of the present study is the first of its kind in Sub-Saharan Africa with irrigated or flooded rice systems on a calcareous soil.
Farmers are rational in their approach to adopting new technologies; thus, we assess the economic benefit of the biochar to determine its economic feasibility in irrigated rice cropping systems. We used the gross margin (GM), gross returns (GR) and value cost ratio (VCR) as economic indicators in this study. Generally, soils amended with biochar gave higher GMs and GRs compared to those from the conventional plots. Thus, the use of biochar in irrigated rice systems has the potential to increase monetary returns on investment of farmers on inorganic fertilizer input across the four cropping cycles. Given that rice husk is bountiful in rice growing areas and is usually burned as a way of disposal, the results from this study provides reasons for processing the husk into biochar for use to enhance inorganic fertilizer use efficiency and increase returns on fertilizer use in irrigated rice systems. In spite of the higher production cost associated with applying biochar in the 1st cropping cycle, the GM were still superior to those from the conventional practice.
Value cost ratio denotes the extra amount of yields gain per unit investment in biochar and/or fertilizer [57]. Except for the 1st cropping cycle, the VCR for yields from biochar amended plots were higher than those under conventional practice, an indication that the additional value brought on by amending the soils with biochar will inure to the benefit of farmers. Even in the 1st cropping cycle where the conventional practices performed better in terms of VCR, the values under biochar amendment were well above the threshold of 2 required to ensure adoption of a technology [61,62]. The lower VCR of the biochar amended plots in the first season which increased in the subsequent seasons attests to the fact that biochar as a soil amendment gets better with age [63]. It is also worth noting that VCR is very sensitive to price fluctuations [61]. Thus, fluctuation in the selling price of rice and input will affect the VCR. Even though VCR decreased with increased fertilizer use, the GM and GR increased with increasing N input. As with other integrated soil fertility management technologies, a factor that could limit farmers from adopting the biochar technology will be issues of security of land tenure. Farmers are usually reluctant to invest in the fertility of farm lands with unsecured tenure [64]. The 3 economic indicators used in the current study show that the use of biochar is economically feasible and hence can be extended to farmers for adoption. The promising economic feasibility could also be attributed partly to the proximity of the feedstock to the study location as haulage of the feedstock to prepare biochar has been cited as a major cost and in many instances make the biochar expensive and hence uneconomical.

5. Conclusions

This study assessed the impact of combining rice husk biochar and inorganic fertilizer to enhance SOC storage, nitrogen recovery and agronomic use efficiency and enhanced economic returns in irrigated rice cropping systems in Ghana. In the short term, combining biochar and inorganic fertilizer resulted in an increase in SOC storage, increased productivity, increased average AEN and ARE above the world averages of 20 kg·grain·kg−1 N and 55% respectively. Additionally, economic returns (gross margin, gross returns and value cost ratio) were improved when biochar was combined with inorganic fertilizer. High temperatures, however, reduced the productivity and profitability of both sole fertilizer use and combined use of fertilizer and biochar. In essence, the choice of planting time is critical to avoid the reproductive stage of the rice plant coinciding with temperatures above 34 °C to ensure increased productivity. The use of biochar in irrigated rice has the potential to be used as an adaptation and mitigation measures for climate change. The fact that positive impacts of biochar application persisted after four cropping cycles following an initial one-time application suggests that biochar indeed has a role to play in improving the efficiency of fertilizers in wet tropical agricultural systems. A long-term study is required to ascertain how long the biochar would persist in the soil and impact on the environment (polycyclic aromatic hydrocarbons in soils and Greenhouse gas emission). To ensure efficient production and use of the biochar technology to enhance productivity and profitability in irrigated rice, adequate training of extension officers will be required prior to disseminating the technology to farmers.

Supplementary Materials

The following are available online at https://www.mdpi.com/2073-4395/10/6/904/s1, Figure S1: The response of irrigated lowland rice to different levels of rice husk biochar with 90 kg ha−1 mineral fertilizer on the vertisols at Kpong, Ghana, Figure S2: Effect of biochar amendment on soil bulk density and soil organic carbon stock in the top soil (0–15 cm) after 4 cropping cycles (2012–2014) of irrigated rice at Kpong, Ghana. Con and Bio are conventional and biochar respectively. N is nitrogen fertilizer in kg ha−1. Table S1: Regression analysis between nutrient use efficiency indicators (AEN and ARE) and SOC and N uptake for irrigated rice production at Kpong, Ghana, Table S2: Production cost and gross return for the use of rice-husks biochar and fertilizer for rice production in Kpong, Ghana.

Author Contributions

Conceptualization, D.S.M. and S.G.K.A.; methodology, D.S.M., E.D., E.K.N. and S.G.K.A.; formal analysis, D.S.M., E.D., E.K.N., S.G.K.A. and A.T.; investigation, D.S.M., E.D., E.K.N., S.G.K.A. and A.T.; data curation, D.S.M. and A.T.; writing—original draft preparation, A.T.; writing—review and editing, D.S.M., E.D., E.K.N., S.G.K.A. and A.T.; visualization, D.S.M. and A.T.; supervision, D.S.M.; project administration, D.S.M. funding acquisition, D.S.M. All authors have read and agreed to the published version of the manuscript.

Funding

Authors are grateful to the University of Ghana Research Funds (ORID-URF/5/ILG-002/2011-2012) for providing financial support for the study.

Conflicts of Interest

The authors declare no conflict of interest.

References

  1. Mwangi, W.M. Low use of fertilizers and low productivity in sub-Saharan Africa. Nutr. Cycl. Agroecosyst. 1996, 47, 135–147. [Google Scholar] [CrossRef]
  2. Bumb, B.L.; Johnson, M.E.; Fuentes, P.A. Policy Options for Improving Regional Fertilizer Markets in West Africa; IFPRI Discussion Paper 01084; IFPRI: Washington, DC, USA, 2011; p. 73. [Google Scholar]
  3. Sanchez, P.A.; Denning, G.L.; Nziguheba, G. The African green revolution moves forward. Food Secur. 2009, 1, 37–44. [Google Scholar] [CrossRef]
  4. Vanlauwe, B.; Kihara, J.; Chivenge, P.; Pypers, P.; Coe, R.; Six, J. Agronomic use efficiency of N fertilizer in maize-based systems in sub-Saharan Africa within the context of integrated soil fertility management. Plant Soil 2011, 339, 35–50. [Google Scholar] [CrossRef]
  5. Castelli, F.; Ceotto, E.; Borrelli, L.; Cabassi, G.; Moschella, A.; Fornara, D. No-till permanent meadow promotes soil carbon sequestration and nitrogen use efficiency at the expense of productivity. Agron. Sustain. Dev. 2017, 37, 55. [Google Scholar] [CrossRef] [Green Version]
  6. Kihara, J.; Huising, J.; Nziguheba, G.; Waswa, B.S.; Njoroge, S.; Kabambe, V.; Iwuafor, E.; Kibunja, C.; Esilaba, A.O.; Coulibaly, A. Maize response to macronutrients and potential for profitability in sub-Saharan Africa. Nutr. Cycl. Agroecosyst. 2016, 105, 171–181. [Google Scholar] [CrossRef] [Green Version]
  7. MacCarthy, D.S.; Sommer, R.; Vlek, P.L. Modeling the impacts of contrasting nutrient and residue management practices on grain yield of sorghum (Sorghum bicolor (L.) Moench) in a semi-arid region of Ghana using APSIM. Field Crop. Res. 2009, 113, 105–115. [Google Scholar] [CrossRef]
  8. Iwasaki, S.; Endo, Y.; Hatano, R. The effect of organic matter application on carbon sequestration and soil fertility in upland fields of different types of Andosols. Soil Sci. Plant Nutr. 2017, 63, 200–220. [Google Scholar] [CrossRef] [Green Version]
  9. Oades, J. Soil organic matter and structural stability: Mechanisms and implications for management. Plant Soil 1984, 76, 319–337. [Google Scholar] [CrossRef]
  10. Kleemann, L.; Abdulai, A. Organic Certification, Agro-Ecological Practices and Return on Investment: Farm Level Evidence from Ghana; Kiel Working Paper: Kiel, Germany, 2012; pp. 4–21. [Google Scholar]
  11. Bossio, D.A.; Horwath, W.R.; Mutters, R.G.; van Kessel, C. Methane pool and flux dynamics in a rice field following straw incorporation. Soil Biol. Biochem. 1999, 31, 1313–1322. [Google Scholar] [CrossRef]
  12. Devêvre, O.C.; Horwáth, W.R. Decomposition of rice straw and microbial carbon use efficiency under different soil temperatures and moistures. Soil Biol. Biochem. 2000, 32, 1773–1785. [Google Scholar] [CrossRef]
  13. Kanouo, B.M.D.; Allaire, S.E.; Munson, A.D. Quantifying the influence of eucalyptus bark and corncob biochars on the physico-chemical properties of a tropical oxisol under two soil tillage modes. Int. J. Recycl. Org. Waste Agric. 2019, 8, 211–224. [Google Scholar] [CrossRef] [Green Version]
  14. Haefele, S.; Konboon, Y.; Wongboon, W.; Amarante, S.; Maarifat, A.; Pfeiffer, E.; Knoblauch, C. Effects and fate of biochar from rice residues in rice-based systems. Field Crop. Res. 2011, 121, 430–440. [Google Scholar] [CrossRef]
  15. Coomes, O.T.; Miltner, B.C. Indigenous charcoal and biochar production: Potential for soil improvement under shifting cultivation systems. Land Degrad. Dev. 2017, 28, 811–821. [Google Scholar] [CrossRef]
  16. Duku, M.H.; Gu, S.; Hagan, E.B. Biochar production potential in Ghana—A review. Renew. Sustain. Energy Rev. 2011, 15, 3539–3551. [Google Scholar] [CrossRef]
  17. Shackley, S.; Carter, S.; Knowles, T.; Middelink, E.; Haefele, S.; Sohi, S.; Cross, A.; Haszeldine, S. Sustainable gasification–biochar systems? A case-study of rice-husk gasification in Cambodia, Part I: Context, chemical properties, environmental and health and safety issues. Energy Policy 2012, 42, 49–58. [Google Scholar] [CrossRef]
  18. Shackley, S.; Sohi, S. Benefits and Issues Associated with the Application of Biochar to Soil; A report commissioned by the UK Department for Environment, Food and Rural Affairs and Department of Energy and Climate Change; DECC: London, UK, 2010; 132p. [Google Scholar]
  19. Arif, M.; Ilyas, M.; Riaz, M.; Ali, K.; Shah, K.; Haq, I.U.; Fahad, S. Biochar improves phosphorus use efficiency of organic-inorganic fertilizers, maize-wheat productivity and soil quality in a low fertility alkaline soil. Field Crop. Res. 2017, 214, 25–37. [Google Scholar] [CrossRef]
  20. Oladele, S.; Adeyemo, A.; Awodun, M.; Ajayi, A.; Fasina, A. Effects of biochar and nitrogen fertilizer on soil physicochemical properties, nitrogen use efficiency and upland rice (Oryza sativa) yield grown on an Alfisol in Southwestern Nigeria. Int. J. Recycl. Org. Waste Agric. 2019, 336, 1–11. [Google Scholar] [CrossRef] [Green Version]
  21. Faloye, O.; Alatise, M.; Ajayi, A.; Ewulo, B. Synergistic effects of biochar and inorganic fertiliser on maize (zea mays) yield in an alfisol under drip irrigation. Soil Tillage Res. 2017, 174, 214–220. [Google Scholar] [CrossRef]
  22. Yeboah, E.; Asamoah, G.; Kofi, B.; Abunyewa, A.A. Effect of biochar type and rate of application on maize yield indices and water use efficiency on an Ultisol in Ghana. Energy Procedia 2016, 93, 14–18. [Google Scholar] [CrossRef] [Green Version]
  23. Manso, E.F.; Nartey, E.; Adjadeh, T.; Darko, D.; Lawson, I.; Amoatey, C. Use of Corn Cob and Rice Husk Biochar as Liming Materials in Acid Soils. West Afr. J. Appl. Ecol. 2019, 27, 32–50. [Google Scholar]
  24. Lehmann, J.; da Silva, J.P.; Steiner, C.; Nehls, T.; Zech, W.; Glaser, B. Nutrient availability and leaching in an archaeological Anthrosol and a Ferralsol of the Central Amazon basin: Fertilizer, manure and charcoal amendments. Plant Soil 2003, 249, 343–357. [Google Scholar] [CrossRef]
  25. Liang, B.; Lehmann, J.; Solomon, D.; Kinyangi, J.; Grossman, J.; O’neill, B.; Skjemstad, J.; Thies, J.; Luizao, F.; Petersen, J. Black carbon increases cation exchange capacity in soils. Soil Sci. Soc. Am. J. 2006, 70, 1719–1730. [Google Scholar] [CrossRef] [Green Version]
  26. Fidel, R.B.; Laird, D.A.; Parkin, T.B. Effect of biochar on soil greenhouse gas emissions at the laboratory and field scales. Soil Syst. 2019, 3, 8. [Google Scholar] [CrossRef] [Green Version]
  27. Shen, Y.; Zhu, L.; Cheng, H.; Yue, S.; Li, S. Effects of biochar application on CO2 emissions from a cultivated soil under semiarid climate conditions in Northwest China. Sustainability 2017, 9, 1482. [Google Scholar] [CrossRef] [Green Version]
  28. Si, L.; Xie, Y.; Ma, Q.; Wu, L. The short-term effects of rice straw biochar, nitrogen and phosphorus fertilizer on rice yield and soil properties in a cold waterlogged paddy field. Sustainability 2018, 10, 537. [Google Scholar] [CrossRef] [Green Version]
  29. Liu, Y.; Lu, H.; Yang, S.; Wang, Y. Impacts of biochar addition on rice yield and soil properties in a cold waterlogged paddy for two crop seasons. Field Crop. Res. 2016, 191, 161–167. [Google Scholar] [CrossRef]
  30. Sarfraz, R.; Shakoor, A.; Abdullah, M.; Arooj, A.; Hussain, A.; Xing, S. Impact of integrated application of biochar and nitrogen fertilizers on maize growth and nitrogen recovery in alkaline calcareous soil. Soil Sci. Plant Nutr. 2017, 63, 488–498. [Google Scholar] [CrossRef]
  31. Nwajiaku, I.M.; Olanrewaju, J.S.; Sato, K.; Tokunari, T.; Kitano, S.; Masunaga, T. Change in nutrient composition of biochar from rice husk and sugarcane bagasse at varying pyrolytic temperatures. Int. J. Recycl. Org. Waste Agric. 2018, 7, 269–276. [Google Scholar] [CrossRef] [Green Version]
  32. Amatekpor, J.K.; Dowuona, G.N.N. Site Characterization. IBSRAM Vertisol Project; Department of Soil Science, University of Ghana: Legon, Ghana, 1995; p. 42. [Google Scholar]
  33. Steiner, C.; Bellwood-Howard, I.; Häring, V.; Tonkudor, K.; Addai, F.; Atiah, K.; Abubakari, A.H.; Kranjac-Berisavljevic, G.; Marschner, B.; Buerkert, A. Participatory trials of on-farm biochar production and use in Tamale, Ghana. Agron. Sustain. Dev. 2018, 38, 12. [Google Scholar] [CrossRef] [Green Version]
  34. Walkley, A.; Black, A. Organic matter was determined by wet digestion: An examination of the Degtjareff method for determining soil organic matter, and a proposed modification of the chromic acid titration method. Soil Sci. 1934, 37, 29–38. [Google Scholar] [CrossRef]
  35. Watanabe, F.; Olsen, S. Test of an ascorbic acid method for determining phosphorus in water and NaHCO3 extracts from soil 1. Soil Sci. Soc. Am. J. 1965, 29, 677–678. [Google Scholar] [CrossRef]
  36. Bremmer, J.M. Total Nitrogen. In Methods of Soil Analysis. Part 2 Chemical and Microbiological Properties; Agronomy Monograph 9; Black, C.A., Ed.; America Society of Agronomy-Soil Science Society of America: Madision, WI, USA, 1965; pp. 1149–1178. [Google Scholar]
  37. Murphy, J.; Riley, J.P. A modified single solution method for the determination of phosphate in natural waters. Anal. Chim. Acta 1962, 27, 31–36. [Google Scholar] [CrossRef]
  38. Day, P.R. Fractionation and particle-size analysis. In Methods of Soil Analysis; Agronomy No. 9 Part 1; Black, C.A., Ed.; America Society of Agronomy-Soil Science Society of America: Madison, WI, USA, 1965; Volume 9, pp. 545–567. [Google Scholar]
  39. Ministry of Food and Agriculture, (MoFA). Statistics Research and Information Directorate, (SRID); Commodity Prices Unit.: Accra, Ghana, 2014. [Google Scholar]
  40. Bank of Ghana (BoG). Historical Interbank FX Rates. Available online: https://www.bog.gov.gh/treasury-and-the-markets/historical-interbank-fx-rates/ (accessed on 10 April 2020).
  41. Masulili, A.; Utomo, W.H.; Syechfani, M. Rice husk biochar for rice based cropping system in acid soil 1. The characteristics of rice husk biochar and its influence on the properties of acid sulfate soils and rice growth in West Kalimantan, Indonesia. J. Agric. Sci. 2010, 2, 39. [Google Scholar] [CrossRef] [Green Version]
  42. Wiesmeier, M.; Urbanski, L.; Hobley, E.; Lang, B.; von Lützow, M.; Marin-Spiotta, E.; van Wesemael, B.; Rabot, E.; Ließ, M.; Garcia-Franco, N. Soil organic carbon storage as a key function of soils-A review of drivers and indicators at various scales. Geoderma 2019, 333, 149–162. [Google Scholar] [CrossRef]
  43. Wonprasaid, S.; Khunthasuvon, S.; Sittisuang, P.; Fukai, S. Performance of contrasting rice cultivars selected for rainfed lowland conditions in relation to soil fertility and water availability. Field Crop. Res. 1996, 47, 267–275. [Google Scholar] [CrossRef]
  44. Ahmed, N.; Tetlow, I.J.; Nawaz, S.; Iqbal, A.; Mubin, M.; Nawaz ul Rehman, M.S.; Butt, A.; Lightfoot, D.A.; Maekawa, M. Effect of high temperature on grain filling period, yield, amylose content and activity of starch biosynthesis enzymes in endosperm of basmati rice. J. Sci. Food Agric. 2015, 95, 2237–2243. [Google Scholar] [CrossRef]
  45. Fahad, S.; Bajwa, A.A.; Nazir, U.; Anjum, S.A.; Farooq, A.; Zohaib, A.; Sadia, S.; Nasim, W.; Adkins, S.; Saud, S. Crop production under drought and heat stress: Plant responses and management options. Front. Plant Sci. 2017, 8, 1147. [Google Scholar] [CrossRef] [Green Version]
  46. MacCarthy, D.; Vlek, P.L. Impact of climate change on sorghum production under different nutrient and crop residue management in semi-arid region of Ghana: A modeling perspective. Afr. Crop Sci. J. 2012, 20, 243–259. [Google Scholar]
  47. Olmo, M.; Alburquerque, J.A.; Barrón, V.; Del Campillo, M.C.; Gallardo, A.; Fuentes, M.; Villar, R. Wheat growth and yield responses to biochar addition under Mediterranean climate conditions. Biol. Fertil. Soils 2014, 50, 1177–1187. [Google Scholar] [CrossRef]
  48. Mukherjee, A.; Lal, R. Biochar impacts on soil physical properties and greenhouse gas emissions. Agronomy 2013, 3, 313–339. [Google Scholar] [CrossRef] [Green Version]
  49. Koyama, S.; Hayashi, H. Rice yield and soil carbon dynamics over three years of applying rice husk charcoal to an Andosol paddy field. Plant Prod. Sci. 2017, 20, 176–182. [Google Scholar] [CrossRef]
  50. Zhang, A.; Bian, R.; Pan, G.; Cui, L.; Hussain, Q.; Li, L.; Zheng, J.; Zheng, J.; Zhang, X.; Han, X. Effects of biochar amendment on soil quality, crop yield and greenhouse gas emission in a Chinese rice paddy: A field study of 2 consecutive rice growing cycles. Field Crop. Res. 2012, 127, 153–160. [Google Scholar] [CrossRef]
  51. Jagadish, S.V.K.; Craufurd, P.Q.; Wheeler, T.R. High temperature stress and spikelet fertility in rice (Oryza sativa L.). J. Exp. Bot. 2007, 58, 1627–1635. [Google Scholar] [CrossRef] [PubMed] [Green Version]
  52. Singh, S.; Aggarwal, P.; Yadav, R. Growth and Yield Response of Rice under Heat Stress during Vegetative, Reproductive, and Ripening Growth Phases; IRRI: Los Baños, Philippines, 2010; pp. 1–4. [Google Scholar]
  53. Krishnan, P.; Ramakrishnan, B.; Reddy, K.R.; Reddy, V. High-temperature effects on rice growth, yield, and grain quality. Adv. Agron. 2011, 111, 87–206. [Google Scholar]
  54. Yousaf, M.; Li, X.; Zhang, Z.; Ren, T.; Cong, R.; Ata-Ul-Karim, S.T.; Fahad, S.; Shah, A.N.; Lu, J. Nitrogen fertilizer management for enhancing crop productivity and nitrogen use efficiency in a rice-oilseed rape rotation system in China. Front. Plant Sci. 2016, 7, 1496. [Google Scholar] [CrossRef]
  55. Tsujimoto, Y.; Inusah, B.; Katsura, K.; Fuseini, A.; Dogbe, W.; Zakaria, A.I.; Fujihara, Y.; Oda, M.; Sakagami, J.-I. The effect of sulfur fertilization on rice yields and nitrogen use efficiency in a floodplain ecosystem of northern Ghana. Field Crop. Res. 2017, 211, 155–164. [Google Scholar] [CrossRef]
  56. Tsujimoto, Y.; Rakotoson, T.; Tanaka, A.; Saito, K. Challenges and opportunities for improving N use efficiency for rice production in sub-Saharan Africa. Plant Prod. Sci. 2019, 22, 413–427. [Google Scholar] [CrossRef]
  57. Fixen, P.; Brentrup, F.; Bruulsema, W.T.; Garcia, F.; Norton, R.; Zingore, S. Nutrient/fertilizer use efficiency: Measurement, current situation and trends. In Managing Water Fertilizer for Sustainable Agricultural Intensification; Drechsel, P., Heffer, P., Magen, H., Mikkelsen, R., Wichelns, D., Eds.; International Fertilizer Industry Association (IFA): Paris, France; International Water Management Institute (IWMI): Colombo, Sri Lanka; International Plant Nutrition Institute (IPNI): Norcross, GA, USA; International Potash Institute (IPI): Horgen, Switzerland, 2015; Volume 270, pp. 1–29. [Google Scholar]
  58. Montemurro, F.; Diacono, M. Towards a better understanding of agronomic efficiency of nitrogen: Assessment and improvement strategies. Agronomy 2016, 6, 31. [Google Scholar] [CrossRef]
  59. Chikowo, R.; Corbeels, M.; Mapfumo, P.; Tittonell, P.; Vanlauwe, B.; Giller, K.E. Nitrogen and phosphorus capture and recovery efficiencies, and crop responses to a range of soil fertility management strategies in sub-Saharan Africa. In Innovations as Key to the Green Revolution in Africa; Springer: Berlin/Heidelberg, Germany, 2011; pp. 571–589. [Google Scholar] [CrossRef] [Green Version]
  60. Agyin-Birikorang, S.; Tindjina, I.; Boubakary, C.; Dogbe, W.; Singh, U. Resilient rice fertilization strategy for submergence-prone savanna agro-ecological zones of Northern Ghana. J. Plant Nutr. 2020, 43, 965–986. [Google Scholar] [CrossRef]
  61. Tovihoudji, P.G.; Akponikpè, P.I.; Adjogboto, A.; Djenontin, J.A.; Agbossou, E.K.; Bielders, C.L. Combining hill-placed manure and mineral fertilizer enhances maize productivity and profitability in northern Benin. Nutr. Cycl. Agroecosyst. 2018, 110, 375–393. [Google Scholar] [CrossRef]
  62. Njoroge, R.; Otinga, A.N.; Okalebo, J.R.; Pepela, M.; Merckx, R. Maize (Zea mays L.) response to secondary and micronutrients for profitable N, P and K fertilizer use in poorly responsive soils. Agronomy 2018, 8, 49. [Google Scholar] [CrossRef] [Green Version]
  63. Sohi, S.P.; Krull, E.; Lopez-Capel, E.; Bol, R. A review of biochar and its use and function in soil. Adv. Agron. 2010, 105, 47–82. [Google Scholar] [CrossRef]
  64. Adjei-Nsiah, S.; Leeuwis, C.; Sakyi-Dawson, O.; Giller, K.; Kuyper, T. Exploring diversity among farmers for orienting inter-disciplinary action research on cropping system management in Wenchi, Ghana: The significance of time horizons. Int. J. Agric. Sustain. 2007, 5, 176–194. [Google Scholar] [CrossRef]
Figure 1. Dynamics of minimum and maximum temperatures over the cropping period (2012–2014) at Kpong, Ghana. The 1st and 3rd cropping cycles were from July to November while the 2nd and 4th cropping cycles spanned the period December to April.
Agronomy 10 00904 g001
Figure 2. Effects of N fertilizer and sowing time on the number of days rice plants took to flower and mature in the 2013–2014 cropping cycle at Kpong, Ghana. DAT: Days after Transplanting. The 3rd cropping cycle was from July to November while the 4th cropping cycles spanned the period December to April.
Agronomy 10 00904 g002
Figure 3. Effect of biochar (10 t·ha−1) and nitrogen fertilizer (kg·ha−1) on the nutrient uptake in rice straw under irrigated conditions over 4 cropping cycles at Kpong Ghana. Error bars are standard deviations of the means. The 1st and 3rd cropping cycles were from July to November while the 2nd and 4th cropping cycles spanned the period December to April.
Agronomy 10 00904 g003
Figure 4. Effect of biochar (10 t·ha−1) and nitrogen fertilizer (kg·ha−1) on the nutrient uptake in rice grain under irrigated conditions over 4 cropping cycles, at Kpong, Ghana. Error bars are standard deviations of the means. The 1st and 3rd cropping cycles were from July to November while the 2nd and 4th cropping cycles spanned the period December to April.
Agronomy 10 00904 g004
Figure 5. Gross margins (GM) of biochar (10 t·ha−1) and nitrogen fertilizer (kg·ha−1) used in irrigated rice over 4 cropping cycles (2012–2014) at Kpong, Ghana. Error bars are standard deviations of the means. The 1st and 3rd cropping cycles were from July to November while the 2nd and 4th cropping cycles spanned the period December to April.
Agronomy 10 00904 g005
Figure 6. Value Cost Ratio (VCR) of biochar (10 t·ha−1) and nitrogen fertilizer (kg·ha−1) used in irrigated rice over 4 cropping cycles (2012–2014) at Kpong, Ghana. Error bars are standard deviations of the means. The 1st and 3rd cropping cycles were from July to November while the 2nd and 4th cropping cycles spanned the period December to April.
Agronomy 10 00904 g006
Table 1. Production costs for irrigated rice using rice-husk biochar and fertilizer (2012–2014) in Kpong, Ghana.
ItemsPer Cycle (US$)
Labor cost
Biochar preparation (tonne−1)17
Herbicide application (ha−1)42
Transplanting (ha−1)83
Irrigation (ha−1)83
Fertilizer application (ha−1)21
Biochar application (ha−1)21
Scaring birds (ha−1)83
Drying & bagging (ha−1)42
Input cost
Cost of water for irrigation (ha−1)83
Cost of herbicides
2 L of 2-4-D (ha−1)8
4 litters of Bounty (ha−1)42
Fertilizer Cost
NPK 15:15:15 (kg−1)0.37
Urea (kg−1)0.31
Rice seed (ha−1)37
Other cost
Ploughing (ha−1)125
Cost of mechanized harvesting (ha−1)117
Land rental (ha−1)62
Selling price of rice (US$ tonne−1)430
Average exchange rate during the study period was 1US$ = GHS 2.402 [40].
Table 2. Physico–Chemical Properties of the rice husk biochar.
ParameterRice HuskRice Husk Biochar
Bulk density (g·cm−3)0.130.22
pH (H2O)5.906.60
Total C (g·kg−1)340384
Total N (g·kg−1)7.10.80
K (cmolc·kg−1)0.380.53
Na (cmolc·kg−1)0.901.17
Available P (mg·kg−1)np1620
Exchangeable Ca (cmolc·kg−1)0.320.61
Exchangeable Mg (cmolc·kg−1)0.220.36
CEC (cmolc·kg−1)np20.30
CEC = Cation exchange capacity; Total C = Total carbon; np = not present.
Table 3. Physico–chemical Properties of the soil used for the experiment.
Soil DepthBulk DensityParticle Size DistributionpH OCTN
SandSiltClay
(cm)(g·cm−3)(g·kg−1)(H2O)(g·kg−1)
0–151.37 (0.03)298 (27)122 (37)580 (36)6.90 (0.30)6.7 (0.7)0.6 (0.1)
15–301.45 (0.04)284 (33)96 (38)621 (54)7.10 (0.20)5.3 (0.4)0.5 (0.1)
30–451.64 (0.03)251 (27)129 (31)620 (33)7.10 (0.20)4.5 (0.4)0.5 (0.1)
Exchangeable bases
TPAv. PKNaCaMgCEC
(mg·kg−1)(cmol·kg−1)
0–15241.0 (18)5.43 (0.56)0.51 (0.14)0.90 (0.19)21.06 (2.92)10.13 (1.80)37.22 (4.74)
15–30241.0 (14)4.25 (0.30)0.59 (0.18)0.94 (0.24)17.70 (2.35)12.27 (2.86)36.81 (4.43)
30–45207 (11)3.48 (0.34)0.30 (0.12)0.73 (0.14)17.20 (3.54)10.67 (2.83)31.68 (3.74)
OC = organic carbon; TN = total nitrogen; TP = total phosphorus; Av P = available phosphorus; CEC = Cation Exchange Capacity; figures in brackets are standard deviations of the means.
Table 4. Summary of the mixed-model repeated measures analysis of variance on all variables (yield, nutrient uptake, nutrient use and economic indicators) over the four cropping cycles.
VariablesSources of Variation (p Values)
Cropping Cycle (C)Biochar (B)Nitrogen (N)C × BC × NB × NC × B × N
Root volume (cm3) <0.001<0.001<0.001<0.0010.006<0.001<0.001
Grain yield (t·ha−1)<0.001<0.001<0.0010.029<0.0010.0040.401
Straw yield (t·ha−1)<0.001<0.001<0.001<0.001<0.0010.003<0.001
Grain filling (%)<0.0010.988<0.0010.021<0.0010.0340.343
Grain N (kg·ha−1)<0.001<0.001<0.001<0.0010.004<0.0010.001
Grain P (kg·ha−1)<0.001<0.001<0.0010.001<0.001<0.0010.484
Grain K (kg·ha−1)<0.001<0.001<0.0010.0990.012<0.0010.724
Straw N (kg·ha−1)<0.001<0.001<0.0010.0370.0050.0300.010
Straw P (kg·ha−1)<0.001<0.001<0.001<0.001<0.001<0.001<0.001
Straw K (kg·ha−1)<0.001<0.001<0.0010.002<0.001<0.001<0.001
AEN (kg·grain·kg−1·N)0.0010.022<0.0010.3070.9390.8280.996
ARE (kg·grain·kg−1·N)0.002<0.001<0.0010.1811.0000.9330.977
GM (USD·ha−1)<0.001<0.001<0.0010.0400.0010.0110.644
GR (USD·ha−1)<0.001<0.001<0.0010.0400.0010.0110.644
VCR<0.001<0.001<0.001<0.0010.0030.032<0.001
Table 5. Effect of soil amendment on root volume (cm3) at flowering stages of rice in the 1st and 2nd cropping cycles.
Biochar (t·ha−1)N Rate (kg·ha−1)Cycle 1 (Vol (cm3))Cycle 2 (Vol (cm3))
0023.00e20.87d
4531.67d37.67c
9035.33c39.33c
12038.67b50.00b
10022.67e36.00c
4532.30cd37.67c
9041.33b51.67b
12048.00a60.33a
pvalue (5%)
Biochar (B) <0.001<0.001
N rates (N) <0.001<0.001
B × N <0.0010.002
Means having letter in common under each year are not significantly different (p ≤ 0.05). Vol is root volume.
Table 6. Effect of soil amendment on grain and straw yield and proportion of grain filled of rice.
Biochar (t·ha−1)N Rate (kg·ha−1)Grain Yield (t·ha−1)Straw Yield (t·ha−1)Grain Filling (%)
Cycle 1Cycle 2Cycle 3Cycle 4Cycle 1Cycle 2Cycle 3Cycle 4Cycle 1Cycle 2Cycle 3Cycle 4
002.58f2.33g2.83f2.42g3.81f3.40d3.92d3.91d88.60a79.17ab86.93ab77.43ab
453.68d3.33e3.93d3.22ef4.78e3.68d4.65c4.92c87.80ab78.23bc87.13a76.90abc
904.49c3.89d4.83bc3.84cd6.44c5.74b5.25b5.68ab85.10cd78.23bc84.80d75.33cd
1204.67c4.23bc5.05b4.26bc7.42b6.60a6.24a5.94a84.20d75.67d83.68e75.67cd
1002.99e2.84f3.29e2.72fg3.70f3.72d4.20d4.31d89.27a79.77a86.17bc78.37a
454.40c3.94cd4.51c3.67de5.43d5.07c5.46b5.24bc86.80bc78.47ab85.63cd76.47bcd
905.24b4.37b5.47a4.40ab7.77b5.23bc6.37a5.48b85.87cd78.13bc85.00d76.47bcd
1206.03a4.85a5.82a4.85a8.60a6.56a6.51a6.07a84.13d76.97c82.47f74.87d
p value (5%)
Biochar (B) <0.001<0.001<0.0010.002<0.0010.062<0.0010.1360.8110.1060.0010.560
N rates (N) <0.001<0.001<0.001<0.001<0.001<0.001<0.001<0.001<0.001<0.001<0.001<0.001
B × N 0.0010.8140.705<0.827<0.0010.0020.0090.2200.3840.4090.0520.172
Means having letter in common under each year are not significantly different (p ≤ 0.05).
Table 7. Effect of biochar amendment and Nitrogen fertilization on agronomic efficiency (AEN) and Apparent Recovery Efficiency of Nitrogen (ARE) of rice for 4 consecutive cropping cycles.
Biochar (t·ha−1)N Rate (kg·ha−1)AEN (kg grain kg−1·N)ARE (%)
Cycle 1Cycle 2Cycle 3Cycle 4Cycle 1Cycle 2Cycle 3Cycle 4
04524c22b25c18b54ab48b57bc53ab
9021d17c22cd16b47bc43bc51cd50b
12017e16c19d15b41c38c47d45b
104540a36a37a33a64a57a70a58a
9030b23b29b19b62a50ab62ab48b
12029b21b25c20b58ab46bc60bc46b
p value (5%)
Biochar (B) <0.001<0.001<0.001<0.001<0.0010.004<0.0010.405
N rates (N) <0.001<0.001<0.001<0.0010.050.0080.0180.009
B × N 0.0020.0030.0410.010.6490.9340.9540.461
Means having letter in common under each year are not significantly different (p ≤ 0.05).
Table 8. Effect of rice husk biochar and inorganic fertilizer on soil (0–15 cm) chemical properties.
Biochar (t·ha−1)N Rate (kg·ha−1)Avail. P (mg·kg−1)CEC (cmol·kg−1)SOC (g·kg−1)TN (g·kg−1)TP (mg·kg−1)pH
InitialFinalInitialFinalInitialFinalInitialFinalInitialFinalInitialFinal
005.435.6b3737c6.76.7b0.60.51b241256c6.66.6a
1206.3b38bc7.1b0.57ab278c 6.6a
1007.7a41ab8.2a0.64a300b6.8a
1208.1a44a9.3a0.68a339a6.8a
p value (5%)
Biochar (B) <0.001 <0.001 <0.001 0.004 0.002 0.010
N rates (N) 0.163 0.049 <0.001 0.086 <0.001 0.551
B × N 0.958 0.144 0.201 0.679 0.185 0.631
Means having letters in common under each column are not significantly different (p ≤ 0.05). TP, Avail. P are total P and available P respectively.

