Abstract
During four consecutive growing seasons (2014–2018), field experiments were conducted in the North China to determine winter wheat production function. The field experiments were carried out using winter wheat subjected to four N levels (N120, N180, N240, and N300) and three irrigation levels (If, I0.8f, and I0.6f). The main aims were to characterize winter wheat productivity, drought response factor Ky, and the winter wheat grain yield production functions in relation to water supply under the different N fertilizer levels. The amount of water supply (rain + irrigation) were 326–434, 333–441, 384–492, and 332–440 mm in 2014–2015, 2015–2016, 2016–2017, and 2017–2018 growing seasons, respectively. Similarly, the values of ETa (including the contribution from soil water storage) were 413–466, 384–468, 401–466, and 417–467 mm in 2014–2015, 2015–2016, 2016–2017, and 2017–2018, respectively. ETa increased as the amount of irrigation increased. The average values of If, I0.8f, and I0.6f over the four growing seasons were 459–465, 432–446, and 404–413 mm, respectively. For the same amount of irrigation, there was only small difference in ETa among different nitrogen levels; for the three irrigation levels, the values of ETa in N120, N180, N240, and N300 ranged from 384 to 466, 384 to 466, 385 to 467, and 407 to 468 mm, respectively. Water productivity values ranged from 1.69 to 2.50 kg m−3 for (rain + irrigation) and 1.45 to 2.05 kg·m−3 for ETa. The Ky linearly decreased with the increase in nitrogen amount, and the values of r were greater than 0.92. The values of Ky for winter wheat in N120, N180, N240, and N300 were 1.54, 1.41, 1.28, and 1.25, respectively. The mean value of Ky for winter wheat over the three irrigation levels and the four nitrogen levels was 1.37 (r = 0.95). In summary, to gain higher grain yield and WUE, optimal combination of N fertilizer of 180–240 kg·ha−1 and irrigation quota of 36–45 mm per irrigation should be applied for winter wheat with drip fertigation in the North China Plain.
1. Introduction
Agricultural irrigation, which is the top water consumer in the world, is essential for intensification of food production. The North China Plain (NCP) is the main agricultural production region in China, which contributes 48% and 39% of the national wheat and maize production, respectively [1]. Winter wheat consumes 80% of irrigation water in the NCP [2]. With the reduction of fresh water resources and mismanagement of nitrogen fertilizer application rates in the NCP, which are bringing potential threats to groundwater security [3], drip irrigation with high water and nitrogen use efficiency of irrigation water and fertilizer, respectively, has been used widely for wheat production in this region [4,5,6]. However, the abundant harvest in previous years under water-saving irrigation technologies still resulted in a further decline in the groundwater table and seriously affected the ecoenvironment [7]. With the rapid economic development, the urban and ecological water for the cities and the environment is increasing [8]. In order to avert the imbalance between the supply and demand for agricultural water and maintain high yield level and sustainable development of local agriculture, it is vital that irrigation and nitrogen management is optimized.
Crop-water production functions, which expresses the relationship between the crop yield (biomass yield, grain yield, and lint yield) and crop water use during the growing season, are important tools for quantifying effects of water scarcity on agricultural production [9]. It helps to mathematically describe how crop yields respond to variable irrigation water inputs and determine the value for irrigation water. Limited and declining water availability in the NCP, where irrigation is practiced, evokes the need for deficit irrigation. Crop water production function is necessary for deficit irrigation scheduling.
The objectives of this study were to determine (i) winter wheat productivity under different water and N fertilizer applied with drip irrigation; (ii) winter wheat-yield responses to water and nitrogen fertilizer, and (iii) water use efficiency and yield response factor for winter wheat under different supplies of water and nitrogen fertilizer.
2. Materials and Methods
2.1. Study Site
Field experiments were conducted during the winter wheat growing seasons from 2014 to 2018 at the Experimental Station of Chinese Academy of Agricultural Science (CAAS), located at Qiliying (35°08′ N, 113°45′ E and 81 m altitude), Xinxiang City of Henan Province, China. The mean annual rainfall (1951–2014 climate data) at the station is 578 mm of which only 28% (162 mm) occurs during the winter wheat growing season (October to June), and the mean annual temperature is 14 °C. The climatic data for the four consecutive seasons from 2014 to 2018 are shown in Table 1. The soil texture is a loam and other soil physical parameters are shown in Table 2. The 0–100 cm soil layer was sampled to determine the basic properties before the establishment of this experiment. The total N, Olsen-P, exchangeable K, and soil organic matter content of the experimental soil of 0–40 cm layer was 11 g kg−1, 24.5 mg kg−1, 129.6 mg kg−1, and 10.7 g kg−1, respectively. Soil pH and electrical conductivity were 8.5 and 252.6 μs cm−1, respectively. The groundwater level was more than 6 m in the experiment field.

Table 1.
Mean 10-day values of reference evapotranspiration (ET0, mm d−1), maximum temperature (Tmax, °C), minimum temperature (Tmin, °C), sunshine (Sun., h), and wind speed (u2, m s−1) during the four wheat seasons from 2014 to 2018.

Table 2.
Physical properties of the experimental soil.
2.2. Experimental Design
Factorial experimental design of three irrigation levels and four N-fertilizer rates, resulting in 12 treatments, replicated three times, was setup. The 36 plots were established in a split plot design, with irrigation treatments as the main plots and N fertilizer rates as the subplots. Plot area was 3 m × 10 m. Three irrigation levels were designed to meet at least the crop water requirement (If, leading to a stress-free soil water status), i.e., reduced irrigation equaling 80% of If (I0.8f) and 60% of If (I0.6f); three irrigation levels of 45, 36, and 27 mm per irrigation for If, I0.8f, and I0.6f, respectively were set. Irrigation scheduling was on the basis of crop evapotranspiration minus precipitation (ETa − P), irrigation was carried out whenever ETa − P reaches to 45 mm (calculated with Equation (1)), and all treatments were irrigated at same time. Readers are referred to the FAO-56 for detailed description of the dual crop coefficient procedure [10]. The four N-fertilizer rates were (i) 120 kg N ha−1 (N120), (ii) 180 kg N ha−1 (N180), (iii) 240 kg N ha−1 (N240), and (iv) 300 kg N ha−1 (N300). The type of the chemical N fertilizer was urea.
where, If is irrigation requirement for full irrigation treatment (mm); ETa is actual evapotranspiration for the winter wheat (mm); P is precipitation (mm); ET0 is reference crop evapotranspiration (mm); Ks is water stress coefficient; Kcb is basal crop coefficient; and Ke is soil water evaporation coefficient.
2.3. Cultivation Practices
The winter wheat variety of Aikang-58 (Triticum aestivum L.) was similarly managed over the four-season experiment. Field and crop management for the winter wheat are shown in Table 3. The conventional tillage practices were employed in our study. Wheat straw was mulched on soil surface after the wheat harvest and maize straw was returned into soil. Before the winter wheat sowing, the basal fertilizers and crushed maize stalks were incorporated into the soil with a tractor-drawn rotary cultivator (25 cm depth), and larger soil clods were smoothed using a harrow to ensure a completely flat bed. Weeds and pests were controlled using standard management practices by application of herbicides and pesticides.

Table 3.
Field and crop management for the winter wheat from 2014 to 2018.
Soil water content data and crop data in the treatment of N300If was used to determine irrigation scheduling with the dual crop coefficient procedure. After the wheat sowing, irrigation was carried out according to the schedule (Table 3). An artificially controlled system of drip fertigation was designed and installed prior to wheat sowing in 2013. Surface drip irrigation was used. Each drip irrigation treatment was operated by a control valve. Drip irrigation laterals measured 16 mm in diameter, and the emitters were the inline type, placed 30 cm apart, and were pressure-compensating with a flow rate of 2.2 L h−1. Based on our previous results, the laterals in a north–south direction were spaced at 0.6 m. Water was filtered using a 152-mm diameter screen filter with a 150-mesh screen. Each plot had a mechanical flow meter and valve and a polypropylene tank for soluble urea.
N, P, and K fertilizers were applied using urea (46% N), calcium superphosphate (16% P2O5), and potassium sulfate (50% K2O). The rates of phosphorus and potassium fertilizer were the same in all plots, applied as basal fertilizer once before the winter wheat sowing. The rate of phosphorus was 90 kg P2O5 ha−1, whereas the rate of potassium was 105 kg K2O ha−1. Before the winter wheat sowing, for the treatments of N120-N300, 50% of nitrogen fertilizer was broadcast with the basal P and K fertilizers over each plot, and it was then immediately ploughed into the soil to avoid nitrogen volatilization. The remaining 50% of N was applied by drip fertigation during the regreening stage to the flowering stage (12 February 2015, 17 April 2015, 19 March 2016, 14 April 2016, 20 March 2017, 26 April 2017, 8 March 2018, and 26 April 2018) for the winter wheat season.
2.4. Measurements
Actual evapotranspiration (ETa) was estimated using the soil water balance equation as follows [11]:
where ETa is the total water use during the growing stage (mm), P is precipitation (mm), I is irrigation (mm), ΔW is soil water content at starting minus that at the ending of the growing stage for a given soil depth (mm), R is surface runoff, D is water drainage from the root zone (mm), and CR is capillary rise to the root zone. The soil water balance equation was calculated in 10-day step. R and CR were negligible and were not considered because the groundwater table was at least 6 m below the surface at experiment site. Drainage from the root zone was calculated based on the relation of unsaturated water conductivity using the volumetric soil moisture at 1.2 m in the soil profile [12].
Soil water content (SWC) was measured with the TRIME-PICO (T3/IPH44, IMKO, Germany) by in situ monitoring of volumetric moisture in soils to the depth of 100–120 cm with an interval of 0.2 m depth. Soil moisture monitoring access tubes were inserted in each subplots for all three replications. The SWC of the top 0–20 cm soil layer was observed with gravimetric method and then converted into volumetric contents by multiplying with soil bulk density of respective depth.
Water productivity (WP) is calculated as follows:
where, Ya is the grain yield of winter wheat (kg ha−1). At grain maturity, three 2 m2 areas of plants in each plot were sampled to determine grain yield.
Water production function is determined as follows:
where Ya and ETa are the actual harvest grain yield (kg ha−1) and actual evapotranspiration (mm) during growing season, Ym and ETm are the maximum grain yield (kg ha−1) and maximum actual evapotranspiration (mm) during growing season, and Ky is a yield response factor.
2.5. Statistical Analyses
Statistical analyses were performed using the SPSS 21.0 program (SPSS, Inc., Chicago, IL, USA). Analysis of variance (ANOVA) was used to analyze differences of ETa, grain yield, and water productivity among different treatments at α = 0.05 level.
3. Results
3.1. Climate and ETa
The temperature decreases gradually during the growing season reaching the minimum during wintering period, whereas it rises gradually reaching peak in the first week of June. Average value of Tmax and Tmin over the winter wheat season from 2014 to 2018 ranged from 4.85 to 16.38 °C and 5.60 to 6.51 °C, respectively (Table 1). Total value of ET0 in the winter wheat growing seasons during 2014–2018 was 648, 601, 627, and 623 mm, respectively; the corresponding daily evapotranspiration values were 2.8, 2.6, 2.7, and 2.7 mm d−1. The accumulated rainfall in the four seasons is shown in Figure 1. The precipitation values during the four consecutive seasons of 2014–2018 of the winter wheat were 164, 171, 222, and 170 mm, respectively, which were greater than the historic average of 161 mm (1951–2014); especially, there was 61 mm increase during the winter wheat growing season in 2016–2017.
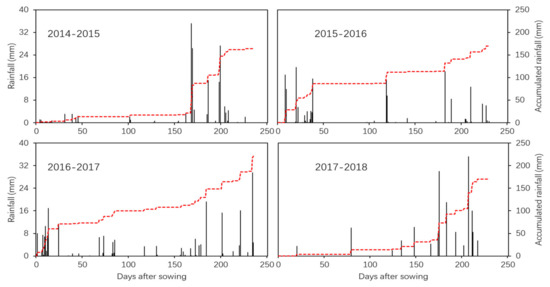
Figure 1.
Accumulated rainfall in the winter wheat growing seasons from 2014 to 2018.
ETa of winter wheat in the seasons from 2014 to 2018 are present in Figure 2. ETa increased with irrigation amount increased. The average value in If, I0.8f, and I0.6f over the four seasons was 461, 438, and 408 mm, respectively. For the three irrigation levels (If, I0.8f, and I0.6f), the values of ETa in N120, N180, N240, and N300 ranged from 384.4 to 465.8 mm, from 384.4 to 465.9 mm, from 385.1 to 467.1 mm, and from 406.8 to 468.1 mm, respectively. Under the same condition of irrigation treatment, quite small difference in ETa among nitrogen levels were observed, although ETa increased with the increase with the nitrogen applied. For the three irrigation levels (If, I0.8f, and I0.6f), the values of ETa with different N ranged from 446.2 to 467.1 mm, from 413.4 to 448.6 mm, and from 384.4 to 423.2 mm.
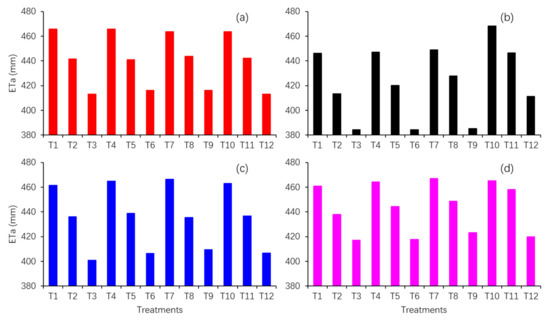
Figure 2.
Actual evapotranspiration (ETa) of winter wheat in the seasons: (a) 2014–2015, (b) 2015–2016, (c) 2016–2017, and (d) 2017–2018. T1, T2, and T3 were If, I0.8f, and I0.6f, respectively (N120); T4, T5, and T6 were If, I0.8f, and I0.6f, respectively (N160); T7, T8, and T9 were If, I0.8f, and I0.6f, respectively (N200); and T10, T11, and T12 were If, I0.8f, and I0.6f, respectively (N240).
3.2. Relationships between ETa and Grain Yield
The objective of this study was to determine the appropriate irrigation scheduling to increase grain yield (Y) per unit of irrigated water. The grain yield calculated at harvest from each treatment is given in Table 4. Statistical analysis showed that irrigation and N levels both had significant effect on Y in all growing seasons (α = 0.01). The grain yield rose significantly with an increase of nitrogen application rate from N120 to N180, but there was no significant difference for grain yield with different N levels until nitrogen application reached 180 Kg·ha−1 (Table 4). Under all nitrogen application rates, the order of grain yield was always If >I0.8f > I0.6f (Table 4). The results of four growing seasons indicated that grain yield showed no significant difference for irrigation levels of If and I0.8f, but there was the significant difference for the irrigation levels of I0.8f and I0.6f.

Table 4.
Grain yield, Eta, and WUE of winter wheat with different treatments from 2014 to 2018.
The relationships between yield and ETa, i.e., crop water production functions, for winter wheat with different irrigation amounts and nitrogen levels are shown in Figure 3. The quadratic curves were fitted to the crop water production functions with the data from all treatments. The regression models are presented in Figure 3. The correlation coefficients were greater than 0.70, as there was little variability in seasonal precipitation. With combination of the data obtained from all treatments, the model of crop water production function for winter wheat under fertigated drip irrigation was developed as:
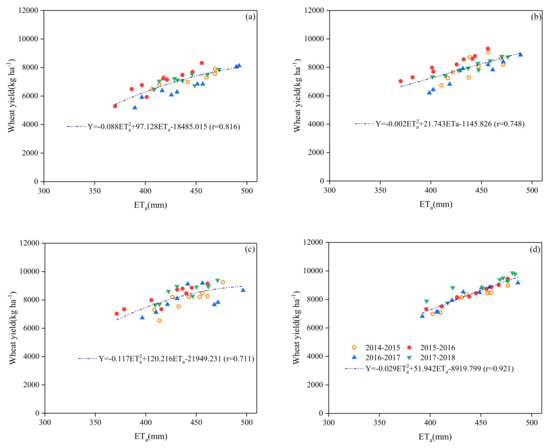
Figure 3.
Relationships between ETa and wheat yield in the treatment of N120 (a), N180 (b), N240 (c), and N300 (d) in the four consecutive seasons from 2014 to 2018.
Relationships between ETa and grain yield reduction were fitted to the linear model for different treatments (Figure 4). The grain yield for winter wheat reduced as ETa increased in N120, N180, N240, whereas the value improved as ETa increased in N300. For the treatments of N120, N180, N240, and N300, winter wheat grain yield decreased at a rate of 0.279, 0.246, 0.202, and 0.261% mm−1, respectively; the corresponding values of the ETm were 479.1, 483.5, 492.0 and 480.7 mm, respectively. With the combination of data from all the treatments, it could be concluded that ETa higher than 483.5 mm resulted in no further decrease in winter wheat yield.
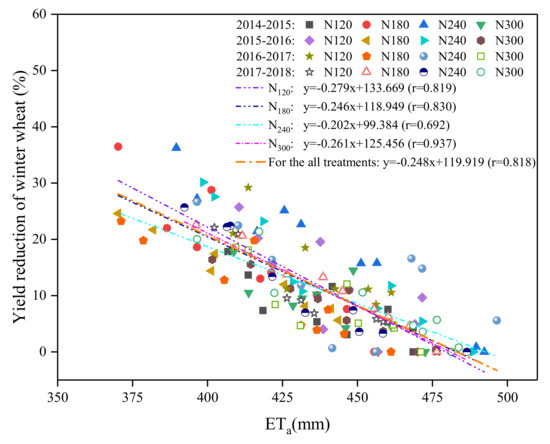
Figure 4.
Relationships between ETa and wheat yield reduction in the different treatments over the four consecutive wheat seasons from 2014 to 2018.
The values of Ky, i.e., the yield response factor, for winter wheat in different treatments are shown in Figure 5. The Ky linearly reduced with the increase in nitrogen amount, and the values of r were greater than 0.92. The value of Ky for winter wheat in N120, N180, N240, and N300 were 1.534, 1.410, 1.275, and 1.250, respectively. The average value of Ky for winter wheat over the three irrigation levels and the four nitrogen levels was 1.368 (r = 0.952).

Figure 5.
Yield response factors (Ky) in the different treatments over the four consecutive wheat seasons from 2014 to 2018.
3.3. Water Productivity
Water productivity (WP) of winter wheat varied with the amounts of irrigation water and nitrogen fertilizer (Figure 6). Generally, WP was improved with the increase in irrigation water and nitrogen amount. The minimum WP of 1.45 kg m−3 was observed in the treatment of N120 + I0.6f in the 2016–2017 winter wheat growing season, while the maximum value of 1.99 kg m−3 was obtained in the treatment of N180 + If in the 2015–2016 winter wheat growing season. The average values of WP in N120, N180, N240, and N300 under different irrigation levels were 1.61, 1.84, 1.85, and 1.88 kg m−3, respectively. The average value of WP in N120 was significantly lower than that in the other treatments of nitrogen amount (p < 0.05), while the differences in WP values between the treatments of N180, N240, and N300 were not significant. WP in If, I0.8f, and I0.6f over the four seasons were 1.82, 1.81, and 1.76 kg m−3, respectively. WP of winter wheat in If and I0.8f was significantly greater than that in I0.6f (p < 0.05), whereas the insignificant difference was observed between If and I0.8f.
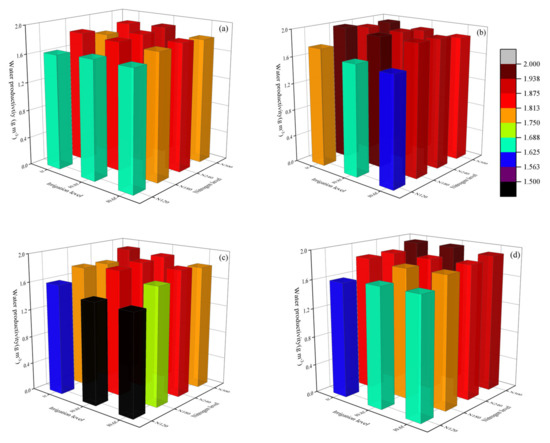
Figure 6.
Water productivity of winter wheat in the season of (a) 2014–2015, (b) 2015–2016, (c) 2016–2017, and (d) 2017–2018.
4. Discussion
The results from the analysis of weather data observed throughout the winter wheat growing seasons indicate that (1) the air temperature is quite different in four growing seasons; (2) the total value of the ET0 in 2014–2015 was typically higher than that of the other growing seasons for winter wheat; and (3) the total value of precipitation during 2016–2017 growing season was higher than the average for the growing seasons, that is, with moister air conditions than usually growing seasons for winter wheat in experiment field site.
The average value of the ETa was 458 mm for winter wheat under well-watered condition from 1999 to 2009 [13], and the value ranged from 433 to 486 mm with drip irrigation based on the two growing seasons experiments in the same region [6]. The evapotranspiration values were significantly different under different irrigation treatments in different growing seasons (Figure 2). The values of ETa in If, I0.8f, and I0.6f were 461.4, 438.3, and 407.8 mm, respectively. This means that the value of season evapotranspiration for winter wheat is lower; this study with drip irrigation was based on three irrigation water rates and four fertilization rates.
In this study region, based on three seasons results, Bai et al. (2020) indicated that winter wheat grain yield (the average value was 7337.7 kg·ha−1) could be achieved under drip irrigation with 403 N kg·ha−1 [14]. Jha et al. (2019) reported that maximum winter wheat grain yield (the average value was 9270 kg·ha−1) could only be achieved only if the soil water content in the root zone would not drop below 60% FC [6]. The results found in this study indicates that the highest grain yield was achieved in the treatments with full irrigation and 240–300 N kg·ha−1 fertigation
The relationship between yield and ETa has been shown to be linear [15,16,17,18] and quadratic [19,20,21]. As shown in Figure 3, the relationships between ETa and grain yield for winter wheat under different fertilization rates in the four growing seasons was found to be quadratic. In a study conducted in the NCP, to determine the relationship between winter wheat grain yield and growing seasonal evapotranspiration under different irrigation treatments, Zhang et al. (2011) also found quadratic relationship.
The range of winter wheat grain yield obtained from different treatments in the experimental seasons would reflect the prevailing environmental conditions. This study shows that grain yield reduces with the reduced ETa in the same growing season. Figure 4 shows that grain yield reduction of winter wheat would decrease with the increase in ETa. Perhaps at lower soil water contents, fertilizer concentration prevents the crop from reaching its maximum growth and reduces the grain yield formation. This result is in agreement with similar studies in the environments in North China [6].
Similar trend lines were obtained for different irrigation levels and different fertilizer levels when the relative grain yield decrease was plotted against relative ETa decreases. The plot shows winter wheat sensitivity to soil water content. The average values of Ky for the four seasons were 1.53, 1.41, 1.28, and 1.25 under three irrigated levels (If, I0.8f, and I0.6f) and the four fertilizer levels (N120, N180, N240 and N300). The Ky values decrease with the increase in fertilizer levels as also reported by Bai (2020).
In the NCP, since the rainfall during the winter wheat growing season is low, the water supply for winter wheat comes mainly from irrigation and stored soil water. Grain yield and WUE for winter wheat would improve with increasing irrigation frequency under microirrigation [22]. Winter wheat grain yield increased significantly as the amount of fertilizer was increased from 20% to 70% and increased only slightly when the fertilizer suppled is higher than 70% [14]. In this study, higher yield and WUE were obtained under N180, N240, and N300 and If and I0.8f. The result shows that in order to get higher yield and WUE, N fertilizer of 180 to 300 kg ha−1 and irrigation supply of 80% to 100% of the full irrigation was needed to be applied.
5. Conclusions
Based on the results of the four growing seasons experiment, the grain yield decreased with the decrease of the amount of irrigation under each nitrogen fertilizer treatments, and there was no significant difference when the irrigation amount exceeded 80% of the irrigation requirement (ETa − P). The average yield reduction was 5–9%. For the same irrigation level, the average grain yields increase with the nitrogen fertilizer supply and there was no significant difference when the nitrogen fertilizer supply reached 180 kg N ha−1 for each irrigation level. In this study, nitrogen fertilization is not the major limiting factor to winter wheat grain yield with the nitrogen fertilizer supply exceeding 180 kg N ha−1.
This study shows that grain yield would be high under drip fertigation system in the region when the rates of fertilizer application are under 180–240 kg N ha−1, irrigation time is determined by ETa − P = 45 mm, and irrigation quota is under 36–45 mm (I0.8f − If). These results indicate that low mineral nitrogen supply by drip irrigation may meet the demand of wheat growth, whereas higher supply may lead to some nitrogen not taken-up by wheat, and thus, decrease the utilization efficiency. This shows that the cost–benefit of winter wheat nitrogen fertilization requires further research, especially for the winter wheat farming with drip fertigation.
Author Contributions
Conceptualization, X.S. and Y.G.; methodology, X.S.; investigation, X.S., G.W., and J.C.; data curation, X.S.; formal analysis, X.S.; visualization, X.S.; writing—original draft preparation, X.S. and Y.G.; writing—editing, Z.S., K.T.Z., and Y.G.; supervision, Y.G.; project administration, Y.G.; funding acquisition, Y.G. All authors have read and agreed to the published version of the manuscript.
Funding
This research was financially supported by the China Agricultural Research System (CARS-3), the National Natural Science Foundation of China (51879267), and the Special Scientific Research Fund of hydraulic Public-Welfare Profession of China (201501017).
Acknowledgments
This work is grateful to all the staff of the Qiliying Experimental Station of Chinese Academy of Agricultural Science (CAAS) for their help in obtaining the data. Special thanks go to the anonymous reviewers for their constructive comments in improving this manuscript.
Conflicts of Interest
The authors declare no conflict of interest.
References
- Huang, T.; Ju, X.; Yang, H. Nitrate leaching in a winter wheat-summer maize rotation on a calcareous soil as affected by nitrogen and straw management. Sci. Rep. 2017, 7, 42247. [Google Scholar] [CrossRef] [PubMed]
- Ning, D.; Li, Z.; Sun, W.; Ma, W.; Huang, S.; Zhao, B. Effects of water-saving irrigation on water consumption and photosynthetic characteristics of winter wheat in Huang-Huai-Hai area of China. Plant Nutr. Fertil. Sci. 2010, 16, 852–858. [Google Scholar]
- Wang, G.; Liang, Y.; Zhang, Q.; Jha, S.K.; Gao, Y.; Shen, X.; Sun, J.; Duan, A. Mitigated CH4 and N2O emissions and improved irrigation water use efficiency in winter wheat field with surface drip irrigation in the North China Plain. Agric. Water Manag. 2016, 163, 403–407. [Google Scholar] [CrossRef]
- Gao, Y.; Yang, L.; Shen, X.; Li, X.; Sun, J.; Duan, A.; Wu, L. Winter wheat with subsurface drip irrigation (SDI): Crop coefficients, water-use estimates, and effects of SDI on grain yield and water use efficiency. Agric. Water Manag. 2014, 146, 1–10. [Google Scholar] [CrossRef]
- Jha, S.K.; Gao, Y.; Liu, H.; Huang, Z.; Wang, G.; Liang, Y.; Duan, A. Root development and water uptake in winter wheat under different irrigation methods and scheduling for North China. Agric. Water Manag. 2017, 182, 139–150. [Google Scholar] [CrossRef]
- Jha, S.K.; Ramatshaba, T.S.; Wang, G.; Liang, Y.; Liu, H.; Gao, Y.; Duan, A. Response of growth, yield and water use efficiency of winter wheat to different irrigation methods and scheduling in North China Plain. Agric. Water Manag. 2019, 217, 292–302. [Google Scholar] [CrossRef]
- Institute of Geographic Sciences and Natural Resources Research (IGSNRR), Chinese Academy of Sciences. Thematic Database for Human-Earth System. Available online: http://wwwdataaccn/indexasp (accessed on 4 December 2016).
- McLaughlin, D.; Kinzelbach, W. Food security and sustainable resource management. Water Resour. Res. 2015, 51, 4966–4985. [Google Scholar] [CrossRef]
- Foster, T.; Brozović, N. Simulating Crop-Water Production Functions Using Crop Growth Models to Support Water Policy Assessments. Ecol. Econ. 2018, 152, 9–21. [Google Scholar] [CrossRef]
- Richard, G.A.; Luis, S.P.; Dirk, R.; Martin, S. Crop evapotranspiration—Guidelines for computing crop water requirements—FAO Irrigation and drainage paper 56. FAO Rome 1998, 300, D05109. [Google Scholar]
- Zhang, X.; Chen, S.; Sun, H.; Pei, D.; Wang, Y. Dry matter, harvest index, grain yield and water use efficiency as affected by water supply in winter wheat. Irrig. Sci. 2008, 27, 1–10. [Google Scholar] [CrossRef]
- Hillel, D. Environmental Soil Physics: Fundamentals, Applications, and Environmental Considerations; Academic Press: London, UK, 1998. [Google Scholar]
- Zhang, X.; Chen, S.; Sun, H.; Shao, L.; Wang, Y. Changes in evapotranspiration over irrigated winter wheat and maize in North China Plain over three decades. Agric. Water Manag. 2011, 98, 1097–1104. [Google Scholar] [CrossRef]
- Bai, S.; Kang, Y.; Wan, S. Drip fertigation regimes for winter wheat in the North China Plain. Agric. Water Manag. 2020, 228, 105885. [Google Scholar] [CrossRef]
- Ferreira, T.; Gonçalves, D. Crop-yield/water-use production functions of potatoes (Solanum tuberosum L.) grown under differential nitrogen and irrigation treatments in a hot, dry climate. Agric. Water Manag. 2007, 90, 45–55. [Google Scholar] [CrossRef]
- Igbadun, H.E.; Tarimo, A.K.; Salim, B.A.; Mahoo, H.F. Evaluation of selected crop water production functions for an irrigated maize crop. Agric. Water Manag. 2007, 94, 1–10. [Google Scholar] [CrossRef]
- Steduto, P.; Hsiao, T.C.; Fereres, E. On the conservative behavior of biomass water productivity. Irrig. Sci. 2007, 25, 189–207. [Google Scholar] [CrossRef]
- Zhang, B.; Feng, G.; Ahuja, L.R.; Kong, X.; Ouyang, Y.; Adeli, A.; Jenkins, J.N. Soybean crop-water production functions in a humid region across years and soils determined with APEX model. Agric. Water Manag. 2018, 204, 180–191. [Google Scholar] [CrossRef]
- Candogan, B.N.; Sincik, M.; Buyukcangaz, H.; Demirtas, C.; Goksoy, A.T.; Yazgan, S. Yield, quality and crop water stress index relationships for deficit-irrigated soybean [Glycine max (L.) Merr.] in sub-humid climatic conditions. Agric. Water Manag. 2013, 118, 113–121. [Google Scholar] [CrossRef]
- Song, J.; Li, J.; Yang, Q.; Mao, X.; Yang, J.; Wang, K. Multi-objective optimization and its application on irrigation scheduling based on AquaCrop and NSGA-II. J. Hydraul. Eng. 2018, 49, 1284–1295. [Google Scholar]
- Wang, J.; Pan, Z.; Pan, F.; He, D.; Pan, Y.; Han, G.; Huang, N.; Zhang, Z.; Yin, W.; Zhang, J.; et al. The regional water-conserving and yield-increasing characteristics and suitability of soil tillage practices in Northern China. Agric. Water Manag. 2020, 228, 105883. [Google Scholar] [CrossRef]
- Fang, Q.; Zhang, X.; Shao, L.; Chen, S.; Sun, H. Assessing the performance of different irrigation systems on winter wheat under limited water supply. Agric. Water Manag. 2018, 196, 133–143. [Google Scholar] [CrossRef]
© 2020 by the authors. Licensee MDPI, Basel, Switzerland. This article is an open access article distributed under the terms and conditions of the Creative Commons Attribution (CC BY) license (http://creativecommons.org/licenses/by/4.0/).