Assessment of Genetic Diversity of Edible Honeysuckle Monitored through RAPD in Relative to Bioactive Substances

 , , and
Abstract
1. Introduction
2. Materials and Methods
2.1. Biological Material
2.2. DNA Extraction
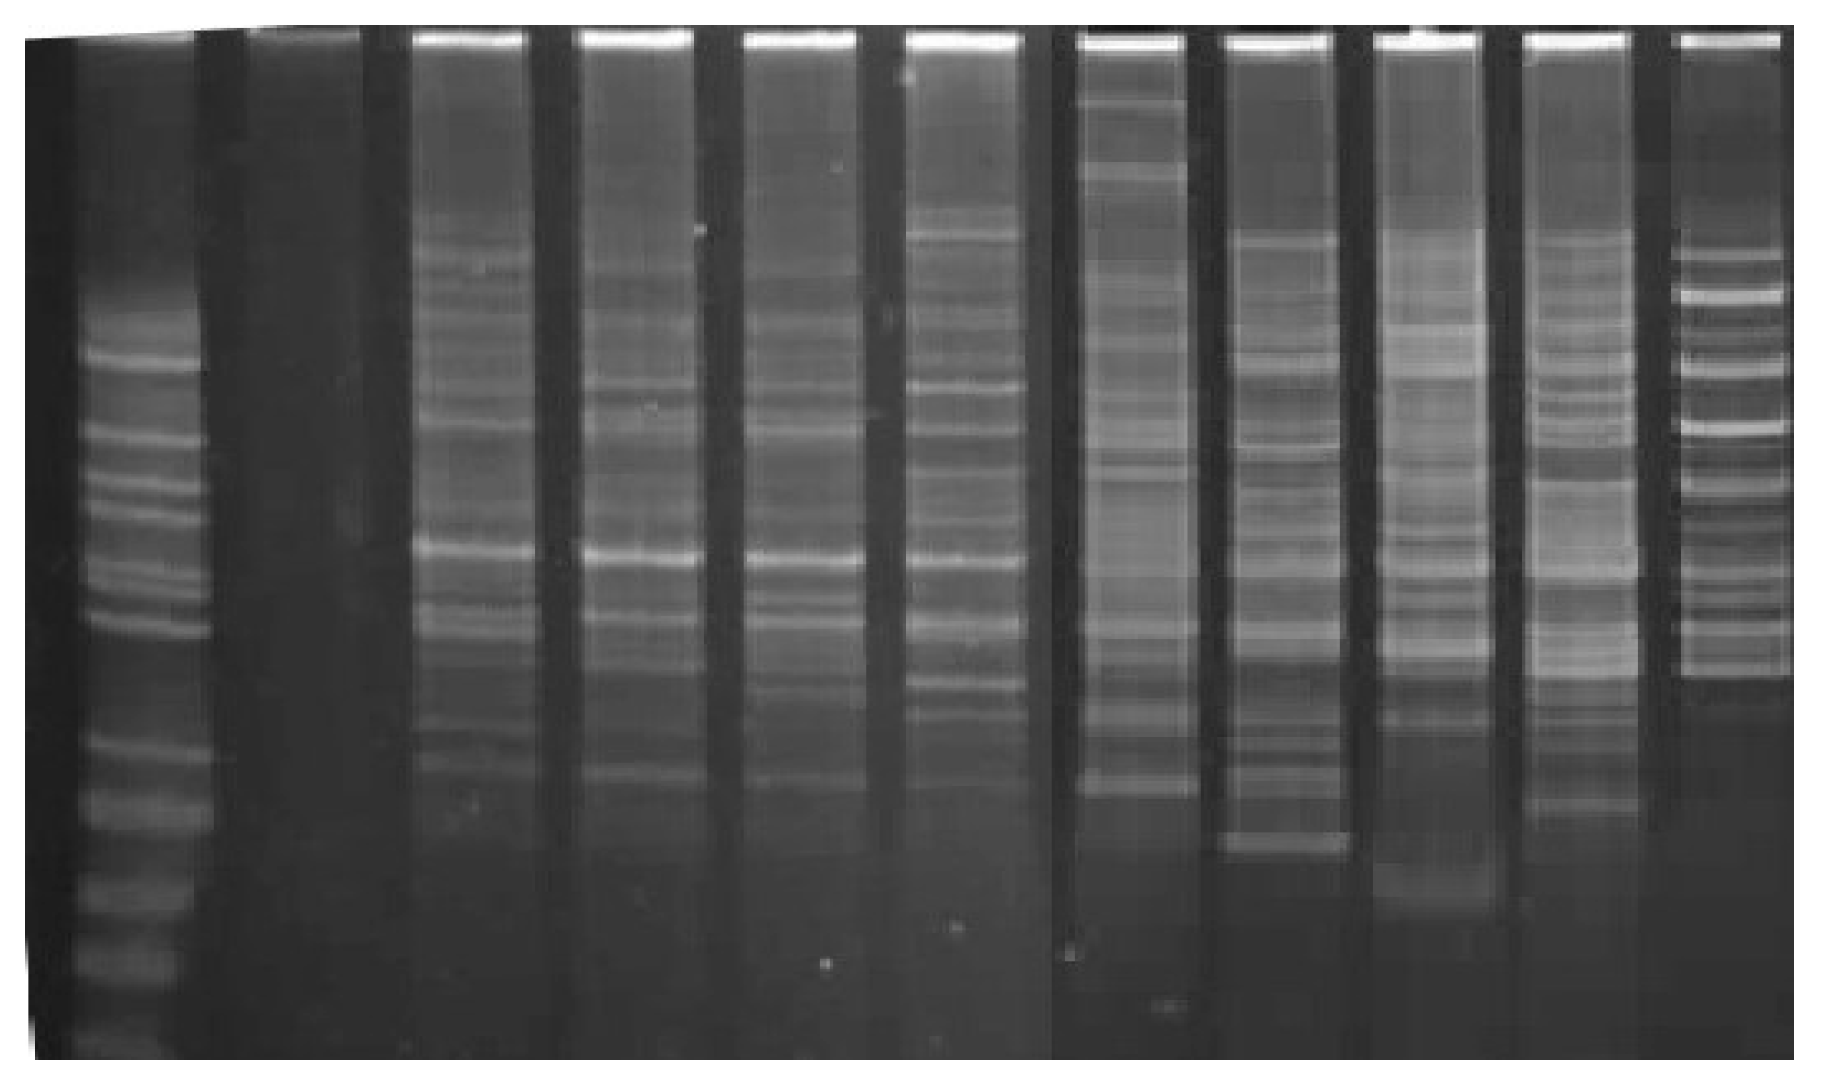
2.3. RAPD Amplification
2.4. Amplicon Analysis
2.5. Determination of Total Polyphenols Content (TPC) and Total Antioxidant Activity (TAA)
2.6. Statistical Analysis
3. Results
4. Discussion
5. Conclusions
Author Contributions
Funding
Conflicts of Interest
References
- Juríková, T.; Sochor, J.; Mlcek, J.; Balla, S.; Ercisli, S.; Durisova, L.; Kynicky, J. Polyphenolic Compounds and Antioxidant Activity in Berries of Four Russian Cultivars of Lonicera kamtschatica (Sevast.) Pojark. Erwerbs-Obstbau 2014, 56, 117–122. [Google Scholar]
- Juríková, T.; Rop, O.; Mlček, J.; Sochor, J.; Balla, S.; Szekeres, L.; Hegedusova, A.; Hubalek, J.; Adam, V.; Kizek, R. Phenolic Profile of Edible Honeysuckle Berries (Genus Lonicera) and Their Biological Effects. Molecules 2012, 17, 61–79. [Google Scholar] [CrossRef] [PubMed]
- Li, F.; Zhao, H.; Xu, R.; Zhang, X.; Zhang, W.; Du, M.; Liu, X.; Fan, L. Simultaneous optimization of the acidified water extraction for total anthocyanin content, total phenolic content, and antioxidant activity of blue honeysuckle berries (Lonicera caerulea L.) using response surface methodology. Food Sci. Nutr. 2019, 7, 2968–2976. [Google Scholar] [CrossRef] [PubMed]
- Lee, Y.S.; Cho, I.J.; Kim, J.W.; Lee, M.K.; Ku, S.K.; Choi, S.K.; Lee, H.J. Hepatoprotective effects of blue honeysuckle on CCl4—Induced acute liver damaged mice. Food Sci. Nutr. 2018, 7, 322–338. [Google Scholar] [CrossRef] [PubMed]
- Quiros, A.R.B.; Frecha-Ferreiro, S.; Vidal-Pérez, A.M.; López-Hernández, J. Antioxidant compounds in edible brown seaweeds. Eur. Food Res. Technol. 2010, 231, 495–498. [Google Scholar]
- Naugžemys, D.; Žilinskaite, S.; Kleizaite, V.; Skridaila, A.; Zvingila, D. Assesment of genetic variation among elite and wild germplasm of blue honeysuckle (Lonicera caerulea L.). Balt. For. 2011, 17, 8–16. [Google Scholar]
- Cehula, M.; Juríková, T.; Žiarovská, J.; Mlček, J.; Kyseľ, M. Evaluation of genetic diversity of edible honeysuckle monitored by RAPD in relation to bioactive substances. Potravin. Slovak J. Food Sci. 2019, 13, 490–496. [Google Scholar] [CrossRef][Green Version]
- Cheng, J.L.; Li, J.; Qiu, Y.M.; Wei, C.L.; Yang, L.Q.; Fu, J.J. Development of novel SCAR markers for genetic characterization of Lonicera japonica from high GC-RAMPPCR and DNA cloning. Genet. Mol. Res. 2016, 15. [Google Scholar] [CrossRef]
- Kaczmarska, E.; Gawroński, J.; Dyduch-Siemińska, M.; Najda, A.; Marecki, W.; Żebrowska, J. Genetic diversity and chemical characterization of selected Polish and Russian cultivars and clones of blue honeysuckle (Lonicera caerulea). Turk. J. Agric. For. 2015, 39, 394–402. [Google Scholar] [CrossRef]
- Sgorbini, B.; Cagliero, C.; Acquadro, S.; Marengo, A.; Cordero, C.; Liberto, E.; Bicchi, C.; Rubiolo, P. Evaluation of volatile bioactive secondary metabolites transfer from medicinal and aromatic plants to herbal teas: Comparison of different methods for the determination of transfer rate and human intake. J. Chromatogr. A 2019, 1594, 173–180. [Google Scholar] [CrossRef]
- Singh, P.K.; Singh, R.P.; Singh, P.; Singh, R.L. Chapter 2—Food Hazards: Physical, Chemical, and Biological. In Food Safety and Human Health, 1st ed.; Singh, R.L., Mondal, S., Eds.; Academic Press: London, UK, 2019; pp. 15–65. [Google Scholar]
- He, H.Y.; Zhang, D.; Quing, H.; Yang, Y. Analysis of the genetic diversity of Lonicera japonica Thumb. using inter-simple sequence repeat markers. Genet. Mol. Res. 2016, 16, 1–7. [Google Scholar] [CrossRef] [PubMed]
- Pan, L.; Zhao, Z.; He, Y.; Li, Y.; Liu, H.; Feng, T.; Zhou, Y. Genetic diversity among five species medicinal plants of Lonicera L. in Guizhou Province by SRAP molecular markers analysis. J. South. Agric. 2018, 49, 2349–2355. [Google Scholar]
- Ding, G.; Wang, Y.; Liu, A.; Hou, Y.; Zhang, T.; Bai, G.; Liu, C. From chemical markers to quality markers: An integrated approach of UPLC/Q-TOF, NIRS, and chemometrics for the quality assessment of honeysuckle buds. RSC Adv. 2017, 7, 22034–22044. [Google Scholar] [CrossRef]
- Truta, E.; Vochita, G.; Rosu, C.M.; Zamfirache, M.M.; Olteanu, Z.; Oprica, L. Karyotype traits in Romanian selections of edible blue honeysuckle. Turk. J. Biol. 2013, 37, 60–68. [Google Scholar]
- Schierenbeck, K.A.; Hamrick, J.L.; Mack, R.N. Comparison of allozyme variability in a native and an introduced species of Lonicera. Heredity 1995, 75, 1–9. [Google Scholar] [CrossRef][Green Version]
- Alberts, B.; Johnson, A.; Lewis, J.; Morgan, D.; Raff, M.; Roberts, K.; Walter, P. Cells and genomes. In Molecular Biology of the Cell, 6th ed.; Lewis, S.G., Zayatz, E., Eds.; Garland Science: New York, NY, USA, 2014; pp. 1–42. [Google Scholar]
- Li, Y.-J.; Chen, J.; Li, Y.; Li, P. Identification and quantification of free radical scavengers in the flower buds of Lonicera species by online HPLC—DPPH assay coupled with electrospray ionization quadrupole time—of—Flight tandem mass spectrometry. Biomed. Chrom. 2011, 26, 449–457. [Google Scholar] [CrossRef]
- Rogers, S.O.; Bendich, A.J. Extraction of total cellular DNA from plants, algae and fungi. In Plant Mol. Biol. Manual, 1st ed.; Gelvin, S.B., Schilperoort, R.A., Eds.; Springer: Dordrecht, Germany, 1994; pp. 183–190. [Google Scholar]
- Paulová, H.; Bochořáková, H.; Táborská, E. Metody stanovení antioxidační aktivity přírodních látek in vitro (Methods of determination of antioxidant activity of natural substances in vitro). Chem. Listy 2004, 98, 174–179, (In Czech language). [Google Scholar]
- Seo, O.N.; Kim, G.S.; Park, S.; Lee, J.H.; Kim, Y.H.; Lee, W.S.; Lee, S.J.; Kim, Y.; Jin, J.S.; Choi, S.K.; et al. Determination of polyphenol components of Lonicera japonica Thunb. using liquid chromatography–tandem mass spectrometry: Contribution to the overall antioxidant activity. Food Chem. 2012, 134, 572–577. [Google Scholar] [CrossRef]
- Pavel, A.B.; Vasile, C.I. PyElph—A software tool for gel images analysis and phylogenetics. BMC Bioinform. 2012, 13, 9. [Google Scholar] [CrossRef]
- Nei, M.; Li, W.H. Mathematical model for studying genetic variation in terms of restriction endonucleases. Proc. Natl. Acad. Sci. USA 1979, 76, 5269–5273. [Google Scholar] [CrossRef]
- Botstein, D.; White, R.L.; Skalnick, M.H.; Davies, R.W. Construction of a genetic linkage map in man using restriction fragment length polymorphism. Am. J. Hum. Genet. 1980, 32, 314–331. [Google Scholar] [PubMed]
- Chesnokov, Y.V.; Artemeyeva, A.M. Evaluation of the measure of polymorphism information of genetic diversity. Agric. Biol. 2015, 50, 571–578. [Google Scholar]
- Holubec, V.; Smekalova, T.; Leisova-Svobodova, L. Morphological and molecular evaluation of the Far East fruit genetic resources of Lonicera caerulea L.-vegetation, ethnobotany, use and conservation. Genet. Resour. Crop Evol. 2019, 66, 121–141. [Google Scholar] [CrossRef]
- Naugžemys, D.; Žilinskaitė, S.; Denkovskij, J.; Patamsytė, J.; Literskis, J.; Žvingila, D. RAPD based study of genetic variation and relationships among Lonicera germplasm accessions. Biologija 2007, 53, 34–39. [Google Scholar]
- Fu, J.; Yang, L.; Khan, A.; Mei, Z. Genetic characterization and authentication of Lonicera japonica Thunb. by using improved RAPD analysis. Mol. Biol. Rep. 2013, 40, 5993–5999. [Google Scholar] [CrossRef]
- Hui, J.X.; Wen, S.C. Genetic diversity analysis of seven varieties of Lonicera japonica Thunb. J. South. Agric. 2011, 42, 831–834. [Google Scholar]
- Yang, L.; Khan, A.; Mei, Z.; Yang, M.; Zhang, T.; Wei, C.; Yang, W.; Zhu, L.; Long, Y.; Fu, J. Development of RAPD-SCAR markers for Lonicera japonica (Caprifolicaceae) variety authentication by improved RAPD and DNA cloning. Rev. Biol. Trop. 2014, 62, 1649–1657. [Google Scholar] [CrossRef]
- Becker, R.; Dashbaldan, S.; Pączkowski, C.; Golis, T.; Szakiel, A. Comparison of steroids and triterpenoids in leaf cuticular waxes of selected Polish and Russian cultivars and genotypes of edible honeysuckle. Phytochem. Lett. 2019, 30, 238–244. [Google Scholar] [CrossRef]
- Matuškovič, J.; Juríková, T.; Jurík, I.; Šimko, J.; Gazdík, Z. The content of anthocyanins and ascorbic acid in the genofond of 22 clones of Lonicera kamtschatica (Sevast.) Pojark. GERDA/25. Agriculture 2009, 55, 88–94. [Google Scholar]
- Sochor, J.; Jurikova, T.; Pohanka, M.; Skutkova, H.; Baron, M.; Tomaskova, L.; Balla, S.; Klejdus, B.; Pokluda, R.; Mlcek, J.; et al. Evaluation of Antioxidant Activity, Polyphenolic Compounds, Amino Acids and Mineral Elements of Representative Genotypes of Lonicera edulis. Molecules 2014, 19, 6504–6523. [Google Scholar] [CrossRef]
- Rop, O.; Řezníček, V.; Mlcek, J.; Juríková, T.; Balík, J.; Sochor, J.; Kramarová, D. Antioxidant and radical oxygen species scavenging activities of 12 cultivars of blue honeysuckle fruit. Hort. Sci. 2011, 38, 63–70. [Google Scholar] [CrossRef]
- Vivodík, M.; Saadaoui, E.; Balážová, Ž.; Gálová, Z.; Petrovičová, L. Genetic diversity in Tunisian castor genotypes (Ricinus communis L.) detected using RAPD markers. Potravin. Slovak J. Food Sci. 2019, 13, 294–300. [Google Scholar] [CrossRef]


| Sample | No. of Fragments/(%) Polymorhism | Length of Amplified Fragments (bp) |
|---|---|---|
| Clone 2 | 6/100 | 344, 477, 578, 648, 785, 886 |
| Clone 3 | 4/99 | 141, 344, 477, 656 |
| Clone 5 | 6/100 | 141, 348, 473, 664, 718, 910 |
| Clone 6 | 5/100 | 141, 360, 461, 656, 718 |
| Clone 7 | 5/100 | 133, 363, 457, 664, 718 |
| Pruhonicky 55 | 4/100 | 375, 488, 715, 867 |
| Gerda | 9/98 | 215, 375, 488, 555, 730, 824, 867, 952, 999 |
| Morena | 8/100 | 293, 379, 477, 582, 730, 867, 1101, 1183 |
| Goluboe vreteno | 9/100 | 215, 289, 375, 477, 586, 629, 734, 847, 1011 |
| Bakcharskaya | 7/100 | 227, 293, 500, 594, 668, 757, 917 |
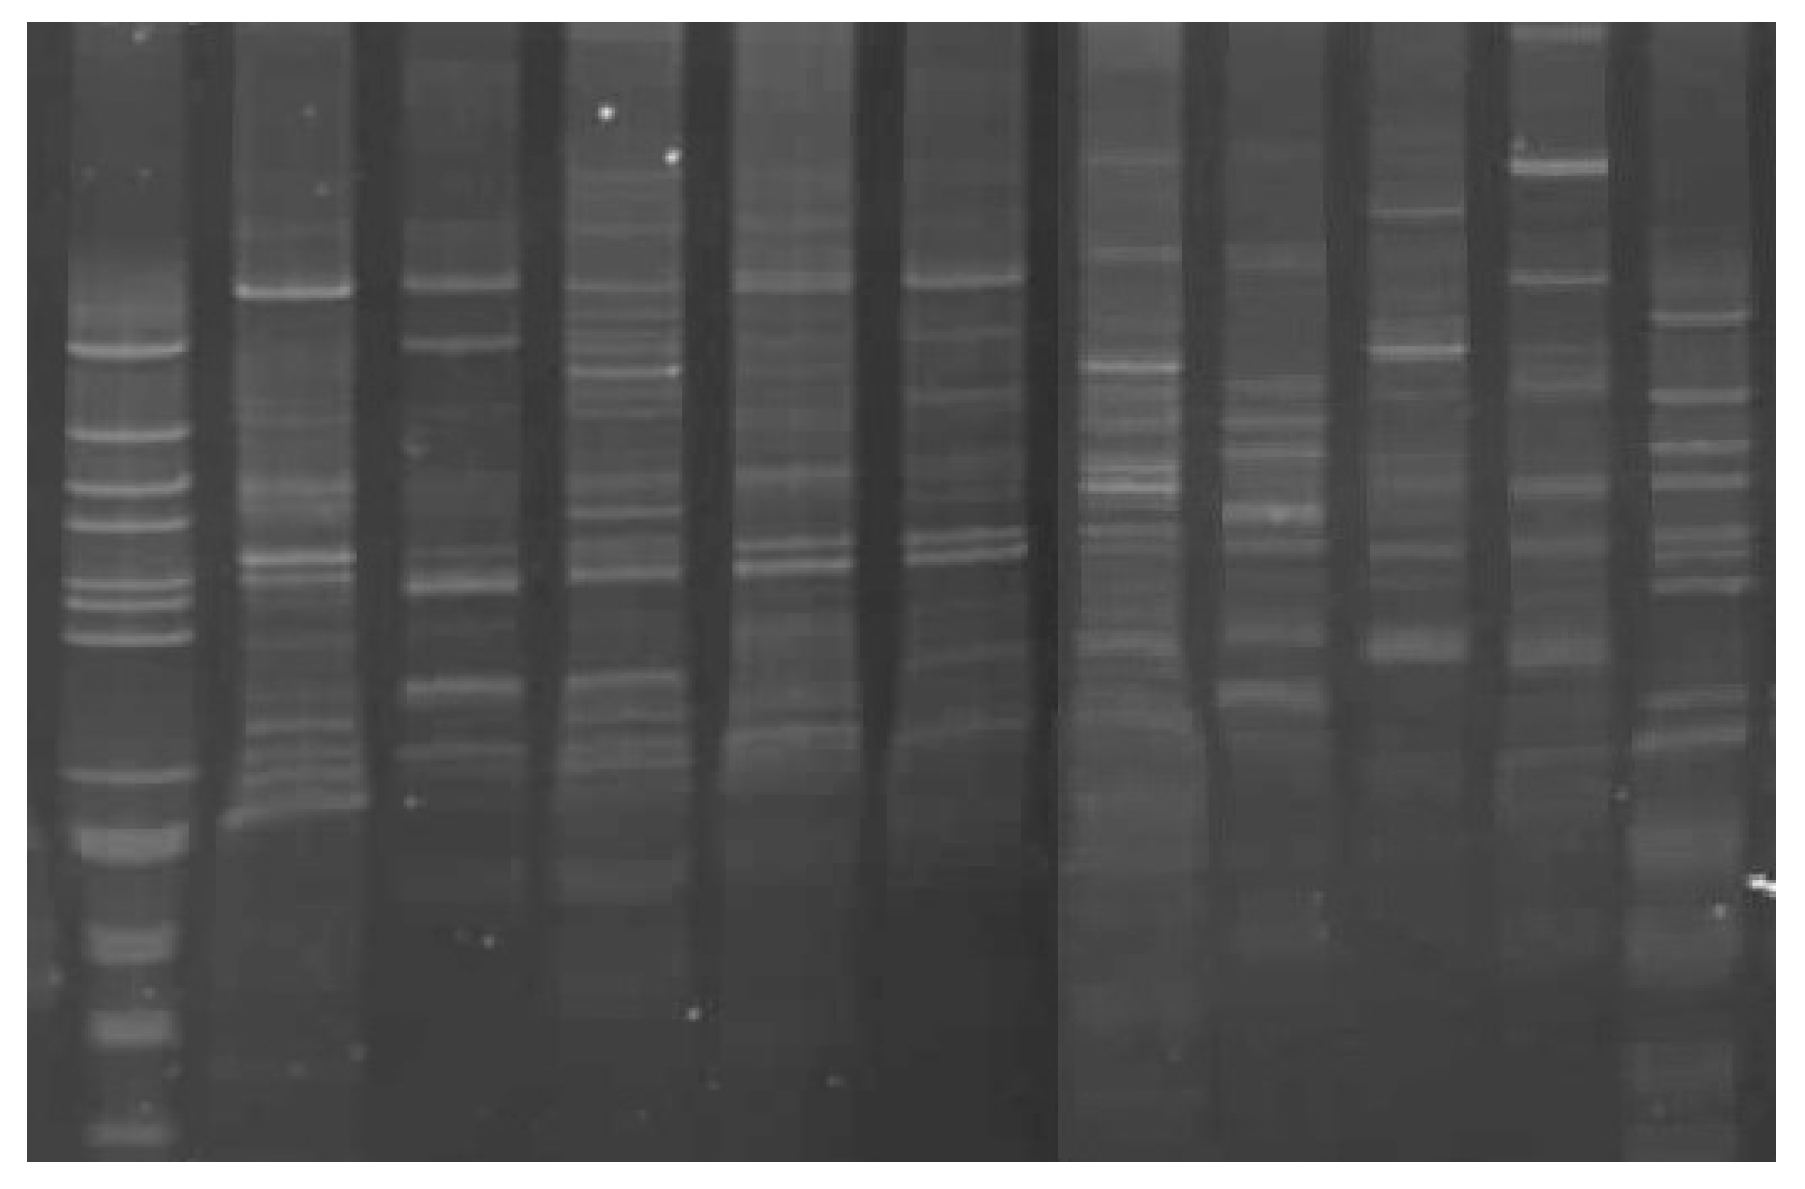
| Sample | No. of Fragments/(%) Polymorhism | Length of Amplified Fragments (bp) |
|---|---|---|
| Clone 2 | 7/99 | 177, 230, 313, 459, 618, 755, 1156 |
| Clone 3 | 5/98 | 269, 383, 564, 1046, 1174 |
| Clone 5 | 8/100 | 244, 398, 586, 705, 766, 986, 1040, 1168 |
| Clone 6 | 6/98 | 303, 358, 602, 645, 778, 1181 |
| Clone 7 | 6/98 | 313, 623, 812, 939, 1070, 1187 |
| Pruhonicky 55 | 10/98 | 82, 132, 244, 287, 421, 482, 551, 604, 680, 806 |
| Gerda | 7/100 | 302, 482, 560, 701, 761, 926, 1117 |
| Morena | 3/100 | 368, 417, 560 |
| Goluboe vreteno | 5/100 | 438, 486, 778, 926, 1035 |
| Bakcharskaya | 6/100 | 181, 280, 379, 532, 869, 1401 |
© 2020 by the authors. Licensee MDPI, Basel, Switzerland. This article is an open access article distributed under the terms and conditions of the Creative Commons Attribution (CC BY) license (http://creativecommons.org/licenses/by/4.0/).
Share and Cite
Cehula, M.; Mlček, J.; Juríková, T.; Žiarovská, J.; Paulen, O.; Dokoupil, L.; Adámková, A.; Babosova, R. Assessment of Genetic Diversity of Edible Honeysuckle Monitored through RAPD in Relative to Bioactive Substances. Agronomy 2020, 10, 868. https://doi.org/10.3390/agronomy10060868
Cehula M, Mlček J, Juríková T, Žiarovská J, Paulen O, Dokoupil L, Adámková A, Babosova R. Assessment of Genetic Diversity of Edible Honeysuckle Monitored through RAPD in Relative to Bioactive Substances. Agronomy. 2020; 10(6):868. https://doi.org/10.3390/agronomy10060868
Chicago/Turabian StyleCehula, Marcela, Jiří Mlček, Tünde Juríková, Jana Žiarovská, Oleg Paulen, Libor Dokoupil, Anna Adámková, and Ramona Babosova. 2020. "Assessment of Genetic Diversity of Edible Honeysuckle Monitored through RAPD in Relative to Bioactive Substances" Agronomy 10, no. 6: 868. https://doi.org/10.3390/agronomy10060868
APA StyleCehula, M., Mlček, J., Juríková, T., Žiarovská, J., Paulen, O., Dokoupil, L., Adámková, A., & Babosova, R. (2020). Assessment of Genetic Diversity of Edible Honeysuckle Monitored through RAPD in Relative to Bioactive Substances. Agronomy, 10(6), 868. https://doi.org/10.3390/agronomy10060868