Article

Water Uptake and Germination of Caper (Capparis spinosa L.) Seeds

by
María Laura Foschi
1,2,
Mariano Juan
2,
Bernardo Pascual
2 and
Núria Pascual-Seva
2,*
1
Horticulture and Floriculture, Agriculture Faculty, National University of Cuyo, Mendoza M5528AHB, Argentina
2
Departament Producció Vegetal, Universitat Politècnica de València, 46022 Valencia, Spain
*
Author to whom correspondence should be addressed.
Agronomy 2020, 10(6), 838; https://doi.org/10.3390/agronomy10060838
Submission received: 18 May 2020 / Revised: 9 June 2020 / Accepted: 11 June 2020 / Published: 12 June 2020

Abstract

:
Caper is a perennial deciduous sub-shrub that grows in almost all circum-Mediterranean countries. The specialized literature presents three possible dormancy types that can cause low germination of caper seeds: Physiological dormancy (PD), physical dormancy (PY), and combinational dormancy (PY + PD). We conducted three experiments to analyze the imbibition, viability, and germination of seeds of different ages, provenances, and the level of deterioration of the seed cover. None of the commercialized lots of standard seeds tested exceeded 6% germination, nor 35% viability, while the owned seeds reached 90% in both parameters, indicating that all viable seeds germinated. The seed moisture content along the soaking period followed the first two phases of the typical triphasic model of water uptake in seed germination: The imbibition and lag phases (phase I and II of germination, respectively). Seed hydration began through the hilar region. The fact that all viable owned seeds germinated, together with their moisture content being lower than that of standard seeds, indicated that caper seeds do not have a water-impermeable coat sensu stricto, i.e., they do not show PY; nevertheless, the need to use gibberellic acid to obtain high germination percentages, demonstrated the presence of PD.

1. Introduction

Caper (Capparis spinosa L.) is a perennial deciduous sub-shrub that grows in almost all circum-Mediterranean countries. At maturity, it is woody and reaches up to 1 m high, with up to 3 m long branches and deep roots. We know, given archaeological evidence, that it was already consumed 18,000 years ago in Ancient Egypt [1]. It is mainly cultivated for the floral buds, which are called capers, however, their fruits, and, to a lesser extent, their vegetative shoots are also consumed. Caper floral buds, fruits, and shoots are usually consumed pickled. Furthermore, the flowers have a high ornamental value, thus, caper plants are included in gardening, particularly in xeriscape.
Although it is considered as an underutilized crop, recent studies showed that there is increased interest in the use of the different organs of the plant in medicinal and food technology applications, as they may provide an additional value to their organoleptic properties. Although it is not intended to be an exhaustive list, some of the latest published references for the different parts of the plant are: Flower buds [2,3], leaves [4], fruits [5], aerial parts [6], and roots [7], not forgetting studies on cultivation, particularly irrigation [8].
Global demand for these products has increased; however, the poor field emergence of caper seeds greatly restricts the expansion of this crop. The specialized literature presents the low germinative power of caper seeds [9,10,11,12,13,14,15,16,17,18], related to their dormancy [19]. A dormant seed is a viable seed that does not have the capacity to germinate in favorable conditions of humidity, temperature, oxygen concentration, etc. [20], after the dispersion of the mother plant. Physical dormancy (PY) is the dormancy caused by a water-impermeable seed coat [21], and is generally caused by one or more water-impermeable layers of palisade cells in the seed (or fruit) coat [20]. The major reason why imbibed seeds with fully developed embryos fail to germinate is the low growth potential, and these seeds have physiological dormancy (PD) [22]. Both PY [10,23] and PD [19], as well as combinational dormancy (PY + PD) [9,24,25], have been reported for caper seeds.
Scarification (mechanical, chemical, enzymatic, etc.) may promote germination in seeds with non-deep PD, thus it is possible to report PY for a particular taxon, when this is, in fact, not the case [20]. In those studies, the lack of water uptake was not documented by imbibition tests both in scarified and non-scarified seeds [20]. The only way to determine if seed coats are water-permeable is to conduct imbibition studies [22]. The main goal of this study is to determine if caper seeds present PY due to a water-impermeable seed coat that restricts the water uptake and limits their germination.
With this objective, three experiments were done; in the first, we conducted viability and germination tests for four seed lots, with different ages from three different enterprises. In view of the low germination obtained in the four lots, the second experiment analyzed the imbibition, viability, and germination of the youngest seed lot. The third experiment was conducted to compare the water uptake, viability, and germination of these seeds with seeds harvested by the research team and that presumably would present an acceptable germination.

2. Materials and Methods

2.1. Experiment I

Viability and germination tests were performed with seeds of standard category [26] from four lots of different ages: 0.5, 2, 4, and 5 years, corresponding to three different enterprises, all of them within the period guaranteed by the producer. Two of these lots were purchased in 0.5 g packets, and, therefore, the number of seeds available was limited. Both viability and germination tests started on March 2019, lasting 48 h and 100 days, respectively.
The seed viability was determined by the tetrazolium test [27]. According to the Tetrazolium Test Manual [28], four categories of tissue indemnity were established: Healthy (H); weak, but viable (WV); weak, not viable (WNV); and dead (D). Samples consisted of 200 seeds (four replications of 50 seeds each). As far as we know, there has been no topographic map published for caper seeds which could be used to establish the seed viability, thus, both the H and H + WV sets were analyzed.
Germination tests followed the International Rules for Seed Testing [29], particularly the Between Paper method (BP) as described in [13,18]. The substrate was moistened with pure water (Wasserlab G.R. Type II analytical grade water system; herein referred to as water), or 500 mg L−1 of gibberellic acid solution (Berelex L.; herein referred to as GA). In both cases, 2 g L−1 captan (CAPTAN 50 BAYER) was added to prevent fungal problems. The seeds were considered germinated when the radicle protruded from the seed coat [29]. Four replicates were used, consisting of 100 seeds. The assays were only considered satisfactory when the difference between the maximum and minimum germination percentage of the four replicates was lower than the International Seed Testing Association (ISTA) tolerance levels [29]. In the present study, it was not necessary to repeat any test. For each replicate, the germination data were fitted to the logistic function [12,30]:
G = A 1 + e ( β k t )
This is defined as a special case of Richards’ function [31], where G is the cumulative germination (%); t is the germination time (days); A represents the final germination percentage; and β and k are function parameters. These parameters were used to determine the parameters with biological significance, as the time (in days) required to reach 50% of G (Gt50 = β/k) and the mean relative cumulative germination rate (k/2, days−1).

2.2. Experiment II

Seeds of the 0.5-year old lot used in Experiment I were used in this experiment, as this lot was the only one with enough seeds available. The seeds were classified into four groups with the aid of a stereomicroscope (Leica MZ APO): (i) Intact seeds (IS); (ii) scrapped seeds (SS; seeds with the cuticle scrapped); (iii) cracked seeds (CS; the minute cracks passes through the cuticle and reaches the testa); and (iv) broken seeds (BS; the fractured coat exposes the perisperm). Next, the relative importance of each group in the sample was determined following the ISTA rules [29] for seed sampling, i.e., determining the composition of four replicates of 5 g each, and obtaining the average. These seed groups were subjected to imbibition, viability, and germination tests, starting on April 2019, and lasting 8, 2, and 100 days, respectively. In these tests, assays were considered satisfactory only when the difference between the maximum and the minimum values of the four replications was not higher than the tolerance level indicated in the ISTA rules [29].
For the imbibition test, four treatments were assayed. The imbibition was performed in the same conditions as the germination test (at room temperature, 23–25 °C, 20–50% relative humidity) indicated in Experiment I, using both water and GA to saturate the substrate. Seeds were also soaked in a 10 cm deep column of water (EC = 0.0 μS cm−1; osmotic potential (Ψo) = −0.13 MPa) or GA (EC = 0.1 μS cm−1; Ψo = −0.65 MPa) at room temperature. Prior to the start of the test, the seed moisture content was determined for each group, by drying samples of 50 seeds in quadruplicate for 24 h at 103 °C [29] in a forced-air oven (Selecta 297; Selecta, Barcelona, Spain). The seed moisture content [29] was determined daily, following that reported by [17], who reported a linear water uptake during the first 24 h, stabilizing afterwards. Seeds were taken out from the Petri dish or from the solution column, blotted with a paper towel, immediately weighed, and returned to the Petri dish [22] or to the solution column. The seed dry mass was determined as previously mentioned. The seed moisture content was calculated on a fresh mass basis [29]:
Seed   moisture   ( % ) = ( Fresh   mass Dry   mass ) Fresh   mass × 100
This test lasted eight days. This is when the maximum water imbibition was stabilized [17]. As water is colorless, the imbibition process cannot be visually detected, so in parallel to this test, an imbibition test was conducted with a dye commonly used in plant histology, methylene blue. Thirty seeds of each category were immersed for eight days in methylene blue for microscopy with a concentrated aqueous solution (Sigma-Aldrich, Steinheim, Germany). Every day, three seeds of each category were extracted, blotted with a paper towel, cut longitudinally, and observed with a photomicroscope (U500X Digital Microscope; Cooling Tech, Guangdong, China) as reported in [22]. The viability and germination tests were carried out as reported for Experiment I.

2.3. Experiment III

The imbibition, viability, and germination tests were performed as explained in Experiments I and II, using IS seeds selected from the lot of standard seeds used in Experiment II (herein referred to as standard seeds) and the seeds obtained by the research team (herein referred to as owned seeds). These owned seeds were extracted from ripe fruits that we collected before dehiscence, in September 2018, from four adult plants of Capparis spinosa L. subsp. rupestris, as it was done in previous studies [12,18]. The seeds were extracted from the fruits, rinsed in tap water, and dried at room temperature (23–25 °C, 20–50% relative humidity) for two weeks. Mature, dark-brown seeds were selected, and we rejected both the light brown seeds by flotation in tap water and the small ones (<2 mm). Afterward, they were stored in glass containers at room temperature until use in the study.

2.4. Statistical Analysis

The results were subjected to analyses of variance (ANOVA; Statgraphics Centurion for Windows, Statistical Graphics Corp. [32]). The percentage data were arcsin transformed before analysis. ANOVA for the viability test studied one factor, the type of seeds (these depended on the experiment). A two-way ANOVA was applied for germination, considering the type of seeds and the solution used to saturate (distilled water or GA solution) the substrate as factors. Finally, a three-way ANOVA was applied for the imbibition test, determining the effect of the type of seeds, saturation solution, and imbibition medium (filter paper or liquid column) at one, four, and eight days of soaking. A probability of ≤0.05% was considered significant. Mean separations were performed when appropriate, using the Fisher’s least significance difference (LSD test) at p ≤ 0.05.

3. Results and Discussion

3.1. Experiment I

The viability of the four seed lots was very low, ranging from 5 to 12.5% (without significant differences (at p ≤ 0.05; Table 1)) when healthy seeds (category H) were considered, and between 10% and 35% (corresponding with the lowest value to 2-year old seeds (p ≤ 0.05)) in seeds with viable tissues (including weak ones; category H + category WV). These results are in line with those obtained by [33], who reported, for a commercialized seed lot of standard category, a viability of 19.5% considering H, and 29.3% considering H + WV.
Seeds cannot retain their viability indefinitely and, after a period of time, they deteriorate. In addition to the species characteristics, seed longevity also depends on the individual seed characteristics and on the storage conditions. The researchers in [9] reported that caper seed germination declined when the seeds were kept at room temperature for more than 12 months. However, the authors in [34] found that the seed viability (harvested, cleaned, dried, and stored by themselves) was maintained over 84% after 3-years of storage, with germination percentages (without scarification or GA addition) similar to those of the recently-harvested seeds (around 30%). These authors also determined that the caper seed longevity (considered as the time taken for 50% of the seeds to die [33,34,35]) stored at 7 °C was 3.85 years [34]. Therefore, the low viability of the caper seeds used in this study (particularly the 0.5 and 2-year old seeds) may not be due to a natural deterioration during storage, but rather to intrinsic seed characteristics.
Germination data was fitted to the logistic function (p ≤ 0.01), presenting coefficients of determination (R2) for the 32 curves (four replicates from eight combinations of variation sources) greater than 0.91. This allows the utilization of the variable A (instead of G), as well as other variables, such as β and k, and then β/k and k/2, as done in previous studies of caper seed germination [18,34]. Figure 1 presents the cumulative germination curves fitted to the logistic model obtained for the average values of each seed age and saturation solution combination. In all cases, germination was very low, and the GA increased the A value in relation to those saturated with water. The highest A value (p ≤ 0.05; Table 2) was obtained for 5-year old seeds using GA (6%), not differing from that for 0.5-year old seeds. The lowest A value was obtained for 2-year old seeds, not differing from that for 4-year old seeds. GA increased A (p ≤ 0.01). The seed age x saturation solution (water or GA) interaction was significant (p ≤ 0.05) given that GA significantly (p ≤ 0.05) increased the value of A in the 5-year old seeds and did not significantly change the other lots.
No differences (at p ≤ 0.05) were detected for Gt50 or k/2. Although Gt50 can seem long, it is short in relation to that obtained in similar studies using the owned seeds, but in which much higher germination percentages were obtained (A = 90.5%, Gt50 = 50 days; [13]). The k/2 values of the seeds with greater germination percentages (0.5- and 5-year old) were comparable to those of the aforementioned study (0.13 d−1). These results were in agreement with those obtained by [33], who reported germination percentages lower than 0.5% in the standard seeds moistened both with water and GA. They were also consistent with the low viability of these seeds, particularly considering only the healthy ones.
The germination percentage values were lower than those of viability, as expected, taking into account that, on one hand, germination loss precedes the viability loss, as stated by [36], and, on the other hand, that if seeds had imbibed the substrate solution, the main reason preventing germination in many H, and probably all WV seeds, was the low embryo growth potential (“push power”), i.e., these seeds presented PD, according to [22]. This theory is also supported by the fact that the GA application improved germination. The GA application to saturate the two filter papers or to soak the seeds, are treatments, alone or in combination with scarification or NO3K utilization, that succeeded in increasing the germination of caper seeds, probably due to breaking their PD [13,16], increasing the embryo vigor, or weakening the seed coat.

3.2. Experiment II

The distribution of the different categories established in the 0.5-year old seed lot was: IS, 40.1%; SS, 13.0%; CS, 30.7%; and BS, 16.2%. Initially, the seed moisture content of each category was: IS, 8.8%; SS, 7.7%; CS, 7.1%; and BS, 6.9%. Although it might be expected that an increase in seed coat damage results in a decrease of the initial moisture content of seeds, the difference in moisture contents were not significant (p < 0.05; ANOVA not shown). The seed moisture content (Figure 2) increased quickly during the first 24 h of soaking, stabilizing in the most deteriorated coat seeds (BS), while the water uptake continued slowly until the fourth day in intact seeds (IS). Although in previous studies our research team reported a linear water uptake during the first 24 h [17], in view of the herein presented seed water content after one day of imbibition, and given that water uptake speed could influence the subsequent germination process, it would be interesting to determine the water uptake rate during the first 24 h, analyzing the seed water content every hour, which is intended to be addressed in a future study. As the researchers in [37] stated, imbibition is a physical process and is a consequence of the matric forces that occur within dry seeds with water permeable seed coats, independently of whether they are alive or dead, or dormant or non-dormant.
In Figure 2, the seed moisture content along the soaking period followed the first two phases of the typical triphasic model of water uptake in seed germination. First (phase I of germination; imbibition itself), the water uptake was initially rapid, followed by a slower linear wetting step. At the end of phase I (from the first to the fourth day, depending on the category of the seed), the water uptake stopped as the seed entered the lag phase of germination (phase II) in which there was a limited water uptake, while, according to the literature [37], the metabolism was supposedly active. Radicle protrusion would result from a second period of fresh weight gain driven by additional water uptake (phase III; not shown in Figure 2).
Seeds do not hydrate uniformly during imbibition, since there is a “wetting front” that develops as the outer portions of the seed hydrates while the inner tissues are still dry; seed parts may hydrate differentially depending on their contents [37]. As in other seeds [38], caper seed coats contain the hilum (a scar formed when the funiculus detaches from the seed at maturity) and the micropyle (a scar that corresponds to the micropyle of the ovule), commonly known as the hilar region, and the rest is known as the extrahilar region. The hilar region can allow for water uptake, behaving like a water channel [12,
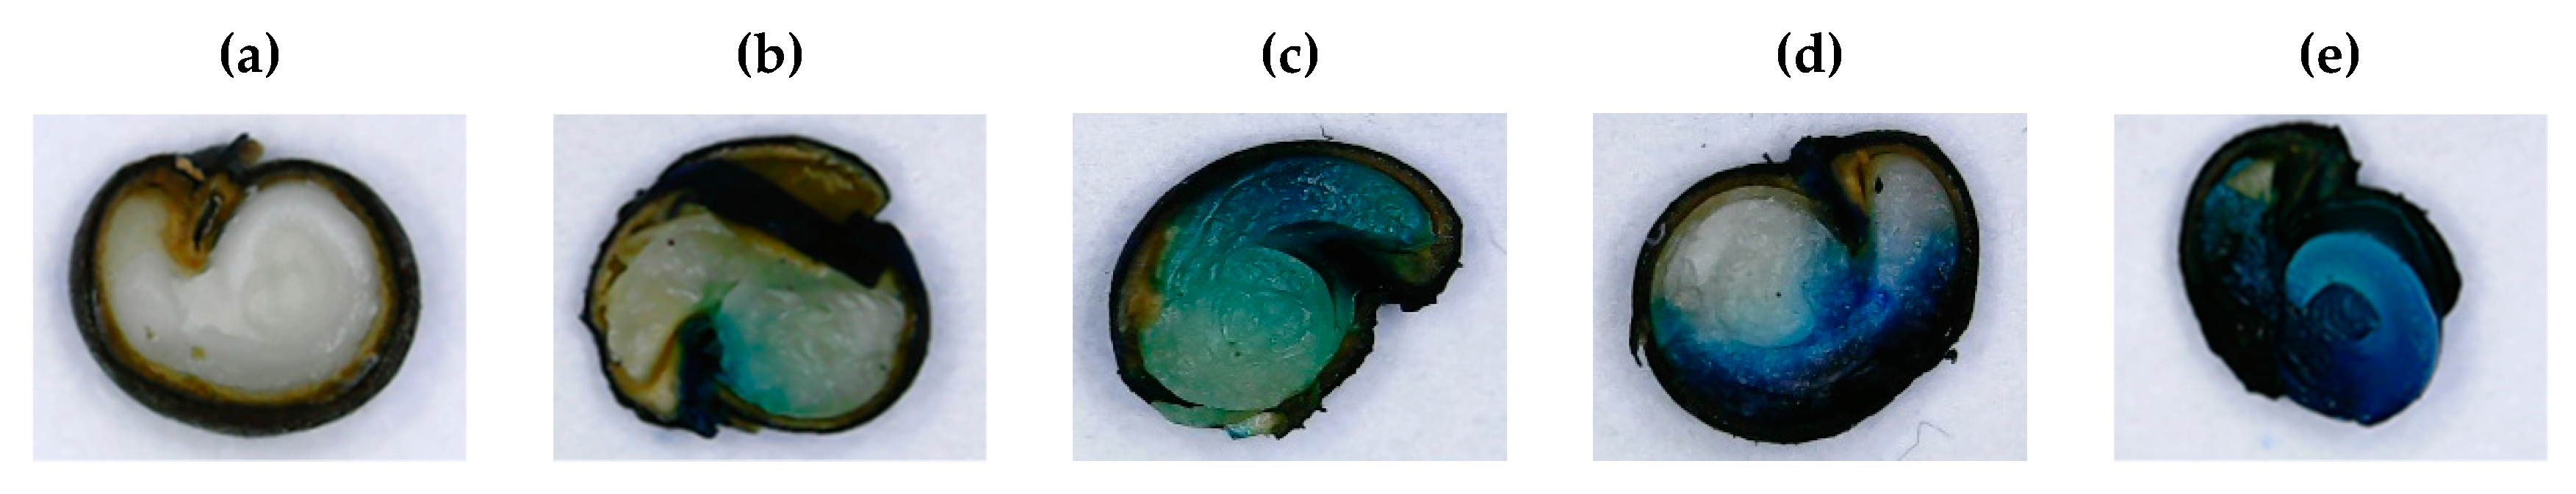
37]. If these sites are large enough to admit dyes, the permeable areas can be visualized.
According to [38], given that the methylene blue dye molecules are larger than those of water, dye entry into the seed coat indicates that this is a penetration point for water. Figure 3b shows that seed hydration begins through the hilar region, while the extrahilar region is impermeable. Caper seeds do not have a water-impermeable coat sensu stricto and they imbibe water without the seed coat being disrupted. When this region is damaged, by scrapping (Figure 3c) or by cracking (Figure 3d,e), hydration begins through the damaged area, contrary to what was reported for Opuntia tomentosa seeds [22].
Table 3 presents the analysis of variance for the seed moisture content corresponding to the first, fourth, and eighth day of imbibition. After one day of soaking, BS reached a higher seed moisture content than CS (p ≤ 0.05), which in turn, presented higher values than SS (p ≤ 0.05), and those were greater than IS (p ≤ 0.05). These differences decreased with the imbibition period. At the fourth and eighth day, only IS presented a lower seed moisture content (p ≤ 0.05; on average 2.6% and 2.2%, respectively) than the other categories, which did not differ between them.
In seeds with a permeable seed coat, seed hydration is determined by the gradient of the water potential between the medium (in this case the solution column in which the seeds are soaked or the two filter papers) and the seed. Initially, the matric potential of dry seeds is very low, and water is absorbed on the dry coat surface, on the cell walls, and in the polymeric reserve compounds, principally proteins [22], mainly due to the gradient between the osmotic potential of the seeds and the osmotic and pressure potential of the medium [39]. When the seeds have a “water channel”, this process occurs through it. No differences at the p ≤ 0.05 level in the seed moisture content were detected in relation to the imbibition medium (filter paper or liquid column) or the saturation solution (water or GA), which indicated that neither the saturated filter paper, nor the use of GA, restricted the solution uptake with respect to soaking in water; i.e., the osmotic potential of the seeds was much lower than the osmotic and pressure potential of the medium. In this experiment, the water column above the seeds had a height of approximately 10 cm, water Ψo = −0.13 MPa, and GA solution Ψo = −0.65 MPa.
The viability of the four seed categories was very low, ranging from 0 to 20% (p ≤ 0.01; Table 4) when healthy seeds (H) were considered, and between 2.5% and 32.5% in seeds with viable tissues (H + WV). Considering H, two groups (p ˂ 0.05) were clearly detected, one consisting of IS and SS, which had greater viability than those of the other group, consisting of seeds with appreciable damage in their coat (CS and BS). The viability of BS seeds was nil. When considering all the seeds with viable tissues (H + WV categories), the viability of the BS seeds was lower (p ≤ 0.05) than that of the other seeds.
As in Experiment I, A was very low or nil; specifically it was null for BS, practically null (on average ≤ 0.3%) for CS and SS, and very low for IS; therefore, it was only possible for IS to adjust the cumulative germination to the logistic model. Coefficients of determination (R2) for the eight curves (four replicates from two combinations of variation sources) were greater than 0.94. The average parameters of the germination curves for IS were: A = 4.3, Gt50 = 23.4 days, and k/2 = 0.4 day−1. The use of GA increased the A value in relation to the use of water, as in previously cited studies, practically doubling its value (3.0% for water, 5.6% for GA). These results agreed with those obtained in Experiment I for the 0.5-year old seeds, which was the original seed lot. As stated above, the results were also consistent with the low viability of these seeds, particularly considering the healthy seeds.
As far as we know, this is the first time that data on caper seed imbibition has been reported. In this experiment, seeds imbibed the corresponding solution, and the embryo likely did not have enough growth potential to germinate [22], as it was mentioned in the previous experiment. It remained to be confirmed whether the moisture content reached in these seeds was enough to allow their germination; thus, the third experiment was conducted.

3.3. Experiment III

The initial seed moisture content of the two types of seeds was rather similar (8.85% for standard seeds and 8.92% for the owned seeds), and evidently this difference was not significant (p ≤ 0.05). As in Experiment II, (Figure 4) the two first phases of germination were described by the water uptake, imbibition, and lag phase.
The analysis of variance for the seed moisture content corresponding to the first, fourth, and eighth day of imbibition are shown in Table 5. Although dry seeds of the two types showed no differences in moisture content, differences (p ≤ 0.01) appeared with imbibition, particularly after one day of soaking (9.3%), decreasing with the soaking period down to 4.6% at the eighth day. As in Experiment II, neither the saturated filter paper nor the use of GA restricted the solution uptake with respect to soaking in water. However, the seed lot × saturation method interaction was significant (p ≤ 0.05) for all the analyzed dates, as the seed moisture reached in the BP method was greater than that in the 10 cm solution column, however, only in standard seeds.
The viability was greater in the owned seeds (p ≤ 0.01; Table 6) than in the standard seeds, considering both H and H + WV. The high viability of the owned seeds was expected since, on the one hand, they were manually extracted from the fruits, and mature dark-brown seeds were selected and, on the other hand, these seeds were only 0.5-years old. As mentioned above, the authors in [9] reported that germination declined for caper seeds after 12 months of storage at room temperature, and [34] demonstrated viability over 84% after three years of storage. Thus, a high viability was expected for 0.5-year old seeds.
Figure 5 presents the cumulative germination curves fitted to the logistic model obtained for the average values of each seed type and saturation solution combinations. The coefficients of determination (R2) for the 16 curves (four replicates from four combinations of variation sources) were greater than 0.92.
Large differences (p ≤ 0.01; Table 7) were observed for A between the owned seeds and the standard ones, in favor of the former. The use of GA also had a significant effect (p ≤ 0.01), multiplying by two the germination in the standard seeds and by 16 in the owned seeds; in the latter, the viability and final germination values coincided totally. The seed lot x saturation solution interaction was significant (p ≤ 0.01) due to the fact that GA increased A more intensively in the owned seeds than in the standard ones, presenting greater viability. In addition to the higher germination, Gt50 was longer for the owned seeds (p ≤ 0.01) than for the standard seeds and, in both cases, was reduced using GA. With the use of GA all viable seeds germinated (including category WV), which implies that GA increased the “push power” of the weak embryo, so that it was able to expand, allowing the radicle protrusion, i.e., to germinate, and/or it also could reduce the mechanical resistance to expansion of the embryo. This should be studied in depth.
Given that the owned seeds reached a germination of 90% (all the viable ones), and taking into account that seed moisture was greater in the standard seeds than in the owned ones, we determined that caper seeds do not have a water-impermeable coat sensu stricto and that they imbibe water without the seed coat being disrupted.

4. Conclusions

Imbibition in caper seeds is not a determining factor in their germination, given that the seed moisture content reached in the owned seeds allowed germination percentages up to 90%, and all the viable seeds germinated. Thus, caper seeds do not have a water-impermeable coat sensu stricto and they imbibe water without the seed coat being disrupted, i.e., caper seeds do not show physical dormancy. To obtain a high percentage of germination, the use of GA was required, which indicates the presence of a physiological dormancy. The presence of scrapped and cracked coat seeds in the lot of standard seeds is one of the causes of low viability and germination of standard commercialized caper seeds, although it is not the only cause. The deterioration, visibly apparent or not, produced in the extraction from the fruits, cleaning, drying, and storing processes, decreased the viability and vigor, and consequently the germinative power of these seeds.

Author Contributions

Conceptualization, M.J. and B.P.; methodology, M.L.F.; software, M.L.F.; validation, M.L.F., M.J., B.P., and N.P.-S.; formal analysis, M.L.F., M.J., B.P., and N.P.-S.; investigation, M.L.F. and N.P.-S.; resources, B.P.; data curation, M.L.F., B.P., and N.P.-S.; writing—original draft preparation, B.P. and N.P.-S.; writing—review and editing, M.L.F., M.J., B.P., and N.P.-S.; visualization, M.L.F., M.J., B.P., and N.P.-S.; supervision, B.P. and N.P.-S.; project administration, M.J.; funding acquisition, M.J. All authors have read and agreed to the published version of the manuscript.

Funding

This research received no external funding.

Conflicts of Interest

The authors declare no conflict of interest.

References

  1. Sozzi, G.O. Caper bush: Botany and horticulture. In Horticultural Reviews; John Wiley & Sons, Inc.: Oxford, UK, 2001; pp. 125–188. [Google Scholar]
  2. Sonmezdag, A.S.; Kelebek, H.; Selli, S. Characterization of aroma-active compounds, phenolics, and antioxidant properties in fresh and fermented capers (Capparis spinosa) by GC-MS-olfactometry and LC-DAD-ESI-MS/MS. J. Food Sci. 2019, 84, 2449–2457. [Google Scholar] [CrossRef] [PubMed]
  3. Wojdyło, A.; Nowicka, P.; Grimalt, M.; Legua, P.; Almansa, M.S.; Amorós, A.; Carbonell-Barrachina, Á.A.; Hernández, F. Polyphenol compounds and biological activity of caper (Capparis spinosa L.) flowers buds. Plants 2019, 8, 539. [Google Scholar] [CrossRef] [PubMed] [Green Version]
  4. Yahia, Y.; Benabderrahim, M.A.; Tlili, N.; Hannachi, H.; Ayadi, L.; Elfalleh, W. Comparison of three extraction protocols for the characterization of caper (Capparis spinosa L.) leaf extracts: Evaluation of phenolic acids and flavonoids by liquid chromatography–electrospray ionization–tandem mass spectrometry (LC–ESI–MS) and the antio. Anal. Lett. 2020. [Google Scholar] [CrossRef]
  5. Ziadi, M.; Bouzaiene, T.; Lakhal, S.; Zaafouri, K.; Massoudi, S.; Dousset, X.; Hamdi, M. Screening of lactic starter from Tunisian fermented vegetables and application for the improvement of caper (Capparis spinosa) fermentation through an experimental factorial design. Ann. Microbiol. 2019, 69, 1373–1385. [Google Scholar] [CrossRef]
  6. Benachour, H.; Ramdani, M.; Lograda, T.; Chalard, P.; Figueredo, G. Chemical composition and antibacterial activities of Capparis spinosa essential oils from Algeria. Biodiversitas J. Biol. Divers. 2020, 21, 161–169. [Google Scholar] [CrossRef]
  7. Khadem, P.; Motalebi, A.A.; Rokni, N.; Razavilar, V. Effects of Capparis spinosa root extract and modified atmosphere packaging on the shelf life of rainbow trout (Oncorhynchus mykiss) fillets by measuring of antioxidant and antimicrobial parameters. Iran. J. Fish. Sci. 2020, 19, 2020. [Google Scholar]
  8. Bagherifard, A.; Hamidoghli, Y.; Biglouei, M.H.; Ghaedi, M. Effects of drought stress and superabsorbent polymer on morpho-physiological and biochemical traits of caper (Capparis spinosa L.). Aust. J. Crop Sci. 2020, 14, 13–20. [Google Scholar] [CrossRef]
  9. Orphanos, P.I. Germination of caper ( Capparis spinosa L.) seeds. J. Hortic. Sci. 1983, 58, 267–270. [Google Scholar] [CrossRef]
  10. Sozzi, G.O.; Chiesa, A. Improvement of caper (Capparis spinosa L.) seed germination by breaking seed coat-induced dormancy. Sci. Hortic. (Amsterdam) 1995, 62, 255–261. [Google Scholar] [CrossRef]
  11. Ölmez, Z.; Yahyaoglu, Z.; Üçler, A.Ö. Effects of H2SO4, KNO3 and GA3 Treatments on Germination of Caper (Capparis ovata Desf.) Seeds. Pak. J. Biol. Sci. 2004, 7, 879–882. [Google Scholar]
  12. Pascual, B.; San Bautista, A.; Ferreros, N.; López-Galarza, S.; Maroto, J.V. Analysis of germination of caper seeds as influenced by the position of fruit on the mother plant, fruit maturation stage and fruit weight. J. Hortic. Sci. Biotechnol. 2003, 78, 73–78. [Google Scholar]
  13. Pascual, B.; San Bautista, A.; Imbernón, A.; López-Galarza, S.; Alagarda, J.; Maroto, J.V. Seed treatments for improved germination of caper (Capparis spinosa). Seed Sci. Technol. 2004, 32, 637–642. [Google Scholar] [CrossRef] [Green Version]
  14. Pascual, B.; San Bautista, A.; Pascual Seva, N.; García Molina, R.; López-Galarza, S.; Maroto, J.V. Effects of soaking period and gibberellic acid addition on caper seed germination. Seed Sci. Technol. 2009, 37, 33–41. [Google Scholar] [CrossRef]
  15. Pascual-Seva, N.; Bautista, A.S.; López-Galarza, S.; Maroto, J.V.; Pascual, B. Effect of accelerated ageing on germination in caper (Capparis spinosa L.) seeds. Acta Hortic. 2011, 898, 69–74. [Google Scholar] [CrossRef]
  16. Arefi, I.H.; Nejad, S.K.; Kafi, M. Roles of duration and concentration of priming agents on dormancy breaking and germination of caper (Capparis spinosa L.) for the protection of arid degraded areas. Pakistan J. Bot. 2012, 44, 225–230. [Google Scholar]
  17. Juan, M. Estudio para la Mejora de la Propagación de la Alcaparra (Capparis spinosa L.). Ph.D. Thesis, Universtiat Politècnica de València, Valencia, Spain, 18 July 2017. [Google Scholar]
  18. Juan, M.; Pascual-Seva, N.; Iranzo, D.; Pascual, B. Improvement of seed germination of caper (Capparis spinosa L.) through magnetic fields. Acta Hortic. 2020, 1273, 433–440. [Google Scholar] [CrossRef]
  19. Baskin, C.C.; Baskin, J.M. Ecology, Biogeography, and Evolution of Dormancy and Germination, 2nd ed.; Academic Press: San Diego, CA, USA, 2014. [Google Scholar]
  20. Baskin, J.M.; Baskin, C.C. A classification system for seed dormancy. Seed Sci. Res. 2004, 14, 1–16. [Google Scholar] [CrossRef] [Green Version]
  21. Baskin, J.M.; Baskin, C.C.; Li, X. Taxonomy, anatomy and evolution of physical dormancy in seeds. Plant Species Biol. 2000, 15, 139–152. [Google Scholar] [CrossRef]
  22. Orozco-Segovia, A.; Márquez-Guzmán, J.; Sánchez-Coronado, M.E.; Gamboa De Buen, A.; Baskin, J.M.; Baskin, C.C. Seed anatomy and water uptake in relation to seed dormancy in Opuntia tomentosa (Cactaceae, Opuntioideae). Ann. Bot. 2007, 99, 581–592. [Google Scholar] [CrossRef] [Green Version]
  23. Pioto, B. Seed Ppropagation of Mediterranean Trees and Shrubs; Agency for the Protection of the Environment and for Technical Services: Rome, Italy, 2003; ISBN 8844800810. [Google Scholar]
  24. Bahrani, M.J.; Ramazani Gask, M.; Shekafandeh, A.; Taghvaei, M. Seed germination of wild caper (Capparis spinosa L., var. parviflora) as affected by dormancy breaking treatments and salinity levels. Seed Sci. Technol. 2008, 36, 776–780. [Google Scholar] [CrossRef]
  25. Marković, M.; Grbić, M.; Skočajić, D.; Đukić, M. Germination of Capparis spinosa L. seeds under Different dormancy breaking treatments. In Book of Proceedings of the X International Scientific Agriculture Symposium “AGROSYM 2019”; University of East Sarajevo: Sarajevo, Bosnia and Herzegovina, 2019; pp. 460–464. [Google Scholar]
  26. The Council of the European Comission COUNCIL DIRECTIVE 2002/55/EC of 13 June 2002 on the marketing of vegetable seed. Off. J. Eur. Union 2002, 193, 33–59.
  27. Perry, D.A. Manual de Métodos de Ensayos de Vigor; Instituto Nacional de Semillas y Plantas de Vivero: Madrid, Spain, 1987. [Google Scholar]
  28. Moore, R.P. Manual de Ensayos al Tetrazolio; Ministerio de Agricultura, Pesca y Alimentación: Madrid, Spain, 1985. [Google Scholar]
  29. International Seed Testing Association (ISTA) ISTA Rules 2018; ISTA: Bassersdorf, Switzerland, 2018.
  30. Torres, M.; Frutos, G. Logistic function analysis of germination behaviour of aged fennel seeds. Environ. Exp. Bot. 1990, 30, 383–390. [Google Scholar] [CrossRef]
  31. Causton, D.R.; Venus, J.C. Single leaf growth and the Richards function: Methodology. In The Biometry of Plant Growth; Causton, D.R., Venus, J.C., Eds.; Edward Arnold: London, UK, 1981; pp. 87–143. [Google Scholar]
  32. Statistical Graphics. Statistical Graphics Corporation Statgraphics Centurion XVI; Statistical Graphics: Rockville, MD, USA, 2014. [Google Scholar]
  33. Navarro, D. Análisis de Posibles Factores que Anulan la Germinación de un lote de Semilla Comercial de Alcaparra (Capparis spinosa L.). Bachelor’s Thesis, Universitat Politècnica de València, Valencia, Spain, 2016. [Google Scholar]
  34. Pascual, B.; San Bautista, A.; López-Galarza, S.; Alagarda, J.; Maroto, J.V. Germination behaviour after storage of caper seeds. Seed Sci. Technol. 2006, 34, 151–159. [Google Scholar] [CrossRef] [Green Version]
  35. Roberts, E.H. Storage environment and control of viability. In Viability of Seeds; Roberts, E.H., Ed.; Chapman and Hall: London, UK, 1972; pp. 14–58. [Google Scholar]
  36. Justice, O.L.; Bass, L. Principles and Practices of Seed Storage; Castle House Publications: London, UK, 1979. [Google Scholar]
  37. Hartman, H.D.; Kester, D.E.; Davies, F.T. Plant propagation. Principles and Practices, 8th ed.; Pearson Education Limited: Harlow, UK, 2014. [Google Scholar]
  38. Ma, F.; Cholewa, E.; Mohamed, T.; Peterson, C.A.; Gijzen, M. Cracks in the palisade cuticle of soybean seed coats correlate with their permeability to water. Ann. Bot. 2004, 94, 213–228. [Google Scholar] [CrossRef] [PubMed] [Green Version]
  39. Bewley, J.D.; Bradford, K.J. Imbibition. In The Encyclopedia of Seeds, Science, Technology and Uses; Black, M., Bewley, J.D., Halmer, P., Eds.; CABI: Trowbridge, UK, 2006; p. 346. [Google Scholar]
Figure 1. A logistic model fitted to the cumulative germination curves of caper seeds. Mean values for the combination of seed age (0.5-, 2-, 4-, and 5-year old seeds in red, green, yellow, and blue, respectively) and substrate saturation solution (water in continuous lines and gibberellic acid (GA) solution in dashed lines).
Agronomy 10 00838 g001
Figure 2. The seed moisture content (%) along the soaking period. Mean values for combinations of four caper seed categories (intact seeds (A); scrapped seeds (B); cracked seeds (C); and broken seeds (D)), two imbibition mediums (between paper in blue and in a 10 cm column in red), and imbibition medium (water in continuous lines and GA solution in dashed lines). Vertical bars represent the standard error.
Agronomy 10 00838 g002
Figure 3. Longitudinal sections of Capparis spinosa seeds. (a) Intact seeds before soaking. Seeds previously immersed for 24 h in a methylene blue solution: (b) Intact seeds; (c) scrapped seeds; (d) cracked seeds; and (e) broken seeds.
Agronomy 10 00838 g003
Figure 4. The seed moisture content (%) along the soaking period. Mean values for the combinations of two caper seed lots (owned seeds in blue lines and standard seeds in red lines), two imbibition mediums (between the paper in dark lines and in a 10 cm column in light lines), and two substrate saturation solutions (water in continuous lines and the GA solution in dashed lines). Vertical bars represent the standard error.
Agronomy 10 00838 g004
Figure 5. Logistic model fitted to cumulative germination curves of caper seeds. Mean values for the combinations of seed lot (owned seeds in blue lines, standard seeds in red lines) and the substrate saturation solution (water in continuous lines and the GA solution in dashed lines).
Agronomy 10 00838 g005
Table 1. Effects of the seed lot age (years) on the viability (%) of the seeds, considering only the healthy seeds (H) and considering both the healthy and viable but with weak tissues (H + weak, but viable (WV)). Mean values.
Seed Lot Age (Y)Viability (H)Viability (H + WV)
0.512.532.5 a
25.010.0 b
47.522.5 ab
512.535.0 a
Analysis of variance
Source (degrees of freedom)% sum of squares
Y (3)34.2 NS59.62 *
Residual (12)65.840.38
Standard deviation6.19.4
Mean values followed by different lower-case letters in each column indicate significant differences at p ≤ 0.05 using the Fisher’s least significance difference (LSD) test. * Indicates significant differences at p ≤ 0.05. NS indicates not significant differences.
Table 2. Effects of the seed lot age (years) and the saturation solution on the germination parameters: Final germination percentage (A, %), time (d) required to reach 50% of final germination (Gt50), and average germination rate (k/2; d−1). Mean values.
AGt50k/2
Seed lot age (Y)
0.5 2.44 ab27.410.11
2 0.37 c9.790.02
4 1.15 bc20.710.05
5 3.37 a13.220.11
Saturation solution (S)
Water0.59 b17.370.05
GA3.07 a21.450.10
Analysis of variance
Source (degrees of freedom)% sum of squares
Y (3)25.1 **10.8 NS9.9 NS
S (1)29.1 **0.9 NS4.7 NS
Y × S (3)13.0 *9.8 NS12.3 NS
Residuals (24)32.871.373.2
Standard deviation1.521.30.1
Mean values followed by different lower-case letters in each column indicate significant differences at p ≤ 0.05 using the Fisher’s least significance difference (LSD) test. ** (*) Indicates significant differences at p ≤ 0.01 (p ≤ 0.05). NS indicates not significant differences.
Table 3. Effects of the caper seed category, imbibition medium, and solution on the seed water content (%) after 1, 4, and 8 days of soaking. Mean values.
Seed Moisture (%)
Day 1Day 4Day 8
Seed category (C)
Intact seeds35.36 d38.44 b39.09 b
Scraped seeds38.32 c40.46 a40.71 a
Cracked seeds39.71 b40.98 a41.34 a
Broken seeds41.10 a41.61 a41.82 a
Imbibition medium (M)
Between paper39.0140.5341.00
10 cm column38.2340.2240.47
Saturation solution (S)
Water38.9740.5240.98
GA38.2840.2340.50
Analysis of variance
Source (degrees of freedom)% sum of squares
C (3)49.86 **24.56 **18.86 **
M (1)1.68 NS0.41 NS1.24 NS
S (1)1.31 NS0.37 NS1.01 NS
C × M (3)6.71 *3.75 NS3.20 NS
C × S (3)3.16 NS3.33 NS3.63 NS
M × S (1)2.02 NS4.97 NS5.87 *
C × M × S (3)3.73 NS3.57 NS4.75 NS
Residual (48)31.5359.0361.46
Standard deviation2.02.12.1
Mean values followed by different lower-case letters in each column indicate significant differences at p ≤ 0.05 using the Fisher’s least significance difference (LSD) test. ** (*) Indicates significant differences at p ≤ 0.01 (p ≤ 0.05). NS indicates not significant differences.
Table 4. Effects of the seed category on the viability (%) of the seeds considering only the healthy seeds (H) and considering both the healthy and viable but with weak tissues (H + WV). Mean values.
Seed Category (C)Viability (H)Viability (H + WV)
Intact seeds20.0 a32.5 a
Scraped seeds17.5 a27.5 a
Cracked seeds7.5 b25.0 a
Broken seeds0.0 b2.5 b
Analysis of variance
Source (degrees of freedom)% sum of squares
C (3)74.5 **61.5 **
Residual (12)25.538.5
Standard deviation5.410.5
Mean values followed by different lower-case letters in each column indicate significant differences at p ≤ 0.05 using the Fisher’s least significance difference (LSD) test. ** Indicates significant differences at p ≤ 0.01.
Table 5. Effects of the seed lot and imbibition medium, and solution on the seed water content (%) after 1, 4, and 8 days of soaking. Mean values.
Seed Moisture (%)
Day 1Day 4Day 8
Seed lot (L)
Owned seeds26.06 b34.18 b34.48 b
Standard seeds35.36 a38.34 a39.09 a
Imbibition medium (M)
Between paper30.9436.4636.92
10 cm column30.4836.0636.65
Saturation solution (S)
Water31.60 a36.3536.89
GA29.82 b36.1736.15
Analysis of variance
Source (degrees of freedom)% sum of squares
L (1)85.37 **69.80 **76.81 **
M (1)0.21 NS0.63 NS0.27 NS
S (1)3.18 **0.13 NS0.44 NS
L × M (1)5.05 **5.72 *4.98 **
L × S (1)1.43 **0.83 NS0.00 NS
M × S (1)0.00 NS1.76 NS2.34 NS
L × M × S (1)0.02 NS1.68 NS0.49 NS
Residual (24)3.7319.4414.67
Standard deviation1.11.31.2
Mean values followed by different lower-case letters in each column indicate significant differences at p ≤ 0.05 using the Fisher’s least significance difference (LSD) test. ** (*) Indicates significant differences at p ≤ 0.01(p ≤ 0.05). NS indicates not significant differences.
Table 6. Effects of the seed lot on the viability (%) of the seeds, considering only the healthy seeds (H) and considering both the healthy and viable but with weak tissues (H + WV). Mean values.
Seed Lot (L)Viability (H)Viability (H + WV)
Owned seeds87.5 a90.0 a
Standard seeds20.0 b32.5 b
Analysis of variance
Source (degrees of freedom)% sum of squares
L (1)95.0 **87.5 **
Residual (6)5.020.0
Standard deviation8.912.1
Mean values followed by different lower-case letters in each column indicate significant differences at p ≤ 0.05 using the Fisher’s least significance difference (LSD) test. ** Indicates significant differences at p ≤ 0.01.
Table 7. Effects of the seed lot and the saturation solution on the germination parameters: The final germination percentage (A, %), time (d) required to reach 50% of final germination (Gt50), and average germination rate (k/2; d−1). Mean values.
AGt50k/2
Seed lot (L)
Owned seeds49.05 a44.66 a0.08 b
Standard seeds4.29 b23.43 b0.38 a
Saturation solution (S)
Water4.89 b46.21 a0.21
GA48.46 a21.88 b0.25
Analysis of variance
Source (degrees of freedom)% sum of squares
L (1)35.8 **32.5 **52.1 *
S (1)34.0 **42.7 **1.0 NS
L × S (1)30.0 **3.2 NS2.4 NS
Residual (12)0.221.644.5
Standard deviation2.010.60.2
Mean values followed by different lower-case letters in each column indicate significant differences at p ≤ 0.05 using the Fisher’s least significance difference (LSD) test. ** (*) Indicates significant differences at p ≤ 0.01 (p ≤ 0.05). NS indicates not significant differences.

