Article

Unraveling Ecophysiological Mechanisms in Potatoes under Different Irrigation Methods: A Preliminary Field Evaluation

1
International Potato Center (CIP), Headquarters P.O. Box, Lima 1558, Peru
2
Water Resources Doctoral Program, Universidad Nacional Agraria La Molina, Av. La Molina s/n, Lima 15024, Peru
3
CATIE—Centro Agronómico Tropical de Investigación y Enseñanza, Cartago Turrialba 30501, Costa Rica
*
Author to whom correspondence should be addressed.
Agronomy 2020, 10(6), 827; https://doi.org/10.3390/agronomy10060827
Submission received: 25 April 2020 / Revised: 22 May 2020 / Accepted: 26 May 2020 / Published: 11 June 2020
(This article belongs to the Special Issue Optimization of Water Usage and Crop Yield Using Precision Irrigation)

Abstract

:
Potatoes—a global food security and staple crop—is threatened by dry spells in drought-prone areas. The use of physiological thresholds to save water while maintaining a reasonable tuber yield has been proposed, but their effects on physiological performances and usefulness under different irrigation methods are yet to be evaluated. In this study, photosynthetic traits were monitored to assess the effect of water restriction and rewatering under drip (DI) and furrow (FI) irrigations. The treatments consisted of two maximum light-saturated stomatal conductance (g s _ m a x ) irrigation thresholds (T2: 0.15 and T3: 0.05 mol H 2 O m 2 s 1 ) compared with a fully irrigated control (g s _ m a x > 0.3 mol H 2 O m 2 s 1 ). DI used less water than FI but promoted early senescence and low percentage of maximum assimilation rate (PMA) at late developmental stages. FI caused no yield penalization in T2 and higher recovery of carbon isotope discrimination and PMA than DI. It is suggested that moderate water quantities of early and frequently water pulses in the irrigation, promote short-term water stress memory improvement, senescence delay and more capability of recovery at late stages.

1. Introduction

Temperature rise and more frequent drought spells induced by climate change may produce concomitant water scarcity and increased evapotranspiration, especially in the arid and semi-arid regions of the world, thus intensifying water stress [1,2,3]. Crop yield reductions under such circumstances are expected to be greater than all other biotic and abiotic factors combined [4]. In the specific case of potatoes—the fourth edible crop produced worldwide that feeds more than a billion people [5]—there is evidence that yields will be greatly affected by climate change [6,7,8,9]. Progressive droughts, followed by rewatering through erratic rainfall predicted by climate change models, might induce negative changes in plant function and production, especially in drought-sensitive crops such as potatoes [10]. Vincent et al. [11] proposed that induce acclimation by “training” plants under different water restriction treatments (primed acclimation) is attainable and advocated for assessing the responses promoted by timing, severity, and duration of the stress in different crop varieties. It has also been pointed out that potatoes have potential for priming acclimation through timing the water reduction directly after tuber initiation [12]. It is essential, therefore, to understand how acclimation and phenotypic plasticity, i.e., shifts in phenotype as a response induced by environmental changes [13], will influence the resilience of the potato crop under climate change conditions [9].
Irrigation can overcome the problem induced by droughts; however, groundwater supplies are declining, and energy costs associated with irrigation are increasing [14]. Water availability for irrigation is considered as one of the most significant constraints for crop production in many parts of the world [15], drip irrigation being a technological solution that can help to combat water scarcity [16,17]. Increased aeration, water, and fertilizer use efficiency, and reduced labor cost, water wasting by percolation below the root zone, and leaching of available nutrients are considered as essential advantages of drip irrigation (DI) over furrow irrigation (FI) [18,19,20]. However, the apparent benefit of “hi-tech” irrigation (sensu [21]), in comparison with conventional ones, in terms of water saving, is a paradigm which is currently under discussion taking into account the spatial scale of analysis and the correct way of water productivity calculus, among others [21,22,23]. It is well known that finding the appropriate water context, i.e., combination of timing, duration, and intensity under conventional irrigation (e.g., FI) can reduce applied water with no yield reduction [24,25,26,27]. For instance, some potato studies suggest that alternate FI can save as much water as DI with no tuber yield penalization, but with a lower carbon footprint and higher economic benefit [28].
The photosynthesis or carbon assimilation rate (A n ), one of the key determinants for plant productivity and survival [29], has been suggested as appropriate but uncommon measure of plant stress [30]. In potatoes, the percentage of maximum A n has shown a close relationship with tuber yield reduction under different soil water conditions [31]. Considering the high relationship between A n and stomatal conductance, the first response to desiccation [32], the maximum light-saturated stomatal conductance (g s _ m a x ) is a useful parameter for comparing photosynthetic performance responses between different species and experimental conditions [33]. Recently, g s _ m a x has been regarded as one of the most pertinent physiological trait, closely related to tuber yield, to define water status for watering purposes under drip irrigation in potatoes [31,34,35]. Likewise, fluorescence can be a potent tool to study photosynthetic performance, especially when complemented with other noninvasive measurements such as gas exchange analyses [36]. This trait has been used to assess potato varieties under stress conditions [37]. Another relevant measurement to ascertain stomatal and photosynthetic responses to water stress is the leaf isotopic composition, from which the isotopic discrimination against 13 C ( Δ 13 C) works as an integrative trait [38] that could help better understand the mechanisms behind plant interactions, growth, and survival [30]. In addition, Ramírez et al. [39] highlighted the importance of Δ 13 C as an indicator of photosynthetic performance under well and water restricted conditions in potatoes.
Analyzing A n will allow determining the degree of a plant’s resistance to adverse environmental conditions [37]. Photosynthetic responses of potato plants to progressive drought and rewatering are not fully understood, and the monitoring of critical physiological traits (like fluorescence and Δ 13 C) might help with improving our understanding about water stress influence on growth and yield, due to their close correlation with carbon exchange [40,41]. Because different irrigation methods impose different water contexts and some studies highlight that thresholds for watering schedules in potato are not necessarily the same under different irrigation systems [42], we hypothesize a differentiated physiological behavior which will affect the irrigation thresholds employed to optimize water use under drip or furrow irrigation. The objectives of this study were: (i) to analyze the effect of water restriction treatments on physiological traits related to photosynthetic recovery and tuber yield, and (ii) to characterize the photosynthetic performance of two irrigation methods under different water stress levels, based on g s _ m a x thresholds. In this study, two irrigation methods (DI and FI) with water applied at different timings, depending on g s _ m a x average values (0.05 and 0.15 mol H 2 O m 2 s 1 ), were tested and compared against controls, where photosynthetic traits were monitored in a potato variety. This study is the second on a series of experiments on the subject, conducted on the same field and with the same potato variety [34,35]. The main difference here is that we wanted to ascertain whether the physiological indicators and thresholds defined for drip irrigation could be extrapolated to furrow irrigation.

2. Materials and Methods

2.1. Study Area and Plant Material

The field trial was carried out at the International Potato Center (CIP) experimental station in Lima, Peru (12.08 S, 76.95 W, 244 m a.s.l.), from 5 July to 10 October 2017. The study site is characterized by a subtropical arid desert climate with cloudy skies during the first hours of the day (autumn–winter), and 19.7 ± 0.9 C and 6.0 ± 0.74 mm of average annual temperature and precipitation, respectively (2013–2017, CIP Meteorological Station). The soil was a sandy-loam texture (58%, 25%, and 17% of sand, silt, and clay, respectively) with high, medium, and low phosphorus (39.9 ± 0.55 ppm), potassium (197.3 ± 3.51 ppm), and organic matter (1.39 ± 0.02%) contents, respectively (Laboratorio de Análisis de Suelo, Plantas, Agua y Fertilizantes–Universidad Nacional Agraria La Molina, Lima, Peru). During the trial, the minimum, maximum and average daily temperatures were 12.7 C (23 July), 23.5 C (25 September) and 16.1 ± 0.1 C, respectively, whereas average daily relative humidity and global solar radiation were 88.6 ± 0.4% and 9.83 ± 0.51 MJ m 2 day 1 , respectively (see more details in Table 1) (HOBO U30 Station model, with temperature/relative humidity sensor S-THB-M008 model and silicon pyranometer Sensor S-LIB-M003 model, Onset Computer Corporation, Bourne, MA, USA). The potato variety studied was UNICA (CIP code: 392797.22), an improved genotype partially tolerant to salt with high-temperature tolerance, PVY virus resistance and susceptibility to leafminer fly (Liriomyza huidobrensis) [43].

2.2. Experimental Design and Crop Management

A twin experiment was implemented, to assess photosynthetic recovery of potatoes under water restriction, using FI and DI irrigation methods. The total area of 1953 m 2 was divided into two and the plots assigned to the irrigation methods (from now on referred to as plots) were separated by a distance of 2.7 m. Randomized complete block designs (RCBD) were used in each plot (see experimental layout in Figure S1). Each plot had 12 subplots (45 m 2 ) distributed into four blocks (three subplots per block). In each block, 2 water restriction levels and a fully irrigated control were randomly assigned, containing 120 plants distributed in 4 rows. The distances between plants and rows were 0.3 and 0.9 m, respectively. The fertilization dose based on N: P 2 O 5 : K 2 O (180: 100: 160 kg 1 ha 1 ) was applied as ammonium nitrate, diammonium phosphate, and potassium sulfate, 24, 31, and 47 kg, respectively, during the planting day. During the first hilling i.e., 27 days after planting (DAP), 40 kg of ammonium nitrate was added to complete the remaining 50% of nitrogen required. Ethological pest control was carried out using blue and yellow traps to control leafminer and white fly (Liriomyza huidobrensis and Trialeurodes vaporariorum, respectively). In addition, pheromone traps (Pherobank, Holland) were used to combat tomato and potato moths (Tuta absoluta and Phthorimaea operculella, respectively). The chemical pest control was applied twice (at 63 and 70 DAP), accompanied by foliar fertilizer application to enhance plant nutrition. The first one was composed of 0.15 L of Vertimec (Syngenta Crop Protection AG, Basel, Switzerland) and 0.125 L of Sunfire (BASF SA, Carlsbad, Brazil) insecticides, plus 0.5 kg of Quimifol 600 (Química Suiza, Lima, Peru) and 0.05 kg of Oligomix (Química Suiza, Lima, Peru) foliar fertilizers in a dilution of 100 L. The second application was composed of 0.125 L of Movento (Bayer AG, Leverkusen, Germany) and 0.035 kg of Trigard (Farmagro, Lima, Peru) insecticides to fight Prodiplosis longifila, plus 0.5 kg of Quimifol 600, 0.05 kg of Oligomix and 0.5 L of agricultural oil (Aris Industrial SA, Lima, Peru).

2.3. Water Management

FI was carried out individually to each subplot by controlling the inflow and closing the extreme to prevent leakage. The inflow came from the experimental station main canal. Once the irrigation water has reached the end of the furrows, the inflow was stopped. The irrigation volume applied depended on the time it took to flood the subplot and the flow rate with which it came, estimated on each occasion. DI system was set up in the other plot following Rinza et al. [34] procedure. In summary, 2 drip tapes per row were installed with a space between drippers, dripper flow rate, number of drippers per tape, and tape pressure of 0.2 m, 1.49 ± 0.07 L h 1 , 63 and 0.05 MPa, respectively. The water was supplied by a pump (1 hp, Venus 33M, Banyoles, Spain) connected to a 5000 L capacity tank. Within the experimental field, two areas of 1.2 × 1.2 m 2 (with edges 0.2 m high) were flooded and covered with plastic to avoid evaporation. After 6 days, when drainage became negligible due to percolation [44], a pit (0.8 × 0.7 × 0.5 m 3 ) was dug in each area. Later, soil samples were collected at 0, 0.10, 0.25 and 0.40 m depth levels, using cylinders of known volume (V t , in cm 3 ). The samples were weighed fresh (S f , in g) and after oven dried (S d , in g) at 105 C during 72 h for determining volumetric soil moisture content [45] at field capacity ( θ f c ) as follows:
θ f c ( % ) = ( S f S d ) V t × 100
The θ f c corresponding to 0, 0.10, 0.25, and 0.40 m depth levels were 34.5 ± 2.1, 32.7 ± 1.2, 31.1 ± 1.2, and 28.6 ± 0.2%, respectively. The required irrigation volume, expressed in irrigation time per subplot (IT), was estimated from soil moisture sampling. For this, composite samples were taken randomly in each subplot, covering maximum concentration of root system in the soil profile ( d r ) according to plant developmental stage (0.15–0.30 m depth). Soil samples were weighed and dried to obtain the current θ , considering water density and soil bulk density of 1.00 and 1.67 g cm 3 , respectively (see more details in [31]). Finally, IT was estimated as follows:
I T ( h ) = l × w × d r × ( θ f c θ ) × 1000 F
where l is the row length (12.5 m) and w, the row width (0.35 m), and F is the flow rate, which was estimated from the product of average dripper flow rate (1.49 L h 1 ) with dripper’s number per row (126).
Water restriction treatments consisted of 2 water stress levels, imposed by stopping irrigation until reaching g s _ m a x thresholds: 0.15 (T2) and 0.05 (T3) mol H 2 O m 2 s 1 , before rewatering (see [34] for specifications). Control subplots (T1) were watered once they reached 70% of θ f c [35]. In the case of FI, all the subplots received an average volume of 1.60 ± 0.17 m 3 on each irrigation time, but with a different frequency between treatments, being T1 subplots watered every 12 days, and T2 and T3, after 30 and 54 days without water, respectively. Instead, DI subplots had different irrigation volumes and frequencies. Their T1 subplots got an average volume of 0.41 ± 0.05 m 3 every 7 days, and T2 and T3 received 0.70 ± 0.12 and 0.945 m 3 , after 37 and 72 days of water restriction, respectively.

2.4. Ecophysiological Monitoring and Tuber Yield Assessment

Water restriction began at 30 DAP, after tuber initiation onset (TIO), and the ecophysiological monitoring started 3 days later. Since then, g s _ m a x and A n were recorded every 2 days using a portable photosynthesis system (LI-6400 XT model, Li-Cor Bioscience, Lincoln, NE, USA) from 8:00 a.m. to 11:00 a.m., in an apical leaflet of the third youngest leaf of a plant, always the same 3 central plants of each subplot (target plants). The parameters set in the equipment were: 1500 μ mol m 2 s 1 PAR, which corresponded to UNICA’s light saturation point for the study area and season, 400 ppm of CO 2 , boundary layer conductance of 9.29 mol m 2 s 1 and air flow rate of 500 μ mol s 1 . The percentage of maximum assimilation rate (PMA) was estimated from current A n and the maximum value obtained in a subplot throughout the whole experiment (A m a x ), following Resco et al. [46] procedure. The value of A n = 30.6 μ mol CO 2 m 2 s 1 , obtained from a DI subplot during first days of monitoring, was the highest value recorded and thus considered as A m a x :
P M A ( % ) = A n A m a x × 100
Additional variables were measured the day before (−1) and 1, 4 and 7 days after rewatering, conforming a recovery cycle. Fluorescence, represented by the parameters photochemical efficiency of PSII at light saturated ( F v / F m ) and effective quantum yield of PSII photochemistry ( Φ P S I I ), were calculated following Genty et al. [47] procedure:
F v F m = F m F o F m
Φ P S I I = F m F s F m
where F v , F m , F o , and F s (see Equations (4) and (5)) corresponded to the variable and maximal fluorescence during a saturating light flash, the minimal fluorescence of a light adapted leaf that has momentarily been darkened, and a “steady-state” fluorescence, respectively. It was also recorded by the LI-6400 XT with an integrated fluorescence chamber head (6400-40 LCF model, Li-Cor Bioscience, Lincoln, NE, USA).
Leaf composite samples per subplot (12 medium and apical leaflets from target plants) were collected only the day before (−1) and 4 days after rewatering (+4) to calculate carbon isotope discrimination in leaves ( Δ C l e a f ) following Ramírez et al. [39] procedure. In summary, the samples were dried (at 60 C per 3 days), ground, packed in tin capsules, and delivered to the Stable Isotopes Facilities at University of California–Davis, where carbon isotope composition was analyzed with a PDZ Europa ANCA–GSL elemental analyzer coupled to a PDZ Europa 20–20 isotope ratio mass spectrometer (Sercon Ltd., Cheshire, UK). Finally, tuber yield was assessed at 97 DAP with the harvest of 6 central plants per subplot (target plants and contiguous). Fresh tuber mass per plant was recorded, and then tuber samples (100 g) were dried at 60 C per 3 days for estimating dry tuber yield (DTY).

2.5. Statistical Analysis

Each plot of the twin experiment was firstly analyzed, individually as a RCBD. Prior to combining both plots (FI and DI), the hypothesis of common variance was made using the Bartlett’s test [48]. Ecophysiological responses to water restriction treatments were taken over time through repeated measurements, following Wolfinger and Chang [49]. The analysis of variance generated using this method allowed the determination of statistical differences between treatments, as a function of time, with a pre-established probability level (p-value) of 5%. Additionally to the comparison of Δ C l e a f among water stress levels, the effect of rewatering over Δ C l e a f was assessed with a paired sample t-test. The water stress level effect on tuber yield was tested with the ANOVA (separate by irrigation methods as well as combining both methods) and then compared with Tukey multiple range test. The Spearman correlation was used to evaluate the relationship between PMA assessed at different moments in a recovery cycle, with DTY. A principal component analysis (PCA) was run to analyze the influence of the extent and magnitude of the previous drought and the intensity of the water pulse applied for rewatering (IP) over photosynthetic recovery capacity. The previous drought was characterized by its duration (number of days with water restriction before rewatering, D) and the phenological stage in which rewatering was applied, represented with the accumulated thermal time estimated until that day (TT), following Ramírez et al. [50] procedure. All statistical analysis were performed with R Studio [51].

3. Results

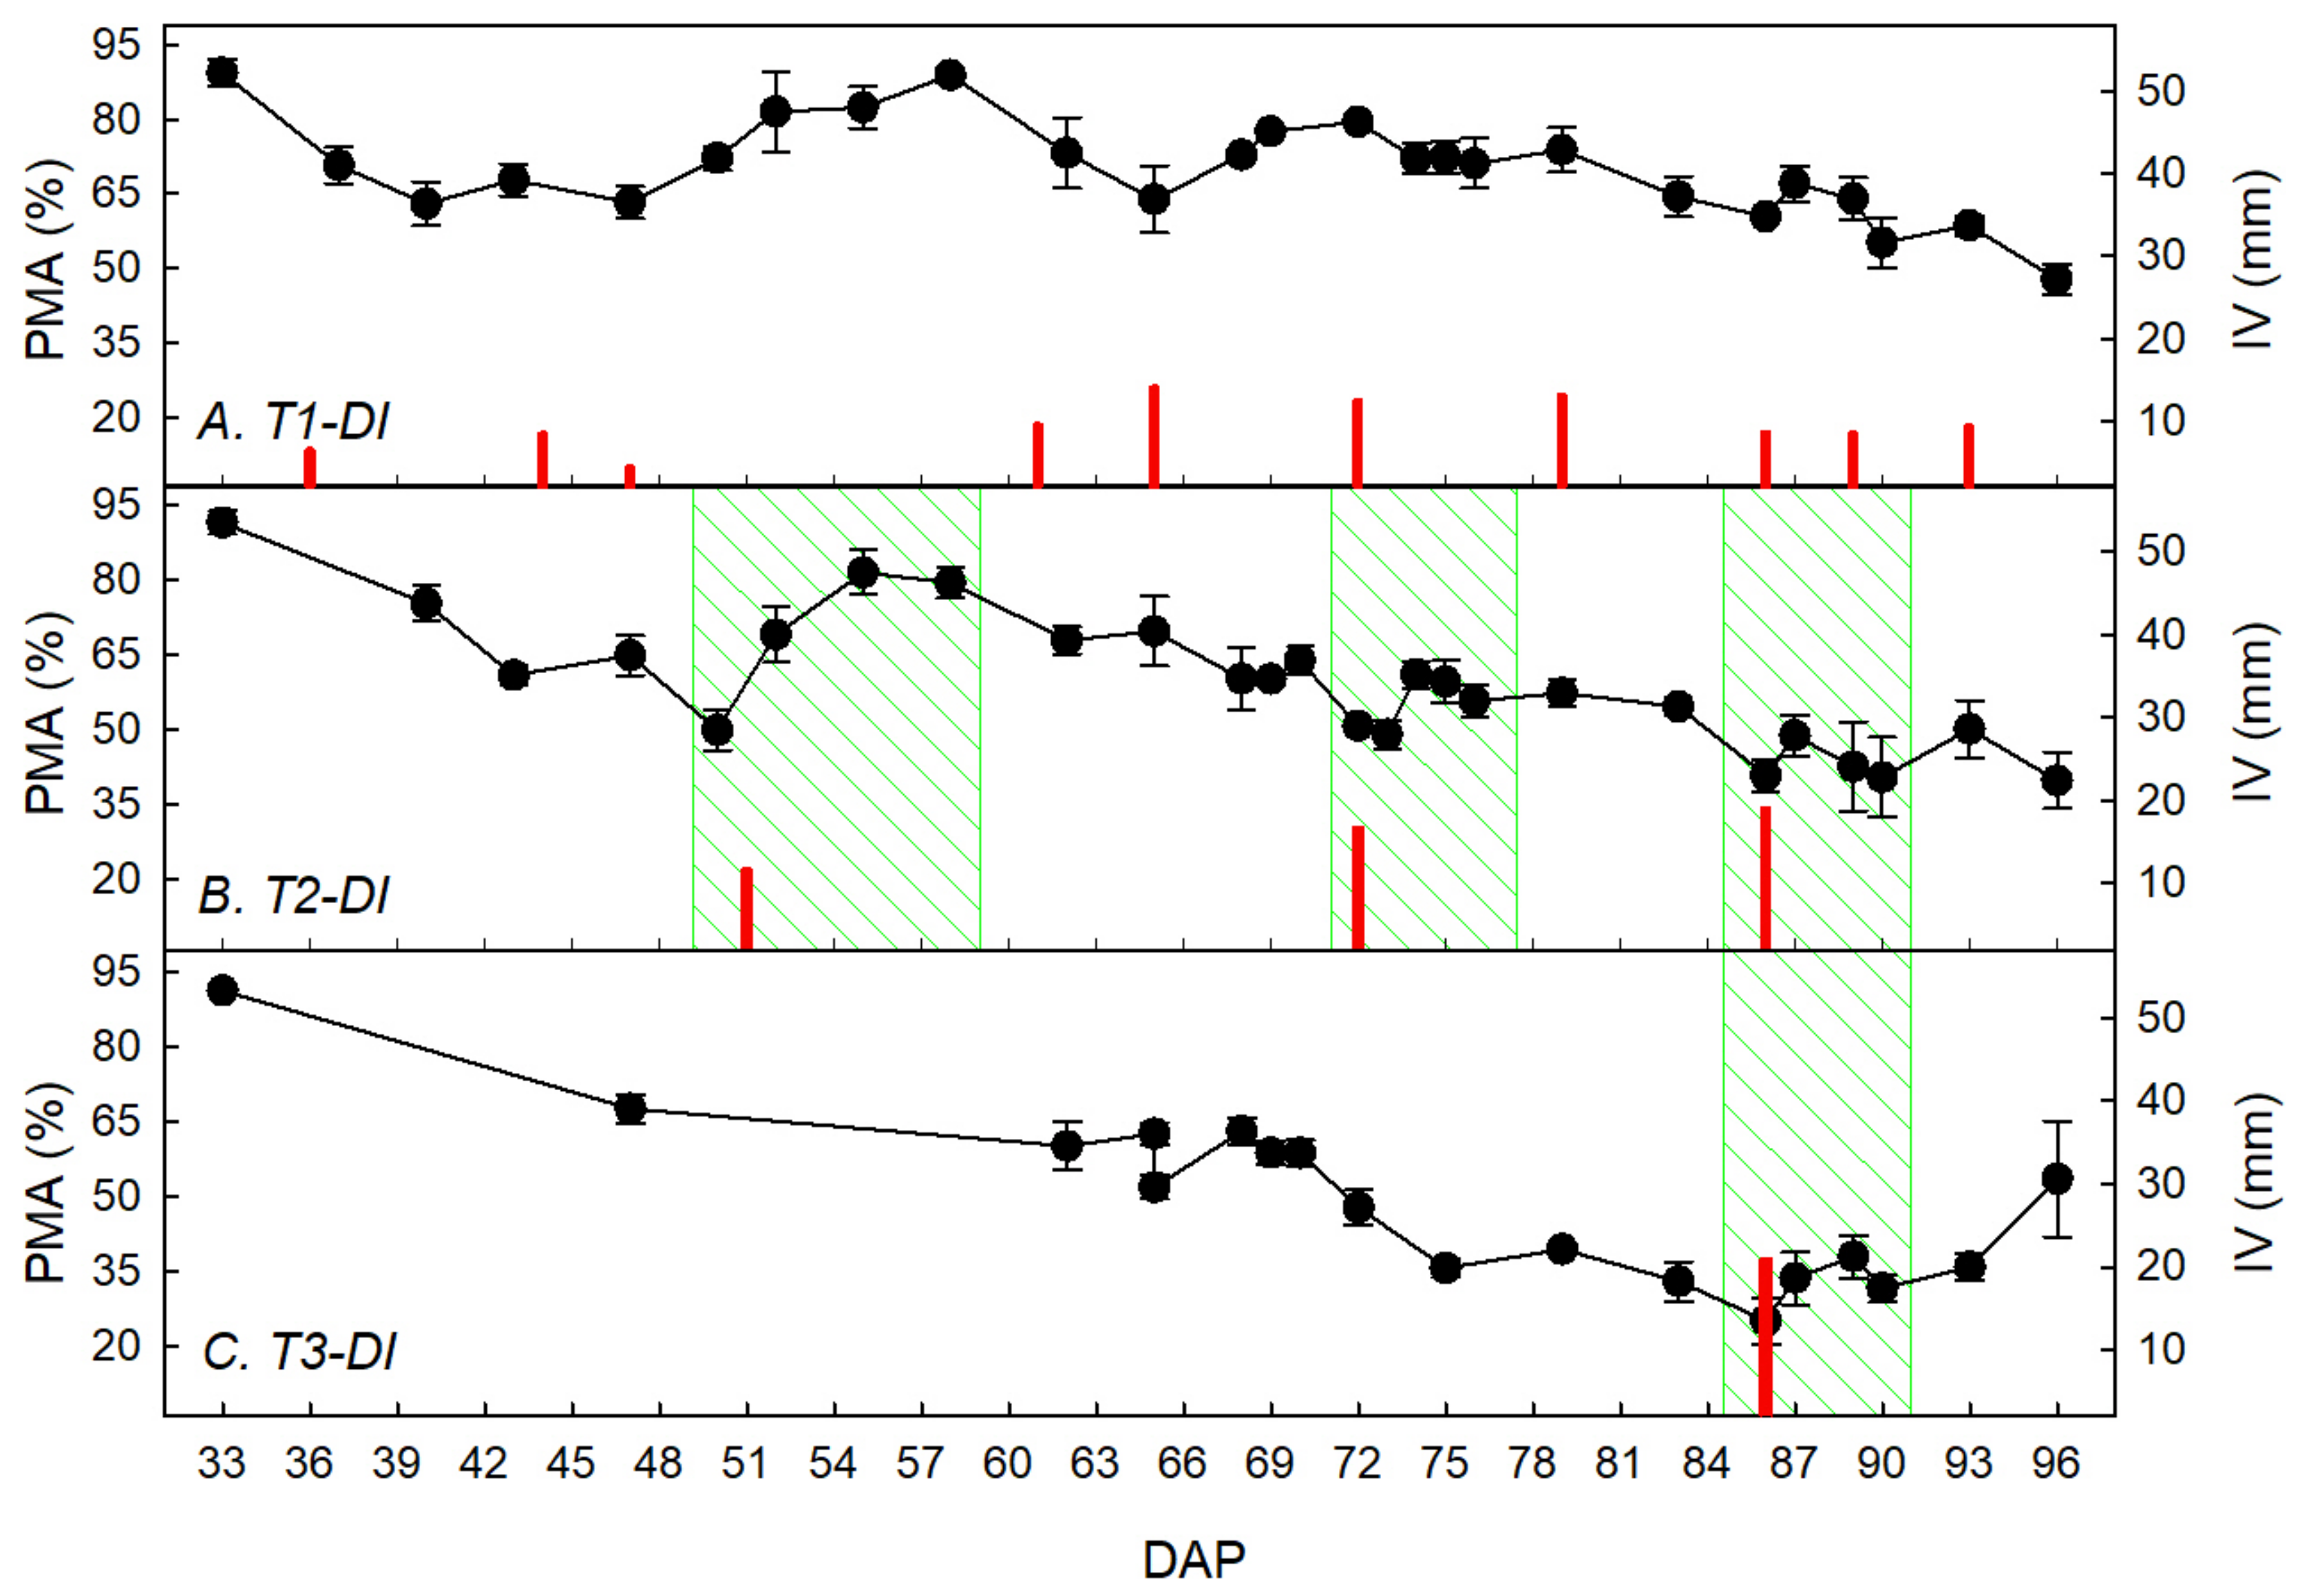
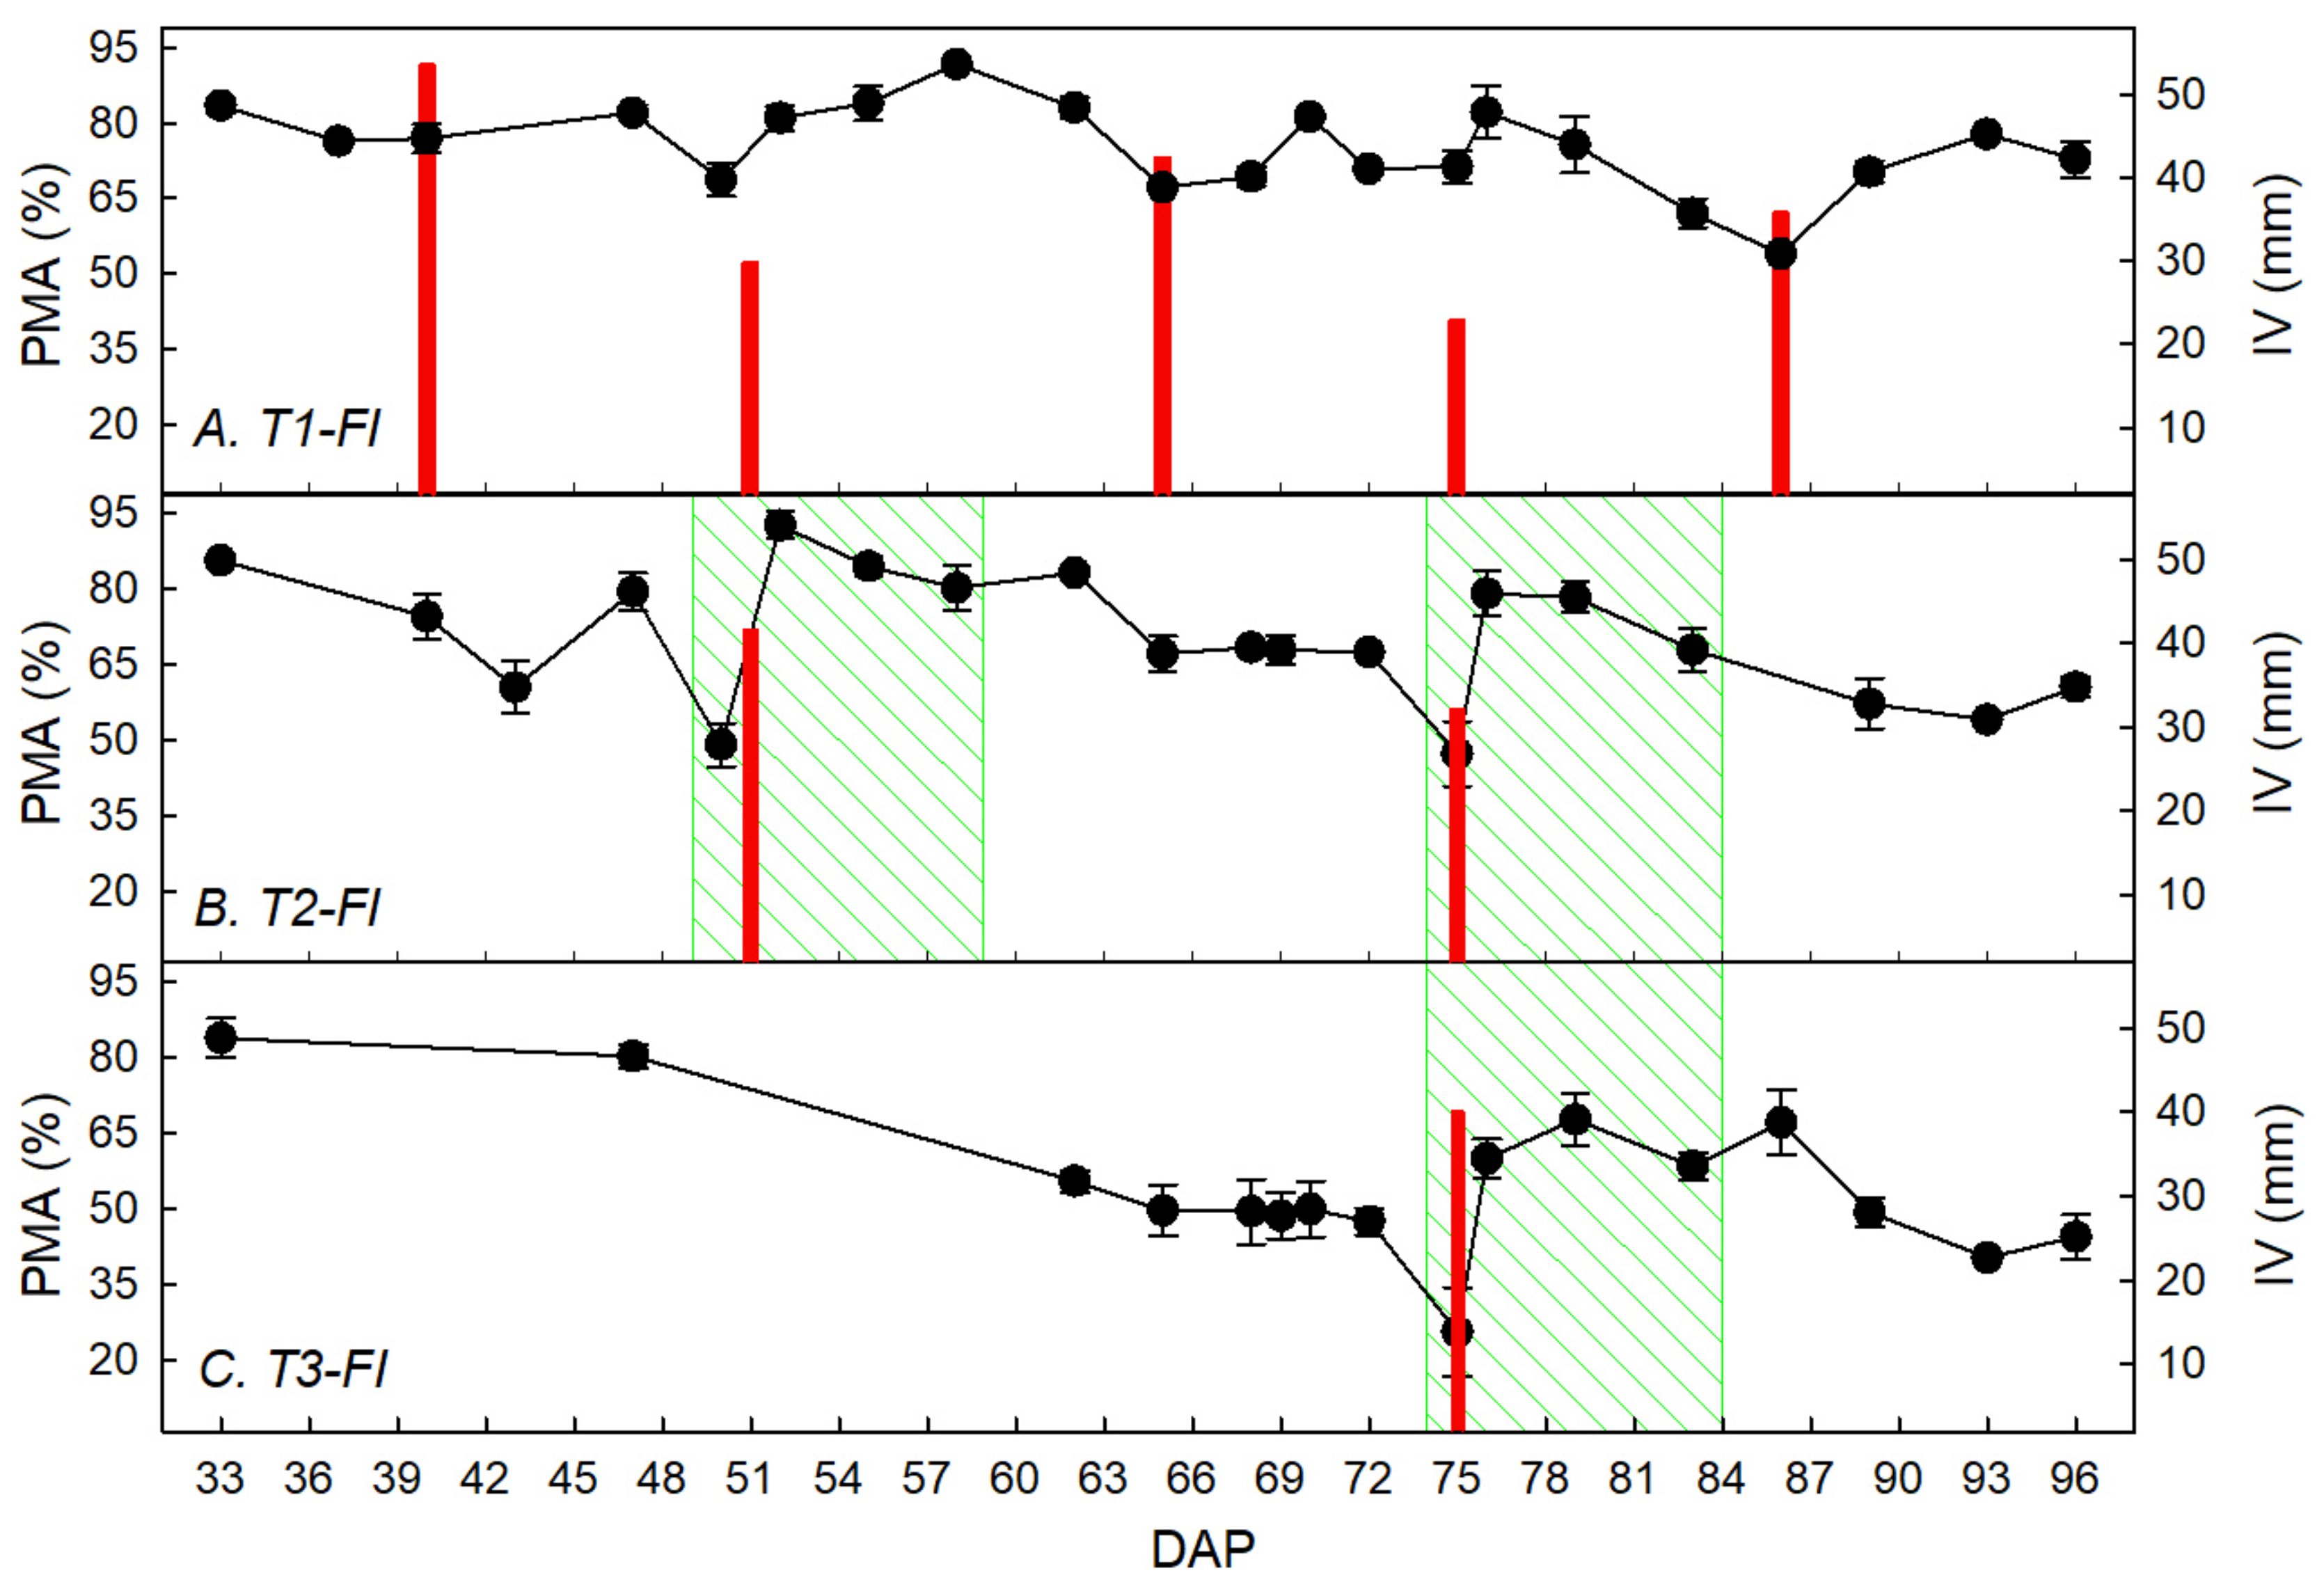
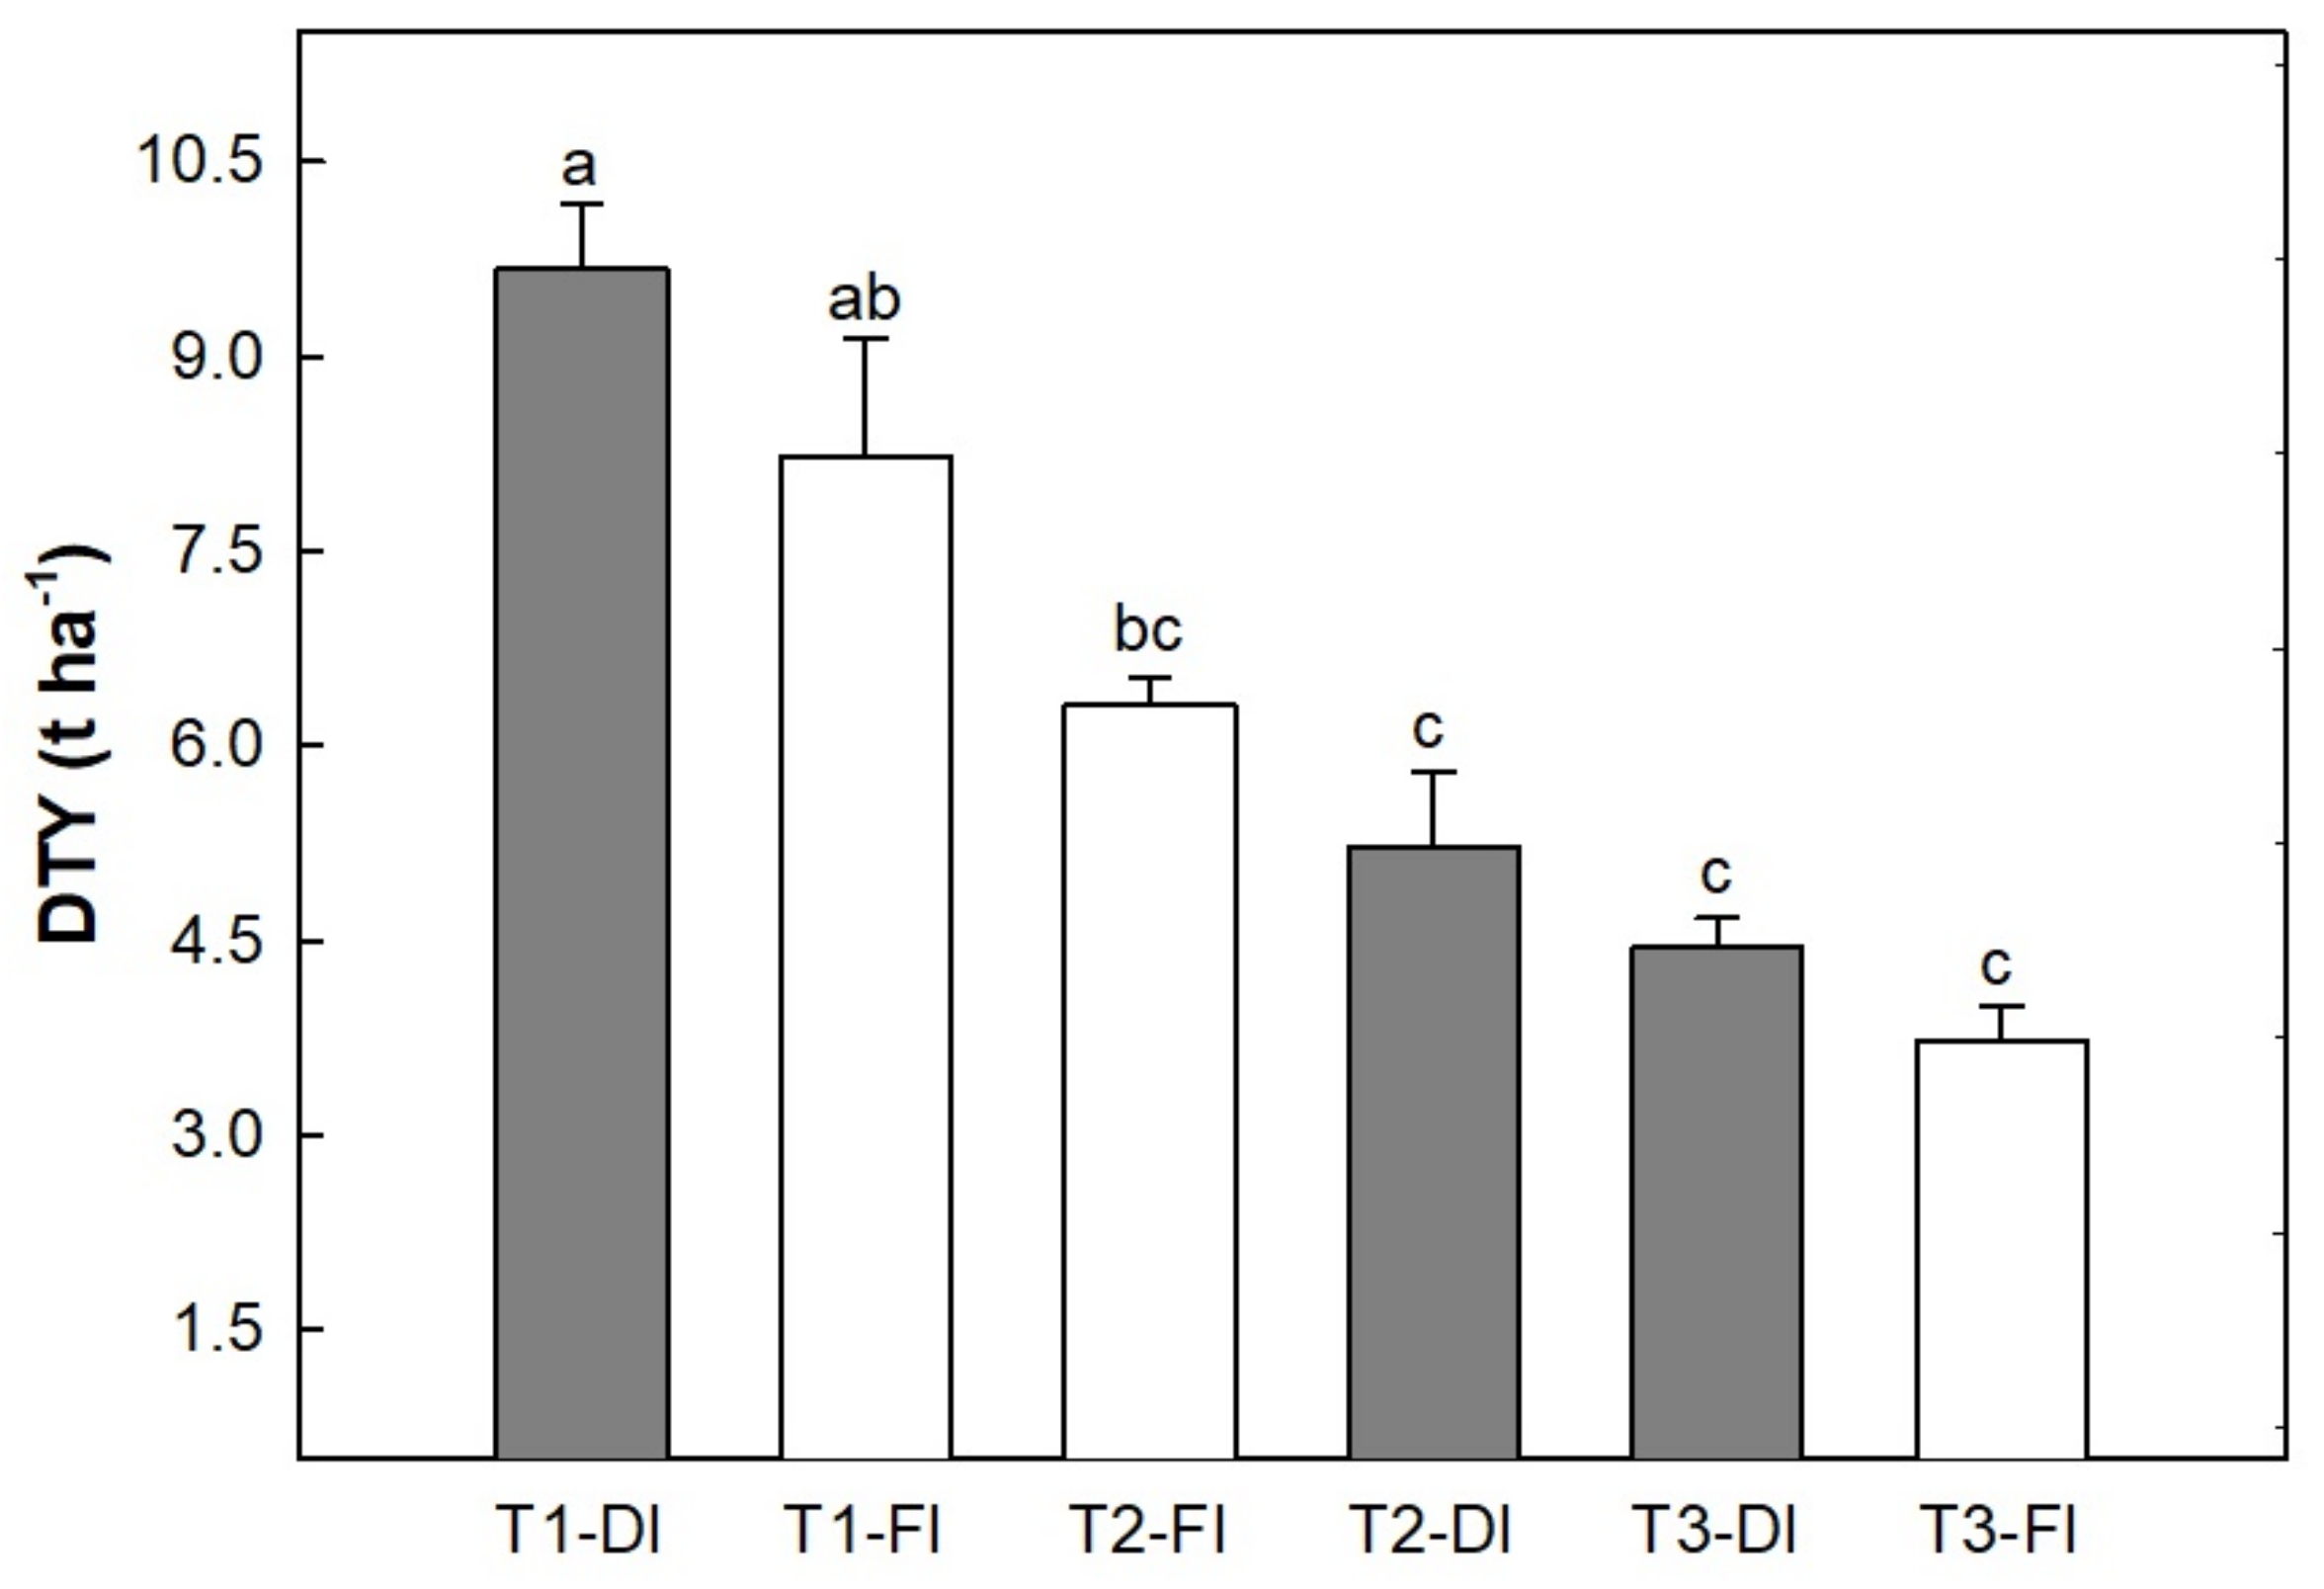
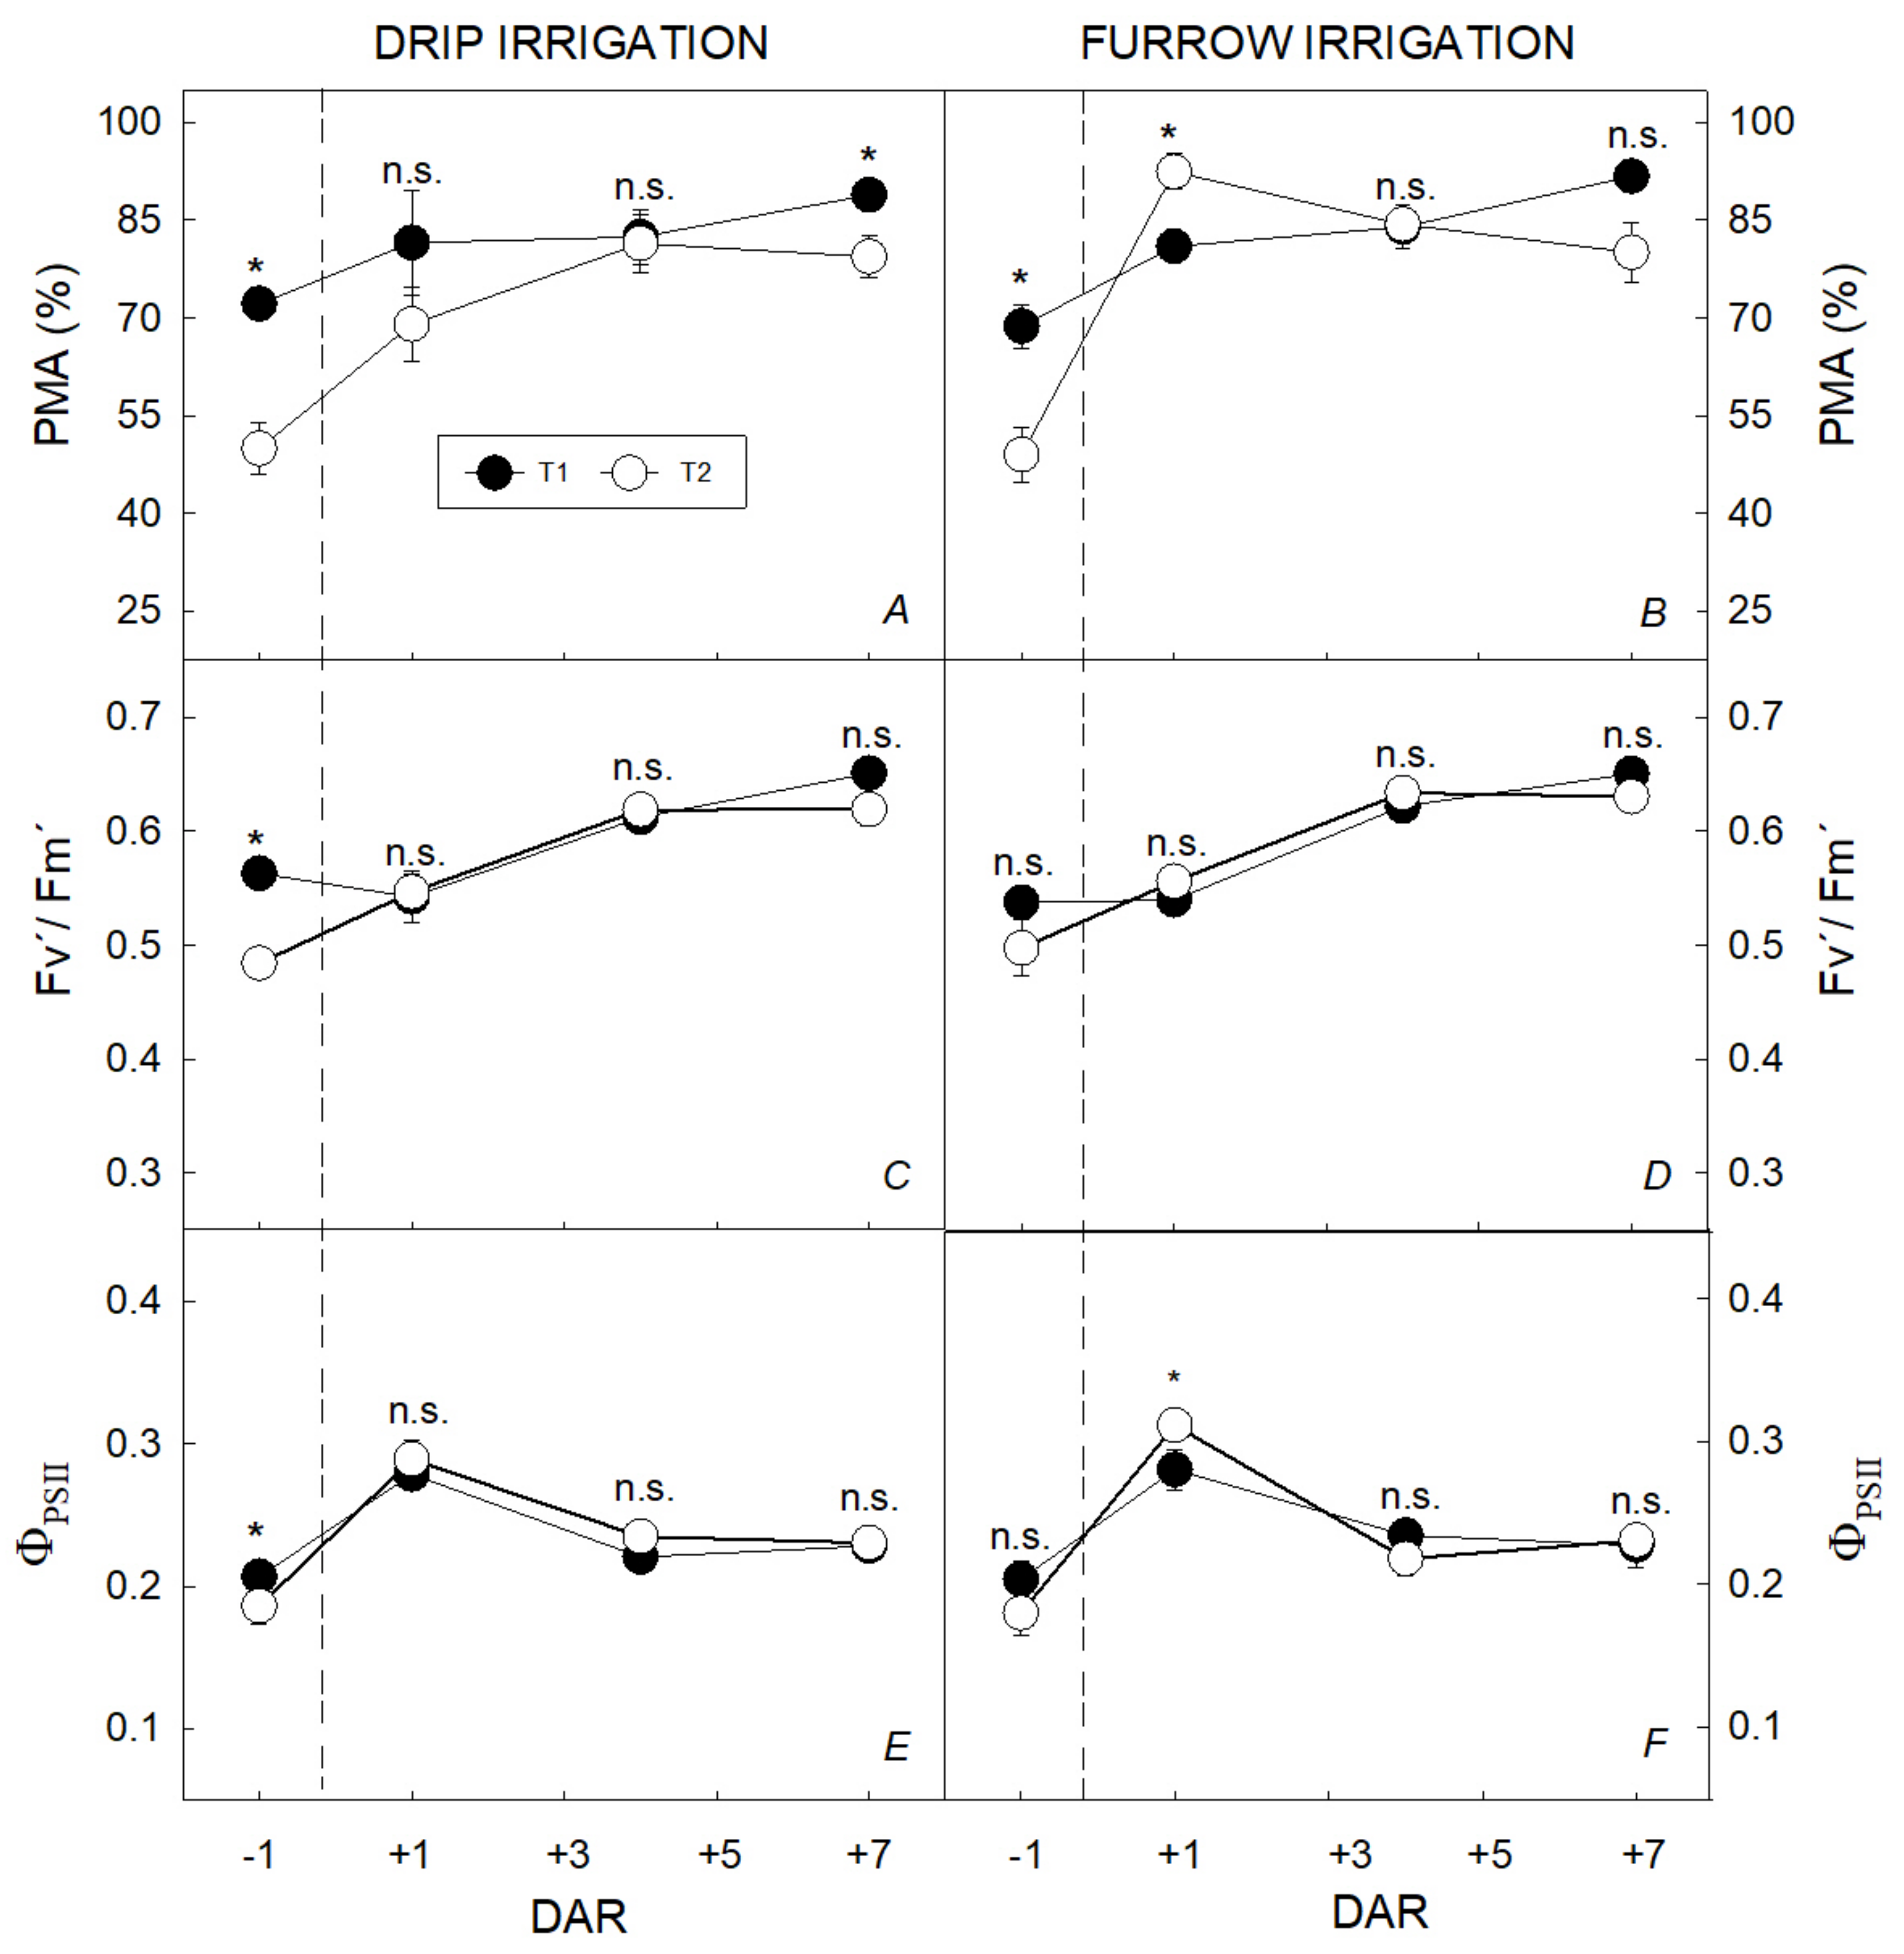
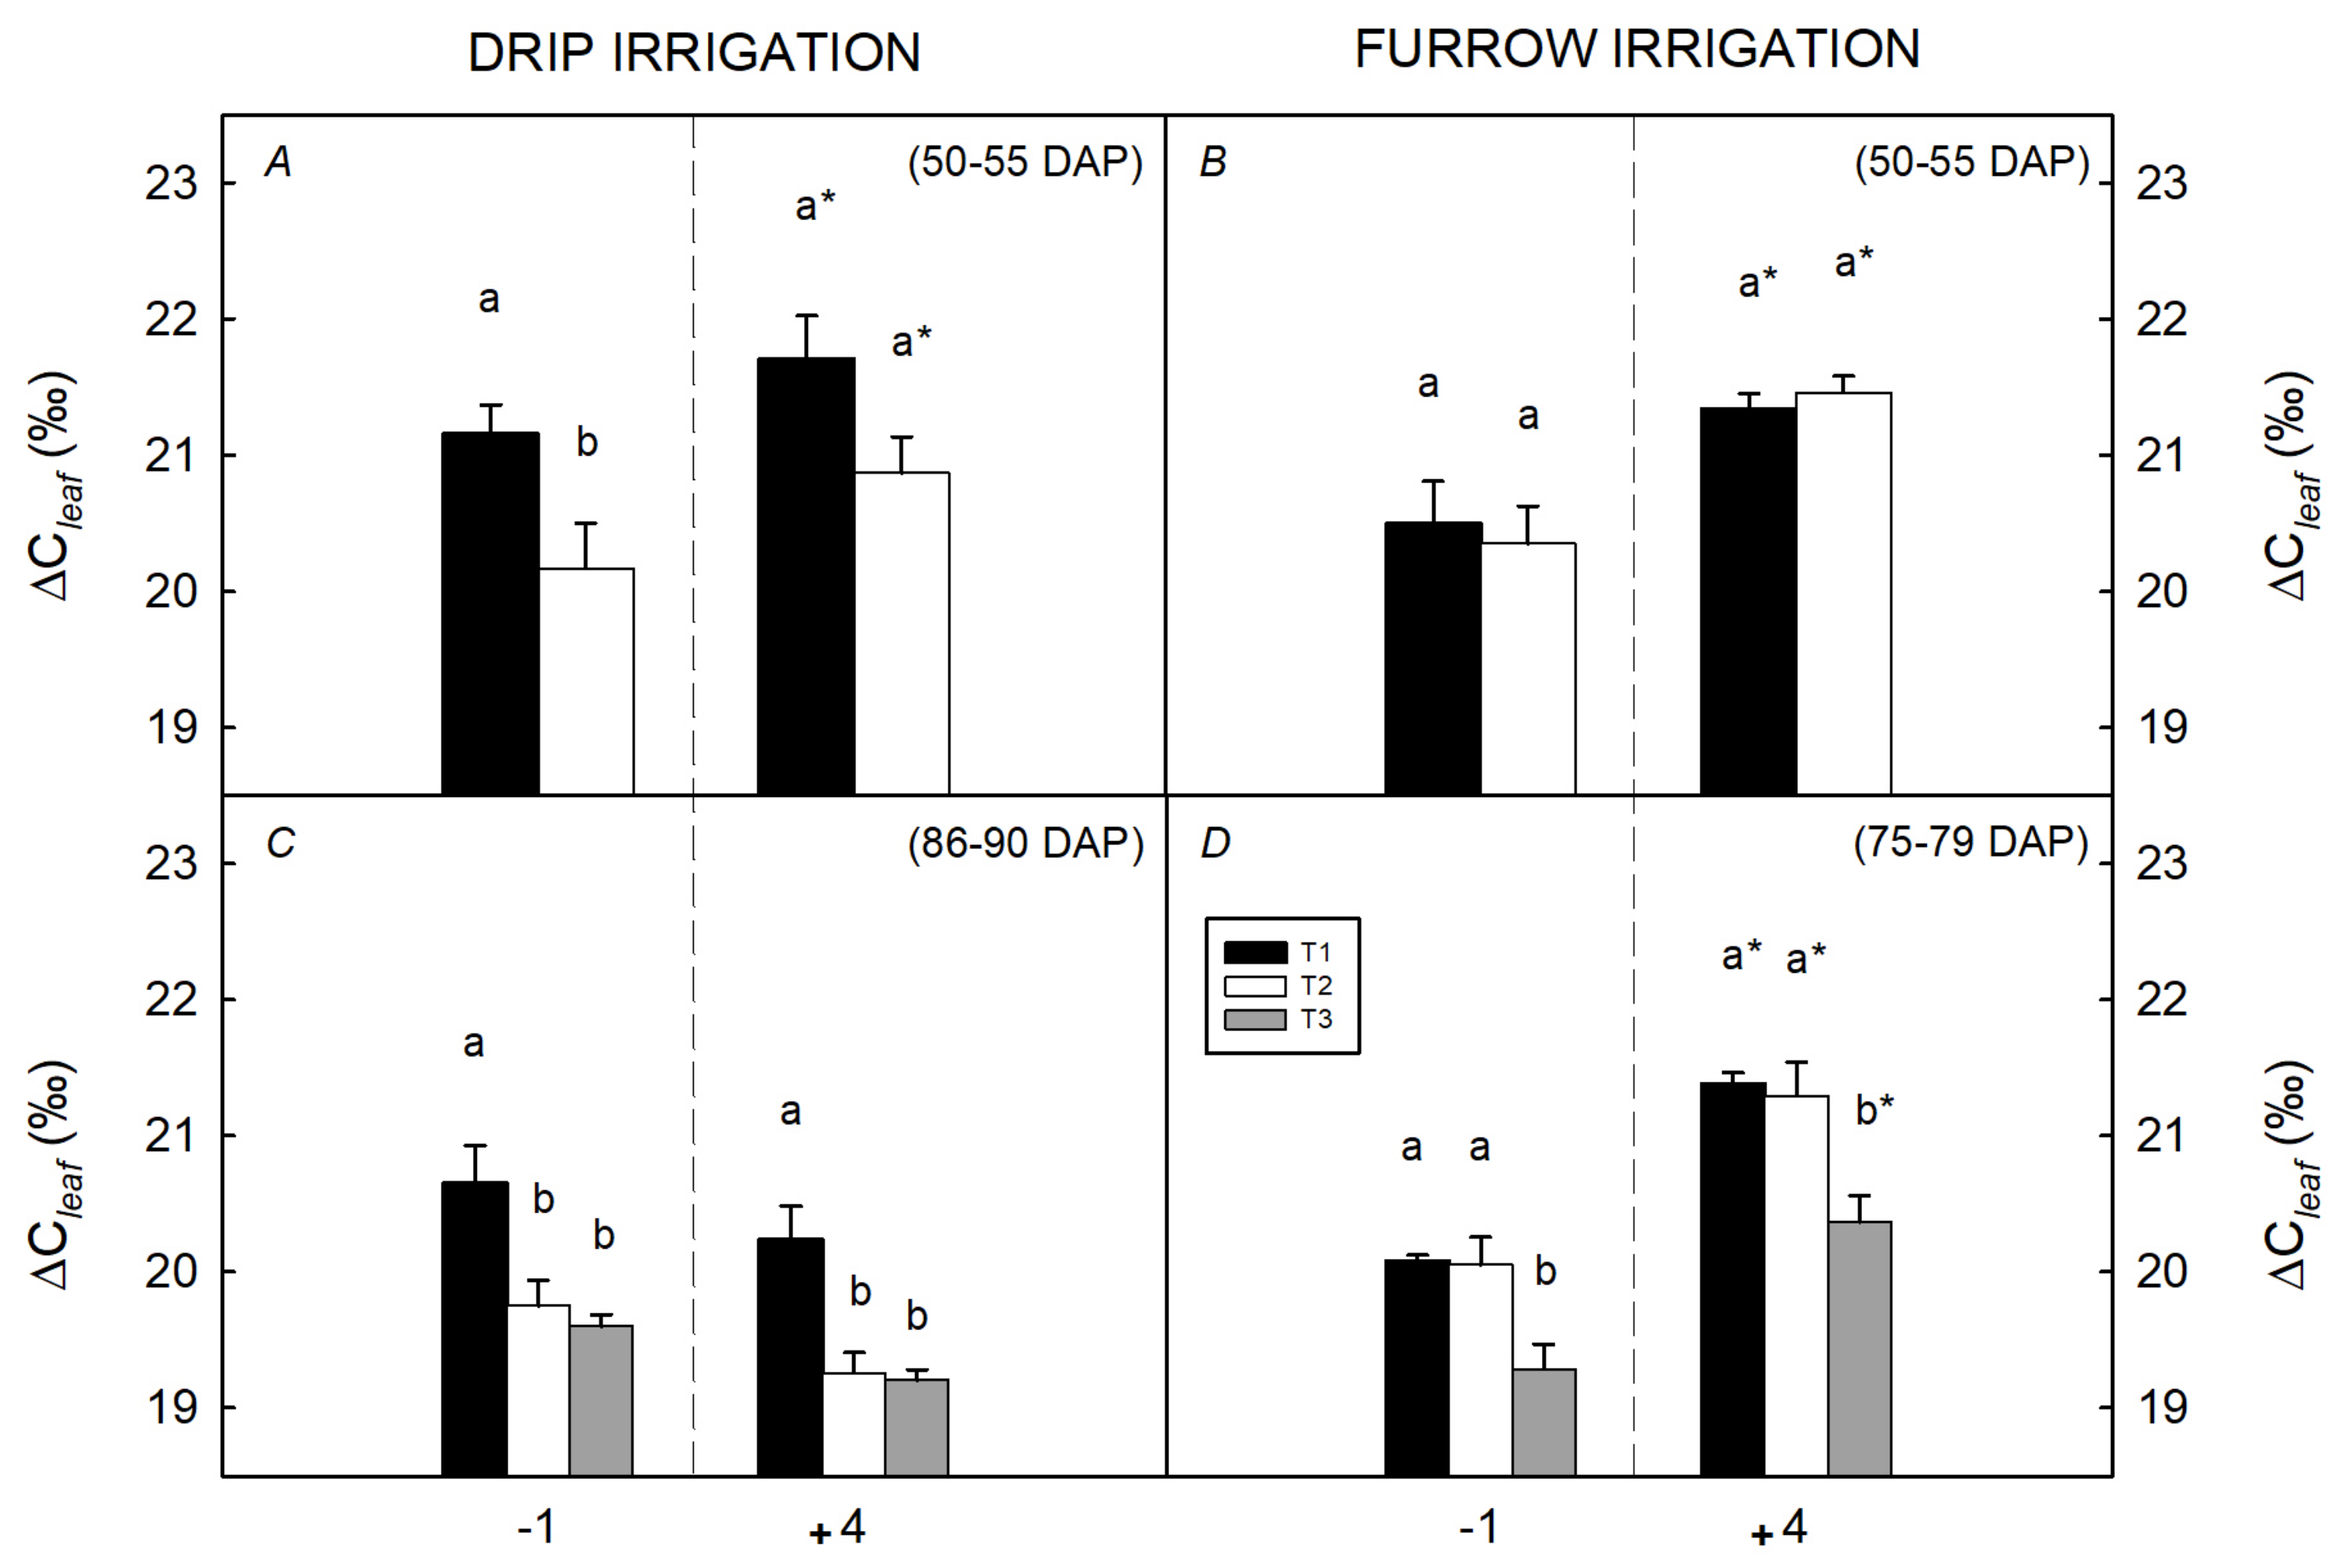
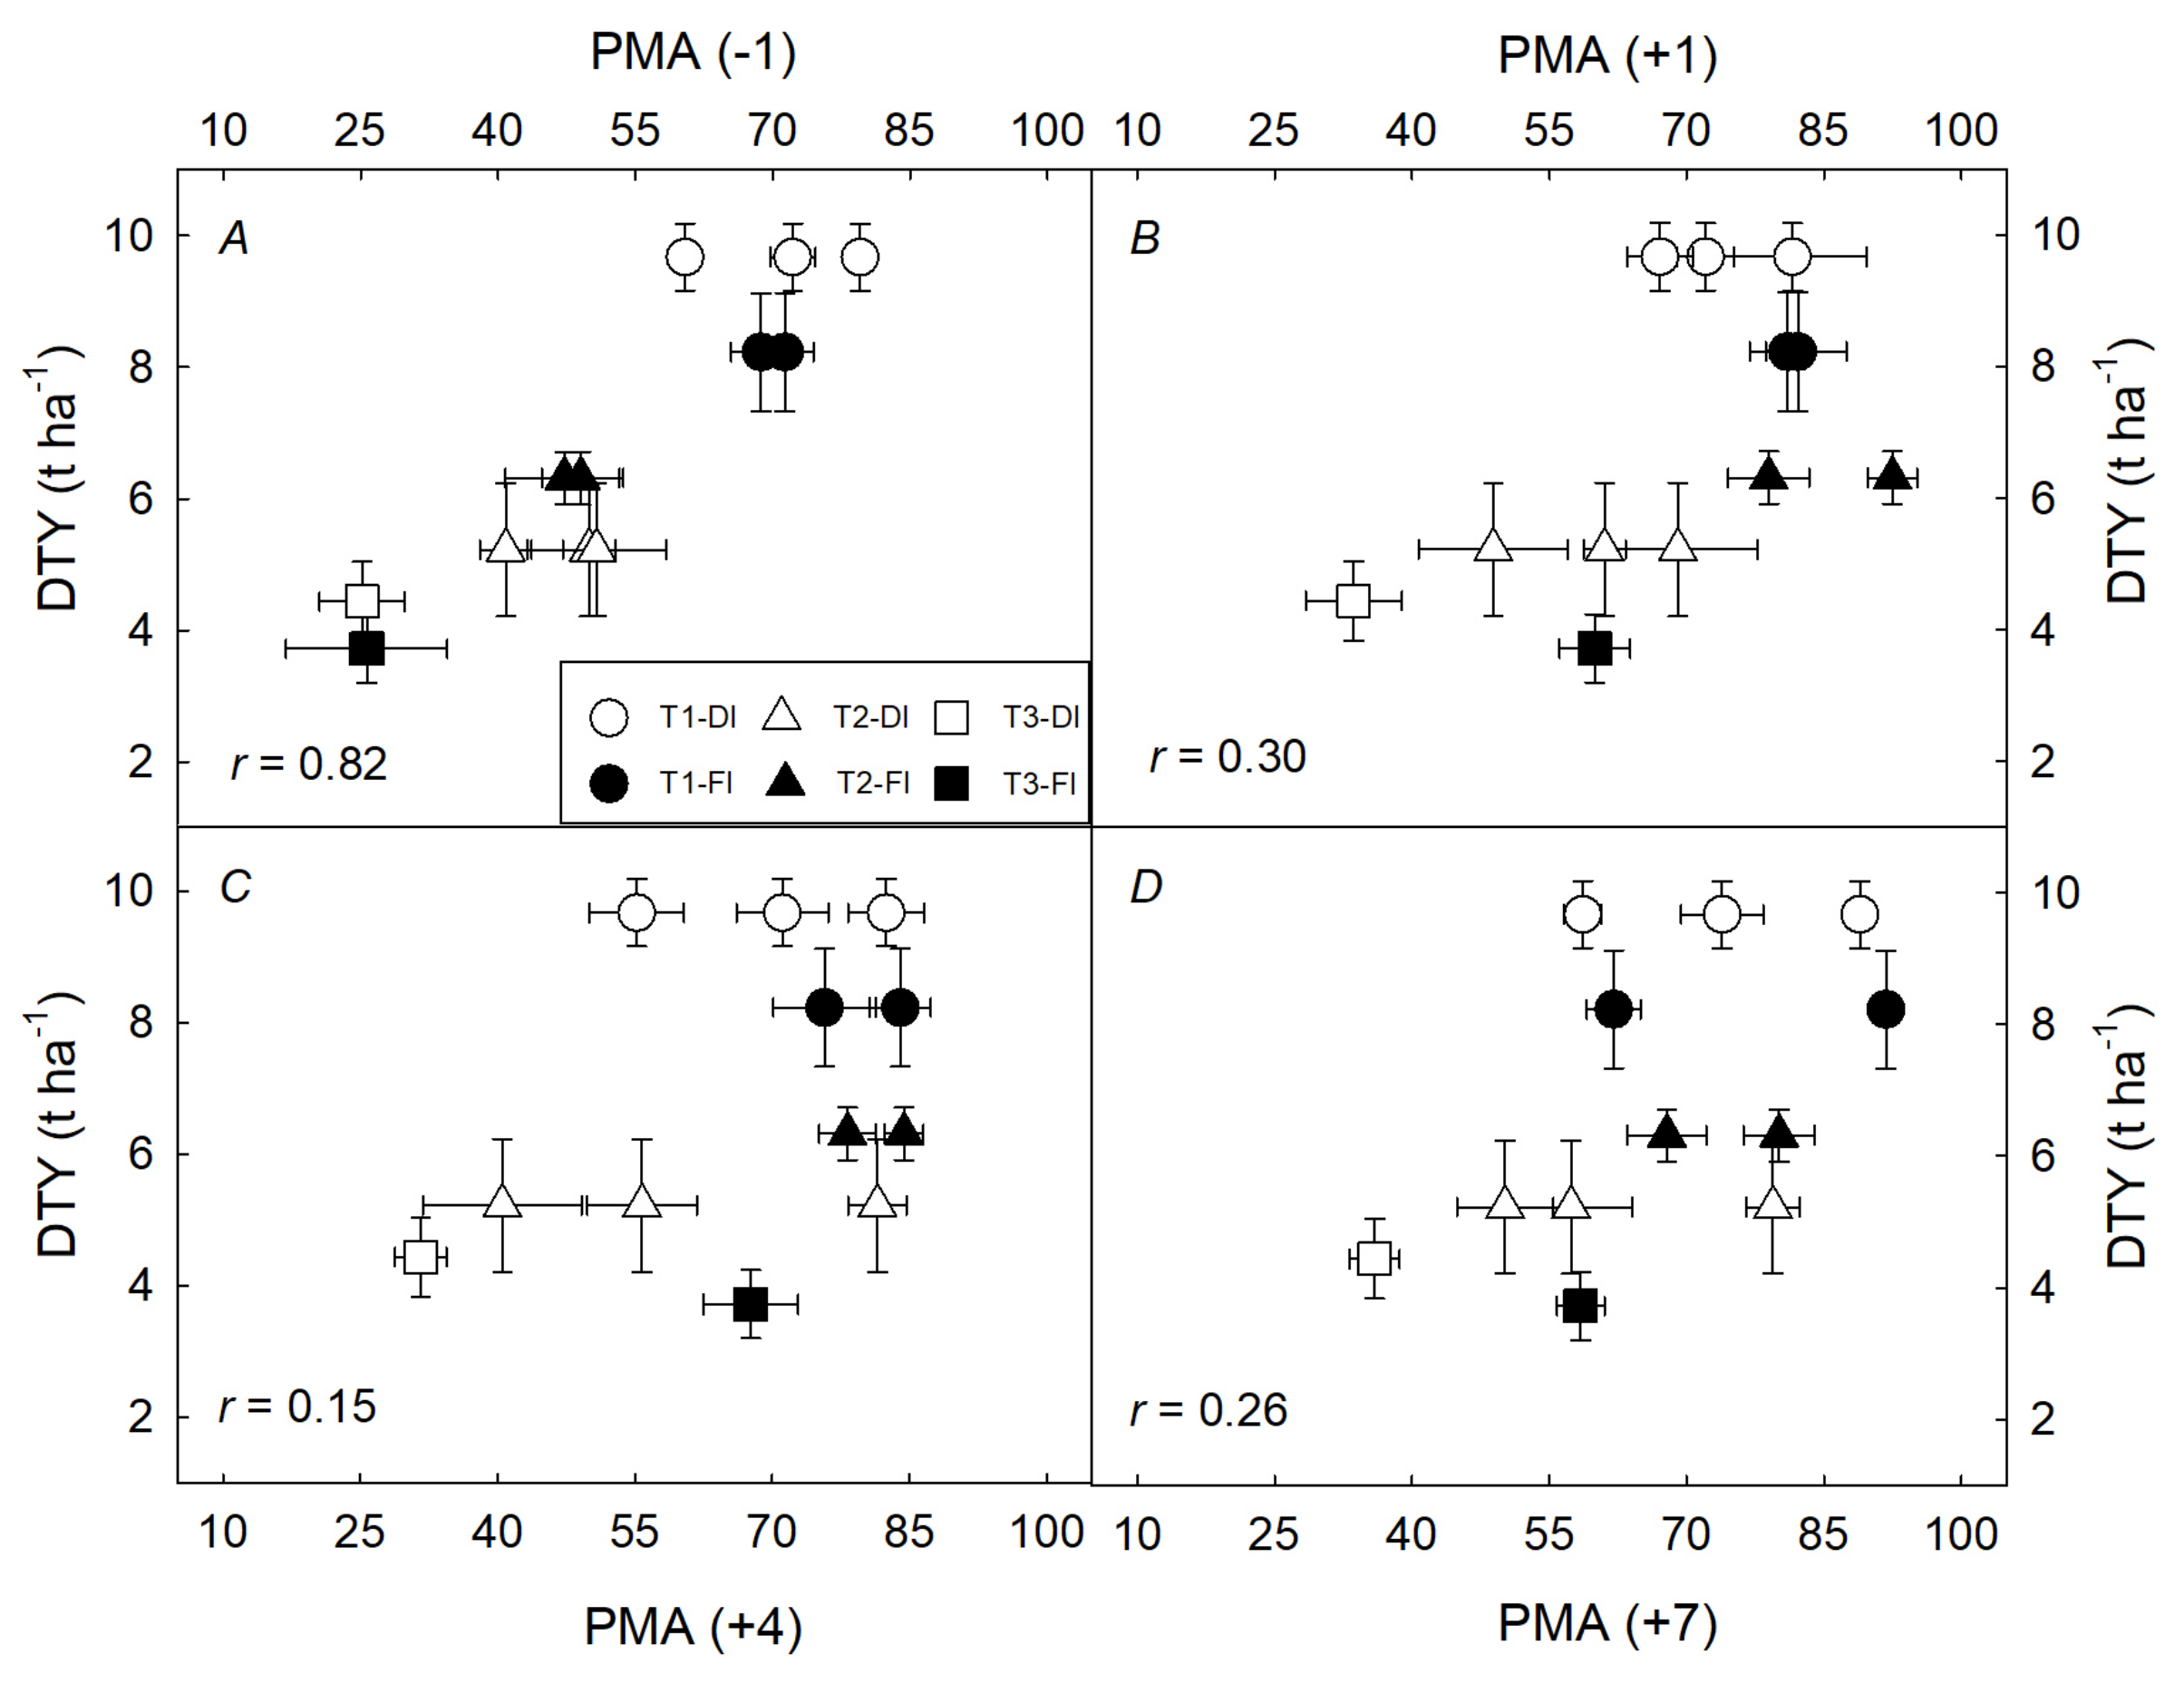
3.1. Water Restriction Effects on Tuber Yield and Ecophysiological Recovery Capacity

DTY with full irrigation was 9.7 ± 0.5 and 8.2 ± 0.9 t ha 1 under DI and FI, respectively, which corresponded to 46.6 ± 2.4 and 41.9 ± 3.0 t ha 1 of fresh tuber yield. There was no DTY difference between irrigation methods (Table S4). The statistical analysis detected significant differences among water restriction treatments within DI (F value = 26.1, p-value < 0.05) and FI (F value = 12.45, p-value > 0.05), the DTY of T1 being significantly higher than that of T2 (46%, average reduction) in a DI plot but not under FI (23%, average reduction). This finding was further confirmed with the Tukey multiple range test against the pooled error of the combined analysis (Figure 1).
The water stress indicator g s _ m a x was highly correlated with PMA in the whole experiment (Figure 2). During recovery cycles, PMA for T1 ranged between 60–89% and 70–92% under DI (Figure 3A) and FI (Figure 4A), respectively; while for T2, it ranged between 40–81% and 47–92% in DI (Figure 3B) and FI plots (Figure 4B), respectively. PMA from T3 dropped down to 25% on both irrigation methods and increased after rewatering with DI and FI, up to 36% (Figure 3C) and 68% (Figure 4C), respectively. The total amount of water used for full drip irrigation (2477 ± 27 m 3 ha 1 ) was less than that for furrow irrigation (3898 ± 10 m 3 ha 1 ) in 37%. Water restriction treatments received 80% (T2–DI), 72% (T2–FI), 67% (T3–DI), and 63% (T3–FI) of their respective full irrigated controls (Figure 3 and Figure 4).
In the period of time in which T2 rewatering coincided for both irrigation methods (50–58 DAP), T2 showed a significant reduction of PMA with respect to T1, before rewatering with DI (F value = 25.1, p-value < 0.05, Figure 5A) and FI (F value = 13.5, p-value < 0.05, Figure 5B); and the same happened with Fv’/Fm’ and ϕ P S I I as shown in Figure 5C,E respectively, for DI. PMA in T2 was significantly higher and lower than T1, at +1 day for FI, and at +7 days for DI, respectively (Figure 5A,B). In contrast, ϕ P S I I in T2 was significantly higher than T1 at +1 day for FI (Figure 5F). During 50–55 DAP, rewatering had a positive effect over Δ C l e a f by increasing T1 and T2 values (Figure 6A,B), following the next pattern of average differences between Δ C l e a f after (+4) and before (−1) rehydration (dif.): T2–FI (dif. = 1.1) > T2–DI (dif. = 0.9) > T1–FI (dif. = 0.8) > T1–DI (dif. = 0.6). During later recovery cycles, (75–90 DAP, Figure 6C,D) dif. showed the next pattern: T1–FI (dif. = 1.3) > T2–FI (dif. = 1.2) > T3–FI (dif. = 1.1) > T1–DI (dif. = -0.4) > T3–DI (dif. = −0.4) > T2–DI (dif. = −0.5).

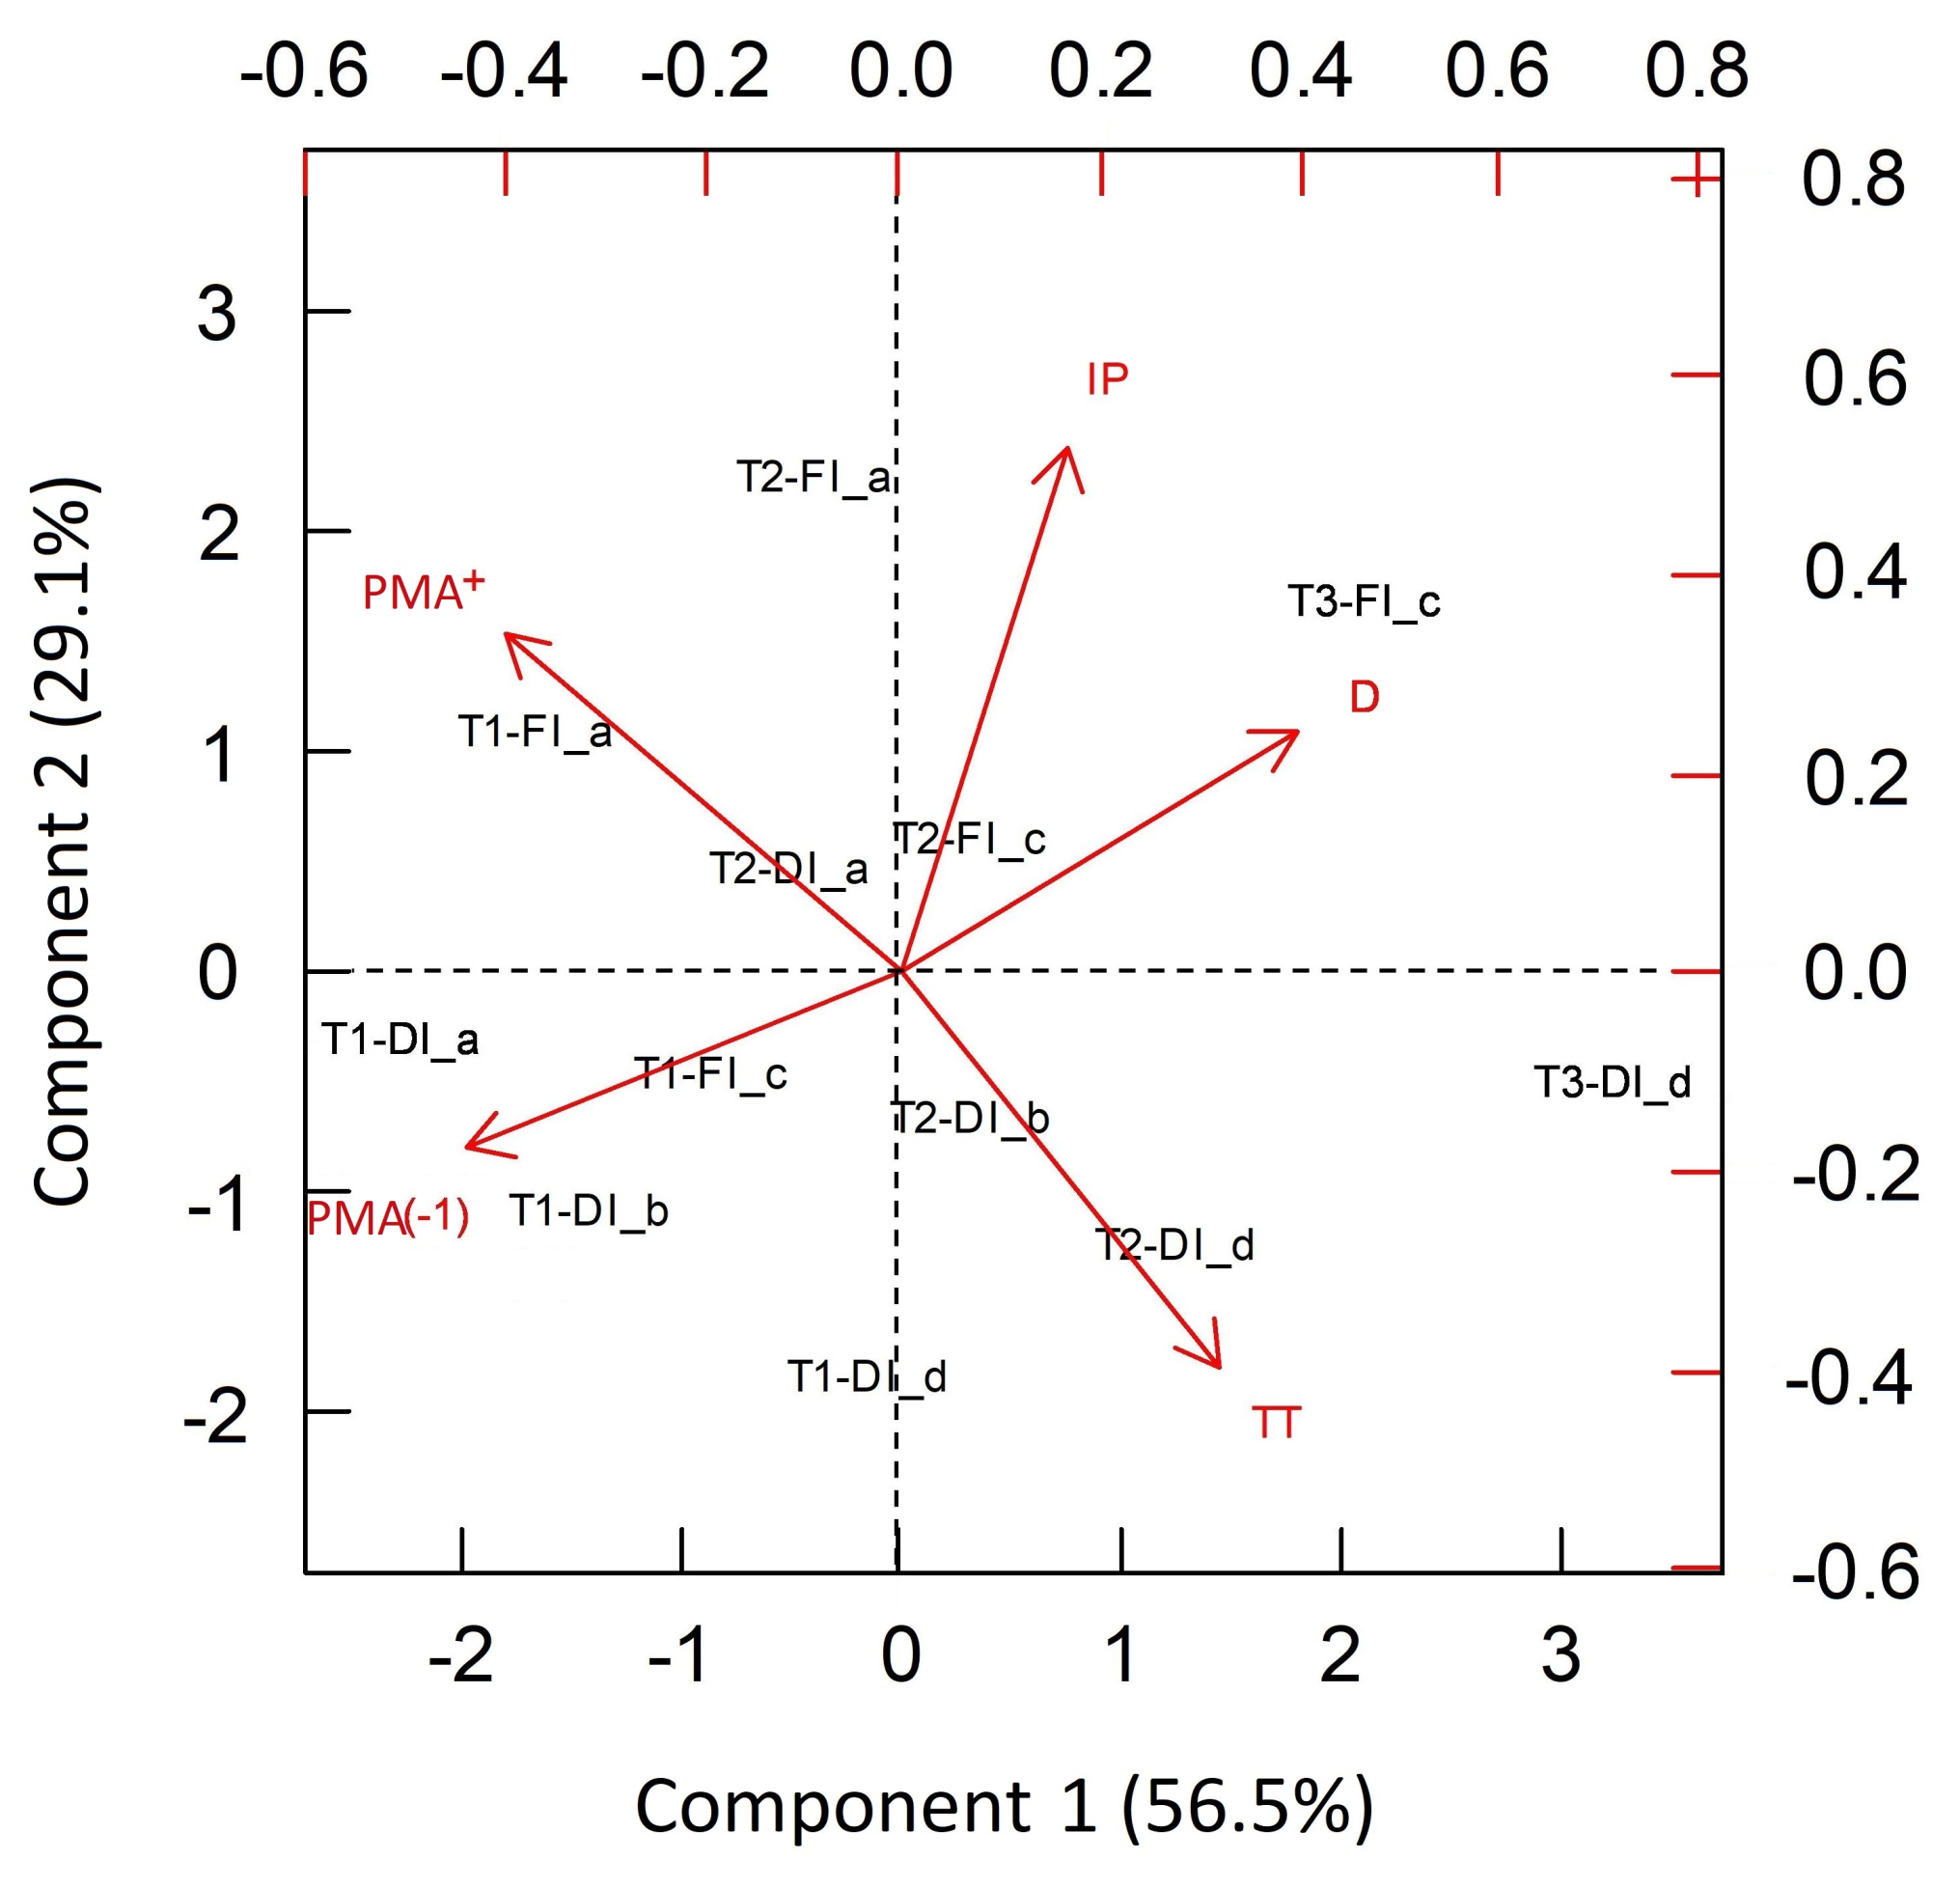
3.2. Integrated Characterization of Water Pulses Effect on Physiological Descriptors under Both Irrigation Methods

PMA before rewatering (−1) showed the highest correlation with DTY (r = 0.8), compared to PMA after rewatering (+1, +4, +7) (Figure 7). An average PMA after rewatering (PMA+) was used for PCA analysis. The first two principal components represented 86% of the total variance (Table 2). The first principal component presented positive coefficients for D and TT, and negative for PMA (−1) and PMA+, whereas the second one was a linear combination with high positive weights for IP, and PMA+ and negative weight for TT (Table 2). FI and DI were mainly located in the positive and negative axis of second component, respectively, and T3 was located at the positive extreme of the first component (Figure 8). The raw data processed in this subsecction are available online [52].

4. Discussion

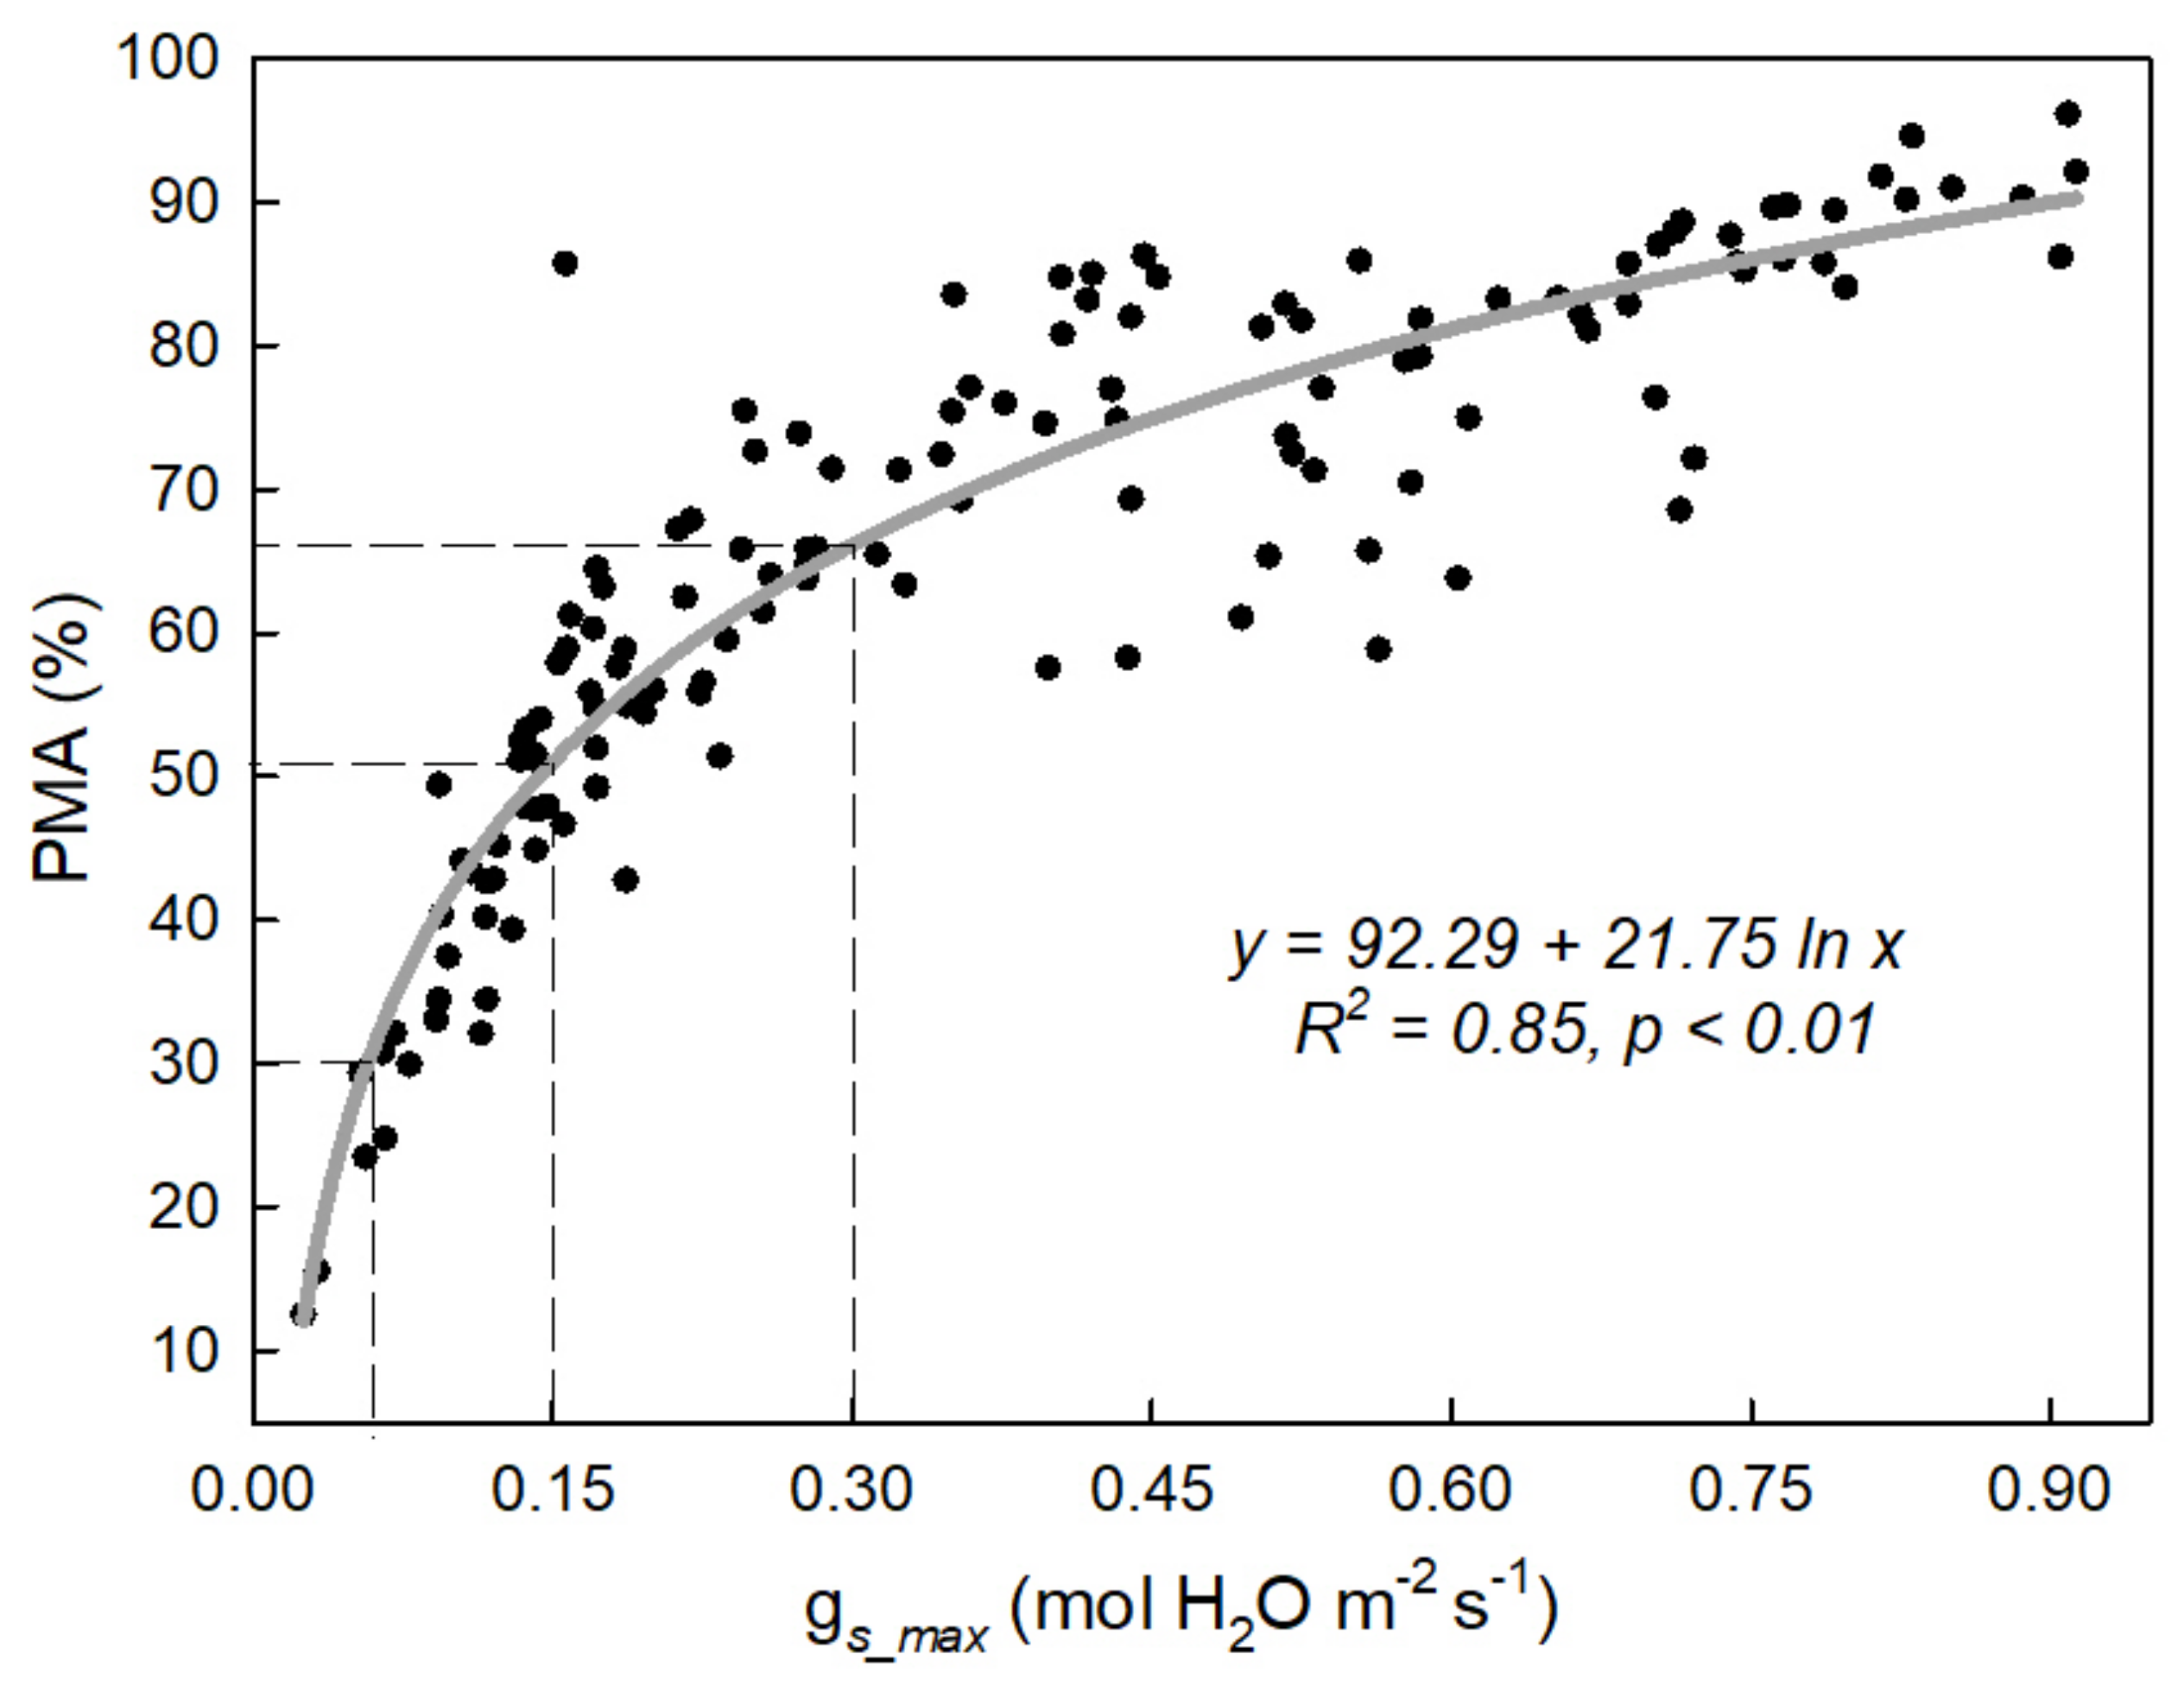
4.1. Physiological Thresholds for Watering Affected Photosynthetic Recovery Depending on the Irrigation Method

Simulated water restriction in this study affected the timing of water pulses (i.e., phenological stage when irrigation occurs) under two irrigation methods. At the beginning, three pieces of evidence supported the fact that control plants in both irrigation methods were in similar optimum physiological conditions: (i) g s _ m a x > 0.3 mol H 2 O m 2 s 1 (0.35 ± 0.03 and 0.37 ± 0.03 mol H 2 O m 2 s 1 for DI and FI, respectively), which is an average value recommended to guarantee optimum yield in potatoes [34]. (ii) The average values of Δ C l e a f (20.9 ± 0.22 and 20.8 ± 0.32 in DI and FI, respectively) were within the maximum values reported for potatoes [53]. (iii) The fresh tuber yield was high for this variety, very close to its reported potential yield (50 t ha 1 , [35,43]). Although some chemical applications were imperative due to severity of pests before rewatering (63 and 70 DAP, see Section 2.2), the high yields obtained suggest that the plants were not significantly affected by these applications. On the other hand, T2 and T3 delayed irrigation until g s _ m a x average values of 0.15 and 0.05 mol H 2 O m 2 s 1 , respectively, the latter recognized as a severity threshold in potato [31]. In DI and FI under control conditions (T1) and after rewatering, PMA values increased quickly with almost a complete recovery four days after, in most of the recovery cycles, indicating an efficient irrigation by keeping a functional water status [24,31,54,55,56,57,58]. Similarly, g s _ m a x was restored but in a lesser proportion than PMA or demanded a longer period of time to reach higher values, as Prange [59] pointed out. Fully irrigated plants (T1) under DI showed higher values of Fv’/Fm’ (Figure 5C,D) and Δ C l e a f (Figure 6A,B) than with FI, but only at early developmental stages (Figure 6A), whereas, under the latter irrigation method, control plants were able to keep good photosynthetic performance and recovery capacity even at late stages (Figure 4A and Figure 6D). The potential mechanical damage caused by sampling made for this purpose was deemed to be minimal since no significant differences were found in yield between sampled and non sampled plants (except for T2–FI, Table S1).The ability of achieving a fast and complete recovery after rewatering depends on the phenological stage, this capacity being reduced at senescence [54,60,61]. The accumulated thermal time at which 50% of maximum canopy cover reduction occurred (considered as an indicator of senescence initiation in potatoes [50]) was 1264.6 ± 18.51 and 1322.2 ± 28.07 C day 1 in DI and FI, respectively (Table S2). That is, control plants under DI achieved senescence earlier than plants with FI, which probably explained its low photosynthetic performance and recovery at late developmental stages. In accordance with other potato studies [28,62,63], well irrigated potato under DI had a similar or higher yield than in FI but with less irrigated water, saving an average of 1421 ± 35 m 3 in this study.
The g s _ m a x value of 0.15 mol H 2 O m 2 s 1 has been distinguished as an irrigation threshold in some crops [64] because, under this water status, plants show a drop in A n and a progressive decline in the substomatal CO 2 concentration, which suggests the domain of stomatal limitations [65]. Ramírez et al. [31] and Rinza et al. [34] reported a significant yield reduction in relation to control when potatoes were irrigated at 0.15 mol H 2 O m 2 s 1 of g s _ m a x under DI. In the present study, this threshold for irrigation (T2) behaved as expected for DI which showed a significant tuber yield reduction (46%) with respect to its control, but not for FI (allowing water saving of 28% in comparison with control) (Figure 1), supporting the hypothesis that thresholds operate different depending on the irrigation method used. Although water restriction affected physiological indicators, damage was not irreversible since PMA restored completely one and four days after rehydration for FI and DI, respectively, suggesting the absence of nonstomatal limitations on both irrigation methods [55]. Thus, the higher value and increment after rewatering of Δ C l e a f under FI in comparison to DI (Figure 6A,B) could be related to a higher photosynthetic capacity as was pointed out by Ramírez et al. [39]. After a mild water stress event, imposed by the first threshold, potatoes can improve its response to future water constrictions in the same (short-term memory) or the following growing period (long-term memory) (see [53] and references therein). These improvements might be due to changes in potato growth partitioning, favoring root growth and leading to a better water access, thus maintaining tuber yield, even under water limiting conditions [11,66]. The consistent increase of Δ C l e a f after rewatering by FI indicated that g s _ m a x threshold of 0.15 mol H 2 O m 2 s 1 might have improved a short-term memory for water stress under this irrigation method but not for DI plants. Furthermore, the time delayed by T2 and T3 until reaching their thresholds suggests that a slow development of a water deficit took place, like what normally occurs in Agriculture [29]. The reduced VPD values registered during the experiment (Table 1) may have influenced this delay [32] that could provoke potato plants to optimize their resources as an acclimation response [29]. This result cautions the use of physiological thresholds for irrigation purposes in this crop, which must be different depending on the irrigation method. This last finding is supported by other studies in potato where thresholds for crop water stress indexes for optimum irrigation took different values for FI and DI [42].
Chlorophyll fluorescence is a critical approach to assess the health of the internal apparatus during the photosynthetic process [67,68]. Regardless of the irrigation method used, an increment of Fv’/Fm’ four days after rewatering was observed, with no significant differences between control and T2 (except for Fv’/Fm’ under DI before rewatering, Figure 5C). The effective recovery of PSII under DI may have enabled potato plants to withstand water restriction and to recover quickly [57]. This study was carried out in an environment characterized by cloudy conditions with high atmospheric humidity and low solar radiation (see Section 2.1) where Fv’/Fm’ average values—for the whole growing season—were 0.60 ± 0.01 and 0.59 ± 0.02 for well watered (T1) and mild water stress (T2) conditions under DI. These values were higher than those under well irrigated (0.47 ± 0.01) and mild water stress (0.41 ± 0.01) conditions registered for the same potato variety under DI (Table S3), in a drier and higher radiation environment (49.7 ± 1.3% and 26.0 ± 0.24 MJ m 2 day 1 of average relative humidity and solar radiation, [31]). This finding is coherent with Prange’s [59] results which stated that potato leaves required some light exposure in the presence of water stress before PSII complex will be significantly affected, and it could also be a possible reason why Jefferies [25] and Germ [69] never detected significantly lower values of Fv’/Fm’ in field-grown potato plants under drought conditions. Germ [69] concluded that the maintenance of electron transport in thyakoids under drought conditions did not allow PSII damage, but a reversible inactivation.
The water restriction until the severity threshold (g s _ m a x = 0.05 mol H 2 O m 2 s 1 ) caused significant reductions in tuber yield as a possible consequence of the decrease in photosynthesis, which had a parallel decrease with g s _ m a x until rewatering [32,55,64,70]. PMA was always significantly lower relative to its control, accompanied by significant decreases in Fv’/Fm’ after 54 days without water (please see the complete data available on [52]) which could disrupt UNICA’s acclimation capability [31], reducing its photosynthetic capacity as a result of downregulation of carboxylation enzymes [32]. Plants showing low values of g s _ m a x (< 0.05 mol H 2 O m 2 s 1 ) can suffer a metabolic impairment of the photosynthetic apparatus [65]. Under this water status, nonstomatal effects would cause damage to the PSII through oxidation, as a consequence of increased reactive oxygen species [27,54,55,57,71].

4.2. The Photosynthetic Recovery Mainly Depends on the Timing and Frequency of Water Pulses

Coherent with Ramírez et al. [31], PMA at the moment of maximum stress (PMA (−1)) i.e., one day before rewatering, showed the highest correlation with DTY (Figure 7A). Independently of the irrigation method, no significant differences were found in tuber yield between DI and FI, similar to Ati et al. [63] and Erdem et al. [62] results. PMA (−1) was positively affected by early (at lower thermal time) and more frequent (short duration of previous drought) water pulses, unrelated to their intensities (Table 2, Figure 8). These findings were further confirmed by the principal component analysis. The first component shows a bipolar response contrasting the lateness of the rewatering with PMA. The second component is also bipolar showing that frequent pulses enhanced PMA+, response counterbalanced by rewatering lateness. Although some studies emphasize the importance of DI for water saving purposes in potato [72,73,74], most recent ones have stated that DI is more expensive and promotes more carbon emissions than alternate furrow irrigation [28]. Deficit [75,76] and alternate [66,77,78] furrow irrigation have provided interesting results for water saving purposes in potatoes. The findings of this study remark the incorporation of treatments looking for short-duration periods of water restriction and watering at early stages—for guaranteeing tuber induction—that could improve the results to get good tuber yield saving water and money with lower carbon emissions. Finally, considering the high correlation of g s _ m a x with PMA (Figure 2), and, concomitantly, with Crop water stress index—obtained by thermal imaging [34,35]—a better understanding of the plant performance under field conditions could be made in a faster and nondestructive way at larger scales.

5. Conclusions

The use of physiological thresholds for improving irrigation schedules is a valuable tool that allows water saving with limited tuber yield reduction. The studied thresholds depend on the irrigation method used, which imposes some peculiarities that promote different photosynthetic responses in potatoes. Thus, whereas drip irrigation allowed for reducing 1421 ± 35 m 3 ha 1 of water applied under well-watered conditions, after a water stress, this irrigation method promoted early senescence onset with low photosynthetic recovery after rewatering at late developmental stages. On the other hand, furrow irrigation delayed senescence improving short-term water stress memory and allowed no significant tuber yield reduction operating with a relatively strict physiological threshold (g s _ m a x = 0.15 mol H 2 O m 2 s 1 ). This preliminary study cautions the use of chlorophyll fluorescence performance under low-radiation and humid conditions. The assessment of the percentage of maximum assimilation rate before rewatering could be used as tuber yield predictor, this photosynthetic trait being positively related to early rewatering and short-duration of the previous drought, independently of the irrigation method applied. The combination of deficit or alternate furrow irrigation with low water quantities of early and frequent water pulses are recommended, but more evidence must be collected using economic and environmental indicators (carbon emissions) when comparing this irrigation with “hi-tech” methods under other environments and agronomic seasons.

Supplementary Materials

The following are available at https://www.mdpi.com/2073-4395/10/6/827/s1, Figure S1: Twin experiment using drip (gray area) and furrow (dark gray area) irrigation methods with a randomized complete block design within each area (plot). A full irrigated control (T1) and 2 water restriction treatments based on maximum light-saturated stomatal conductance (T2: 0.15 and T3: 0.05 mol H 2 O m 2 s 1 ) were implemented at each plot. Shaded plants—target plants. Table S1: One—way ANOVA for comparing dry tuber yield of "sampled" against "nonsampled" plants for carbon isotopic discrimination analysis, in each treatment (T1—control; T2—water restriction until g s _ m a x = 0.15 mol H 2 O m 2 s 1 ) and T3—water restriction until g s _ m a x = 0.05 mol H 2 O m 2 s 1 ), and irrigation method (DI—drip irrigation and FI—furrow irrigation). n.s.—Non significant difference. * Significant difference at p-value < 0.05. Table S2. Canopy cover (CC) and cumulative thermal time (TT) for estimation of Senescence Initiation, for each treatment (T1—control; T2—water restriction until g s _ m a x = 0.15 mol H 2 O m 2 s 1 ) and T3—water restriction until g s _ m a x = 0.05 mol H 2 O m 2 s 1 ), and irrigation method (DI—drip irrigation and FI—furrow irrigation). DAP—days after planting. Table S3. Fv’/Fm’—Average values of fluorescence parameter (±SE, n = 8) in different water restriction levels reported by [31] at Santa Rita, Arequipa—Peru in 2016. Table S4. ANOVA analysis combined to compare drip (DI) and furrow (FI) irrigation for dry tuber yield. IM—Irrigation method. Block (IM)—Block nested in irrigation method. TWR—Treatment of water restriction. IM*TWR—Interaction between irrigation method and treatment.

Author Contributions

Conceptualization, D.A.R. and R.Q.; project administration, D.A.R.; methodology, D.A.R., C.S.-D., and J.R.; formal analysis, F.d.M., C.S.-D. and J.N.; investigation, D.A.R., R.Q., J.R., H.L. and C.S.-D.; resources, D.A.R. and J.R.; data curation, C.S.-D., J.R. and J.N.; writing—original draft preparation, C.S.-D. and D.A.R.; writing—review and editing, D.A.R., R.Q., H.L. and A.R.-D.; visualization, C.S.-D., J.N. and J.R.; funding acquisition, D.A.R. All authors have read and agreed with the submitted version of the manuscript.

Funding

This research received the financial support from “Programa Nacional de Innovación Agraria” (PNIA), with the Project No. 016-2015-INIA-PNIA/UPMSI/IE “Uso efectivo del agua en el cultivo de papa en zonas áridas: Mejorando el manejo del riego mediante el monitoreo del estatus hídrico para enfrentar al Cambio Climático”, and the complementary funds from “Root, Tubers and Bananas” (RTB) CGIAR Research Program.

Acknowledgments

The authors thank Nikolai Alarcon and Jesus Zamalloa for their technical assistance and help in the data collection, and Fernando Guerrero, for his valuable support in finishing this manuscript.

Conflicts of Interest

The authors declare no conflict of interest.

References

  1. Xu, Z.; Zhou, G.; Shimizu, H. Are plant growth and photosynthesis limited by pre-drought following rewatering in grass? J. Exp. Bot. 2009, 60, 3737–3749. [Google Scholar] [CrossRef] [PubMed] [Green Version]
  2. Khordadi, M.J.; Olesen, J.E.; Alizadeh, A.; Nassiri Mahallati, M.; Ansari, H.; Sanaeinejad, H. Climate change impacts and adaptation for crop management of winter wheat and maize in the semi-arid region of Iran. Irrig. Drain. 2019, 68, 841–856. [Google Scholar] [CrossRef]
  3. Zeng, X.; Evans, M.N.; Liu, X.; Wang, W.; Xu, G.; Wu, G.; Zhang, L. Spatial Patterns of Precipitation-Induced Moisture Availability and their Effects on the Divergence of Conifer Stem Growth in the Western and Eastern Parts of China’s Semi-Arid Region. For. Ecol. Manag. 2019, 451, 117524. [Google Scholar] [CrossRef]
  4. Lambers, H.; Chapin, F.S.; Pons, T.L. Plant Water Relations. In Plant Physiological Ecology; Springer: New York, NY, USA, 2008; pp. 163–216. [Google Scholar]
  5. Faostat. Available online: http://www.fao.org/faostat/en/ (accessed on 4 June 2019).
  6. Hijmans, R.J. The effect of climate change on global potato production. Am. J. Potato Res. 2003, 80, 271–279. [Google Scholar] [CrossRef]
  7. Sanabria, J.; Lhomme, J.P. Climate change and potato cropping in the Peruvian Altiplano. Theor. Appl. Climatol. 2013, 112, 683–695. [Google Scholar] [CrossRef]
  8. Fleisher, D.H.; Condori, B.; Quiroz, R.; Alva, A.; Asseng, S.; Barreda, C.; Bindi, M.; Boote, K.J.; Ferrise, R.; Franke, A.C.; et al. A potato model intercomparison across varying climates and productivity levels. Glob. Chang. Biol. 2017, 23, 1258–1281. [Google Scholar] [CrossRef]
  9. Quiroz, R.; Ramírez, D.A.; Kroschel, J.; Andrade-Piedra, J.; Barreda, C.; Condori, B.; Mares, V.; Monneveux, P.; Perez, W. Impact of climate change on the potato crop and biodiversity in its center of origin. Open Agric. 2018, 3, 273–283. [Google Scholar] [CrossRef]
  10. Harris, P.M. Impact of climate change on the potato crop. In The Potato Crop; Springer: Dordrecht, The Netherlands, 1978; p. 909. [Google Scholar]
  11. Vincent, C.; Rowland, D.; Schaffer, B.; Bassil, E.; Racette, K.; Zurweller, B. Primed acclimation: A physiological process offers a strategy for more resilient and irrigation-efficient crop production. Plant Sci. 2019, 3, 110240. [Google Scholar] [CrossRef]
  12. Byrd, S.A.; Rowland, D.L.; Bennett, J.; Zotarelli, L.; Wright, D.; Alva, A.; Nordgaard, J. Reductions in a Commercial Potato Irrigation Schedule during Tuber Bulking in Florida: Physiological, Yield, and Quality Effects. J. Crop Improv. 2014, 28, 660–679. [Google Scholar] [CrossRef]
  13. Nicotra, A.B.; Atkin, O.K.; Bonser, S.P.; Davidson, A.M.; Finnegan, E.J.; Mathesius, U.; Poot, P.; Purugganan, M.D.; Richards, C.L.; Valladares, F.; et al. Plant phenotypic plasticity in a changing climate. Trends Plant Sci. 2010, 15, 684–692. [Google Scholar] [CrossRef]
  14. Luo, H.H.; Zhang, Y.L.; Zhang, W.F. Effects of water stress and rewatering on photosynthesis, root activity, and yield of cotton with drip irrigation under mulch. Photosynthetica 2016, 54, 65–73. [Google Scholar] [CrossRef]
  15. Kirby, M.; Bark, R.; Connor, J.; Qureshi, M.E.; Keyworth, S. Sustainable irrigation: How did irrigated agriculture in Australia’s Murray–Darling Basin adapt in the Millennium Drought? Agric. Water Manag. 2014, 145, 154–162. [Google Scholar] [CrossRef]
  16. Van der Kooij, S.; Zwarteveen, M.; Boesveld, H.; Kuper, M. The efficiency of drip irrigation unpacked. Agric. Water Manag. 2013, 123, 103–110. [Google Scholar] [CrossRef]
  17. Alcon, F.; Navarro, N.; de-Miguel, M.D.; Balbo, A.L. Drip Irrigation Technology. In Sustainable Solutions for Food Security Combating Climate Change by Adaptation; Springer: Cham, Switzerland, 2019; pp. 262–285. [Google Scholar]
  18. Amali, S.; Rolston, D.E.; Fulton, A.E.; Hanson, B.R.; Phene, C.J.; Oster, J.D. Soil water variability under subsurface drip and furrow irrigation. Irrig. Sci. 1997, 17, 151–155. [Google Scholar] [CrossRef]
  19. Ahmadi, S.H.; Plauborg, F.; Andersen, M.N.; Sepaskhah, A.R.; Jensen, C.R.; Hansen, S. Effects of irrigation strategies and soils on field grown potatoes: Root distribution. Agric. Water Manag. 2011, 98, 1280–1290. [Google Scholar] [CrossRef]
  20. Tagar, A.; Chandio, F.A.; Mari, I.A.; Wagan, B. Comparative Study of drip and furrow irrigation methods at farmer’s field in Umarkot. Int. J. Agric. Biosyst. Eng. 2012, 69, 863–867. [Google Scholar]
  21. Perry, C. Does Improved Irrigation Technology Save Water? A Review of the Evidence; FAO (Food and Agriculture Organization of the United Nations): Rome, Italy, 2017; Volume 42. [Google Scholar]
  22. Ward, F.A.; Pulido-Velazquez, M. Water conservation in irrigation can increase water use. Proc. Natl. Acad. Sci. USA 2008, 105, 18215–18220. [Google Scholar] [CrossRef] [Green Version]
  23. Perry, C.; Steduto, P.; Allen, R.G.; Burt, C.M. Increasing productivity in irrigated agriculture: Agronomic constraints and hydrological realities. Agric. Water Manag. 2009, 105, 1517–1524. [Google Scholar] [CrossRef] [Green Version]
  24. van Loon, C.D. The effect of water stress on potato growth, development, and yield. Am. Potato J. 1981, 58, 51–69. [Google Scholar] [CrossRef]
  25. Jefferies, R.A. Physiology of crop response to drought. In Potato Ecology and Modelling of Crops under Conditions Limiting Growth; Haverkort, A.J., MacKerron, D.K.L., Eds.; Springer: Dordrecht, The Netherlands, 1994; pp. 61–74. [Google Scholar]
  26. Schneekloth, J.P.; Klocke, N.L.; Davison, D.R.; Payero, J.O. Furrow irrigation management with limited water. Appl. Eng. Agric. 2006, 22, 391–398. [Google Scholar] [CrossRef] [Green Version]
  27. Obidiegwu, J.E.; Bryan, G.J.; Jones, H.G.; Prashar, A. Coping with drought: Stress and adaptive responses in potato and perspectives for improvement. Front. Plant Sci. 2015, 30, 239–264. [Google Scholar] [CrossRef] [PubMed] [Green Version]
  28. Qin, J.; Ramírez, D.A.; Xie, K.; Li, W.; Yactayo, W.; Jin, L.; Quiroz, R. Is partial root-zone drying more appropriate than drip irrigation to save water in China? A preliminary comparative analysis for potato cultivation. Potato Res. 2018, 61, 391–406. [Google Scholar] [CrossRef] [Green Version]
  29. Chaves, M.M.; Maroco, J.P.; Pereira, J.S. Understanding plant responses to drought–from genes to the whole plant. Funct. Plant Biol. 2003, 30, 239–264. [Google Scholar] [CrossRef]
  30. Resco, V.; Ignace, D.D.; Sun, W.; Huxman, T.E.; Weltzin, J.F.; Williams, D.G. Chlorophyll fluorescence, predawn water potential and photosynthesis in precipitation pulse-driven ecosystems—Implications for ecological studies. Funct. Ecol. 2008, 22, 479–483. [Google Scholar] [CrossRef]
  31. Ramírez, D.A.; Yactayo, W.; Rens, L.R.; Rolando, J.L.; Palacios, S.; de Mendiburu, F.; Mares, V.; Barreda, C.; Loayza, H.; Monneveux, P.; et al. Defining biological thresholds associated with plant water status for monitoring water restriction effects: Stomatal conductance and photosynthesis recovery as key indicators in potato. Agric. Water Manag. 2016, 117, 369–378. [Google Scholar] [CrossRef]
  32. Chaves, M.M. Effects of Water Deficits on Carbon Assimilation. J. Exp. Bot. 1991, 42, 1–16. [Google Scholar] [CrossRef]
  33. Flexas, J.; Bota, J.; Cifre, J.; Mariano Escalona, J.; Galmés, J.; Gulías, J.; Lefi, E.; Martinez-Cañellas, S.F.; Moreno, M.T.; Ribas-Carbó, M.; et al. Understanding down-regulation of photosynthesis under water stress: Future prospects and searching for physiological tools for irrigation management. Ann. Appl. Biol. 2004, 144, 273–283. [Google Scholar] [CrossRef]
  34. Rinza, J.; Ramírez, D.A.; García, J.; de Mendiburu, F.; Yactayo, W.; Barreda, C.; Velasquez, T.; Mejía, A.; Quiroz, R. Infrared Radiometry as a Tool for Early Water Deficit Detection: Insights into Its Use for Establishing Irrigation Calendars for Potatoes Under Humid Conditions. Potato Res. 2019, 62, 109–122. [Google Scholar] [CrossRef] [Green Version]
  35. Cucho-Padin, G.; Rinza, J.; Ninanya, J.; Loayza, H.; Quiroz, R.; Ramírez, D.A. Development of an open-source thermal image processing software for improving irrigation management in potato crops (Solanum tuberosum L.). Sensors 2020, 20, 472. [Google Scholar] [CrossRef] [Green Version]
  36. Baker, N.R. Chlorophyll Fluorescence: A Probe of Photosynthesis In Vivo. Annu. Rev. Plant Biol. 2008, 59, 89–113. [Google Scholar] [CrossRef] [Green Version]
  37. Olechowicz, J.; Chomontowski, C.; Olechowicz, P.; Pietkiewicz, S.; Jajoo, A.; Kalaji, M.H. Impact of intraspecific competition on photosynthetic apparatus efficiency in potato (Solanum tuberosum) plants. Photosynthetica 2018, 56, 971–975. [Google Scholar] [CrossRef] [Green Version]
  38. Farquhar, G.D.; Ehleringer, J.R.; Hubick, K.T. Carbon Isotope Discrimination and Photosynthesis. Ann. Rev. Plant Phys. 1989, 40, 503–537. [Google Scholar] [CrossRef]
  39. Ramírez, D.A.; Rolando, J.L.; Yactayo, W.; Monneveux, P.; Mares, V.; Quiroz, R. Improving potato drought tolerance through the induction of long-term water stress memory. Plant Sci. 2015, 238, 26–32. [Google Scholar] [CrossRef]
  40. Fracheboud, Y.; Jompuk, C.; Ribaut, J.M.; Stamp, P.; Leipner, J. Genetic analysis of cold tolerance of photosynthesis in maize. Plant Mol. Biol. 2004, 56, 241–253. [Google Scholar] [CrossRef]
  41. Anithakumari, A.M.; Nataraja, K.N.; Visser, R.G.; van der Linden, C.G. Genetic dissection of drought tolerance and recovery potential by quantitative trait locus mapping of a diploid potato population. Mol. Breed. 2012, 30, 1413–1429. [Google Scholar] [CrossRef] [Green Version]
  42. Erdem, T.; Orta, A.H.; Erdem, Y.; Okursoy, H. Crop water stress index for potato under furrow and drip irrigation systems. Potato Res. 2005, 48, 49–58. [Google Scholar] [CrossRef]
  43. Gutiérrez-Rosales, R.O.; Espinoza-Trelles, J.A.; Bonierbale, M. UNICA: Variedad Peruana para mercado fresco y papa frita con tolerancia y resistencia para condiciones climáticas adversas. Rev. ALAP 2007, 14, 45–50. [Google Scholar]
  44. Twarakavi, N.K.; Sakai, M.; Šimůnek, J. An objective analysis of the dynamic nature of field capacity. Water Resour. Res. 2014, 45, 153–155. [Google Scholar] [CrossRef]
  45. Topp, G.C.; Parkin, G.W.; Ferré, T.P.; Carter, M.R.; Gregorich, E.G. Sample moisture content. In Soil Sampling and Methods of Analysis, 2nd ed.; Carter, M.R., Gregorich, E.G., Eds.; CRC Press: Boca Raton, New York, USA, 2008; pp. 41–44. [Google Scholar]
  46. Resco, V.; Ewers, B.E.; Sun, W.; Huxman, T.E.; Weltzin, J.F.; Williams, D.G. Drought-induced hydraulic limitations constrain leaf gas exchange recovery after precipitation pulses in the C3 woody legume, Prosopis velutina. New Phytol. 2009, 181, 672–682. [Google Scholar] [CrossRef]
  47. Genty, B.; Briantais, J.-M.; Baker, N.R. The relationship between the quantum yield of photosynthetic electron transport and quenching of chlorophyll fluorescence. Biochim. Biophys. Acta Gen. Subj. 1989, 990, 87–92. [Google Scholar] [CrossRef]
  48. Bartlett, M.S. Properties of sufficiency and statistical tests. Proc. R. Soc. Agriic. 1937, 160, 268. [Google Scholar]
  49. Wolfinger, R.D.; Chang, M. Comparing the SAS GLM and MIXED procedures for repeated measures Cary. In NC: SUGI Proceedings; The SAS Institute: Cary, NC, USA, 1998. [Google Scholar]
  50. Ramírez, D.A.; Yactayo, W.; Gutiérrez, R.; Mares, V.; De Mendiburu, F.; Posadas, A.; Quiroz, R. Chlorophyll concentration in leaves is an indicator of potato tuber yield in water-shortage conditions. Sci. Hortic-Amst. 2014, 168, 202–209. [Google Scholar] [CrossRef]
  51. R Core Team. R Software. Version, 5.6.1. Available online: https://www.r-project.org/ (accessed on 15 May 2020).
  52. Silva, C.; Ramirez, D.; Rinza, J. Dataset for: The photosynthesis recovery, a key trait as indicator of an appropriate irrigation criteria in potato crop. Int. Potato Cent. 2019, V2. [Google Scholar] [CrossRef]
  53. Ramírez, D.A.; Rolando, J.L.; Yactayo, W.; Monneveux, P.; Quiroz, R. Is discrimination of 13C in potato leaflets and tubers an appropriate trait to describe genotype responses to restrictive and well-watered conditions? J. Agron. Crop Sci. 2015, 201, 410–418. [Google Scholar] [CrossRef]
  54. Schapendonk, A.H.C.M.; Spitters, C.J.T.; Groot, P.J. Effects of water stress on photosynthesis and chlorophyll fluorescence of five potato cultivars. Potato Res. 1989, 32, 17–32. [Google Scholar] [CrossRef]
  55. Flexas, J.; Gallé, A.; Galmés, J.; Ribas-Carbo, M.; Medrano, H. The Response of Photosynthesis to Soil Water Stress. In Plant Resp. Drought Stress; Aroca, R., Ed.; Springer: Berlin/Heidelberg, Germany, 2012; Volume 32, pp. 129–144. [Google Scholar]
  56. Rivas, R.; Falcão, H.M.; Ribeiro, R.V.; Machado, E.C.; Pimentel, C.; Santos, M.G. Drought tolerance in cowpea species is driven by less sensitivity of leaf gas exchange to water deficit and rapid recovery of photosynthesis after rehydration. S. Afr. J. Bot. 2016, 103, 101–107. [Google Scholar] [CrossRef]
  57. Yi, X.P.; Zhang, Y.L.; Yao, H.S.; Luo, H.H.; Gou, L.; Chow, W.S.; Zhang, W.F. Rapid recovery of photosynthetic rate following soil water deficit and rewatering in cotton plants (Gossypium herbaceum L.) is related to the stability of the photosystems. J. Plant Physiol. 2016, 194, 23–34. [Google Scholar] [CrossRef]
  58. Rodríguez-Pérez, L.; Ñústez, C.E.; Moreno, L.P. Drought stress affects physiological parameters but not tuber yield in three Andean potato (Solanum tuberosum L.) cultivars. Agron. Colomb. 2017, 35, 158–170. [Google Scholar] [CrossRef]
  59. Prange, R.K. Chlorophyll fluorescence in vivo as an indicator of water stress in potato leaves. Am. Potato J. 1986, 63, 325–333. [Google Scholar] [CrossRef]
  60. Gucci, R.; Massai, R.; Casano, S.; Costagli, G. The effect of leaf age on CO2 assimilation and stomatal conductance of field-grown olive trees. Acta Hortic. 1991, 4, 325–333. [Google Scholar] [CrossRef]
  61. David, M.M.; Coelho, D.; Barrote, I.; Correia, M.J. The effect of leaf age on CO2 assimilation and stomatal conductance of field-grown olive trees. Funct. Plant Biol. 1998, 25, 299–306. [Google Scholar] [CrossRef]
  62. Erdem, T.; Erdem, Y.; Orta, H.; Okursoy, H. Water-yield relationships of potato under different irrigation methods and regimens. Sci. Agric. 2006, 63, 226–231. [Google Scholar] [CrossRef]
  63. Ati, A.S.; Iyada, A.D.; Najim, S.M. Water use efficiency of potato (Solanum tuberosum L.) under different irrigation methods and potassium fertilizer rates. Ann. Agric. Sci. 2012, 57, 99–103. [Google Scholar] [CrossRef] [Green Version]
  64. Flexas, J.; Barón, M.; Bota, J.; Ducruet, J.M.; Gallé, A.; Galmés, J.; Jiménez, M.; Pou, A.; Ribas-Carbó, M.; Sajnani, C.; et al. Photosynthesis limitations during water stress acclimation and recovery in the drought–adapted Vitis hybrid Richter–110 (V. berlandierixV. rupestris). J. Exp. Bot. 2009, 60, 2361–2377. [Google Scholar] [CrossRef] [PubMed] [Green Version]
  65. Medrano, H.; Escalona, J.M.; Bota, J.; Gulías, J.; Flexas, J. Regulation of photosynthesis of C3 plants in response to progressive drought: Stomatal conductance as a reference parameter. Ann. Bot.-Lond. 2002, 89, 895–905. [Google Scholar] [CrossRef] [PubMed]
  66. Yactayo, W.; Ramírez, D.A.; Gutiérrez, R.; Mares, V.; Posadas, A.; Quiroz, R. Effect of partial root-zone drying irrigation timing on potato tuber yield and water use efficiency. Agric. Water Manag. 2013, 123, 65–70. [Google Scholar] [CrossRef]
  67. Clavel, D.; Diouf, O.; Khalfaoui, J.L.; Braconnier, S. Genotypes variations in fluorescence parameters among closely related groundnut (Arachis hypogaea L.) lines and their potential for drought screening programs. Field Crops Res. 2006, 96, 296–306. [Google Scholar] [CrossRef]
  68. Bürling, K.; Cerovic, Z.G.; Cornic, G.; Ducruet, J.M.; Noga, G.; Hunsche, M. Fluorescence-based sensing of drought-induced stress in the vegetative phase of four contrasting wheat genotypes. Environ. Exp. Bot. 2013, 89, 51–59. [Google Scholar] [CrossRef]
  69. Germ, M. The response of two potato cultivars on combined effects of selenium and drought. Acta Agric. Slov. 2008, 91, 121–137. [Google Scholar] [CrossRef]
  70. Hao, S.; Cao, H.; Wang, H.; Pan, X. A PRI-based water stress index combining structural and chlorophyll effects: Assessment using diurnal narrow-band airborne imagery and the CWSI thermal index. Sci. Hortic.-Amst. 2019, 249, 143–154. [Google Scholar] [CrossRef]
  71. Flexas, J.; Medrano, H. Drought-inhibition of Photosynthesis in C3 Plants: Stomatal and Non stomatal Limitations Revisited. Ann. Bot.-Lond. 2002, 89, 183–189. [Google Scholar] [CrossRef] [PubMed] [Green Version]
  72. Onder, S.; Caliskan, M.E.; Onder, D.; Caliskan, S. Different irrigation methods and water stress effects on potato yield and yield components. Agric. Water Manag. 2005, 73, 73–86. [Google Scholar] [CrossRef]
  73. Wang, F.-X.; Kang, Y.; Liu, S.-P. Effects of drip irrigation frequency on soil wetting pattern and potato growth in North China Plain. Agric. Water Manag. 2006, 79, 248–264. [Google Scholar] [CrossRef]
  74. Badr, M.A.; El-Tohamy, W.A.; Zaghloul, A.M. Yield and water use efficiency of potato grown under different irrigation and nitrogen levels in an arid region. Agric. Water Manag. 2012, 110, 9–15. [Google Scholar] [CrossRef]
  75. Stikic, R.; Savíc, S.; Jovanovic, Z.; Jacobsen, S.E.; Liu, F.; Jensen, C.R. Deficit irrigation strategies: Use of stress physiology knowledge to increase water use efficiency in tomato and potato. In Horticulture in the 21st Century; Sampson, A.N., Ed.; Nova Science Publishers, Inc.: New York, NY, USA, 2010; pp. 161–178. [Google Scholar]
  76. Medici, L.O.; Reinert, F.; Carvalho, D.F.; Kozak, M.; Azevedo, R.A. What about keeping plants well watered? Environ. Exp. Bot. 2014, 99, 38–42. [Google Scholar] [CrossRef]
  77. Shahnazari, A.; Liu, F.; Andersen, M.N.; Jacobsen, S.E.; Jensen, C.R. Effects of partial root-zone drying on yield, tuber size and water use efficiency in potato under field conditions. Field Crops Res. 2007, 100, 117–124. [Google Scholar] [CrossRef]
  78. Xie, K.; Wang, X.X.; Zhang, R.; Gong, X.; Zhang, S.; Mares, V.; Gavilán, C.; Posadas, A.; Quiroz, R. Partial root-zone drying irrigation and water utilization efficiency by the potato crop in semi-arid regions in China. Sci. Hortic. 2012, 134, 20–25. [Google Scholar] [CrossRef]
Figure 1. DTY—Dry tuber yield (± SE, n = 4) for each treatment (T1—full irrigation; T2—water restriction until g s _ m a x = 0.15 mol H 2 O m 2 s 1 ; T3—water restriction until g s _ m a x = 0.05 mol H 2 O m 2 s 1 ) within irrigation method (DI—drip irrigation; FI—furrow irrigation). Different letters mean significant differences (p-value < 0.05) by the Tukey test. g s _ m a x — maximum light-saturated stomatal conductance.
Agronomy 10 00827 g001
Figure 2. Relationship between PMA—Percentage of maximum assimilation rate, and g s _ m a x —maximum light-saturated stomatal conductance, during the whole experiment. R 2 —Coefficient of determination.
Agronomy 10 00827 g002
Figure 3. PMA—Percentage of maximum assimilation rate (± SE, n = 4) (black symbols) along the growing season under DI—drip irrigation, for each treatment: T1—full irrigation (A); T2—water restriction until g s _ m a x = 0.15 mol H 2 O m 2 s 1 (B); T3—water restriction until g s _ m a x = 0.05 H 2 O m 2 s 1 (C). IV—irrigation volume applied (vertical bars); recovery cycles (green areas); DAP—days after planting; g s _ m a x —maximum light-saturated stomatal conductance.
Agronomy 10 00827 g003
Figure 4. PMA—Percentage of maximum assimilation rate (± SE, n = 4) (black symbols) along the growing season under furrow irrigation, for each treatment: T1—full irrigation (A); T2—water restriction until g s _ m a x = 0.15 mol H 2 O m 2 s 1 (B); T3—water restriction until g s _ m a x = 0.05 mol H 2 O m 2 s 1 (C). IV—irrigation volume applied (vertical bars); recovery cycles (green areas); DAP—days after planting; g s _ m a x —maximum light-saturated stomatal conductance.
Agronomy 10 00827 g004
Figure 5. PMA—Percentage of maximum assimilation rate (A,B); Fv’/Fm’—photochemical efficiency of PSII at light saturated (C,D) and Φ P S I I —effective quantum yield of PSII photochemistry (E,F), along a recovery cycle (−1, +1, +4 and +7 days after rewatering—DAR corresponding to 50, 52, 55 and 58 days after planting, respectively). T1—full irrigation; T2—water restriction until g s _ m a x = 0.15 mol H 2 O m 2 s 1 . Each symbol represents an average value (± SE) of four replicates. Rewatering moment (vertical dashed line); g s _ m a x —maximum light-saturated stomatal conductance. *—Significant differences (p-value < 0.05); n.s.—no significant differences (p-value > 0.05), by t-Student test.
Agronomy 10 00827 g005
Figure 6. Δ C l e a f —Carbon isotope discrimination in leaves one day before (−1) and four days after (+4) rewatering (vertical dashed line) by drip (A,C) and furrow (B,D) irrigation. T1—full irrigation (black bars); T2—water restriction until g s _ m a x = 0.15 mol H 2 O m 2 s 1 (white bars); T3—water restriction until g s _ m a x = 0.05 mol H 2 O m 2 s 1 (gray bars). Different letters mean significant differences (p-value < 0.05) between treatments, by a paired sample t-test. *—significant effect (p-value < 0.05) of rewatering over treatments; DAP—days after planting; g s _ m a x —maximum light-saturated stomatal conductance.
Agronomy 10 00827 g006
Figure 7. Scatter plots showing DTY—dry tuber yield and PMA—percentage of maximum assimilation rate means along a recovery cycle: (A) one day before rewatering (−1), (B) one day after rewatering (+1); (C) four days after rewatering (+4), and (D) seven days after rewatering (+7), under drip (black symbols) and furrow (white symbols) irrigation, for each treatment: T1—full irrigation (circles); T2—water restriction until g s _ m a x = 0.15 mol H 2 O m 2 s 1 (triangles); T3—water restriction until g s _ m a x = 0.05 mol H 2 O m 2 s 1 (squares). Each symbol represents an average value (±SE) of four replicates. r—Spearman correlation coefficient; g s _ m a x —maximum light-saturated stomatal conductance.
Agronomy 10 00827 g007
Figure 8. Biplot of principal component analysis based on water contexts descriptors: D—number of days without irrigation prior to rewatering; TT—cumulative thermal time until rewatering; IP—irrigation pulse applied, and PMA (−1)—percentage of maximum assimilation rate before and PMA+—after rewatering under DI—drip and FI—furrow irrigation. Water treatments: T1—full irrigation; T2—water restriction until g s _ m a x = 0.15 mol H 2 O m 2 s 1 ; T3—water restriction until g s _ m a x = 0.05 mol H 2 O m 2 s 1 under different recovery cycles (a, b, c, d). g s _ m a x —maximum light-saturated stomatal conductance.
Agronomy 10 00827 g008
Table 1. Average daily values (±SE) of environmental conditions during the experimental growing season (2017). VPD—Vapor pressure deficit. PAR—Photosynthetically active radiation.
JulyAugustSeptemberOctober
Average temperature ( C)16.8 ± 0.1015.8 ± 0.1015.6 ± 0.1216.8 ± 0.15
Maximum temperature ( C)19.8 ± 0.2919.2 ± 0.2719.0 ± 0.3821.5 ± 0.30
Minimum temperature ( C)15.3 ± 0.1414.3 ± 0.1014.0 ± 0.0814.6 ± 0.08
Average relative humidity (%)85.4 ± 0.6188.7 ± 0.5791.2 ± 0.5989.6 ± 0.46
Average VPD (kPa)0.24 ± 0.010.18 ± 0.010.14 ± 0.010.17 ± 0.01
Maximum VPD (kPa)0.68 ± 0.030.60 ± 0.030.56 ± 0.050.84 ± 0.03
Solar radiation (MJ m 2 day 1 ) 8.5 ± 0.77 8.8 ± 0.69 9.4 ± 0.9616.8 ± 0.68
Maximum PAR density ( μ mol m 2 s 1 )1084.0 ± 62.21057.2 ± 75.01006.0 ± 89.11692.3 ± 30.5
Table 2. Extracted components (Comp.) loadings from Principal Component Analysis based on previous drought descriptors: number of days without irrigation prior to rewatering (D) and cumulative thermal time until rewatering (TT), irrigation pulse applied (IP) and percentage of maximum assimilation rate before (PMA (−1)) and after (PMA+) rewatering. Shaded data mean loadings or weights of original variables on components > |0.5|. TCV = total cumulative variance.
Comp.1Comp.2
IP0.350.80
TT0.67−0.59
D0.830.37
PMA (−1)−0.92−0.27
PMA+−0.840.51
% TCV56.585.6

