Article

Challenges and Prospects of Biogas from Energy Cane as Supplement to Bioethanol Production

1
Institute NOWUM-Energy, FH Aachen University of Applied Science, Heinrich-Mussmann-Str. 1, 52428 Juelich, Germany
2
Federal Institute of Goiás (IFG), Goiás 76600-000, Brazil
3
PlanET Biogas Group GmbH, Up de Hacke 26, 48691 Vreden, Germany
*
Author to whom correspondence should be addressed.
Agronomy 2020, 10(6), 821; https://doi.org/10.3390/agronomy10060821
Submission received: 5 May 2020 / Revised: 4 June 2020 / Accepted: 4 June 2020 / Published: 9 June 2020
(This article belongs to the Special Issue Bioenergy Crops: Current Status and Future Prospects)

Abstract

:
Innovative breeds of sugar cane yield up to 2.5 times as much organic matter as conventional breeds, resulting in a great potential for biogas production. The use of biogas production as a complementary solution to conventional and second-generation ethanol production in Brazil may increase the energy produced per hectare in the sugarcane sector. Herein, it was demonstrated that through ensiling, energy cane can be conserved for six months; the stored cane can then be fed into a continuous biogas process. This approach is necessary to achieve year-round biogas production at an industrial scale. Batch tests revealed specific biogas potentials between 400 and 600 LN/kgVS for both the ensiled and non-ensiled energy cane, and the specific biogas potential of a continuous biogas process fed with ensiled energy cane was in the same range. Peak biogas losses through ensiling of up to 27% after six months were observed. Finally, compared with second-generation ethanol production using energy cane, the results indicated that biogas production from energy cane may lead to higher energy yields per hectare, with an average energy yield of up to 162 MWh/ha. Finally, the Farm2CBG concept is introduced, showing an approach for decentralized biogas production.

1. Introduction

Sugar cane cultivation was established during the colonization of Brazil by Portugal. Brazil’s geographical and climatic conditions are highly suitable for the growth of sugar cane, which is mainly processed into sugar and bioethanol. Additionally, heat and electricity are produced through burning bagasse in steam boilers. The oil crisis, that began in the early 1970s and culminated in 1979, prompted the Brazilian government to launch the Brazilian alcohol program (Pró-Álcool) in 1975, to produce ethanol for fuel, in an effort to become less dependent on fossil oil imports, which have reduced since 1989 [1]. After committing to the Paris Agreement in 2015, the Brazilian government launched the RenovaBio program in 2017, which aims to reduce carbon dioxide emissions by 43% compared with the emissions in 2005, by 2030, through the introduction of carbon dioxide emission certificates [2,3]. Although bioethanol was established to counter high oil prices, growing awareness of climate change and the need to reduce greenhouse gases is likely to result in ongoing strong demand for alcohol as a fuel in Brazil [3]. Consequently, in 2018, approximately 33.1 billion L of ethanol were produced, including 30.3 billion L for use as fuel [4].
In response to past high oil prices, Brazil’s total annual sugar cane production increased from 79.8 million tons in 1970 to 620 million tons in 2018–2019. Because of the increased demand for production capacities, new sugar cane processing plants have been built between 2004 and 2019 [5,6]. In 2019, 343 sugar cane processing plants were operating in Brazil [7].
Most ethanol mills that have been built in the last two decades can also produce surplus electrical energy, which is generated from the steam that results from burning bagasse. Consequently, the electrical energy contribution from bagasse combustion to the Brazilian grid rose from 7.9 TWh/a in 2009 to 21.5 TWh/a in 2018 [8,9]. Contrary to the positive effect of reduced carbon dioxide emissions from biofuels related to fossil fuels, sugar cane cultivation can increase the deforestation in Brazil, which has a negative impact on the climate and native communities [10,11]. Energy crop cultivation on the landside is competing with food and consumables production and residential areas [12]. Producing ethanol or biogas out of microalgal biomass and waste from industrial agriculture may be an approach to counteract deforestation. In Brazil, about 40 TWh/a of electrical energy could be generated from biogas converted from landfills, wastewater treatment, vinasse, cattle-, pig-, and poultry manure [13]. Biogas or ethanol production from microalgae would shift bioenergy production to the sea, leading, for example, to new food production capacity on the fertile soil, but these techniques need to be further developed to reach market maturity [14,15,16]. Energy cane can be cultivated on marginal soil for ethanol and biogas production. Thereby, fertile soil capacities would be released [17,18].
To accomplish efficient ethanol production from sugar cane, second-generation ethanol processes must be used, because of the high cellulose content in sugar cane. Yeasts in industrial ethanol production lack the enzyme expression necessary to degrade cellulose to glucose. In second-generation ethanol production, cellulose-degrading enzymes are added during a hydrolyzation step prior to fermentation. Since 2015, second-generation ethanol has been produced from sugar cane waste in Brazil, and in 2018, approximately 25 million L were produced from cellulose [4]. Biogas could be produced complementary to second-generation ethanol from sugar cane, as it has a high fiber content, including cellulose, which can also be degraded to methane during biogas fermentation [18,19].
In Brazil, the possibility of using biogas for electricity production or as biofuel had largely been overlooked until 2010, when the first sugar cane processing plants were also used for energy generation. Approximately 95% of the biogas produced in Brazil is landfill gas from urban waste digestion, and this means that agricultural waste and energy crops such as energy cane represent major unexploited sources for biogas production [20]. Industrial biogas processes are well established, especially in Germany, where the first biogas plants were constructed in the 1980s to use manure for energy generation. Biogas consists mainly of methane (50–75%) and carbon dioxide (25–45%) [21]. Since 1992, the amount of biogas plants in Germany rose from 139 to 9444 plants in 2018, and the feed of biomass for biogas production, especially maize silage, increased [22]. In 2018, approximately 29.4 TWh/a were produced from biogas, representing 4.5% of the total energy generation in Germany [23].
The feasibility of the anaerobic digestion of byproducts from sugar cane processing into sugar and bioethanol has already been demonstrated by studies on the biogas potential of the waste materials vinasse, filter cake, bagasse and straw [24,25,26,27]. However, to date, the biogas potential of the entire sugar cane plant has not been sufficiently investigated. In the past, for bioethanol production, the goal had been to maximize the sugar content of cane, which is inconsistent with producing cane that meets the biomass needs of biogas production. Since the 1970s, however, sugar cane breeds with increased biomass yields, so-called energy cane, have been developed for energy production [17]. The cultivation of energy cane can lead to up to 2.5 times higher yields of dry matter per hectare (68.4 tDM/ha) compared with conventional sugar cane (27.6 tDM/ha) [18]. The increased yield of biomass per hectare also boosts the energy amount that can be obtained per hectare.
Several aspects, such as the organic loading rate, technical challenges and the specific biogas yield, must be considered when changing the feed source of a biogas process. Since the energy cane harvest is seasonal and biogas processes must be fed continuously, conservation of the cane is essential for a stable biogas process. This requires examining whether energy cane can be ensiled, like the energy crop maize, which is predominant in Germany. Problems regarding the process performance must also be resolved: for example, the high fiber content of energy cane may lead to flotation layers in the biogas plant that hinder the mixing process [18,28,29]. Furthermore, the high lignin content in energy cane may lower the biogas potential if no pretreatment is applied, because the anaerobic degradability of lignin is poor [29,30].
The novelty of this study is the investigation of the ensiling of the entire energy cane crops for conservation and the determination of the biogas potential to compare its area-related energy yield with that of modern ethanol production in Brazil. Published data on energy cane conversion to biogas are low, and there are only a few concepts known to establish energy cane related biogas production.
The main objectives of this study are (i) demonstrating the feasibility of energy cane ensiling to provide year-round biogas feed for biogas production in batch tests and (ii) in a continuous biogas process, (iii) comparing the area related energy yield of biogas and first- and second-generation ethanol production from energy cane, (iv) introduction of a concept for decentralized biogas production.

2. Materials and Methods

The experiments to determine the biogas potential of Brazilian energy cane were carried out with samples of the entire plant. In order to ensure year-round feeding of the continuous biogas process, a conservation period of six months was required.

2.1. Ensiling

Samples of energy cane plants, including the straw (leaves), were obtained from a sugarcane producer in the Brazilian State of Goiás. Two lots of energy cane (lot A and lot B) were used for the experiments.
Lot A was obtained two months before the determination of the specific biogas yield. After shipment within two weeks, energy cane plants were shredded to approximately 10–100 mm (Holzhaecksler, 35 mm, Boels Verleih GmbH, Willich, Germany) on the Campus Jülich of the FH Aachen University of Applied Sciences in Germany. The shredded energy cane was compacted, ensiled in a 120 L polyethylene barrel, and stored at room temperature for two months. The remaining air was displaced by nitrogen (N2), to avoid aerobic digestion and mold growth.
The entire composition of the energy cane plants in lot B, including the straw, was preshredded in Brazil at the Instituto Federal de Goiás, and the shredded matter was sent to Germany, where it was shredded to approximately 4–10 mm (1830 Coffee Flavour, CASO, Arnsberg, Germany) and ensiled in vacuum bags (Lava V.300® Premium, la.va, Bad Saulgau, Germany), with and without natrium hydroxide (NaOH; 0.25 mol/kgFM). Natrium hydroxide was added, because of promising results from preliminary trials in Brazil, and because it may reduce silage losses [19,31,32]. Three loose-packed samples and three tightly packed samples of each treatment were stored at room temperature for four months. Furthermore, the weight of each silage bag was documented at the beginning and at the end of ensiling. To determine possible weight losses due to ensiling, a precision balance with a reproducibility of ±0.01 g was used (LSP-1502, VWR, Darmstadt, Germany) [33].
For the continuous process, tightly packed energy cane with NaOH addition was prepared like the batch test preparations and ensiled. Amounts of substrate were removed from the bag weekly for feeding the continuous biogas process, after which the bag was vacuum-sealed again.

2.2. Analysis of Energy Cane Composition

The energy cane composition was determined externally by the German Institute for Soil and Environment from the LUFA-Nord-West, with the following being measured: nitrogen (N), carbon (C), C/N ratio, acid detergent fiber (ADF), amylase-treated neutral detergent fiber (aNDF), acid detergent lignin (ADL), dry matter (DM), ash content, crude protein, crude fat, and the theoretical biogas yield, according to the method of Baserga [34].

2.3. Batch Tests

The batch tests were performed in glass eudiometers in accordance with DIN 38 414 [35]. In the batch tests of lot A, amounts of fresh matter (FM) energy cane (10 or 15 g), shredded to approximately 4–10 mm (1830 Coffee Flavour, CASO, Arnsberg, Germany) were added to an inoculum of digestate (240 or 235 g) from a German agricultural mesophilic biogas plant (70% maize-silage and 30% liquid manure) in triplicate. In addition, three batch tests were prepared, with 250 g inoculum as control. The amount of fresh mass used was chosen based on previous batch tests (data not shown). Batch trials in lot B were prepared with a volumetric organic load of 10.5–12.5 gVS/L and an inoculum of 200 g (70% maize-silage and 30% liquid manure). For parallel biogas determination, two samples of each vacuum bag were used, leading to each six samples of the four different ensiling conditions (control/tight, control/loose, NaOH/tight, NaOH/loose). For the estimation of specific biogas potential, the biogas potential of 200 g inoculum was measured in triplicate. The specific biogas potential of the non-ensiled energy cane (non-ensiled EC) was determined in triplicate with 9 gVS/L and 200 g inoculum. For control, the biogas potential of 200 g inoculum was determined in triplicate. The digestate was preheated for 24 h at 40 °C to enhance microbial metabolism. Following the substrate addition, the testing vessels were pivoted to mix the substrate with the microorganisms. The trials were prepared at 40 °C; water baths (Aqua Line AL 18, LAUDA, Lauda-Königshofen, Germany) were used to temper the vessels. The volumetric organic loadings of the tests are shown in Table 1.

2.4. Continuous Biogas Process

The continuous biogas process was performed as described by Paulsen et al., in a modified continuous stirred tank reactor (Bioprocess Control), with an enlarged drain pipe and a working volume of 10 l [36]. The process was fed once per day, with organic loading rates varying between 1.05 and 1.51 gVS/(L × d). The moisture of the feed was adjusted to 25%DM with tap water. Biogas production was measured (MilliGascounter, Ritter Apparatebau, Bochum, Germany) and its methane and carbon dioxide composition were measured (Multitec 540, SEWERIN, Gütersloh, Germany) on daily basis from the cumulated gas. The digestate was analyzed as follows: VOA/TIC (BIOGAS Titration Manager, Hach, Hach Lange GmbH, Duesseldorf, Germany) and pH (pHenomenal pH 1100L®, VWR, Darmstadt, Germany, with a BlueLine 22 pH electrode from SI Analytics/ Xylem Analytics Germany Sales GmbH & Co. KG, Weilheim, Germany) were determined twice per week. Volatile organic acids were analyzed once per week or during acidification daily via gas chromatography (GC-2010 with AOC-20i Auto-Injector, Shimadzu Scientific Instruments, Kyoto, Japan and Column: FS-FFAP-CB-0.25 CS-Chromatographie Service, Langerwehe, Germany). Total phosphorous, ammonium and total nitrogen bound were measured once per week (LT 200 and DR 2800, standardized kits LCK350, LCK238, LCK302, LCK302, Hach Lange GmbH, Duesseldorf, Germany). DM and volatile solids (VS) content of the digestate was determined on a weekly basis (N 100/14, Nabertherm, Lilienthal, Germany).
In addition, the concentrations of trace elements were adjusted to 16 mg/kgVS nickel, 25 mg/kgVS cobalt, 7.5 mg/kgVS molybdenum, and 0.5 mg/kgVS selenium (at day 562), on the basis of the nutritional analysis of the digestate by LUFA-Nord-West. The carbon/nitrogen/phosphorous (C/N/P) ratio of the digestate could not be adjusted, because the C content was not determined. Instead, the N/P ratio was related to the VS as the VS/N/P ratio. At day 565, the contents of N and P were increased through the addition of diammonium phosphate and urea, resulting in a VS/N/P ratio of 70 gVS:1 gN:0.15 gP.

2.5. Calculation of Theoretical Energy Yields

The theoretical energy cane–based methane yield, first- and second-generation ethanol yields, area-related energy yields from biogas, and total ethanol production were calculated based on the biogas yields of the continuous process shown in this work and the crop yield and composition data, based on dos Santos et al. and Kim and Day, which are shown in Table 2 [18,29].
The calculation of the theoretical area-related energy yield from biogas was based on the minimum biogas yield of energy cane, with 400 m3N/tVS and 50% methane content and the mean biogas yield of energy cane with 475 m3N/tVS and 51% methane content. Biogas losses through ensiling, and losses through pretreatment and processing for biogas and ethanol production, were neglected.

3. Results

3.1. Ensiling and Batch Tests

The ensiling process was monitored through visual and olfactory control. Mold growth is an indicator of leakage of the ensiling vessel, because it is oxygen dependent. Thus, a foul or rotten odor indicates faulty fermentation. Two lots of energy cane were ensiled and tested for specific biogas production: lot A and lot B. After two months of ensiling, the energy cane in lot A exhibited no negative visual or olfactory characteristics. Batch tests indicated that specific biogas production from the ensiled energy cane (lot A), which achieved stability after 28 days, was between 417 ± 45 (10 gFM) and 485 ± 66 LN/kgVS (15 gFM; shown in Figure 1). This demonstrated that a biogas process based on energy cane is generally feasible.
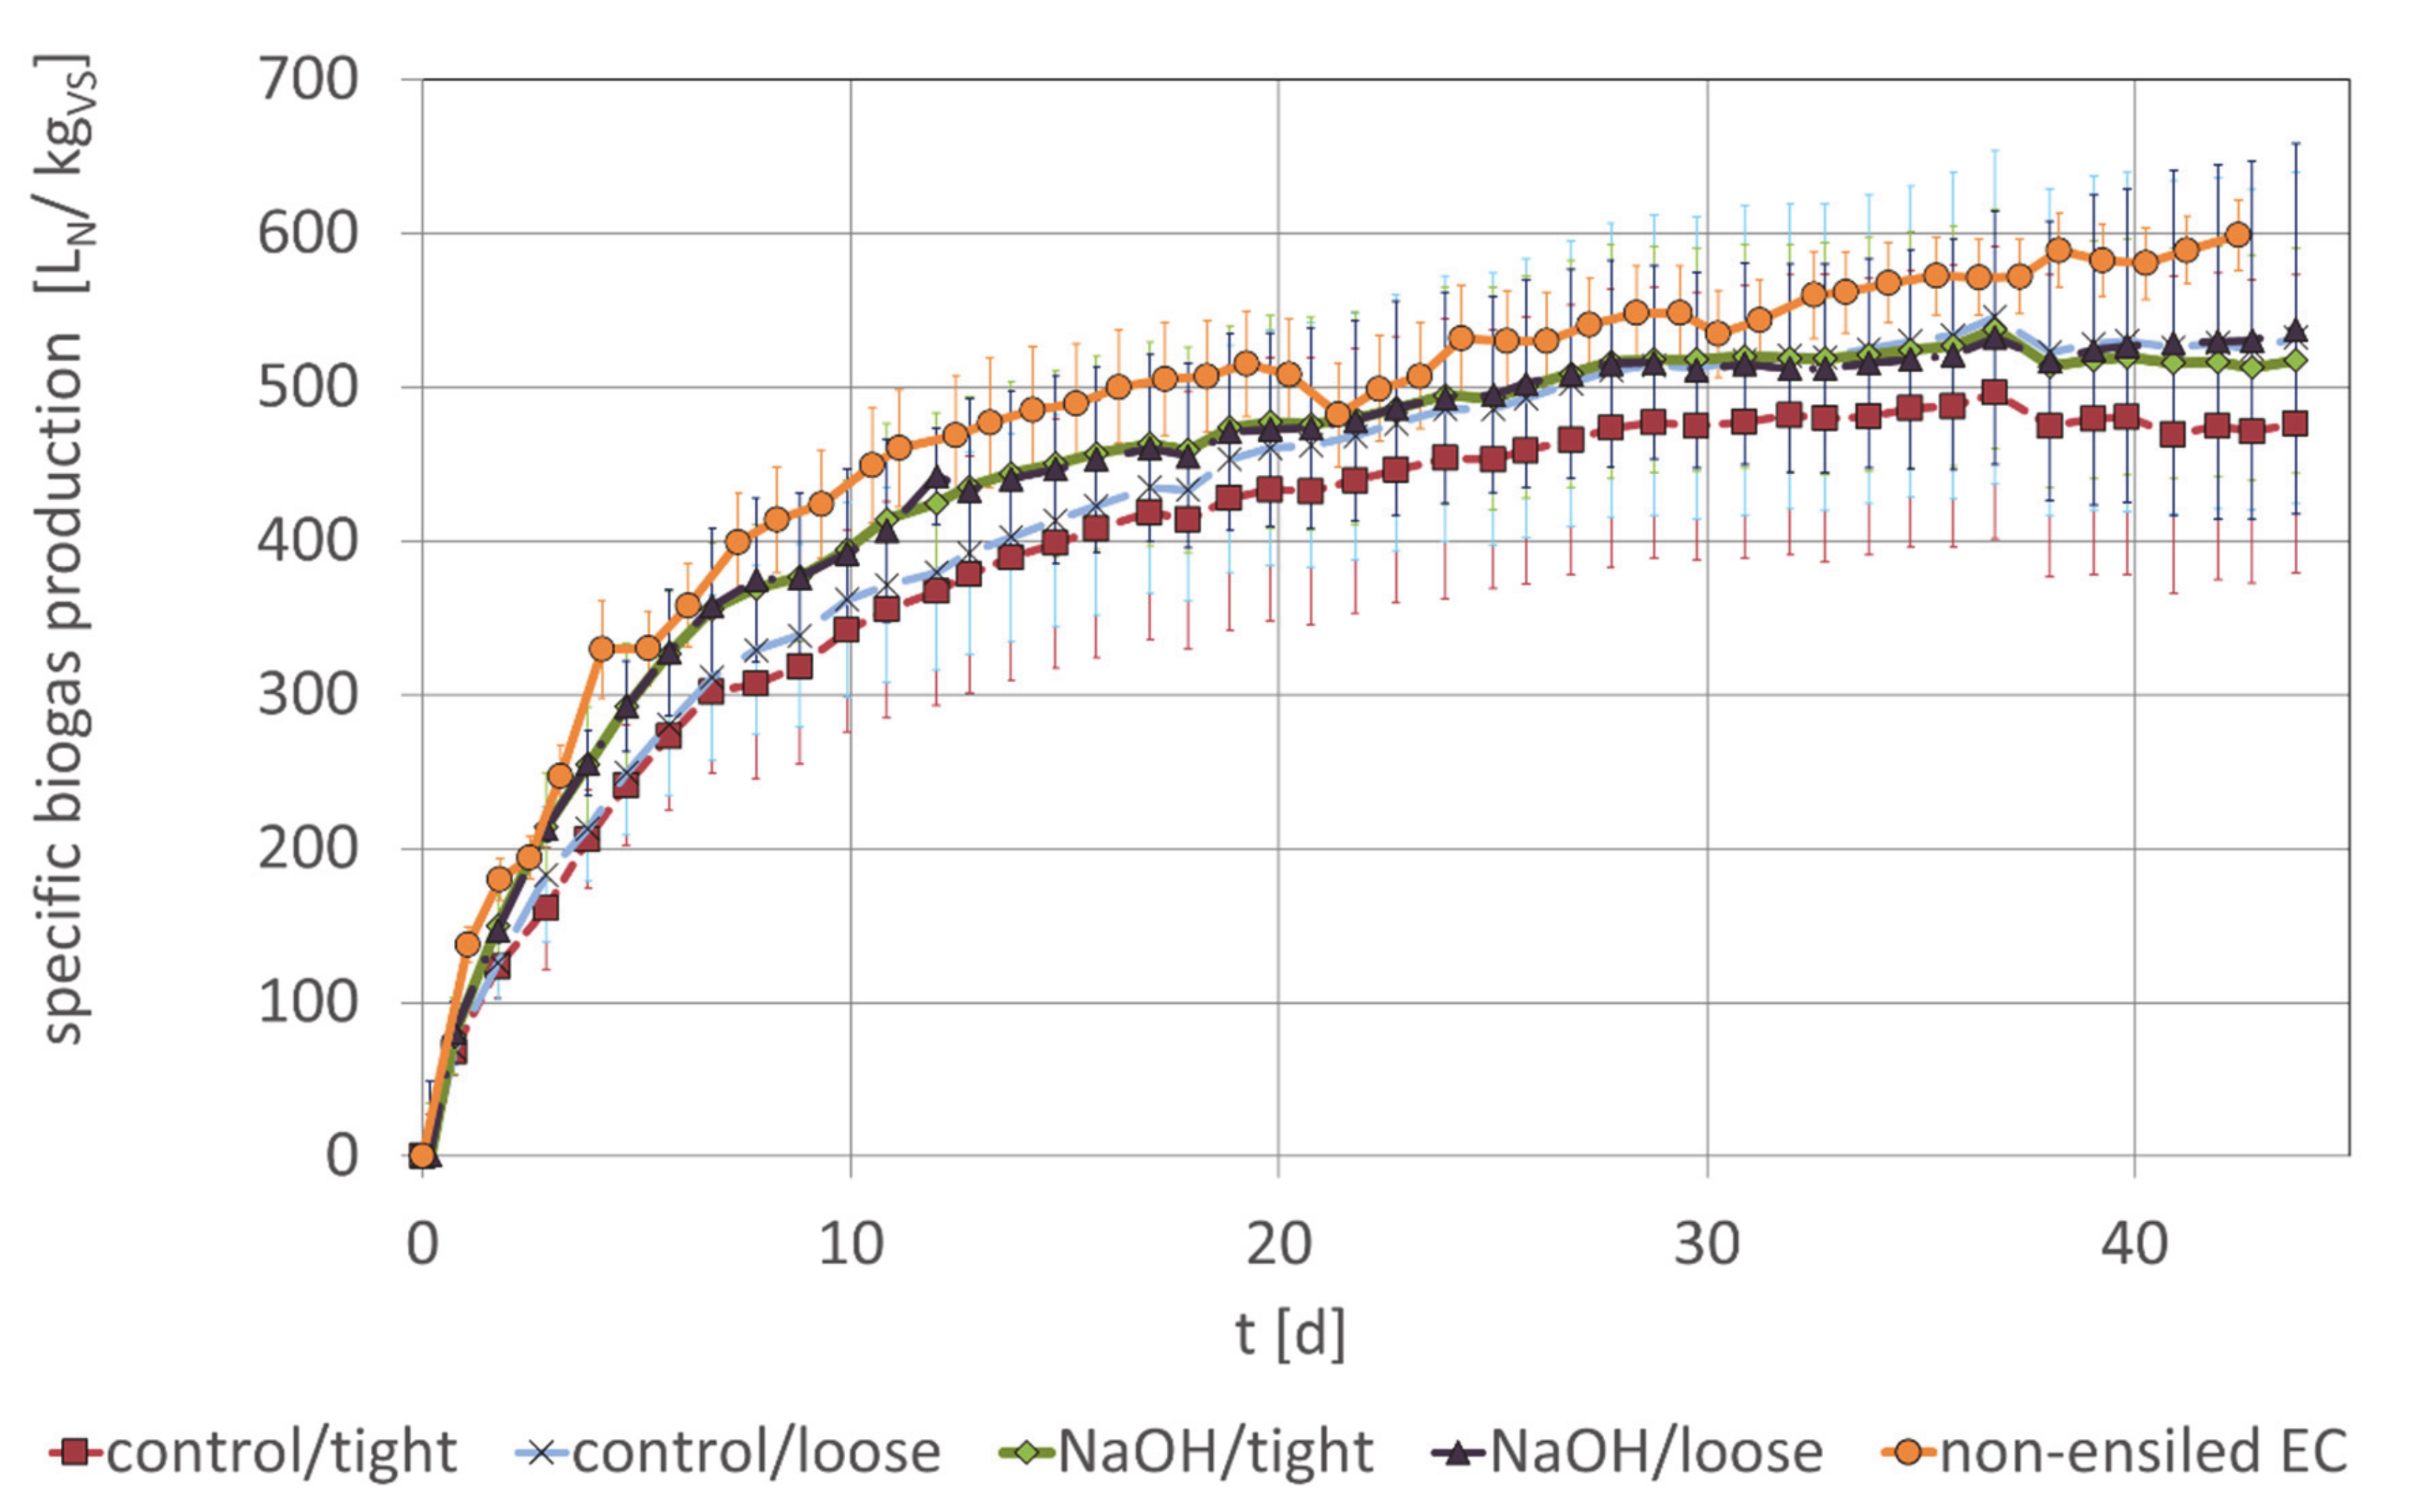
In the batch tests of the non-ensiled energy cane from lot B, a specific biogas production of 599 ± 22 LN/kgVS was achieved after 42 days (non-ensiled EC in Figure 2.). In addition, the composition of the non-ensiled sugar cane was analyzed, and the results (shown in Table 3) indicated that the biogas potential was approximately 555 LN/kgVS, according to the method of Baserga [34].
After ensiling the energy cane for four months, with and without the addition of NaOH and using loose or tight packaging, the specific biogas potential was determined again, over a period of 44 days through batch tests. The batch tests of the energy cane ensiled without the addition of NaOH (“control” in Figure 2) revealed a biogas potential of 469 ± 103 LN/kgVS for the tightly packed silage and 536 ± 108 LN/kgVS for the loose-packed silage. Yields for tightly packed silages with NaOH reached 518 ± 77 LN/kgVS, and the loose-packed silage yielded 524 ± 100 LN/kgVS (Figure 2).
Batch tests demonstrated that ensiling energy cane for four months decreased its biogas potential by 10–22% compared with fresh, non-ensiled energy cane (Figure 2) and 3–16% compared with the biogas potential calculated based on the method of Baserga. No weight loss was detectable after ensiling the energy cane. The influence of the varied NaOH addition and packing density was not observed under the given circumstances.

3.2. Continuous Biogas Process

Ensiled energy cane was fed to a mesophilic stirred continuous biogas process. Data concerning the establishment of the biogas process (Day 1 to 500) were published by Paulsen et al., resulting in an average gas production of 0.5 m3N/kgVS (500 LN/(kgVS respectively) [36]. The continuous process was susceptible to acidification caused by the massive local accumulation of slowly degradable floating fibers.
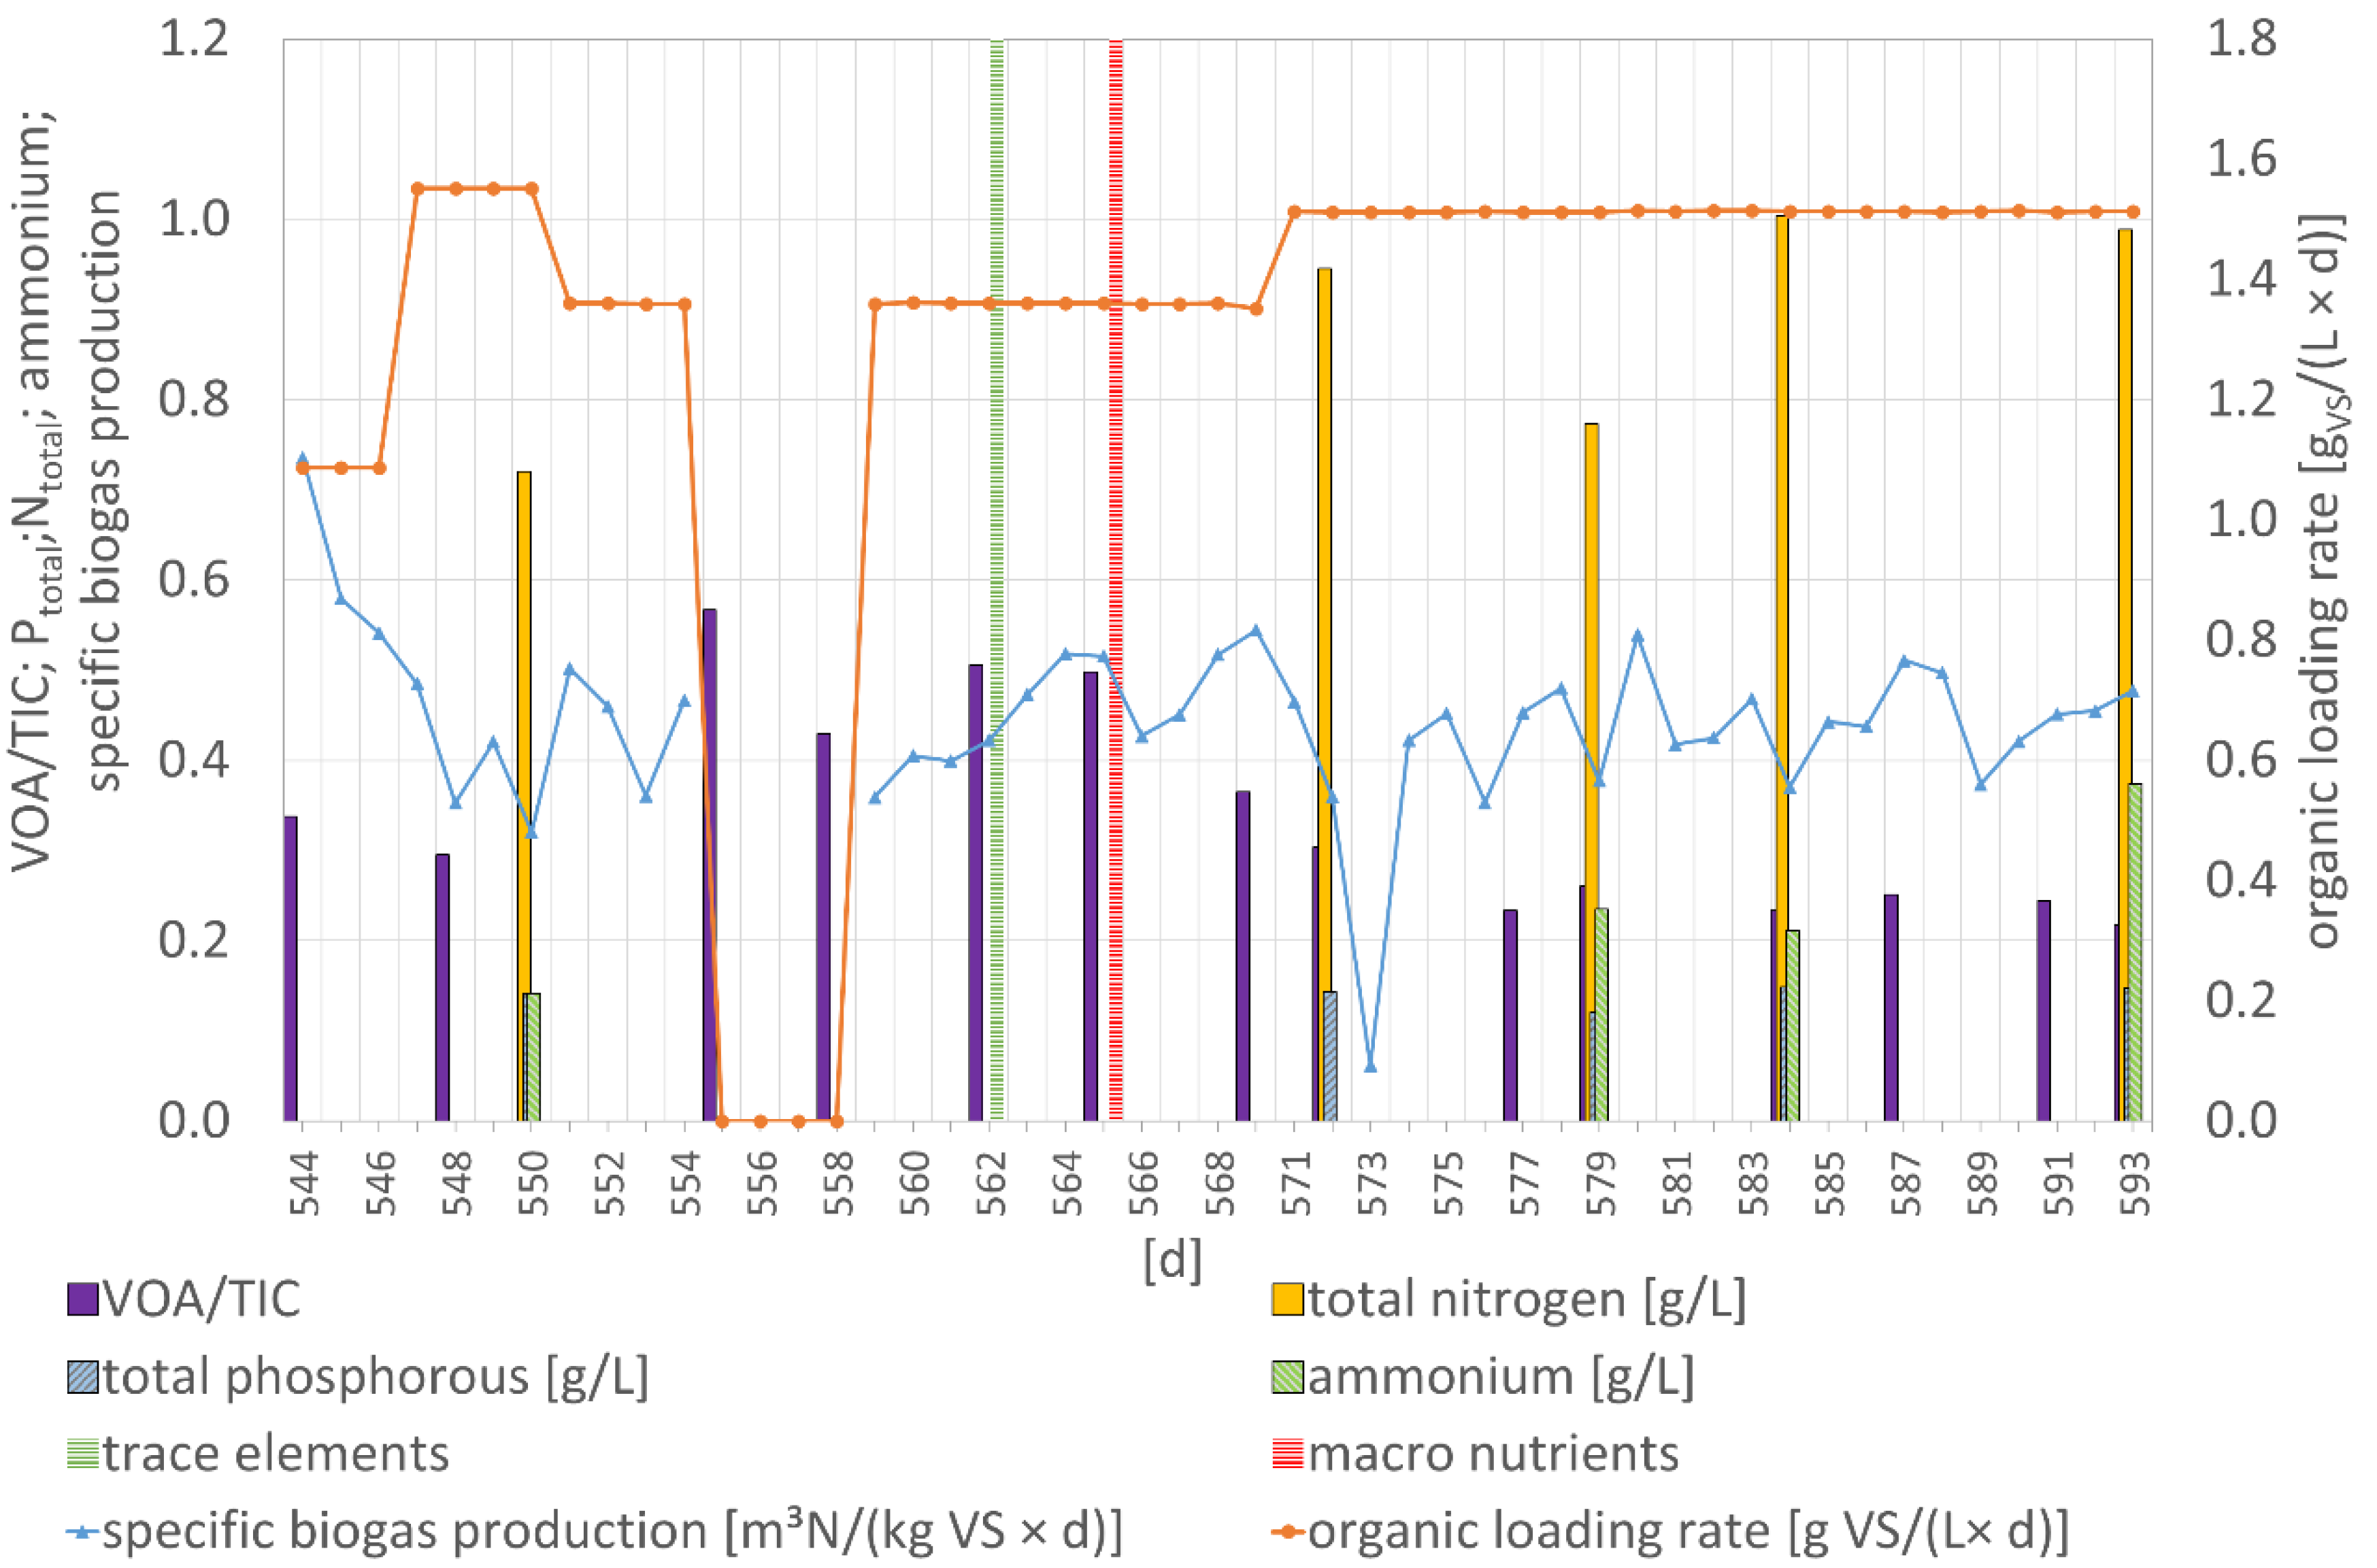
As shown in Figure 3 and Figure 4, the main parameters for monitoring acidification, the volatile organic acid to total inorganic carbon ratio (VOA/TIC) and the acetic acid concentration, rose from day 555 to day 564, although feeding was paused between day 555 and 558. To counteract acidification, trace elements were added on day 562. Because the acetic acid concentration did not decrease after trace element supplementation (Figure 3), the VS/N/P ratio of 70 gVS:0.7 gN:0.14 gP was adapted on day 565.
Because the acetic acid concentration and the VOA/TIC ratio decreased from day 565, the organic loading rate was increased on day 571 from 1.36 gVS/(L × d) to 1.51 gVS/(L × d). This inhibited the gas formation of the process on day 573 and led to increased acetic acid and isovaleric acid concentrations. Without changing the parameters, the process regenerated on day 574. Subsequently, the process was stable until day 593, and no further acidification occurred.
The specific gas production varied from approximately 0.36 to 0.5 m3N/kgVS (360 to 500 LN/kgVS respectively), between days 574 and 593 (Figure 3). During the given period, the biogas carbon dioxide concentration was between 20 and 30%, and the methane concentration ranged from approximately 25 to 65% (Figure 4).
Table 4 presents the average process parameters of the time periods prior to the addition of trace elements and macronutrients (days 544–561), the adaption phase after the addition (days 562–573), and the recovered biogas process (days 574–593). An average methane production rate of 242 LN/kgVS for the period of days 574–593 was calculated based on the daily specific biogas production and methane concentration.

4. Discussion

Biogas was produced successfully from the whole energy cane plant in batch tests and in the continuous process, even after ensiling the energy cane. The conservation of energy cane over six months, which is necessary to ensure a continuous year-round feed of the biogas process, was successful. The high biogas losses through ensiling after four months with 6–16% according to Baserga or 13–22% according to the batch test of non-ensiled EC, and six months with 20% according to Baserga or 27% according to the batch test of non-ensiled EC represent peak values; the mean values were not determined. By comparison, silage losses from the well-established energy and forage crop maize result in 12% lower biogas yields at the industrial scale in Germany [34]. The high losses of biogas potential caused by ensiling the sugar cane may be reduced by optimizing the ensiling process through, for example, the application of silage additives [37,38]. Nevertheless, the average silage losses for energy cane ensiling must be determined in the field.
Batch tests of the ensiled energy cane (lot A) indicated that it had lower biogas potential (10 gFM: 417 LN/kgVS; 15 gFM: 485 LN/kgVS) than was observed during the stable continuous process (also lot A, mean: 559 LN/kgVS) [36]. The batch tests on the non-ensiled energy cane of lot B revealed a higher biogas potential (599 LN/kgVS) than what had been calculated theoretically according to the method of Baserga (555 LN/kgVS) [34]. This may be attributable to the microleakage of the glass eudiometers, which would allow air to enter, leading to overestimation of the biogas potential or underestimation of the methane potential when methane concentration would have been measured [39]. Compared with the automatic methane potential test system (AMPTS), which works similarly to the MilliGascounter, the biogas potential examined by eudiometers can be twice as high [40]. The eudiometers used for batch testing indicated only the potential of biogas production, and not that of methane production. The batch tests suffered from high standard deviation, maybe due to low sample homogeneity. As the entire crop was used for the tests and cane straw and stalks digestion lead to different methane yields (sugar cane straw approx. 230–260 LN/kgVS, sugar cane stalks 300–350 LN/kgVS [27,41]), sample homogeneity is rather important, but on the same side hard to achieve, even though the samples were mixed and shredded.
Yeast activities in sugar cane silage may reduce the soluble carbohydrates content and lead to losses of DM. The addition of 1.0–1.5%FM NaOH may support lactic bacteria and increase the digestibility value of dry matter by improving the digestibility of neutral detergent fiber [31,32,42]. Furthermore, increased lactic acid concentrations may inhibit ethanol fermentation [43]. Nevertheless, the addition of NaOH to the ensiling process did not show an improved biogas potential in batch tests. This could also be caused by the high standard deviation. The continuous process provides a more reliable value than the batch test does, because it is closer to the technical upscaling application; the microbiome adapts to the substrate composition over time, and the biogas volume was measured by a MilliGascounter (Dr.-Ing. RITTER Apparatebau, Bochum, Germany), which is less susceptible to false positive results than eudiometers are. However, leakage of the MilliGascounter tubing can lead to false negative results and the consequent underestimation of biogas potential.
The anaerobic fermentation of methane from energy cane must produce an energy yield comparable to conventional ethanol production for biogas to be practicable, especially in view of the currently booming second-generation ethanol production. In Brazil, an average of 6280 L/ha of first-generation ethanol with 36.7 MWh/ha energy, based on the lower heating value of ethanol, can be produced from sugar cane [44]. Through second-generation ethanol production, an additional 4572 l/ha (26.7 MWh/ha) can be produced [29]. This totals a production of 63.4 MWh/ha from sugar cane.
To reveal the potential of biogas production from the energy cane, its area-related energy yield was calculated. No area-related crop yields were given for the tested energy cane, so the theoretical energy yield, as shown in Table 5, was calculated on the basis of the crop yield from two different studies (dos Santos et al. and Kim and Day) and the minimum and mean biogas potentials determined in this work [18,29]. Neither energy consumption nor product losses were considered with respect to biogas or ethanol production.
With respect to the average specific gas production in the period of days 574–593, the biogas potential was reduced by 27% compared with the batch test results for non-ensiled energy cane digestion (599 LN/kgVS). According to the biogas potential calculated from the energy cane composition based on the method of Baserga, the loss would be approximately 20% after six months of ensiling [34]. Supplementation of macronutrients and trace elements had a positive effect on process stability.
The energy yields per hectare from total ethanol and biogas production out of energy cane are shown in Table 4. The energy potential from biogas production, based on the data of Kim and Day, was slightly lower when assuming the minimum biogas potential. In all other cases, however, biogas production from energy cane was found to result in a superior energy yield per hectare compared with ethanol production, including second-generation ethanol production. Silage losses (assumed to be 12–20%) were neglected in the calculation (Table 5), because only peaks were evaluated instead of the average. Consequently, prior to application, they must be validated in the field.
Based on the calculations, sugar cane exhibited a lower potential for biogas than for ethanol. Since the calculations for biogas energy yield from sugar cane were based on the specific biogas potential for energy cane, the calculations should be repeated for the as-yet unidentified biogas potential of the continuous anaerobic fermentation of conventional sugar cane. The batch test fermentation of ensiled Australian sugar cane stalks yielded 300–350 LN/kgVS methane [41]. In comparison, the results of the continuous ensiled energy cane fermentation (242 LN/kgVS) were lower. Different plant composition, ensiling strategies, inoculum, conditions for growth and the poor comparability of batch tests and continuous processes may influence the methane potential of a substrate [33,41,45,46]. Seeing the influence of local conditions (e.g., soil properties, cane breeds, climate), the need for data on methane potential becomes clear.
In comparison with methane potential of other substrates with high lignocellulose content, like wheat straw (237–269 LN/kgVS) and miscanthus (247 l/kgVS;278.7 L/kgVS), the results of energy cane (242 lN/kgVS) are of a similar magnitude [47,48,49]. Compared with energy cane, the average methane yield from anaerobic maize silage digestion is comparatively higher, at approximately 340 LN/kgVS, but higher crop yields from energy cane may compensate for its lower methane potential [21,50]. Between 2013 and 2017, the average maize silage yield in Germany was approximately 16.2 tDM/ha (assuming 33%DM/FM and 95%VS/DM), resulting in 5223 m3N/ha of methane with 52.0 MWh/ha energy, based on the lower heating value of methane [21,51]. If biogas technology is applied to Brazilian maize silage yields (17.4–28.2 tDM/ha), a production between 55.9 and 90.6 MWh/ha can be expected (assuming 95%VS/DM) [21,52]. Although the Brazilian maize yields can possibly be improved in the future through further industrialization, the prospects for energy cane as biogas substrate are not diminished, because, compared with maize silage fermentation, the theoretical biogas energy yields per hectare from energy cane are 1.5 to 2.9 times higher than those of maize silage, and the yields from sugar cane are of a similar magnitude. Despite the promising data regarding biogas production from energy cane in Table 5, the results still need to be confirmed at the industrial scale in the field.
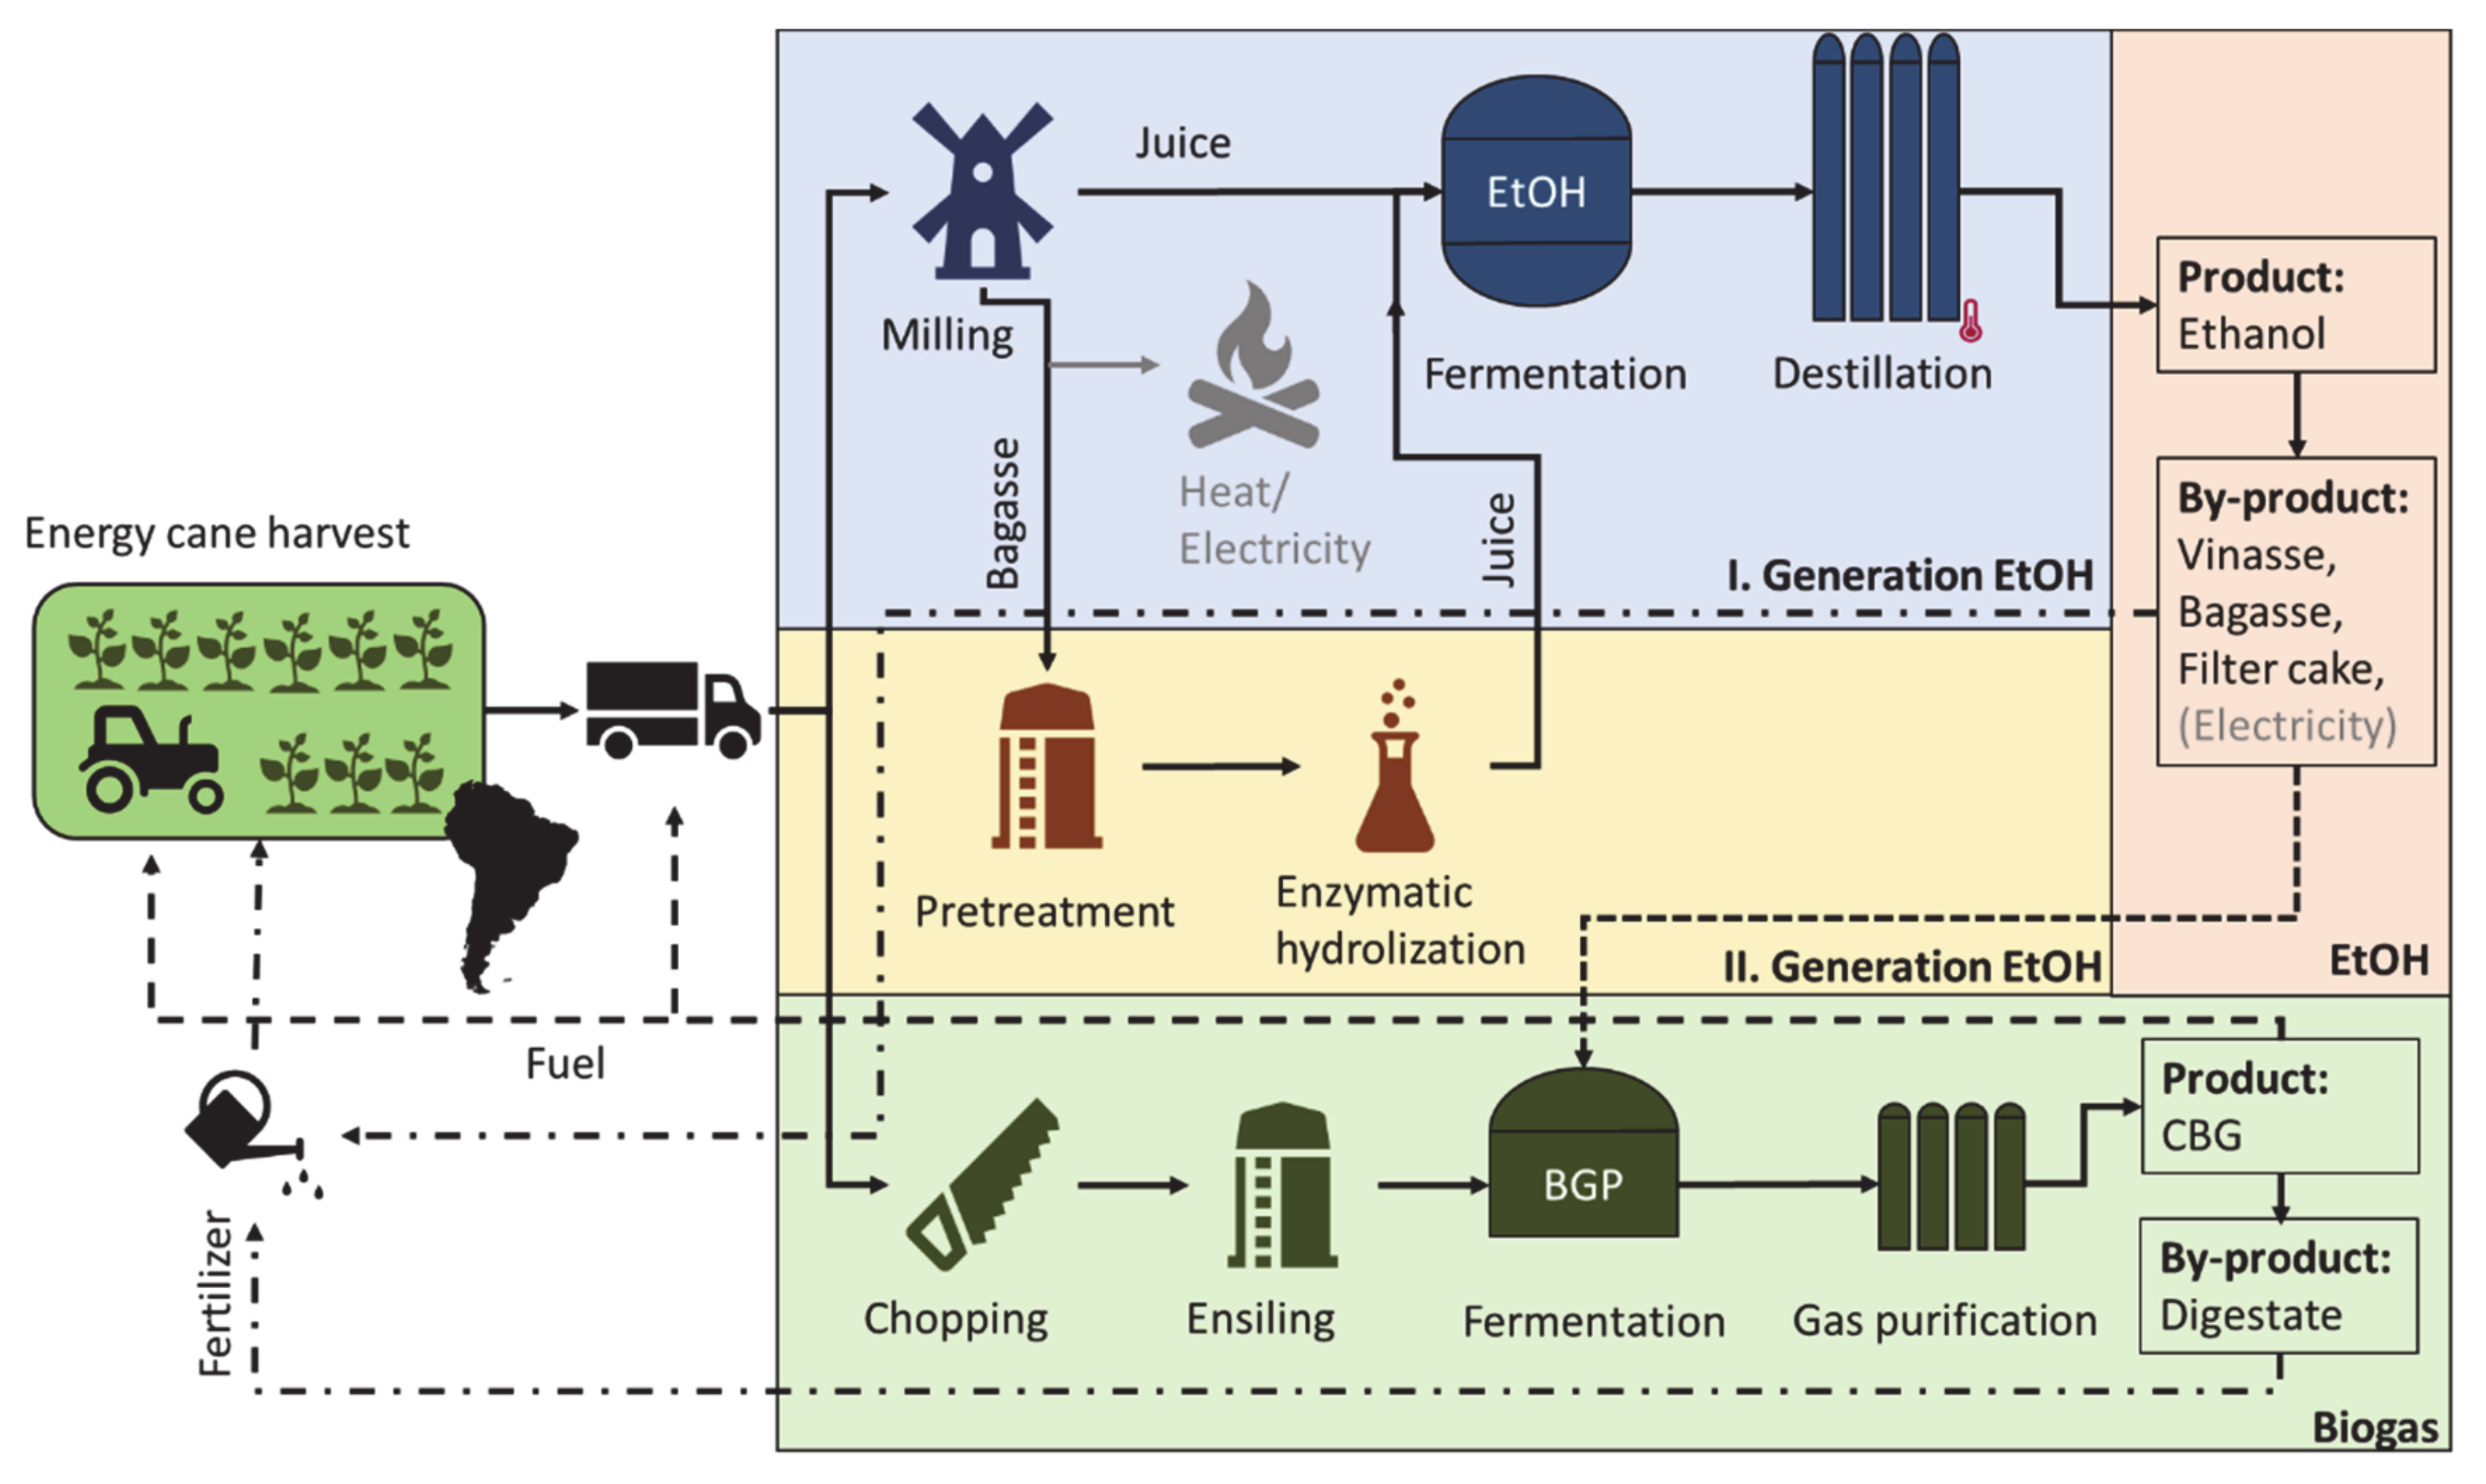
To establish a stable energy cane biogas industry, production technology must be economical. Furthermore, a thorough understanding of the technologies and their advantages and disadvantages is important. A comparison of the production schemes of biogas and first- and second-generation ethanol is shown in Figure 5.
Due to the harvest periods, ethanol mills cannot run year-round [29]. Transportation of the seasonally harvested energy cane to the ethanol mill accounts for up to 75% of the bioethanol production costs [53]. The average distance that sugar cane must be transported to the ethanol mills varies between 25 and 40 km [53,54]. For first-generation ethanol production, the sugar cane/energy cane plants are washed prior to sugar milling, producing sugar juice as the product and bagasse as the by-product. The bagasse can either be used for heat and surplus energy production, or it can be enzymatically hydrolysed in the second-generation ethanol process. The sugar juice and the glucose containing hydrolysate are then fermented into ethanol by yeast and finally distilled. Bagasse, filter cake, and vinasse can be used as fertilizer or fed into a biogas plant [25,26,27].
For biogas production, the energy cane must be chopped into small pieces to improve its availability for the microorganisms. The chopped cane is ensiled for conservation. Biogas is produced from the silage, and then it is compressed and purified. The digestate of the biogas process can be used as fertilizer. When comparing the biogas process with first- and second-generation ethanol processes, several challenges are evident for establishing the biogas industry. Increasing energy cane yields per hectare may overcome these challenges in the future, because a more-sophisticated second-generation ethanol process is needed for efficient ethanol production, which might be more difficult to handle [15,17,18]. Since the second-generation ethanol process is still under development, biogas processes may be a promising alternative or supplement, especially due to the high theoretical biogas energy yield per hectare. The implementation of energy cane–based biogas technology in Brazil would enable year-round compressed biogas (CBG) production (and employment). The produced CBG could be used as fuel for vehicles, for cooking, or for industrial processes. CBG can be used instead of diesel fuel for heavy-duty vehicles and thereby reduce carbon dioxide emissions and the costs for energy cane cultivation and transport, especially in view of the carbon dioxide certificates that will be introduced as part of the RenovaBio program [55,56].
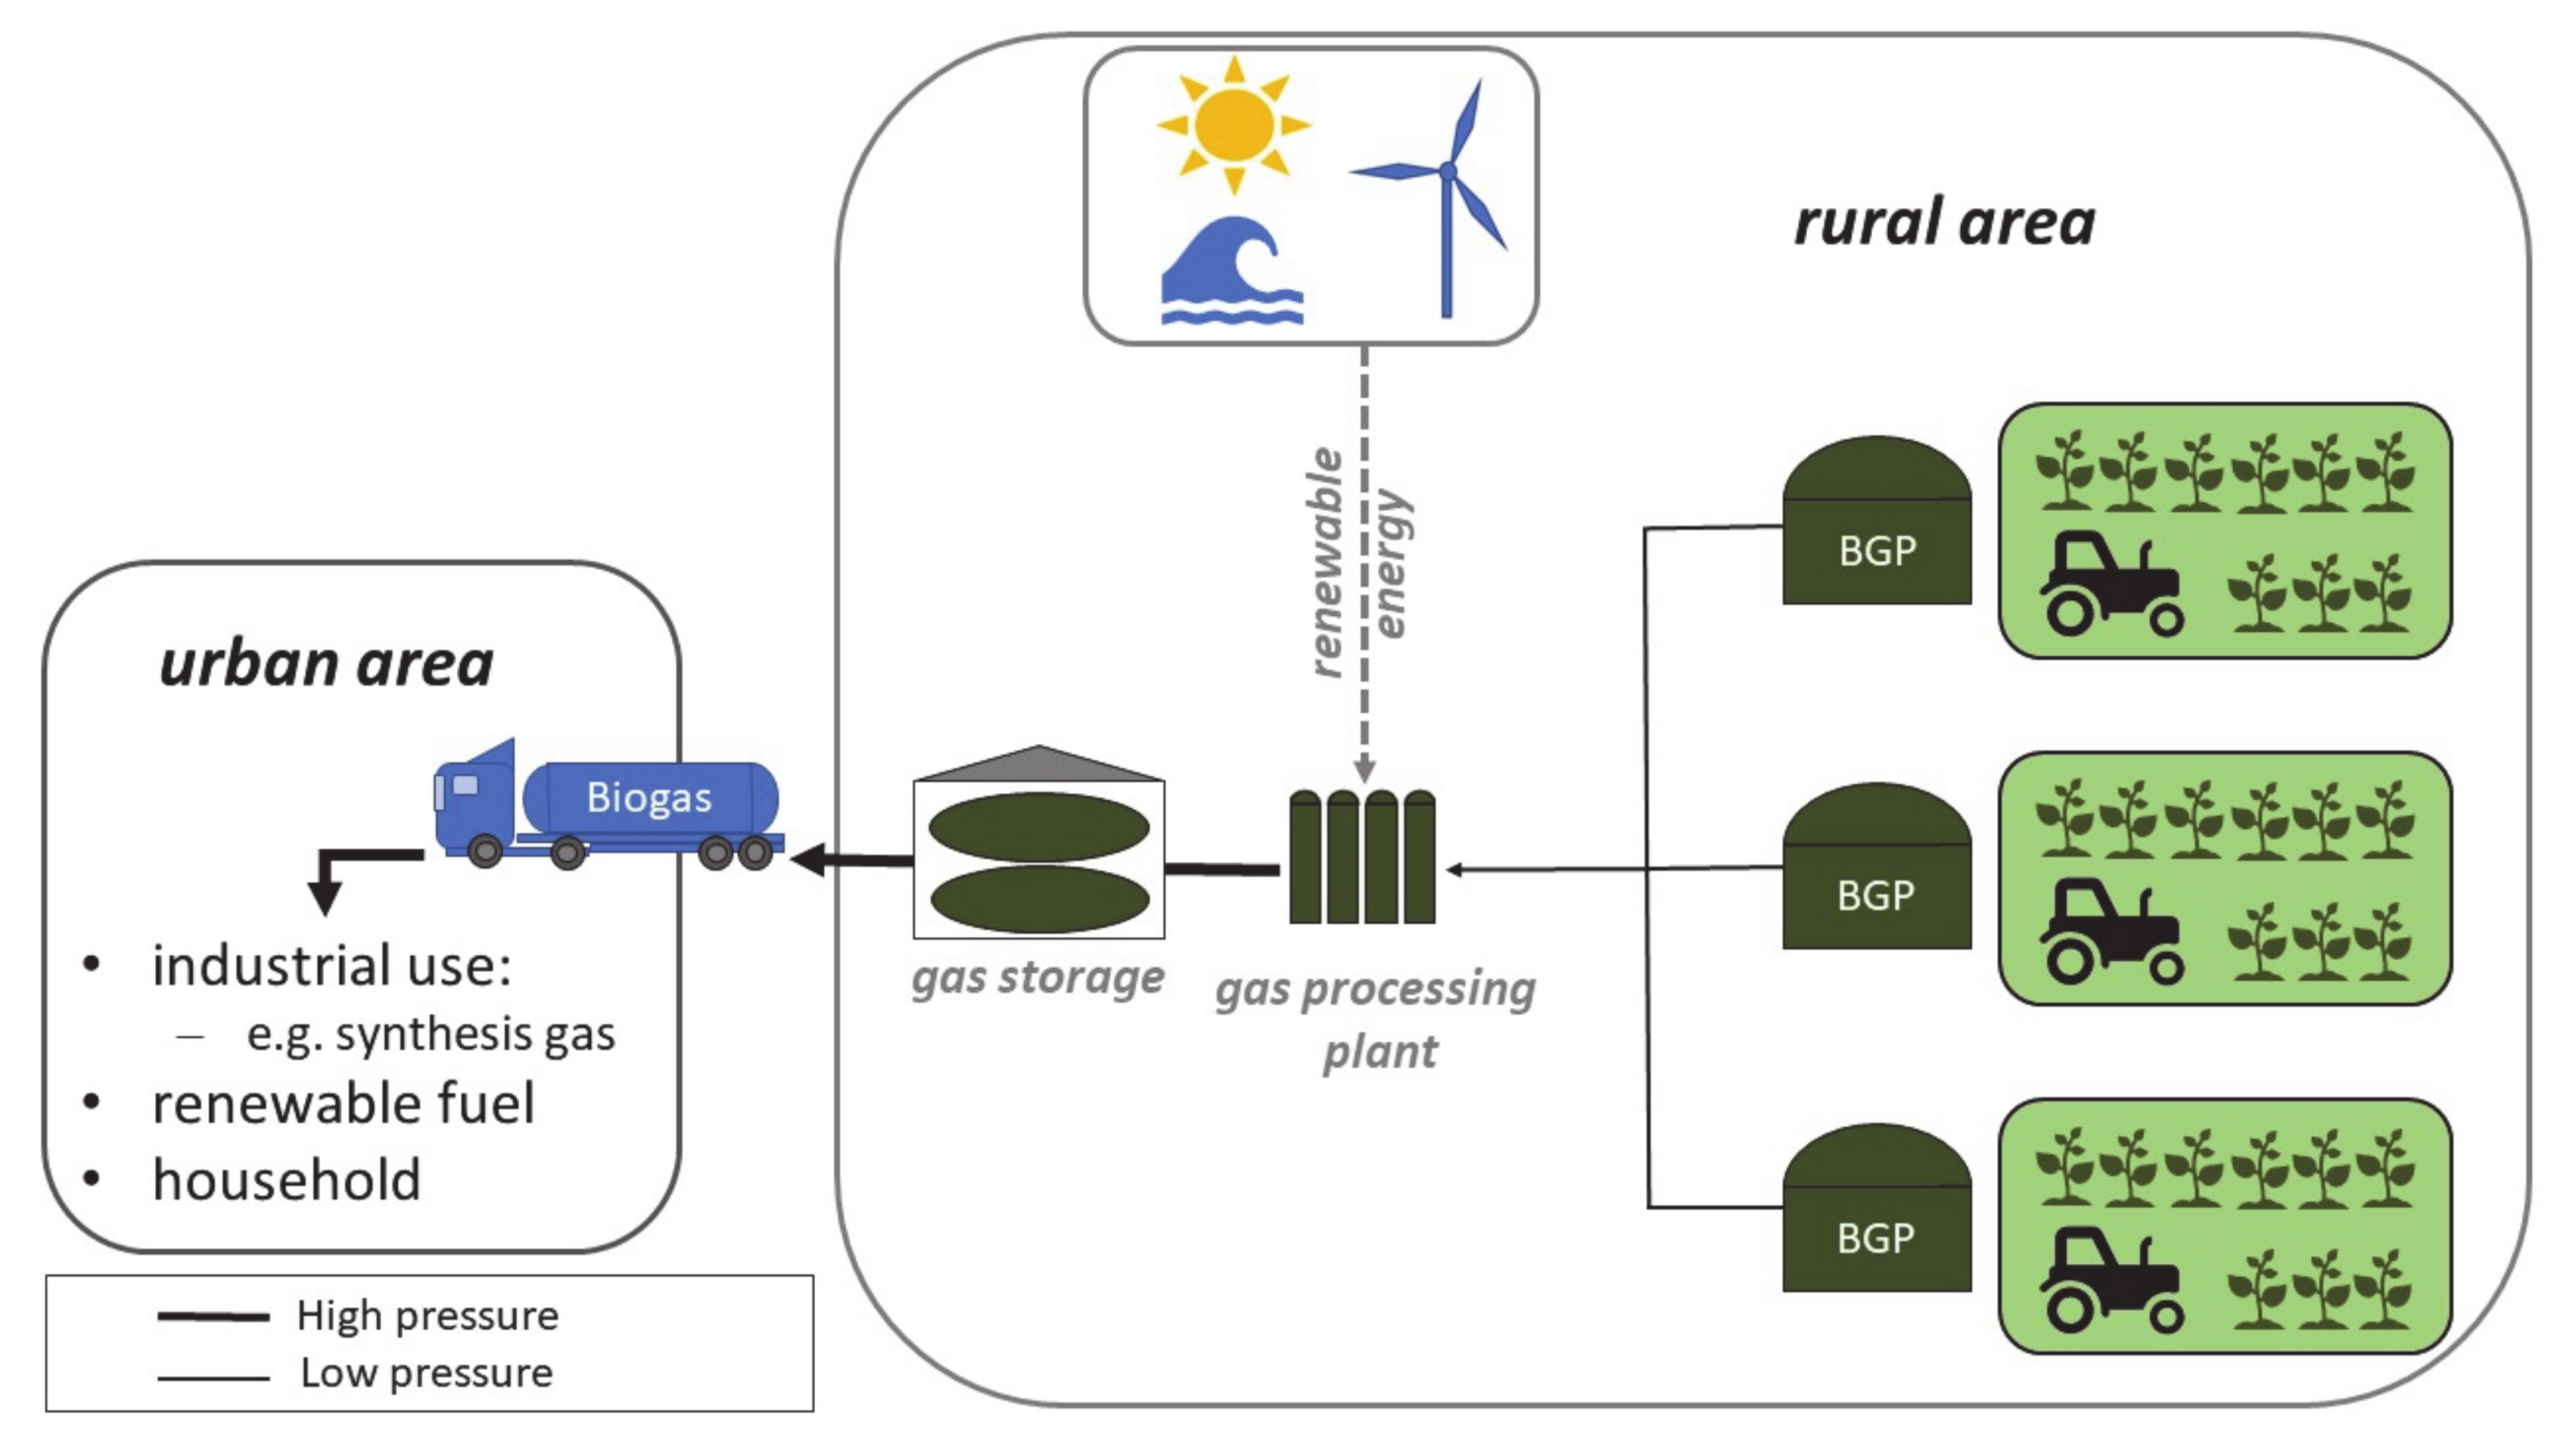
With “Farm2CBG,” the authors propose a possible concept for biogas distribution, as shown in Figure 6.
Since the investment costs for upgrading to biogas production decrease with the increasing size of the biogas plant, the economic efficiency, especially for small to medium-sized biogas plants, can be improved through a joint biogas processing plant [57]. In the Farm2CBG concept, each farm supplies the biomass for a single biogas plant. Therefore, the energy cane is ensiled and stored at the farms close to the biogas plant. The remaining digestate can be used as a fertilizer for energy cane cultivation. This creates a material cycle in agriculture. After desulfurization and dehumidification, the biogas is quantified and injected into a low-pressure pipeline, that connects surrounding biogas plants with the gas processing plant. Thus, the substrate transport distances can be kept low. At the central plant, the biogas can then be purified to achieve higher methane concentrations and compressed using renewable energy sources. The processed gas is then filled into a central gas storage and transported by pipelines or tank trucks as CBG to distributors and customers. Due to the centralization of gas processing, small biogas plants or a waste digester may be integrated. Participating farmers, as suppliers, are paid according to the amount of biogas injected into the system. The concept presents an opportunity for biogas production in rural areas, and consumption in urban areas.
To realize the concept, several factors must be considered, such as the economic efficiency of the concept, the burden of investment costs, and biogas plant design. For example, farms with an area of 1000 ha or more represent the largest share (60%) of total sugar cane production in Brazil [58]. Using the substrate of 1000 ha for a single biogas plant would result in a very large biogas plant (4.9 MWel). By comparison, in Germany, 500 kWel biogas plants with combined heat and power units are the standard. If such a scale were adapted to energy cane feeding on the basis of the parameters in Table 6, an approximately 100 ha cultivation area and a fermenter with a capacity of 3300 m3 would be required (producing 1.35 MWh on the basis of the lower heating value of methane).
For example, a single biogas plant for a 1000 ha farm would be over 30,000 m3 in size.
To simplify the construction of biogas plants, several smaller plants could be built. The construction of biogas plants adjacent to farms would reduce the transport distances. Assuming a square outline of a 1000 ha farm, an edge length of 3.33 km can also be assumed. Even in the worst-case scenario (positioning the biogas plants at the corners of the farm), the maximum transport distance would be 6.66 km (73–83% less than the average in ethanol production). The farm design is highly dependent on local circumstances, and thus, the given assumptions must be checked on a case-by-case basis. Furthermore, the biogas and ethanol production from energy cane should be compared based on life cycle assessments after validation of the given results in the field. In addition, to produce biogas from energy cane, technical applications must be adapted to the new substrate; for instance, sand separators can be implemented to avoid the washing step (which would result in a loss of substrate and thus energy), and special mixers can be used to avoid floating layers. Future upgrades notwithstanding, the present results give an impressive first overview of the potential for biogas technology in Brazil.

5. Conclusions

Biogas can be produced from energy cane with sufficient specific biogas yields (approximately 400 to 600 lN/kgVS). Furthermore, ensiling can conserve the substrate for up to six months with acceptable silage losses. The high calculated energy yields per hectare must still be proven in the field, but they are indicative of the promise of biogas production.
If introduced into the Brazilian market, biogas production from energy cane can be a promising energy solution that complements first- and second-generation ethanol production. Since second-generation ethanol production is a highly sophisticated process that is still under development, biogas production might be more accessible, practically and economically. For the successful industrial implementation of biogas production from energy cane, ensiling and preprocessing (e.g., cane shredding) must be scaled up. The Farm2CBG concept represents a first impression of how biogas processes based on energy cane can be established. Centralized gas purification could reduce the costs for single farmers, and thus, small farm communities could also supply biogas by sharing investment costs.
Finally, in addition to technical and economic considerations, political incentivization will also be necessary to establish the biogas technology in Brazil. For example, the European regenerative energy directive has proven to be an effective instrument for reducing carbon dioxide emissions, which has also led to an expansion of the biogas sector [21,59]. If implemented consistently, the RenovaBio program may also foster the expansion of the biogas sector in Brazil [2].

Author Contributions

Conceptualization: J.W.Z., W.A.d.F.-Z., A.L., K.H., S.K.; investigation: M.D.D., G.D.P., S.P., K.H.; project administration: I.K., S.K.; resources: J.W.Z., W.A.d.F.-Z., A.L.; supervision: I.K; visualization: M.D.D., G.D.P., S.P., K.H.; writing—original draft: K.H., G.D.P.; writing—review and editing: G.D.P., M.D.D., S.P., K.H., J.W.Z., W.A.d.F.-Z., A.L., S.K., I.K. All authors have read and agreed to the published version of the manuscript.

Funding

This research was funded by the German Federal Ministry of Education and Research (grant number 031B0172A).

Acknowledgments

The authors would like to thank Markus Dahmen, Isabelle Grudda, Daniel Gierens, Kristina Braun, Michelle Reutemann, Alex James, Julien Tilly, and Sebastian Decker for supporting the execution of the experiments.

Conflicts of Interest

The authors declare no conflict of interest.

References

  1. Kohlhepp, G. Análise da situação da produção de etanol e biodiesel no Brasil. Estud. Av. 2010, 24, 223–253. [Google Scholar] [CrossRef]
  2. Salina, F.H.; de Almeida, I.A.; Bittencourt, F. R Chapter 30 RenovaBio Opportunities and Biofuels Outlook in Brazil. In Renewable Energy and Sustainable Buildings: Selected Papers from the World Renewable Energy Congress WREC 2018; Innovative Renewable Energy; Sayigh, A., Ed.; Springer International Publishing: Cham, Switzerland, 2020; ISBN 978-3-030-18487-2. [Google Scholar]
  3. Grassi, M.C.B.; Pereira, G.A.G. Energy-cane and RenovaBio: Brazilian vectors to boost the development of Biofuels. Ind. Crop. Prod. 2019, 129, 201–205. [Google Scholar] [CrossRef]
  4. Barros, S.; Flake, O. Brazil -Biofuels Annual 2019; USDA Foreign Agricultural Service: Washington, DC, USA, 2019; pp. 1–29. [Google Scholar]
  5. FAOSTAT. Available online: http://www.fao.org/faostat/en/ (accessed on 29 November 2019).
  6. Companhia Nacional de Abastecimento (CONAB). Acompanhamento da Safra Brasileira de Cana-de-açúcar V.6 - SAFRA 2019/20 - N.3. 2019, Volume 6, 53.
  7. RPA Consultoria. RPA News: Em 2019, 23% das Usinas Brasileiras de Cana-de-açúcar Estarão Paradas, NovaCana.com. 2019. Available online: https://www.novacana.com/n/industria/usinas/2019-23-usinas-cana-de-acucar-brasileiras-paradas-050419 (accessed on 28 April 2020).
  8. Leal, M.R.L.V.; Walter, A.S.; Seabra, J.E.A. Sugarcane as an energy source. Biomass Convers. Biorefin. 2013, 3, 17–26. [Google Scholar] [CrossRef]
  9. De Souza, Z.J. Bioelectricity of sugarcane: A case study from Brazil and perspectives. In Sugarcane Biorefinery, Technology and Perspectives; Elsevier: Amsterdam, The Netherlands, 2020; pp. 255–279. ISBN 978-0-12-814236-3. [Google Scholar]
  10. Martinelli, L.A.; Filoso, S. Expansion of sugarcane ethanol production in Brazil: Environmental and social challenges. Ecol. Appl. 2008, 18, 885–898. [Google Scholar] [CrossRef] [Green Version]
  11. Seyffarth, A.R. The impact of rising ethanol production on the Brazilian market for basic food commodities: An econometric assessment. Env. Resour. Econ. 2016, 64, 511–536. [Google Scholar] [CrossRef]
  12. Steinbuks, J.; Hertel, T.W. Confronting the Food–Energy–Environment Trilemma: Global Land Use in the Long Run. Environ. Resour. Econ. 2016, 63, 545–570. [Google Scholar] [CrossRef] [Green Version]
  13. Dos Santos, I.F.S.; Vieira, N.D.B.; de Nóbrega, L.G.B.; Barros, R.M.; Filho, G.L.T. Assessment of potential biogas production from multiple organic wastes in Brazil: Impact on energy generation, use, and emissions abatement. Resour. Conserv. Recycl. 2018, 131, 54–63. [Google Scholar] [CrossRef]
  14. Zabed, H.M.; Akter, S.; Yun, J.; Zhang, G.; Zhang, Y.; Qi, X. Biogas from microalgae: Technologies, challenges and opportunities. Renew. Sustain. Energy Rev. 2020, 117, 109503. [Google Scholar] [CrossRef]
  15. Carvalho-Netto, O.V.; Bressiani, J.A.; Soriano, H.L.; Fiori, C.S.; Santos, J.M.; Barbosa, G.V.; Xavier, M.A.; Landell, M.G.; Pereira, G.A. The potential of the energy cane as the main biomass crop for the cellulosic industry. Chem. Biol. Technol. Agric. 2014, 1. [Google Scholar] [CrossRef] [Green Version]
  16. Lu, W.; Alam, M.A.; Liu, S.; Xu, J.; Saldivar, R.P. Critical processes and variables in microalgae biomass production coupled with bioremediation of nutrients and CO2 from livestock farms: A review. Sci. Total Environ. 2020, 716, 135247. [Google Scholar] [CrossRef] [PubMed]
  17. Matsuoka, S.; Kennedy, A.J.; dos Santos, E.G.D.; Tomazela, A.L.; Rubio, L.C.S. Energy cane: Its concept, development, characteristics, and prospects. Adv. Bot. 2014, 2014, 1–13. [Google Scholar] [CrossRef] [Green Version]
  18. Dos Santos, L.V.; de Barros Grassi, M.C.; Gallardo, J.C.M.; Pirolla, R.A.S.; Calderón, L.L.; de Carvalho-Netto, O.V.; Parreiras, L.S.; Camargo, E.L.O.; Drezza, A.L.; Missawa, S.K.; et al. Second-generation ethanol: The need is becoming a reality. Ind. Biotechnol. 2016, 12, 40–57. [Google Scholar] [CrossRef]
  19. Almeida, S.; Zang, J.W.; Da Fonseca-Zang, W.A.; Freitas, R.A.; Lima, W.S.; Rubio, L.C. Estudo cinético da produção de biometano de cana-de-açúcar e cana-energia. Anais do V Simpósio Internacional Sobre Gerenciamento de Resíduos Agropecuários e Agroindustiais 2017, 5, 280–283. [Google Scholar]
  20. Freitas, F.F.; De Souza, S.S.; Ferreira, L.R.A.; Otto, R.B.; Alessio, F.J.; De Souza, S.N.M.; Venturini, O.J.; Junior, O.H.A. The Brazilian market of distributed biogas generation: Overview, technological development and case study. Renew. Sustain. Energy Rev. 2019, 101, 146–157. [Google Scholar] [CrossRef]
  21. Fachagentur Nachwachsende Rohstoffe e.V. (FNR); Deutsches BiomasseForschungsZentrum (DBFZ); Kuratorium für Technik und Bauwesen in der Landwirtschaft; Institut für Agrartechnologie und Biosystemtechnik (KTBL) (Eds.) Guide to Biogas; Bioenergie: Rostock, Germany, 2010; Volume 5. [Google Scholar]
  22. Biogas Market data in Germany 2018/2019. Available online: https://www.biogas.org/edcom/webfvb.nsf/id/EN-German-biogas-market-data/$file/19-07-12_Biogasindustryfigures-2018-2019_english.002.pdf (accessed on 3 December 2019).
  23. Fachagentur Nachwachsende Rohstoffe e.V. (FNR) (Ed.) Basisdaten Bioenergie Deutschland 2019 [Brochure], 17th ed.; Basisdaten Bioenergie: Rostock, Germany, 2019. [Google Scholar]
  24. Janke, L.; Leite, A.; Nikolausz, M.; Schmidt, T.; Liebetrau, J.; Nelles, M.; Stinner, W. Biogas production from sugarcane waste: Assessment on kinetic challenges for process designing. Int. J. Mol. Sci. 2015, 16, 20685–20703. [Google Scholar] [CrossRef] [Green Version]
  25. Rabelo, S.C.; Carrere, H.; Filho, R.M.; Costa, A.C. Production of bioethanol, methane and heat from sugarcane bagasse in a biorefinery concept. Bioresour. Technol. 2011, 102, 7887–7895. [Google Scholar] [CrossRef] [Green Version]
  26. Moraes, B.S.; Junqueira, T.L.; Pavanello, L.G.; Cavalett, O.; Mantelatto, P.E.; Bonomi, A.; Zaiat, M. Anaerobic digestion of vinasse from sugarcane biorefineries in Brazil from energy, environmental, and economic perspectives: Profit or expense? Appl. Energy 2014, 113, 825–835. [Google Scholar] [CrossRef]
  27. Janke, L.; Weinrich, S.; Leite, A.F.; Schüch, A.; Nikolausz, M.; Nelles, M.; Stinner, W. Optimization of semi-continuous anaerobic digestion of sugarcane straw co-digested with filter cake: Effects of macronutrients supplementation on conversion kinetics. Bioresour. Technol. 2017, 245, 35–43. [Google Scholar] [CrossRef]
  28. Lienen, T.; Kleyböcker, A.; Brehmer, M.; Kraume, M.; Moeller, L.; Görsch, K.; Würdemann, H. Floating layer formation, foaming, and microbial community structure change in full-scale biogas plant due to disruption of mixing and substrate overloading. Energy Sustain. Soc. 2013, 3, 20. [Google Scholar] [CrossRef] [Green Version]
  29. Kim, M.; Day, D.F. Composition of sugar cane, energy cane, and sweet sorghum suitable for ethanol production at Louisiana sugar mills. J. Ind. Microbiol. Biotechnol. 2011, 38, 803–807. [Google Scholar] [CrossRef]
  30. Mulat, D.G.; Dibdiakova, J.; Horn, S.J. Microbial biogas production from hydrolysis lignin: Insight into lignin structural changes. Biotechnol. Biofuels 2018, 11. [Google Scholar] [CrossRef] [Green Version]
  31. Bernardes, T.F.; Siqueira, G.R.; Schocken-Iturrino, R.P.; Roth, A.P.T.P.; Reis, R.A. Synergism of chemical and microbial additives on sugarcane (Saccharum officinarum) silage fermenation. In Silage Production and Utilisation; Wageningen Academic Publishers: Wageningen, The Netherlands, 2005; p. 202. [Google Scholar]
  32. Siqueira, G.R.; Reis, R.A.; Schocken-Iturrino, R.P.; Bernardes, T.F.; Pires, A.J.V.; Roth, M.T.P.; Roth, A.P.T.P. Associação entre aditivos químicos e bacterianos na ensilagem de cana-de-açúcar. R. Bras. Zootec. 2007, 36, 789–798. [Google Scholar] [CrossRef] [Green Version]
  33. Kreuger, E.; Nges, I.; Björnsson, L. Ensiling of crops for biogas production: Effects on methane yield and total solids determination. Biotechnol. Biofuels 2011, 4, 44. [Google Scholar] [CrossRef] [Green Version]
  34. Baserga, U. Landwirtschaftliche Co.Vergärungs-Biogasanlagen. Fat-Berichte 1998, 512, 1–11. [Google Scholar]
  35. DIN 38414-8 (1985-06-00), German standard methods for the examination of water, waste water and sludge; sludge and sediments (group S); determination of the amenability to anaerobic digestion (S 8); German Institute for Standardisation (Deutsches Institut für Normung): Berlin, Germany, 1985.
  36. Paulsen, S.; Hoffstadt, K.; Krafft, S.; Leite, A.; Zang, J.; Fonseca-Zang, W.; Kuperjans, I. Continuous biogas production from sugarcane as sole substrate. Energy Rep. 2020, 6, 153–158. [Google Scholar] [CrossRef]
  37. Muck, R.E.; Nadeau, E.M.G.; McAllister, T.A.; Contreras-Govea, F.E.; Santos, M.C.; Kung, L. Silage review: Recent advances and future uses of silage additives. J. Dairy Sci. 2018, 101, 3980–4000. [Google Scholar] [CrossRef] [PubMed]
  38. Herrmann, C.; Idler, C.; Heiermann, M. Improving aerobic stability and biogas production of maize silage using silage additives. Bioresour. Technol. 2015, 197, 393–403. [Google Scholar] [CrossRef] [Green Version]
  39. Hülsemann, B.; Zhou, L.; Merkle, W.; Hassa, J.; Müller, J.; Oechsner, H. Biomethane potential test: Influence of inoculum and the digestion system. Appl. Sci. 2020, 10, 2589. [Google Scholar] [CrossRef] [Green Version]
  40. Kleinheinz, G.; Hernandez, J. Comparison of two laboratory methods for the determination of biomethane potential of organic feedstocks. J. Microbiol. Methods 2016, 130, 54–60. [Google Scholar] [CrossRef]
  41. Janke, L.; McCabe, B.K.; Harris, P.; Hill, A.; Lee, S.; Weinrich, S.; Marchuk, S.; Baillie, C. Ensiling fermentation reveals pre-treatment effects for anaerobic digestion of sugarcane biomass: An assessment of ensiling additives on methane potential. Bioresour. Technol. 2019, 279, 398–403. [Google Scholar] [CrossRef] [PubMed]
  42. Neumann, M.; Oliboni, R.; Oliveira, M.R.; Faria, M.V.; Ueno, R.K.; Reinerh, L.L.; Durman, T. Chemicals additive used in silages. Appl. Res. Agrotechnol. 2010, 3, 187–195. [Google Scholar]
  43. Ma, H.; Yang, J.; Jia, Y.; Wang, Q.; Tashiro, Y.; Sonomoto, K. Stillage reflux in food waste ethanol fermentation and its by-product accumulation. Bioresour. Technol. 2016, 209, 254–258. [Google Scholar] [CrossRef]
  44. Boddey, R.M.; Soares, L.H.B.; Alves, B.J.R.; Urquiaga, S. Bio-ethanol production in Brazil. In Biofuels, Solar and Wind as Renewable Energy Systems; Pimentel, D., Ed.; Springer: Dordrecht, The Netherlands, 2008; pp. 321–356. ISBN 978-1-4020-8653-3. [Google Scholar]
  45. Brauer-Siebrecht, W.; Jacobs, A.; Christen, O.; Götze, P.; Koch, H.-J.; Rücknagel, J.; Märländer, B. Silage maize and sugar beet for biogas production in rotations and continuous cultivation: Dry matter and estimated methane yield. Agronomy 2016, 6, 2. [Google Scholar] [CrossRef] [Green Version]
  46. Krzystek, L.; Wajszczuk, K.; Pazera, A.; Matyka, M.; Slezak, R.; Ledakowicz, S. The influence of plant cultivation conditions on biogas production: Energy efficiency. Waste Biomass Valor. 2020, 11, 513–523. [Google Scholar] [CrossRef] [Green Version]
  47. Victorin, M.; Davidsson, Å.; Wallberg, O. Characterization of mechanically pretreated wheat straw for biogas production. Bioenergy Res. 2020. [Google Scholar] [CrossRef] [Green Version]
  48. Kiesel, A.; Lewandowski, I. Miscanthus as biogas substrate–Cutting tolerance and potential for anaerobic digestion. Gcb Bioenergy 2017, 9, 153–167. [Google Scholar] [CrossRef]
  49. Katukuri, N.R.; Fu, S.; He, S.; Xu, X.; Yuan, X.; Yang, Z.; Guo, R.-B. Enhanced methane production of Miscanthus floridulus by hydrogen peroxide pretreatment. Fuel 2017, 199, 562–566. [Google Scholar] [CrossRef]
  50. Rath, J.; Heuwinkel, H.; Herrmann, A. Specific biogas yield of maize can be predicted by the interaction of four biochemical constituents. Bioenerg. Res. 2013, 6, 939–952. [Google Scholar] [CrossRef]
  51. Peters, D.; Becker, A.; Kemnitz, D. Anbau und Verwendung Nachwachsender Rohstoffe in Deutschland; Erhebung, Aufbereitung und Analyse statistischer Daten zum Anbau und zur Verarbeitung nachwachsender Rohstoffe und Energiepflanzen in Deutschland sowie Weiterentwicklung von Methoden hierzu (NRstat); Fachagentur Nachwachsende Rohstoffe e.V.: Gulzov, Germany, 2019. [Google Scholar]
  52. Daniel, J.L.P.; Bernardes, T.F.; Jobim, C.C.; Schmidt, P.; Nussio, L.G. Production and utilization of silages in tropical areas with focus on Brazil. Grass Forage Sci. 2019, 74, 188–200. [Google Scholar] [CrossRef]
  53. De Castro, R.E.N.; de Brito Alves, R.M.; do Nascimento, C.A.O.; Giudici, R. Assessment of sugarcane-based ethanol production. In Fuel Ethanol Production from Sugarcane; Peixoto Basso, T., Carlos Basso, L., Eds.; IntechOpen: London, UK, 2019; ISBN 978-1-78984-937-0. [Google Scholar]
  54. Rocha, M.H.; Capaz, R.S.; Lora, E.E.S.; Nogueira, L.A.H.; Leme, M.M.V.; Renó, M.L.G.; del Olmo, O.A. Life cycle assessment (LCA) for biofuels in Brazilian conditions: A meta-analysis. Renew. Sustain. Energy Rev. 2014, 37, 435–459. [Google Scholar] [CrossRef]
  55. Delgado, O.; Muncrief, R. Assessment of Heavy-Duty Natural Gas Vehicle Emissions: Implications and Policy Recommendations; International council on clean transportation: Washington, DC, USA, 2015; p. 42. [Google Scholar]
  56. Zang, J.W.; Martins, K.F.; Fonseca-Zang., W.A.D. Life Cycle inventory for biomethane as a diesel substitute for the Brazilian ethanol industry–Case study. Energy Procedia 2018, 153, 444–449. [Google Scholar] [CrossRef]
  57. Urban, W. Biomethane injection into natural gas networks. In The Biogas Handbook; Elsevier: Amsterdam, The Netherlands, 2013; pp. 378–403. ISBN 978-0-85709-498-8. [Google Scholar]
  58. Ferreira Filho, J.B.d.S.; Vian, C.E.d.F. The evolving role of large and medium farms on Brazilian agriculture. Agric. Econ. 2016, 47, 215–225. [Google Scholar] [CrossRef]
  59. Chiaramonti, D.; Goumas, T. Impacts on industrial-scale market deployment of advanced biofuels and recycled carbon fuels from the EU Renewable Energy Directive II. Appl. Energy 2019, 251, 113351. [Google Scholar] [CrossRef]
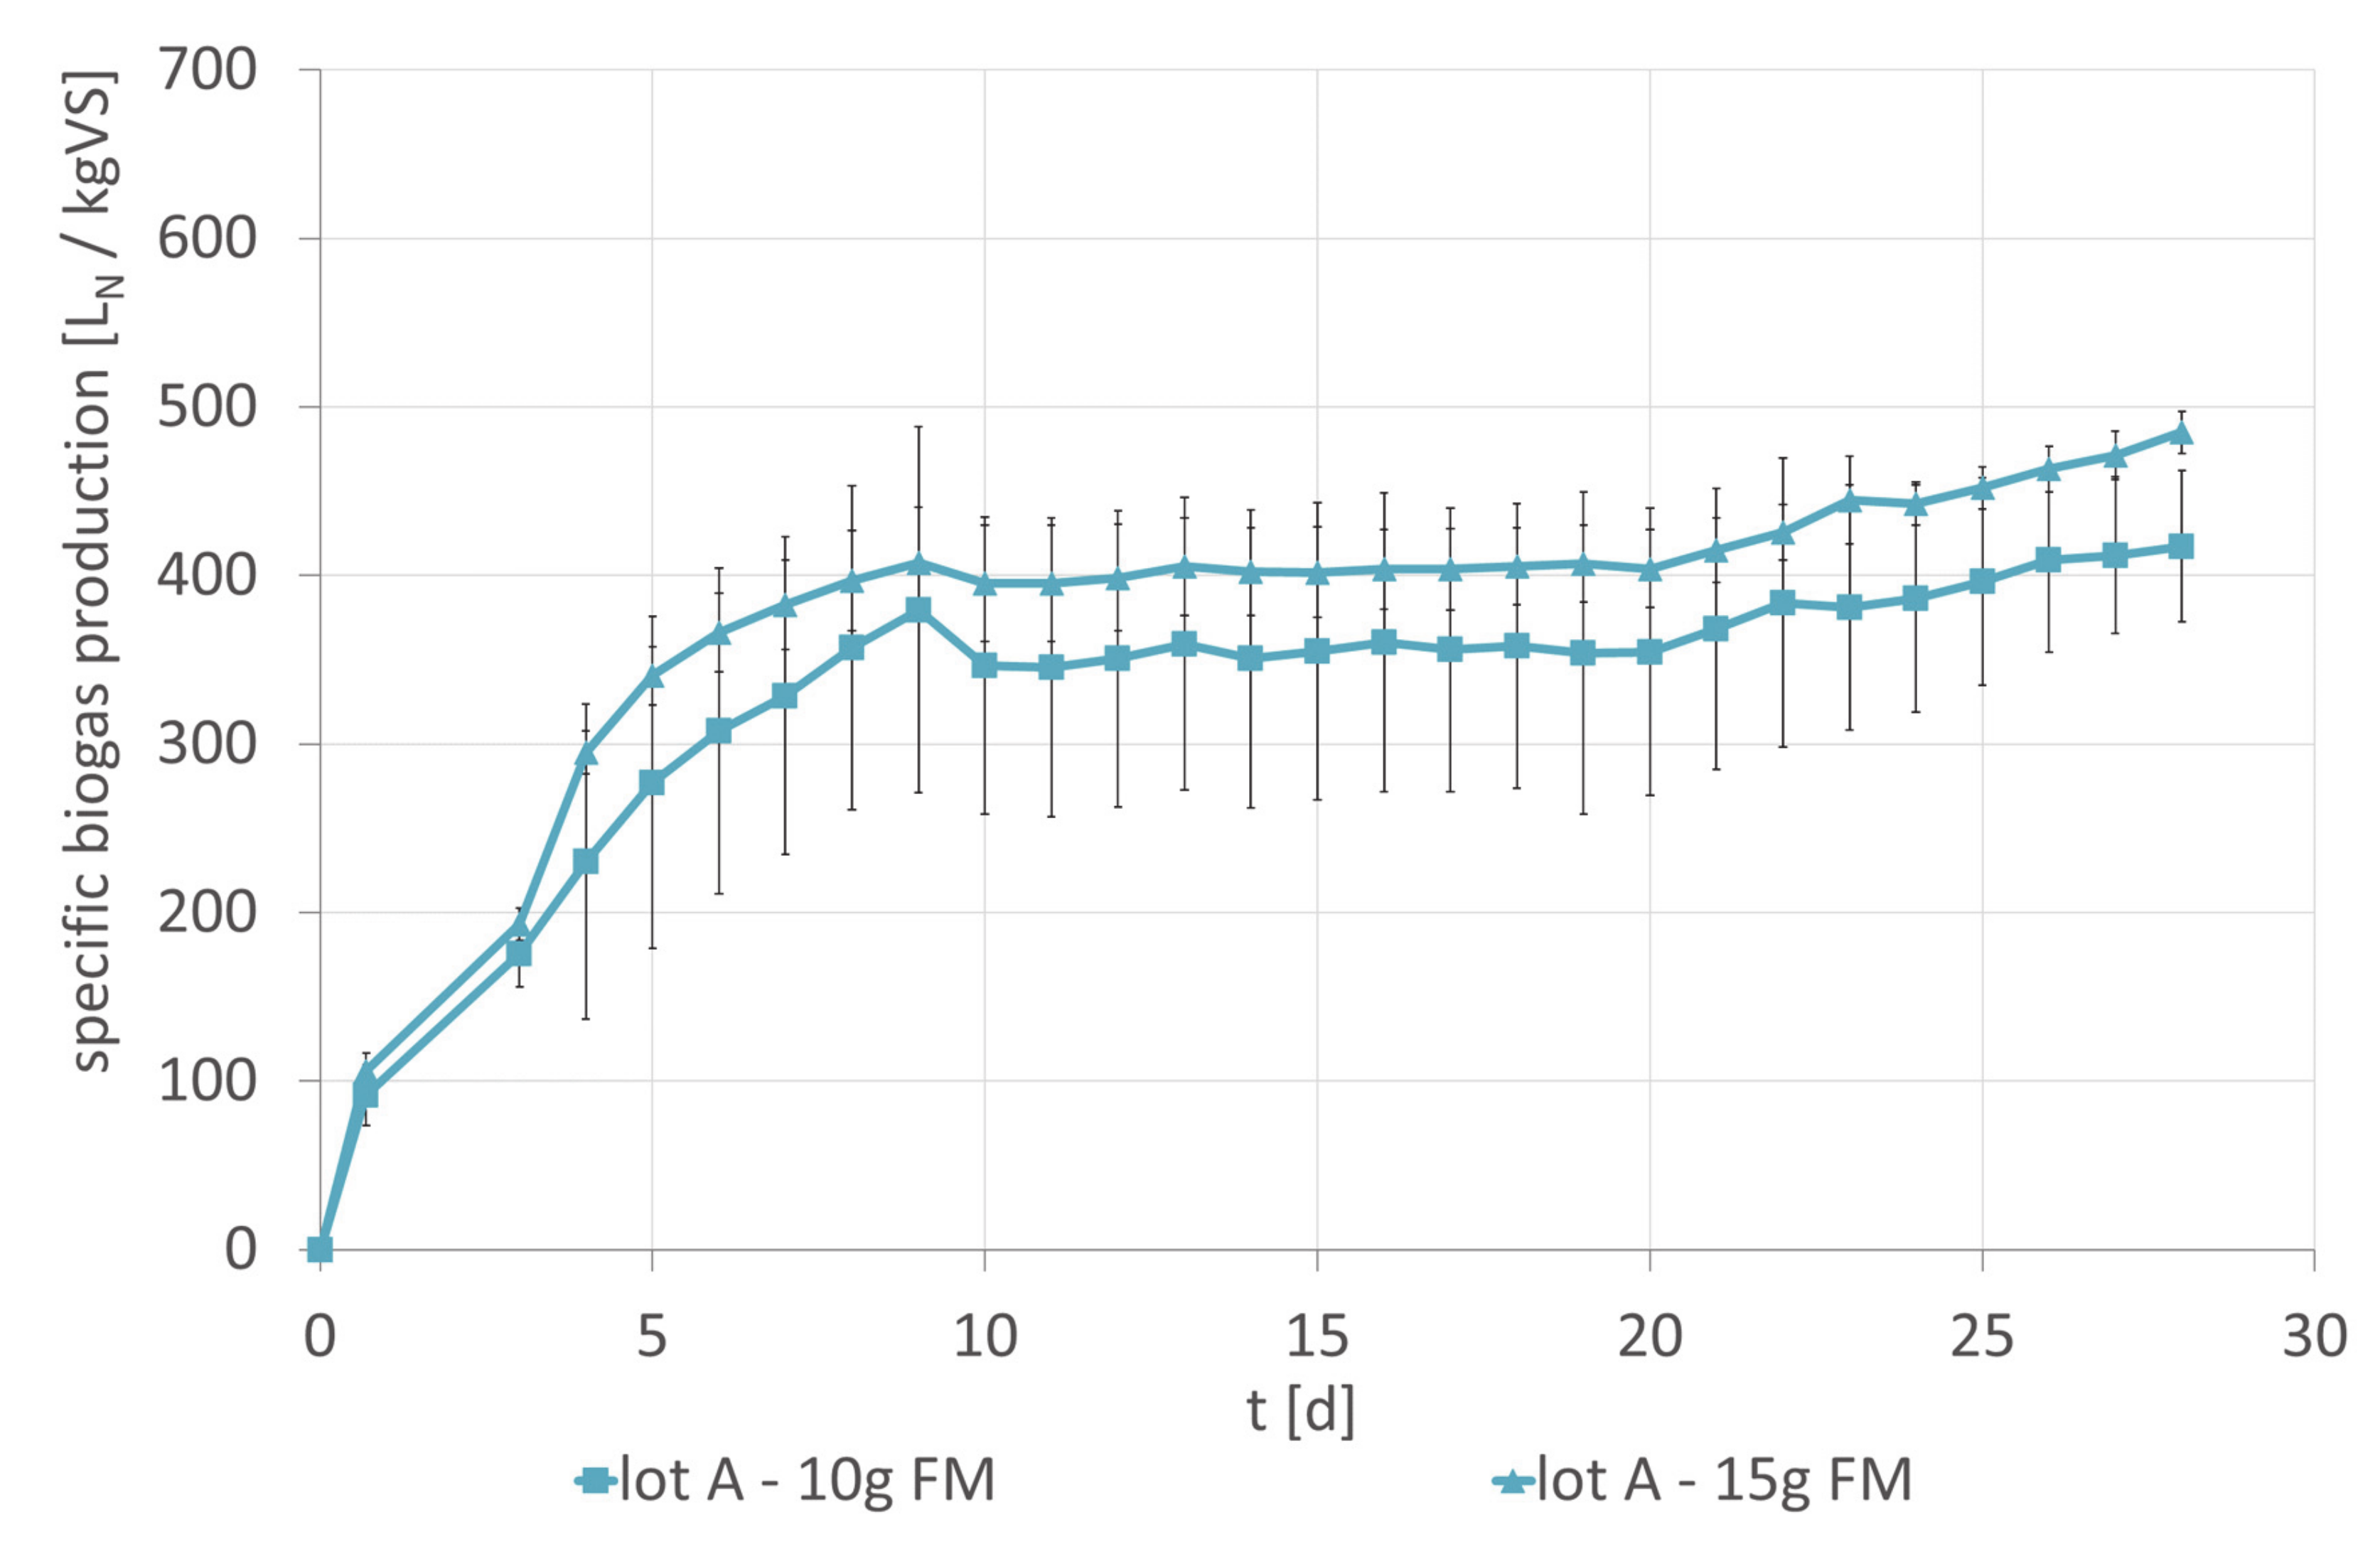
Figure 1. Specific biogas production of ensiled energy cane lot A 10 gFM (result: 417 LN/kgVS) and lot A 15 gFM (result: 485 LN/kgVS).
Agronomy 10 00821 g001
Figure 2. Specific biogas production of ensiled energy cane tightly and loose packed, with and without the addition of NaOH, and non-ensiled energy cane (EC) of lot B.
Agronomy 10 00821 g002
Figure 3. Specific daily biogas production, VOA/TIC, total phosphorous, total nitrogen, ammonium, and organic loading rate of the continuous biogas process (40 °C; pH 7.0–8.0, lot B). The days of macronutrient and trace element supplementation are marked.
Agronomy 10 00821 g003
Figure 4. Acetic, propionic, and isovaleric acid concentrations and biogas composition of the continuous biogas process (40 °C; pH 7.0–8.0, lot B). The days of macronutrient and trace element supplementation are marked.
Agronomy 10 00821 g004
Figure 5. Production schemes of compressed biogas (CBG) from biogas plants (BGP) and first- and second-generation ethanol (EtOH).
Agronomy 10 00821 g005
Figure 6. Farm2CBG: A possible concept for biogas distribution via pipelines or as compressed biogas (CBG) from rural biogas plants (BGP) to urban areas in Brazil.
Agronomy 10 00821 g006
Table 1. Batch tests: volumetric organic load, initial substrate weight, and amount of the inoculum.
Energy Cane LotVolumetric Organic Load (gVS/L)Energy Cane (g)Inoculum (g)
A7.110240
A10.615235
B10.5–12.58200
Table 2. Crop yield data based on dos Santos et al. and Kim and Day [18,29].
SubstrateFresh Matter (FM) Yield (tFM/ha)Dry Matter (DM) Yield (tDM/ha)VS Yield (tVS/ha)Source
Sugar cane9227.5926.4 2dos Santos et al. [18]
Sugar cane709 18.4 1,2Kim and Day [29]
Energy cane18068.4 67.0 2dos Santos et al. [18]
Energy cane10046.445.6 2Kim and Day [29]
1 excluding sugar 2 volatile solids (VS) were calculated/estimated assuming 0.8%FM ash content
Table 3. Composition of non-ensiled energy cane FM of lot B.
ParameterValueParameterValue
C/N ratio107DM (%)29.2
Nitrogen (%)0.15Ash content (%)0.8
Carbon (%)16.5Crude protein (%)1
1 ADFVS (%)15Crude fiber (%)12.9
2 ADL (%)2.2Crude fat (%)0.6
3 aNDFVS (%)22.5
1 acid detergent fiber 2 acid detergent lignin 3amylase-treated neutral detergent fiber.
Table 4. Average process parameters of the periods: days 544–561, days 562–573, and days 574–593 (40 °C; pH 7.0–8.0; fed with energy cane (lot B)).
PeriodCH4 (%)CO2 (%)Specific Biogas Production (m3N/kgVS)Organic Loading Rate (gVS/(L × d))VOA/TICNtotal (g/L)Ptotal (g/L)NH4+ (g/L)
Days 544–56152290.351.050.410.720.140.24
Days 562–57355240.431.400.420.950.140.21
Days 574–59355290.441.510.240.920.130.37
Table 5. Theoretical energy cane-based methane yield, first- and second-generation ethanol yields, area-related energy yields from biogas, and total ethanol production.
SubstrateMethane Yield min/mean (m3N/ha)1st gen. Ethanol Yield (L/ha)2nd gen. Ethanol Yield (L/ha)Total Ethanol Yield (L/ha)Biogas Energy Yield min/mean (MWh/ha)Ethanol Energy Yield (MWh/ha)
Energy cane 113,392 3/16,204 4428214,25618,538134 3/162 4109
Energy cane 29120 3/11,035 4340012,99116,39191 3/110 496
Sugar cane 15371 3/6499 46525378210,307(54 3/65 4)60
Sugar cane 21688 3/2042 4-45724572(17 3/20 4)27
1 Crop yield and composition data based on dos Santos et al.2 Crop yield and composition data based on Kim and Day.3 Calculated based on the minimum biogas yield of energy cane with 400 LN/kgVS and 50% methane content.4 Calculated based on the mean biogas yield of energy cane with 475 LN/kgVS and 51% methane content.
Table 6. Parameters of a 500 kWel biogas plant fed with energy cane based on the results of this work.
ParameterValueParameterValue
Operating time (d)334Operating time (h/a)8016
Area related energy cane yield (tVS/ha)67Silage losses (%)20
Organic loading rate (1.5 kgVS/(m3 × d))1.5Methane yield (m3/tVS)200
ηel (%)37