Article

Soil Water and Nitrogen Fluxes in Response to Climate Change in a Wheat–Maize Double Cropping System

1
Institute of Environment and Sustainable Development in Agriculture, Chinese Academy of Agricultural Sciences, Beijing 100081, China
2
College of Resources and Environmental Sciences, China Agricultural University, Beijing 100193, China
3
College of Agricultural Science and Engineering, Hohai University, Nanjing 210098, China
4
School of Advanced Agricultural Sciences, Peking University, Beijing 100871, China
*
Authors to whom correspondence should be addressed.
Agronomy 2020, 10(6), 786; https://doi.org/10.3390/agronomy10060786
Submission received: 30 March 2020 / Revised: 26 May 2020 / Accepted: 27 May 2020 / Published: 1 June 2020

Abstract

:
The impact of soil nutrient depletion on crop production is a thoroughly researched issue; however, robust assessments on the impact of climate change on water and N fluxes in agroecosystem are lacking. The complexity of soil water and N fluxes in response to climate change under agroecosystems makes simulation-based approaches to this issue appealing. This study evaluated the responses of crop yield, soil water, and N fluxes of a wheat–maize rotation to two Representative Concentration Pathways climate scenarios (RCP4.5 and RCP8.5) at Tai’an, a representative site on the North China Plain (NCP). Results showed that the mean air temperature and accumulated precipitation for both winter wheat (Triticum aestivum L.) and summer maize (Zea mays L.) growing seasons changed in both magnitude and pattern under various climate scenarios. The temperature increases shortened the growth periods of these two crops by more than 13 days and decrease summer maize yields (P < 0.05). These results are illustrated by lower yield results associated with RCP4.5 (20.5%) and RCP8.5 (19.3%) climate scenarios, respectively. During the winter wheat growing season, water drainage examined in the climate scenarios was significantly higher (more than double) than the baseline, and there was no significant change to nitrate leaching and denitrification. In the summer maize growing season, with continuously rising temperatures, the ranking for evaporation was in the order baseline < RCP4.5 < RCP8.5, however, the opposite ranking applied for transpiration and evapotranspiration. The increase in water drainage was 1.4 times higher than the baseline, whereas the nitrate leaching in soil significantly decreased. Our simulation results provide an opportunity to improve the understanding of soil water and N fluxes in agroecosystems, which can lead to deficient or excess N under future climate conditions.

1. Introduction

Nitrogen (N) fertilizer plays an important role in improving crop yield and quality in agricultural production. Among various forms of added N, the leaching of nitrate is considered to be one of the main pathways of N loss in agroecosystem [1]. Globally, vast amount of nitrates leach from agricultural fields to ecosystems, primarily associated with fertilizer application, which causes substantial and wide-ranging impacts including declines in water quality and increases in N loss [2,3,4]. A major cause of this is poor nutrient and water management technologies in agroecosystem [2].
The potential for soil water drainage and N loss is a function of weather conditions, soil types, and crop management systems [5,6,7]. Among these influential factors, it is axiomatic that alterations in climate patterns will influence agroecosystems in terms of crop life cycles, soil water balance, and the efficiency of crop N uptake and use. Studies have shown that nitrate leaching is related to the intensity, duration, and interval of precipitation, as well as the crop’s growth stage at the time of precipitation [8,9]. Changes in climate with increased variability have already been observed to affect available soil moisture and N variability across crop growth phases with major negative impacts on crop production globally [10,11,12]. For example, a modeling study conducted in Denmark indicated that air temperature increases have negative effects on both wheat yield and nitrate leaching [13].
Understanding the processes that influence water and N fluxes in soil–crop systems in the context of climate change is of major importance with respect to both environmental concerns and the crop production [13,14]. Many investigations have been conducted in agroecosystems to explore the potential contribution of field practice measures on soil water drainage and nitrate leaching under current and future climates [15,16,17,18]. Knowledge obtained regarding water and N fluxes in agroecosystems and the corresponding control factors has been utilized to develop field management practices to decrease N loss [19,20]. However, soil water and N fluxes in response to climate change under complicated cropping systems need to be further investigated [15]. The process-based crop models have become accepted tools for agricultural research because the model’s purpose is to describe the causal relationships between crop growth and environmental driving factors [21]. Numerous studies have examined the effectiveness of field management practices and measures aimed at reducing N loss and increasing crop yields under future climatic conditions by using modeling approaches [22,23,24]. For example, Biggs et al. (2013) reported that adaptive fertilizer management practices could reduce N loss with soil water drainage under projected climate change conditions. Modeling crop yields together with water and N balances is key to quantifying and reducing N loss in the context of climate change [25].
The objective of this study was to evaluate climate change impacts on crop yield, soil water, and N fluxes in a wheat–maize cropping system. We recognize that increased atmospheric CO2 concentration will also interact with changes in air temperature and precipitation to affect crop and soil processes [26]; however, we focus mainly on the over-riding effects of changing temperature and precipitation patterns on soil water and N fluxes, which can lead to deficient or excess N under future climatic conditions.

2. Materials and Methods

2.1. Study Area and Overview of Experiment

For the case study, we considered the Tai’an in Shandong Province and the North China Plain (NCP), an important agricultural production region for winter wheat and summer maize production in China. The research site is located inside the Shandong Agricultural University’s Agricultural Experimental Station (36°09′37″ N, 117°09′18″ E, 130 m above sea level), which has a temperate, semi-humid continental monsoon climate. Its mean annual temperature and sunshine hours are 13 °C and 2627 h, respectively. The maximum and minimum temperatures occur in July (26.4 °C) and January (−2.6 °C), respectively. The rainy season is from July to September each year. The mean annual precipitation is 697 mm, and the groundwater depth exceeds 10 m. The parent material for soil formation is fluvial alluvium, and the soil type is alluvial cambisol (further details are given in Table A1 in the Appendix A). The winter wheat and summer maize crop rotation system has long been in use in the region and is widely practiced.
According to historical records of the local agro-meteorological observation stations, the growing season for winter wheat starts as early as October each year and continues until mid-June the following year, while that for summer maize is mid-June to mid-October of each year. The variety of winter wheat used in this experiment was Tainong 8. The cultivation method is deep ploughing, with straw mulching being practiced after harvesting. The variety of summer maize used in this study was Zhengdan 958 and the no-till farming method was used. Experimental design and water–fertilizer management details are shown in Table A2 [27].

2.2. Data Sources

Historical daily weather data (1981–2010) were obtained from the Tai’an Meteorological Station’s surface climate daily dataset, which was provided by the China Meteorological Data Service Center (http://cdc.cma.gov.cn/). The meteorological elements included air temperature (maximum, minimum, and mean), precipitation, mean wind speed, relative humidity, and sunshine hours. This set of 30-year historical meteorological data was used as the baseline climate period to generate data for future climate scenarios. Specifically, the baseline data were generated by three climate system models: GFDL-CM3, CSIRO-Mk3-6-0, and Had-GEM2-AO. In this study, the future climate period assessed was from 2031–2060. Two Representative Concentration Pathways (RCP4.5 and RCP8.5) scenarios were selected to generate meteorological data for this future climate period. The data included daily minimum, maximum, temperatures, and precipitation. The current CO2 concentration (354 ppm) was assumed for the study [28].

2.3. Model Choice

A soil–crop system model (soil Water Heat Carbon Nitrogen Simulator, WHCNS), which was used in this study to simulate water consumption, N fates, and crop growth for different climate scenarios. The WHCNS model includes five main modules: Soil water, soil temperature, soil carbon, soil N, and crop growth. The model is driven by daily meteorological data and crop biology parameters that compute daily processes including soil evaporation, crop transpiration, soil water movement, runoff, soil temperature, soil net mineralization, nitrification, ammonia volatilization, denitrification, and crop growth. The model has been widely used to support its effectiveness in increasing crop yields and fertilizer use efficiency [29,30,31,32]. For a more detailed description of the model, please refer to Liang et al. (2016) [30].

2.4. Model Parameters, Evaluation, and Statistical Analyses

Data from field experiments conducted from 2009‒2012 were used to calibrate and evaluate the WHCNS model. Soil hydraulic parameters soil N transformation parameters, and crop parameters entered into the model are shown in Table A1, Table A3 and Table A4, respectively. For the model used in this study, the source of its parameters is described in the literature [30]. The model parameters were calibrated and evaluated, and the indicators for evaluating the simulation effect are shown in Table A5. The performance of the WHCNS model was acceptable in its simulation of the soil water content, nitrate concentration, and grain yield. Therefore, we proceeded to perform a response analysis of soil water drainage, nitrate leaching, crop N uptake, and grain yield to climate change. Several WHCNS-simulated outputs, including crop yield at harvest, various items related to water and N budget driven by the above three climate system models were averaged and then used to analyze the effect of climate change using the SAS PROC MIXED procedure with the method of restricted maximum likelihood (REML) [33]. The LSMEANS procedure of PROC MIXED along with adjusted Tukey was used for mean comparisons.

2.5. Optimizing Field Management Measures

This study eliminated the complex process of annual variations causing changes in the growth stages since the current WHCNS model cannot schedule automatic irrigation according to the crop growth period. The specific method involved selecting the fertilization and irrigation date as the date that corresponded to the multi-year average key growth period. Optimized water and fertilizer management measures were adopted for winter wheat and summer maize and are shown in Table 1.

3. Results

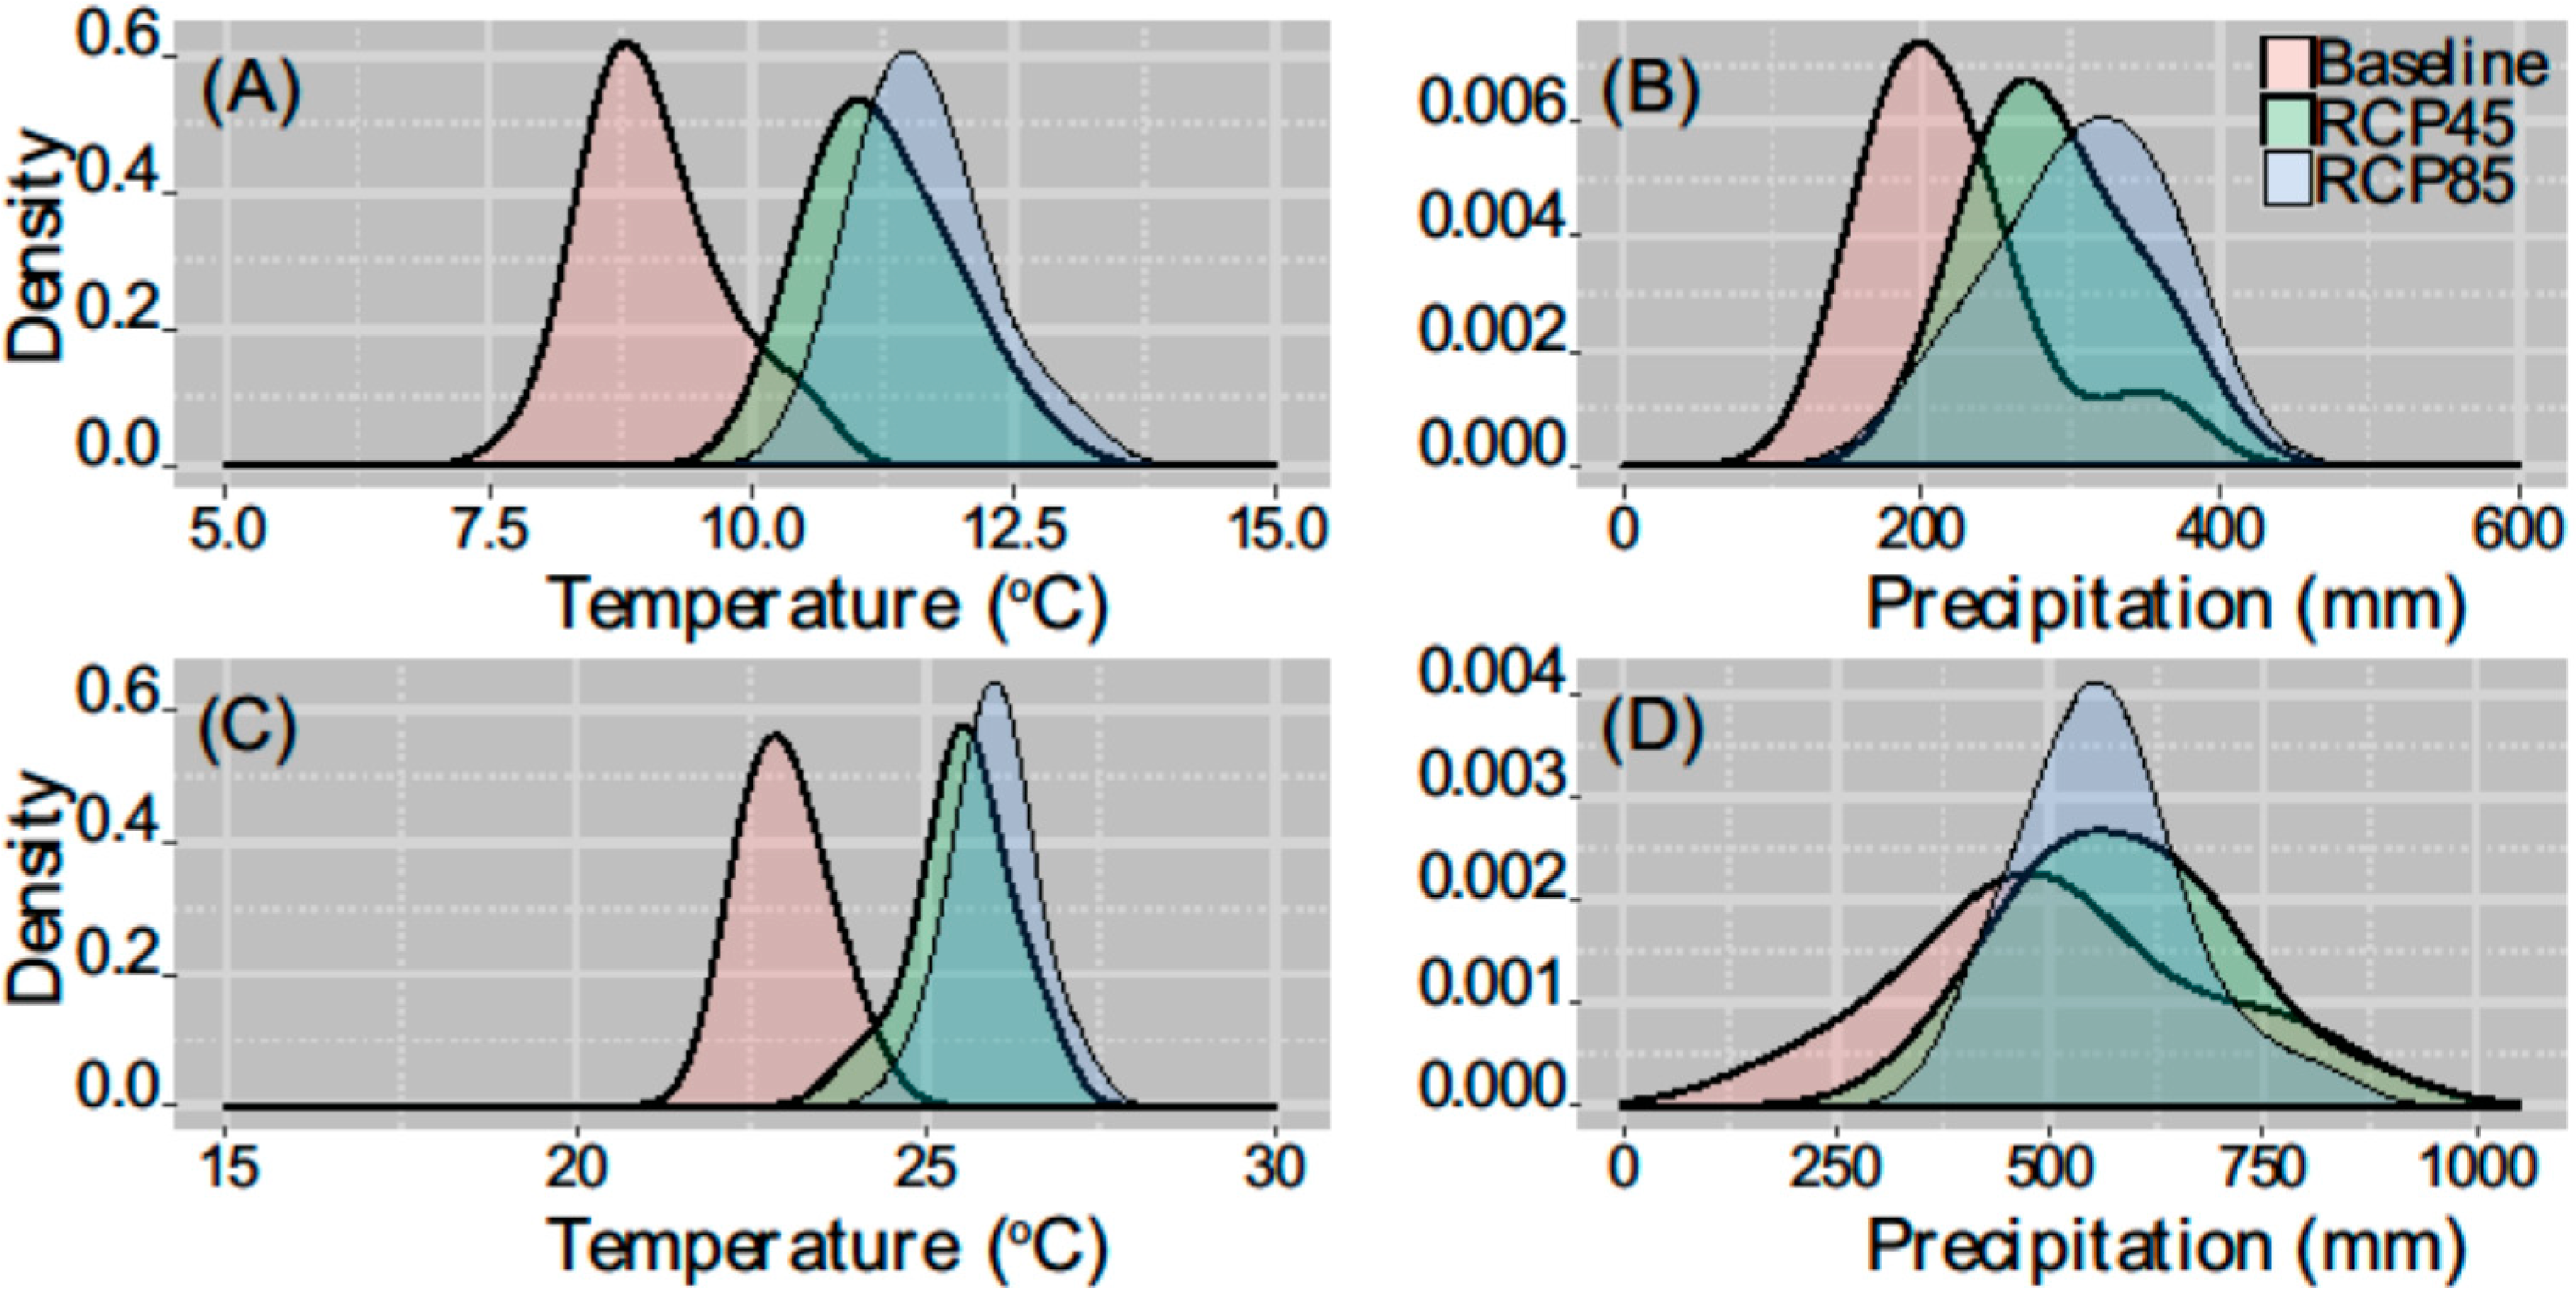
3.1. Growing Season Air Temperature and Precipitation of Climate Scenarios

The mean temperature and accumulated precipitation of the winter wheat growing season changed in terms of both quantity and pattern under different climate scenarios. On a growing season basis, the mean temperatures shifted right under the future climate scenarios (Figure 1A), with the ranking for the minimum, maximum, and mean values being RCP8.5 > RCP4.5 > baseline. In other words, temperatures increased across the growing season. The probability distribution of accumulated precipitation during the growing season of winter wheat under different climate scenarios is shown in Figure 1B. In terms of the mean accumulated precipitation during the growing season, the ranking is RCP8.5 > RCP4.5 > baseline. The minimum and maximum precipitation under RCP4.5 and RCP8.5 are very similar and are both higher than the baseline. The intensity of heavy precipitation events under RCP8.5 compared to RCP4.5 scenarios is also higher than that of the baseline.
The pattern of changes in the mean temperature of summer maize growing season is similar to that of winter wheat, with overall increases in the maximum, minimum, and mean values (Figure 1C). This implies that hot weather occurs more frequently during the growing season. The changes in accumulated precipitation are more complicated. The probability distribution of accumulated precipitation during the growing season under different climate scenarios is shown in Figure 1D. The distribution under the baseline is scattered, together with the occurrence of extremely dry and wet years (i.e., accumulated precipitation < 200 mm and >800 mm, respectively). Compared with the baseline, precipitation is more concentrated under the future climate scenarios, i.e., 300–900 mm and 200–1000 mm under RCP8.5 and RCP4.5, respectively.

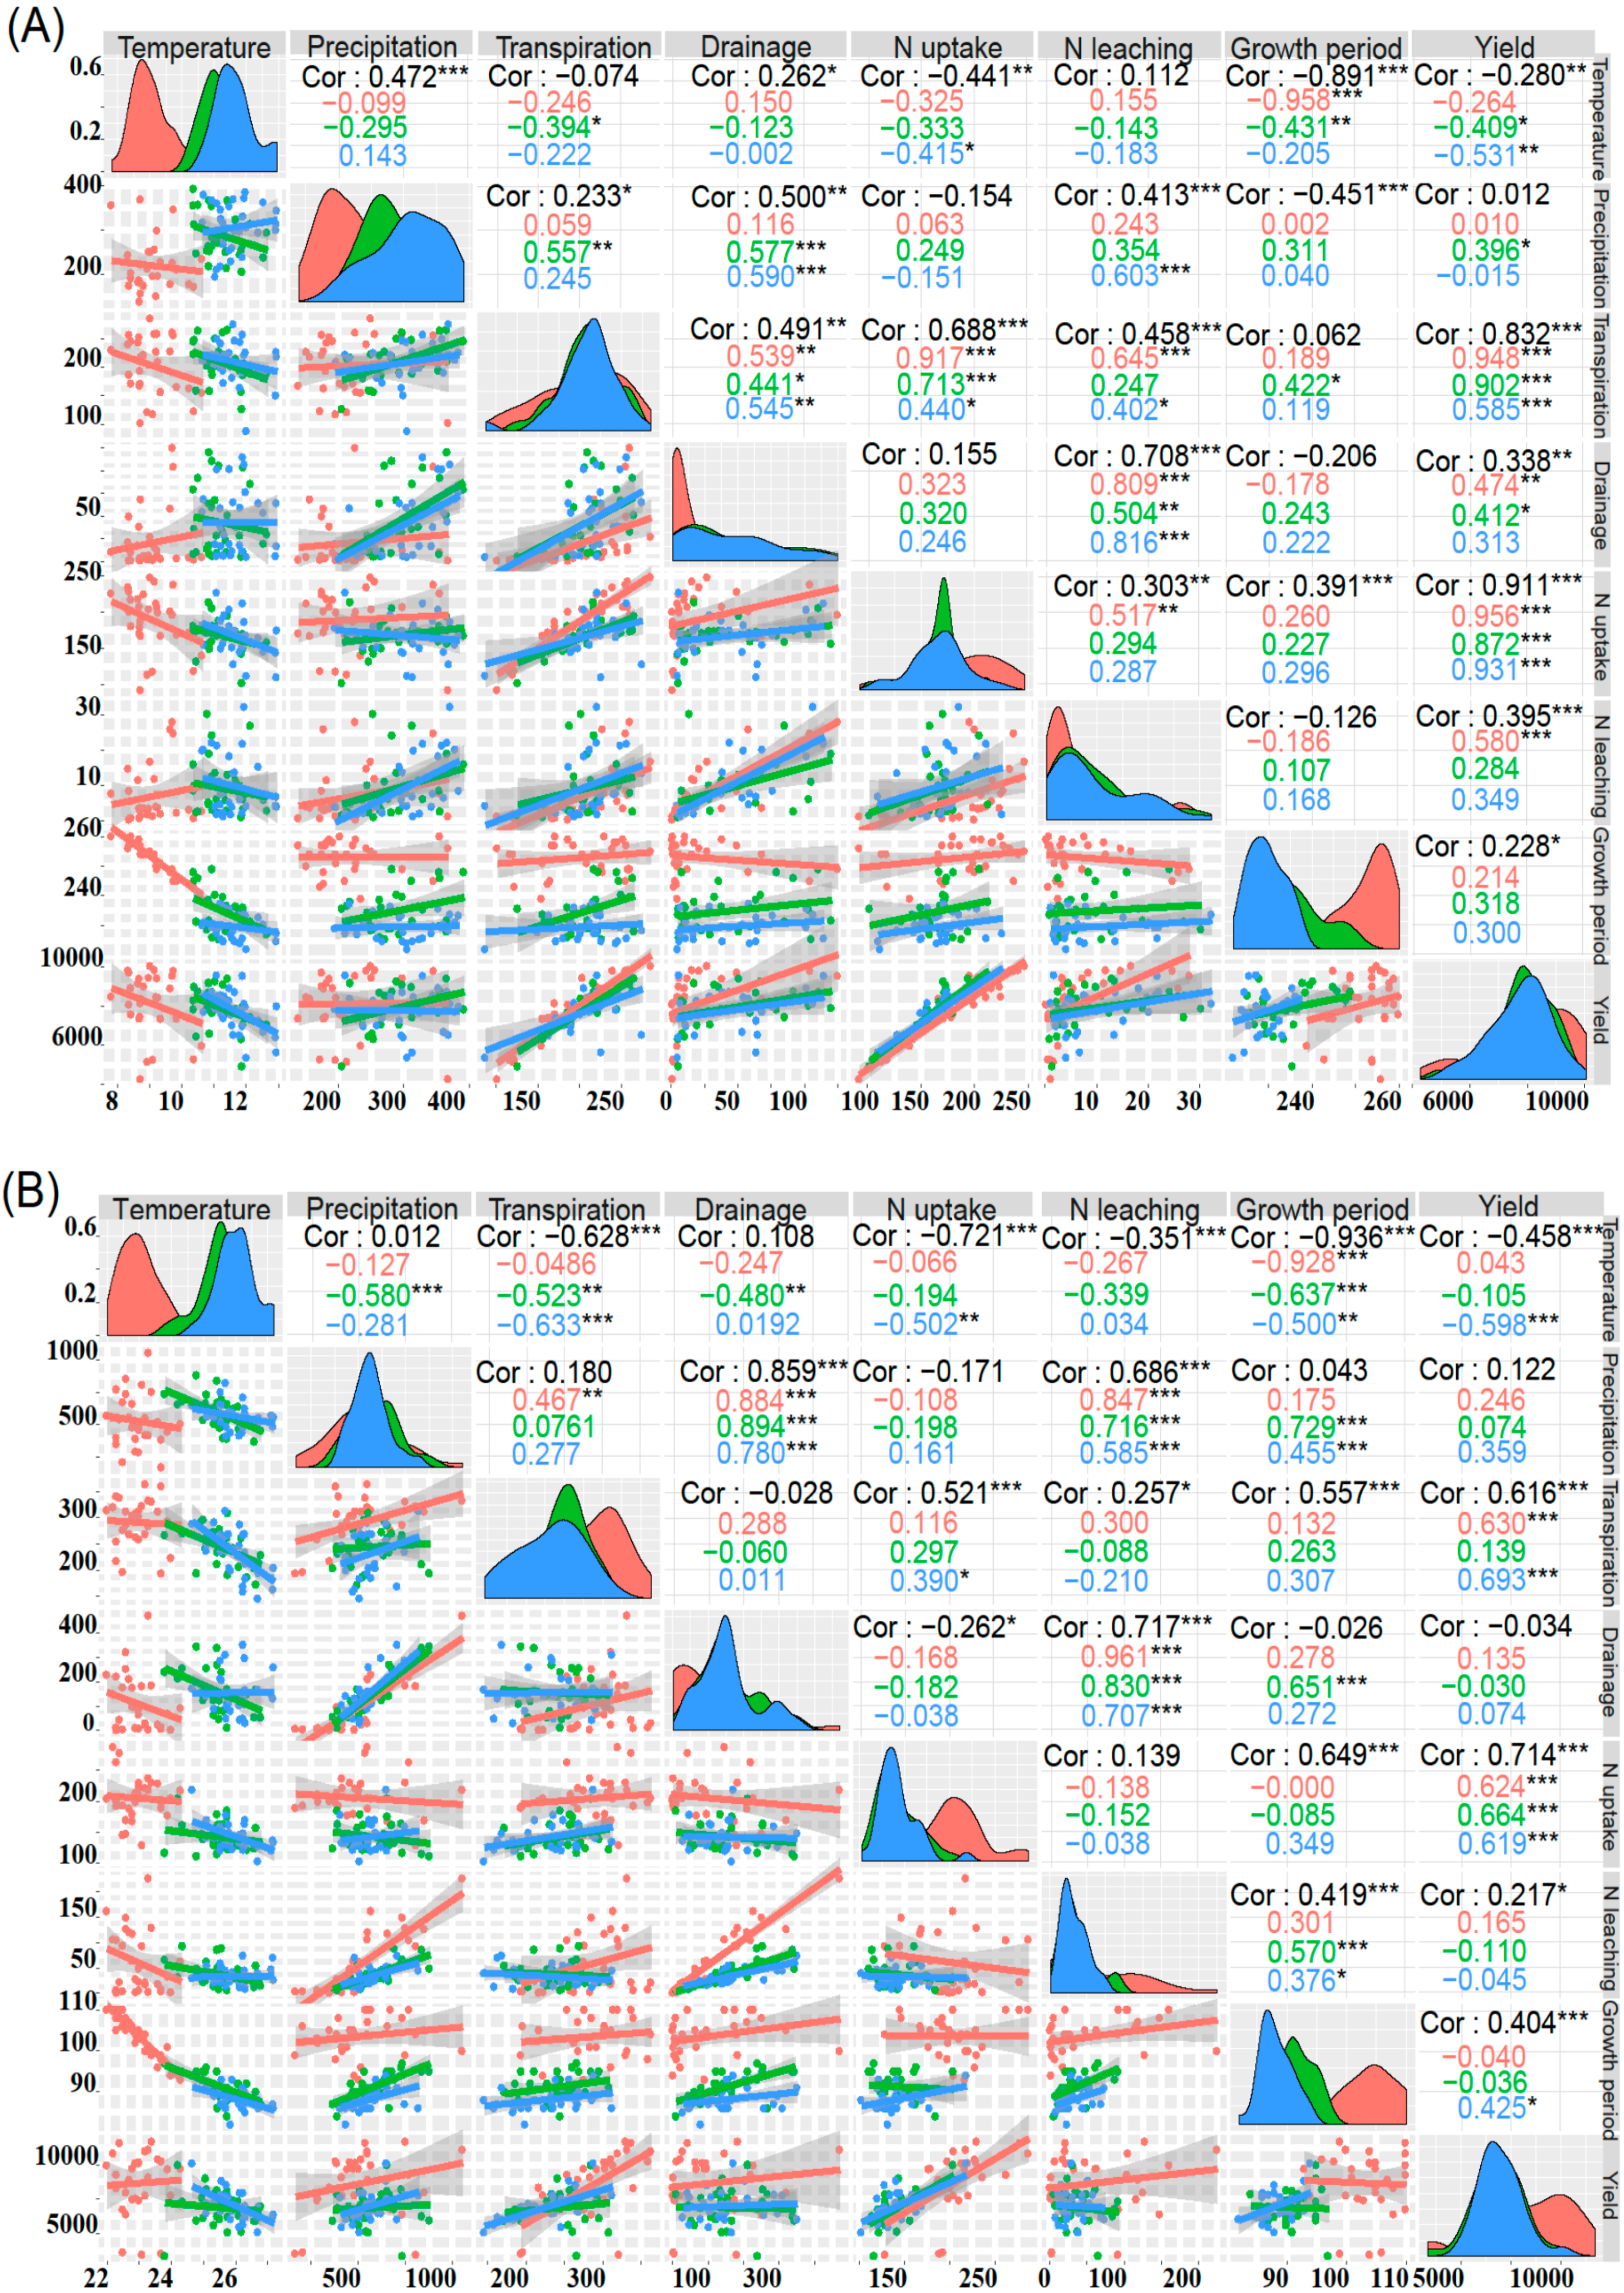
3.2. Impact of Climate Change on Crops’ Growth Period, Crop Yield, Soil Water, and N Fluxes

Air temperature increases will shorten the growth periods of winter wheat and summer maize. For the winter wheat growing season, the growth period under both scenarios is shorter than that under the baseline: the mean reduction under RCP4.5 is 18 d, and that under RCP8.5 is more significant at 23 d (P < 0.05) (Table 2). The reduction ration of growth period for summer maize is higher than that of winter wheat (data no shown). With increasing temperatures, the ranking of the growth period is baseline > RCP4.5 > RCP8.5 (Table 2). Projected climate scenarios only significantly decreased maize yields (P < 0.05) with substantial differences found among climate scenarios as indicated by the lower yields associated with RCP4.5 (20.5%) and RCP8.5 (19.3%) climate scenarios, respectively.
In the winter wheat growing season, items related to water balance—such as precipitation—increased significantly in the future compared with the baseline, with the greatest increase occurring under RCP8.5. There is no significant change to evaporation, transpiration, evapotranspiration, or runoff. Soil water drainage in the climate scenarios is significantly higher (i.e., more than double) (P < 0.05) than at the baseline. Overall, there are significant increases in precipitation and water drainage (P < 0.05) under RCP4.5 and RCP8.5 compared with the baseline. Since the increase in input is greater than that of output, there is a significant increase in soil water storage under RCP8.5 (P < 0.05). Items related to N balance—such as the amounts of N brought into the field through N fertilizer, straw mulching, and irrigation water—were consistent under the various scenarios. In the climate scenarios, there is a significant decline (P < 0.05) in the amount of N due to mineralization, meaning that there is a significant decrease in N input. Uptake of N by crops also decreases significantly (P < 0.05). The same applies to ammonia volatilization, with the ranking being baseline > RCP8.5 > RCP4.5. There is no significant change to nitrate leaching or denitrification. The various input and output items for N balance change dynamically, although there is no significant change to the overall N balance.
In the summer maize growing season, the indicators for water and N balances are more susceptible to climate change than they are for winter wheat. For the various items pertaining to water balance, there is no significant change to precipitation and runoff for the summer maize growing season. With continuously rising temperatures, the ranking for evaporation is baseline < RCP4.5 < RCP8.5, whereas the opposite ranking was determined for transpiration and evapotranspiration. The increase in water drainage is 1.4 times higher than the baseline (P < 0.05). Although there are increases and decreases in the output items, the overall water balance does not change significantly. For the items related to N balance, net mineralization decreases significantly (P < 0.05). The pattern of change for the various N output items is consistent with the ranking of baseline > RCP4.5 > RCP8.5. Nitrate leaching and accumulation in soil significantly decreases and increases (P < 0.05), respectively.

4. Discussion

4.1. Crops Growth and Crop Yield Under Baseline and Projected Future Climate Scenarios

The projected climate change pattern in our study site is consistent with the phenomenon of climate change and the findings of many studies conducted near our study areas [34,35,36]. Our results demonstrated the dominant effect of climate change on crop growth periods and yields. Similar results have been reported by Xiao et al. (2016) [36]. Air temperature increases accelerate crop flowering and maturation, thereby accelerating the growth process and shortening the growth period [37,38]. The magnitude of the temperature increase is the largest under RCP8.5, and hence the reduction in the growth period is also the most obvious. In terms of crops, summer maize has more reduction in the growth period due to more frequent hot weather patterns. Similar change patterns were also noted in a study on the growth periods of winter wheat and summer maize on the North China Plain [36].
Crop yield is affected by several factors that, in combination, cause a decline under the different climate scenarios. Among these factors, the length of growth period had been observed to be closely related to crop yield [39]. In our study, the correlation between yield and temperature is negative, which agrees with the findings of Ray et al. (2015) [40]. Correlations between the yield of winter wheat and the mean temperature of the wheat growing season are significant (P < 0.05) and vary among baseline and climate scenarios (Figure 2). This result further confirmed the negative impact of warmer weather on yield. The negative correlation between yield and temperature in summer maize is extremely significant. This indicates that it is susceptible to heat damage from high temperatures during its growing season, which results in a decline in yield. The positive correlation between transpiration and yield is also extremely significant, and is in agreement with the findings of Djaman et al. (2013) [41]. The correlation coefficients of the aforementioned factors are ranked in the following descending order: Transpiration > temperature > growth period. It is surmised that transpiration has the greatest effect on yield determination. Under the varying climate scenarios, there is no significant change in transpiration during the wheat growing season; therefore, the reduction in yield is not significant. However, during the maize growing season, transpiration, as well as crop yield, are significantly reduced, which is consistent with what would be expected.

4.2. Soil Water and N Fluxes Under Baseline and Projected Future Climate Scenarios

Projected climate scenarios have significant effects on soil water drainage. This result was expected due to seeing precipitation increases during the growth period of both crops under RCP4.5 and RCP8.5 climate scenarios. The correlation coefficient between precipitation and water drainage during the summer maize growth period is 0.859 (P < 0.01), which is higher than that of winter wheat (0.500, P < 0.001) (Figure 2). Precipitation impacts varied, which is possibly due to the use of different irrigation systems used for both crops. Cultivation of winter wheat in the NCP utilizes two methods of water input: irrigation and rainfed. In contrast, summer maize is cultivated only using rainfed conditions, making it more susceptible to changes in climate and precipitation. This also resulted in a greater correlation between water drainage and precipitation under RCP4.5 and RCP8.5. Although increased precipitation led to more water input, the soil water balance for the maize growth period did not differ significantly with warmer temperatures, which was likely due to reduced crop water consumption (CWC). This result is similar to the reports of Hawkins et al. (2013) that showed that the amount of CWC was directly relevant to temperature increases [42]. Therefore, further investigation into the means of addressing decreases in CWC resulting from temperature increases is necessary for maximizing water use efficiency.
Increases in soil water drainage did not result in an increase of nitrate leaching. In general, soil water drainage is closely related to nitrate leaching. Congreves et al. (2016) and Patil et al. (2010) showed that heavy rainfall events cause larger soil water drainage through the soil that carries nitrate below the root zone and vice versa [43,44]. In our present study, nitrate leaching for winter wheat did not increase significantly, and there was a significant reduction in nitrate leaching for summer maize, although precipitation and water drainage increased. These results were not expected; however, they can be explained in part due to a decreased N input (net mineralization) induced by climate change. The positive effect of temperature increases on reducing net mineralization is shown in both the incubation experiment of Dalias et al. [45] and in our simulation. In addition, studies have shown that nitrate leaching is related to the intensity, duration, and precipitation intervals as well as the crop’s growth stage at the time of precipitation [8,9]. Precipitation patterns during the summer maize growing season will become complicated in the future. Under conditions where total precipitation does not change significantly, the occurrence of extreme precipitation events will decrease mostly in the RCP8.5 scenario. This study showed that the correlation coefficient between precipitation and nitrate leaching in the summer maize growing season reduces from 0.847 to 0.716 and then to 0.585, corresponding to the baseline, RCP4.5, and RCP8.5 climate scenarios, respectively (Figure 2B). A plausible explanation is that there are less extreme precipitation events under RCP4.5 and RCP8.5 climate scenarios, and thus, less extreme soil water drainage events. Such an explanation could be supported by an experimental study of nitrate isotopes, which was also conducted in NCP under a wheat–maize double cropping system [46]. This study indicated that extreme precipitation events are highly relevant to nitrate leaching.
Climate factors that limit crop growth can leave surpluses of unused fertilizer N in soil and has a negative effect on crop N uptake even when field management practices are optimized [47]. Crop N uptake in field conditions can greatly vary in a single year and over several years even when the N supplies from both the soil and additional fertilizer inputs are abundant [10]. Changes in the climatic factors, specifically temperature and precipitation, are associated with decreased N uptake during the growing season. The present crop model assessing N uptake is based on the thermal unit concept, which implies that high temperatures will affect the process of N transfer from the soil to the shoot and limit N accumulation in crops [48]. In addition, a shorter growth period further reduces N uptake. This result agrees with the findings of Gastal and Lemaire (2002), who suggest that with an adequate soil N supply, crop N uptake is mostly determined by the crop growth rate [10].

5. Conclusions

Climate change impacts on winter wheat and summer maize growth, and water and N fluxes in agroecosystems were determined using the process-based WHCNS model. Our results showed that the mean temperature and accumulated precipitation of the winter wheat growing season clearly changed in both quantity and pattern under different climate scenarios. Temperature increases were shown to shorten the growth periods of winter wheat and summer maize.
Our study shows that increased precipitation under RCP4.5 and RCP8.5 climate scenarios leads to a significant increase in soil water drainage. However, the increases in soil water drainage did not result in increased nitrate leaching, which could be explained in part by a decrease in N input (net mineralization) induced by climate change. There is no significant change to evaporation, transpiration, or evapotranspiration for the winter wheat growing season, and the converse is true for the summer maize growing season. Although the various input and output items for the N balance change dynamically, there is no significant change to the overall N balance. During the summer maize growing season, the pattern of change for the various N output items is consistent with the order baseline > RCP4.5 > RCP8.5. Nitrate leaching in soil significantly decreases, which is likely due to less N input (net mineralization) and less heavy rainfall events under projected climate change scenarios.

Author Contributions

Conceptualization, Y.H.; Data curation, K.H.; formal analysis, Y.S. and H.L.; funding acquisition, Y.H.; writing, Y.H. and Y.S.; writing—review and editing, K.H., and L.H. All authors have read and agreed to the published version of the manuscript.

Funding

This research was funded by National Natural Science Foundation of China (41501118;41975148), National Key Research and Development Program of China (2016YFD0800101), Chinese Academy of Agricultural Sciences Elite Youth Program and Chinese Academy of Agricultural Sciences Central Public-interest Scientific Institution Basal Research Fund (BSRF201502;BSRF202005).

Conflicts of Interest

The authors declare no conflict of interest.

Appendix A

Table A1. Parameters for physical and hydraulic properties of soil profiles [30].
Soil LayerVolumetric WeightθrθsαnKs
(cm)(g cm−3)(cm3 cm−3)(cm3 cm−3)(cm−1) (cm d−1)
0–251.450.0300.4530.01061.4472.1
25–451.500.0320.3740.01111.2862.2
45–951.500.0250.4300.01201.2962.5
95–1151.510.0250.4300.02701.1355.4
115–1351.450.0500.4530.02631.1455.0
135–1601.400.0500.4720.01791.0954.0
Note: θr and θs = residual and saturated water contents, respectively; Ks = the saturated hydraulic conductivity; and α and n = parameters of the water characteristic curve.
Table A2. Summary of crop management practices conducted for the experiment during 2009 to 2012 [30].
2009–20102010–20112011–2012
Management EventsWinter WheatSummer MaizeWinter WheatSummer MaizeWinter WheatSummer Maize
Planting date1 October15 June1 October15 June1 October15 June
Planting density, plant ha−12,400,00066,0002,400,00066,0002,400,00066,000
Row spacing, m0.250.60.250.60.250.6
Irrigation date and amount, mmSeedling Before sowing
75
SeedlingBefore sowing
75
75 75
Jointing JointingJointing
75 7575
Flowering FloweringFlowering
75 7575
Filling FillingFilling
75 7575
Fertilizer application date and amount, N kg ha−1Sowing
84
Jointing
126
Jointing
210
Sowing
84
Jointing
126
Jointing
210
Sowing
84
Jointing
126
Jointing
210
Table A3. Soil nitrogen transformation parameters used in the WHCNS model [30].
ParameterDescriptionValue
Vn (mg L−1 d−1 N)Maximum nitrification rate20
Kn (mg L−1 N)Half-saturation constant for nitrification 50
Kd (-)Empirical scaling parameter for denitrification1
Ad (mg mg−1)Empirical constant for denitrification0.1
Kv (day−1)First-order kinetic parameters for ammonia volatilization0.02
Table A4. Parameters for original crop species used in the WHCNS model [30].
ParameterDescriptionCrop
Winter WheatSummer Maize
TbaseMinimum temperature for crop growth & development (°C)08
TsumAccumulated temperature from seedling germination to maturity (°C)20001550
KeExtinction coefficient (-)0.60.6
K_iniEarly-term crop coefficient (-)0.650.65
K_midMid-term crop coefficient (-)1.051.35
K_endLate-term crop coefficient (-)0.251.2
SLA_maxMaximum specific leaf area (m2 kg−1)2430
SLA_minMinimum specific leaf area (m2 kg−1)1415
AMAXMaximum assimilation rate (kg hm−2 h−1)4560
R_maxMaximum root length (cm)12080
Table A5. Evaluation of the model’s simulation effects [30].
ItemRMSEEd
Soil water content (cm3 cm−3)0.0380.370.80
Soil nitrate N content (mg kg−1)10.3−0.850.48
Leaf area index (m2 m−2)0.580.900.97
Yield (kg ha−1)3190.760.93
Note: RMSE = root mean square error; E = coefficient for the model’s simulation efficiency; and d = consistency index.

References

  1. Marchi, E.C.; Zotarelli, L.; Delgado, J.A.; Rowland, D.L.; Marchi, G. Use of the Nitrogen Index to assess nitrate leaching and water drainage from plastic-mulched horticultural cropping systems of Florida. Int. Soil Water Conserv. Res. 2016, 4, 237–244. [Google Scholar] [CrossRef]
  2. Zhang, X.; Davidson, E.; Mauzerall, D.L.; Searchinger, T.D.; Dumas, P.; Shen, Y. Managing nitrogen for sustainable development. Nature 2015, 528, 51–59. [Google Scholar] [CrossRef] [PubMed] [Green Version]
  3. Wang, Y.; Ying, H.; Yin, Y.; Zheng, H.; Cui, Z. Estimating soil nitrate leaching of nitrogen fertilizer from global meta-analysis. Sci. Total. Environ. 2019, 657, 96–102. [Google Scholar] [CrossRef] [PubMed]
  4. Kasper, M.; Foldal, C.; Kitzler, B.; Haas, E.; Strauss, P.; Eder, A.; Zechmeister-Boltenstern, S.; Amon, B. N2O emissions and NO3− leaching from two contrasting regions in austria and influence of soil, crops and climate: A modelling approach. Nutr. Cycl. Agroecosyst. 2019, 113, 95–111. [Google Scholar] [CrossRef] [Green Version]
  5. Lu, J.; Bai, Z.; Velthof, G.; Wu, Z.; Chadwick, D.; Ma, L. Accumulation and leaching of nitrate in soils in wheat-maize production in China. Agric. Water Manag. 2019, 212, 407–415. [Google Scholar] [CrossRef]
  6. Sogbedji, J.M.; Van Es, H.M.; Yang, C.L.; Geohring, L.D.; Magdoff, F.R. Nitrate Leaching and Nitrogen Budget as Affected by Maize Nitrogen Rate and Soil Type. J. Environ. Qual. 2000, 29, 1813–1820. [Google Scholar] [CrossRef]
  7. Wang, F.L.; Alva, A.K. Leaching of Nitrogen from Slow-Release Urea Sources in Sandy Soils. Soil Sci. Soc. Am. J. 1996, 60, 1454–1458. [Google Scholar] [CrossRef]
  8. Gheysari, M.; Mirlatifi, S.M.; Homaee, M.; Asadi, M.E.; Hoogenboom, G. Nitrate leaching in a silage maize field under different irrigation and nitrogen fertilizer rates. Agric. Water Manag. 2009, 96, 946–954. [Google Scholar] [CrossRef]
  9. Yang, X.; Lu, Y.; Tong, Y.; Yin, X. A 5-year lysimeter monitoring of nitrate leaching from wheat–maize rotation system: Comparison between optimum N fertilization and conventional farmer N fertilization. Agric. Ecosyst. Environ. 2015, 199, 34–42. [Google Scholar] [CrossRef]
  10. Gastal, F.; Lemaire, G. N uptake and distribution in crops: An agronomical and ecophysiological perspective. J. Exp. Bot. 2002, 53, 789–799. [Google Scholar] [CrossRef] [Green Version]
  11. Gungula, D.T.; Kling, J.G.; Togun, A.O. Ceres-maize predictions of maize phenology under nitrogen-stressed conditions in nigeria. Agron. J. 2003, 95, 892–899. [Google Scholar] [CrossRef]
  12. Nord, E.A.; Lynch, J.P. Plant phenology: A critical controller of soil resource acquisition. J. Exp. Bot. 2009, 60, 1927–1937. [Google Scholar] [CrossRef] [PubMed] [Green Version]
  13. Jabloun, M.; Schelde, K.; Tao, F.; Olesen, J.E. Effect of temperature and precipitation on nitrate leaching from organic cereal cropping systems in Denmark. Eur. J. Agron. 2015, 62, 55–64. [Google Scholar] [CrossRef]
  14. Van Der Velde, M.; Folberth, C.; Balkovič, J.; Ciais, P.; Fritz, S.; Janssens, I.A.; Obersteiner, M.; See, L.; Skalský, R.; Xiong, W.; et al. African crop yield reductions due to increasingly unbalanced Nitrogen and Phosphorus consumption. Glob. Chang. Boil. 2014, 20, 1278–1288. [Google Scholar] [CrossRef] [PubMed]
  15. Dirnböck, T.; Kobler, J.; Kraus, D.; Grote, R.; Kiese, R.; Grote, R. Impacts of management and climate change on nitrate leaching in a forested karst area. J. Environ. Manag. 2016, 165, 243–252. [Google Scholar] [CrossRef] [PubMed]
  16. Kurunc, A.; Ersahin, S.; Uz, B.Y.; Sonmez, N.; Uz, I.; Kaman, H.; Bacalan, G.; Emekli, Y. Identification of nitrate leaching hot spots in a large area with contrasting soil texture and management. Agric. Water Manag. 2011, 98, 1013–1019. [Google Scholar] [CrossRef]
  17. Poch-Massegú, R.; Jiménez-Martínez, J.; Wallis, K.; De Cartagena, F.R.; Candela, L. Irrigation return flow and nitrate leaching under different crops and irrigation methods in Western Mediterranean weather conditions. Agric. Water Manag. 2014, 134, 1–13. [Google Scholar] [CrossRef]
  18. Woli, P.; Hoogenboom, G. Simulating weather effects on potato yield, nitrate leaching, and profit margin in the US Pacific Northwest. Agric. Water Manag. 2018, 201, 177–187. [Google Scholar] [CrossRef]
  19. Gholamhoseini, M.; Aghaalikhani, M.; Sanavy, S.M.; Mirlatifi, S. Interactions of irrigation, weed and nitrogen on corn yield, nitrogen use efficiency and nitrate leaching. Agric. Water Manag. 2013, 126, 9–18. [Google Scholar] [CrossRef]
  20. Qin, X.; Wang, H.; He, Y.; Li, Y.; Li, Z.; Gao, Q.; Wan, Y.; Qian, B.; McConkey, B.; Depauw, R.; et al. Simulated adaptation strategies for spring wheat to climate change in a northern high latitude environment by DAYCENT model. Eur. J. Agron. 2018, 95, 45–56. [Google Scholar] [CrossRef]
  21. Rotter, R.; Tao, F.; Höhn, J.G.; Palosuo, T. Use of crop simulation modelling to aid ideotype design of future cereal cultivars. J. Exp. Bot. 2015, 66, 3463–3476. [Google Scholar] [CrossRef] [PubMed] [Green Version]
  22. Akbariyeh, S.; Pena, C.A.G.; Wang, T.; Mohebbi, A.; Bartelt-Hunt, S.; Zhang, J.; Li, Y. Prediction of nitrate accumulation and leaching beneath groundwater irrigated corn fields in the Upper Platte basin under a future climate scenario. Sci. Total. Environ. 2019, 685, 514–526. [Google Scholar] [CrossRef] [PubMed]
  23. Zarrineh, N.; Abbaspour, K.C.; Holzkämper, A. Integrated assessment of climate change impacts on multiple ecosystem services in Western Switzerland. Sci. Total. Environ. 2020, 708, 135212. [Google Scholar] [CrossRef]
  24. He, Y.; Liang, H.; Hu, K.; Wang, H.; Hou, L. Modeling nitrogen leaching in a spring maize system under changing climate and genotype scenarios in arid Inner Mongolia, China. Agric. Water Manag. 2018, 210, 316–323. [Google Scholar] [CrossRef]
  25. Biggs, J.; Thorburn, P.; Crimp, S.; Masters, B.; Attard, S. Interactions between climate change and sugarcane management systems for improving water quality leaving farms in the Mackay Whitsunday region, Australia. Agric. Ecosyst. Environ. 2013, 180, 79–89. [Google Scholar] [CrossRef]
  26. Lam, S.K.; Chen, D.; Norton, R.; Armstrong, R.; Mosier, A.R. Nitrogen dynamics in grain crop and legume pasture systems under elevated atmospheric carbon dioxide concentration: A meta-analysis. Glob. Chang. Boil. 2012, 18, 2853–2859. [Google Scholar] [CrossRef]
  27. Liu, H.; Hu, K.; Li, B.; Ren, T. Effects of soil profile basic properties on water and nitrogen movement and crop yield. Agric. Sci. China 2015, 48, 1348–1360. [Google Scholar]
  28. Peñuelas, J.; Fernández-Martínez, M.; Vallicrosa, H.; Maspons, J.; Zuccarini, P.; Carnicer, J.; Sanders, T.G.M.; Krüger, I.; Obersteiner, M.; Janssens, I.A.; et al. Increasing atmospheric CO2 concentrations correlate with declining nutritional status of European forests. Commun. Boil. 2020, 3, 125. [Google Scholar] [CrossRef]
  29. Li, Z.; Hu, K.; Li, B.; He, M.; Zhang, J. Evaluation of water and nitrogen use efficiencies in a double cropping system under different integrated management practices based on a model approach. Agric. Water Manag. 2015, 159, 19–34. [Google Scholar] [CrossRef]
  30. Liang, H.; Hu, K.; Batchelor, W.D.; Qi, Z.; Li, B. An integrated soil-crop system model for water and nitrogen management in North China. Sci. Rep. 2016, 6, 25755. [Google Scholar] [CrossRef] [Green Version]
  31. Liang, H.; Qi, Z.; Hu, K.; Li, B.; Prasher, S.O. Modelling subsurface drainage and nitrogen losses from artificially drained cropland using coupled DRAINMOD and WHCNS models. Agric. Water Manag. 2018, 195, 201–210. [Google Scholar] [CrossRef]
  32. Liang, H.; Qin, W.; Hu, K.; Tao, H.; Li, B. Modelling groundwater level dynamics under different cropping systems and developing groundwater neutral systems in the North China Plain. Agric. Water Manag. 2019, 213, 732–741. [Google Scholar] [CrossRef]
  33. SAS, I.I. Sas/Stat 9.2 User’s Guide: Statistics; SAS Institute, Inc.: Cary, NC, USA, 2009. [Google Scholar]
  34. Wang, Y.; Zhang, L.; Zhou, N.; Xu, L.; Zhu, J.; Tao, H.; Huang, S.; Wang, P. Late harvest and foliar fungicide acted together to minimize climate change effects on summer maize yield in the north china plain during 1954–2015. Agric. Ecosyst. Environ. 2018, 265, 535–543. [Google Scholar] [CrossRef]
  35. Zhang, H.-L.; Zhao, X.; Yin, X.; Liu, S.-L.; Xue, J.-F.; Wang, M.; Pu, C.; Lal, R.; Chen, F. Challenges and adaptations of farming to climate change in the North China Plain. Clim. Chang. 2015, 129, 213–224. [Google Scholar] [CrossRef]
  36. Xiao, D.; Qi, Y.; Shen, Y.-J.; Tao, F.; Moiwo, J.P.; Liu, J.; Wang, R.; Zhang, H.; Liu, F. Impact of warming climate and cultivar change on maize phenology in the last three decades in North China Plain. Theor. Appl. Clim. 2015, 124, 653–661. [Google Scholar] [CrossRef]
  37. Tao, F.; Zhang, S.; Zhang, Z.; Rotter, R. Maize growing duration was prolonged across China in the past three decades under the combined effects of temperature, agronomic management, and cultivar shift. Glob. Chang. Boil. 2014, 20, 3686–3699. [Google Scholar] [CrossRef]
  38. Wang, Z.; Qi, Z.; Xue, L.; Bukovsky, M.; Helmers, M.J. Modeling the impacts of climate change on nitrogen losses and crop yield in a subsurface drained field. Clim. Chang. 2015, 129, 323–335. [Google Scholar] [CrossRef] [Green Version]
  39. Cleland, E.E.; Chuine, I.; Menzel, A.; Mooney, H.A.; Schwartz, M. Shifting plant phenology in response to global change. Trends Ecol. Evol. 2007, 22, 357–365. [Google Scholar] [CrossRef]
  40. Ray, D.K.; Gerber, J.S.; Macdonald, G.K.; West, P.C. Climate variation explains a third of global crop yield variability. Nat. Commun. 2015, 6, 5989. [Google Scholar] [CrossRef] [Green Version]
  41. Djaman, K.; Irmak, S.; Rathje, W.R.; Martin, D.L.; Eisenhauer, D.E. Maize Evapotranspiration, Yield Production Functions, Biomass, Grain Yield, Harvest Index, and Yield Response Factors under Full and Limited Irrigation. Trans. ASABE 2013, 56, 373–393. [Google Scholar] [CrossRef]
  42. Hawkins, E.; Fricker, T.E.; Challinor, A.J.; Ferro, C.A.T.; Ho, C.K.; Osborne, T.M. Increasing influence of heat stress on French maize yields from the 1960s to the 2030s. Glob. Chang. Boil. 2012, 19, 937–947. [Google Scholar] [CrossRef] [PubMed] [Green Version]
  43. Congreves, K.; Dutta, B.; Grant, B.; Smith, W.; Desjardins, R.; Wagner-Riddle, C. How does climate variability influence nitrogen loss in temperate agroecosystems under contrasting management systems? Agric. Ecosyst. Environ. 2016, 227, 33–41. [Google Scholar] [CrossRef]
  44. Patil, R.H.; Laegdsmand, M.; Olesen, J.; Porter, J.R. Effect of soil warming and rainfall patterns on soil N cycling in Northern Europe. Agric. Ecosyst. Environ. 2010, 139, 195–205. [Google Scholar] [CrossRef]
  45. Dalias, P.; Anderson, J.M.; Bottner, P.; Coûteaux, M.-M. Temperature responses of carbon mineralization in conifer forest soils from different regional climates incubated under standard laboratory conditions. Glob. Chang. Boil. 2001, 7, 181–192. [Google Scholar] [CrossRef]
  46. Zheng, W.; Wang, S.; Tan, K.; Lei, Y. Nitrate accumulation and leaching potential is controlled by land-use and extreme precipitation in a headwater catchment in the North China Plain. Sci. Total. Environ. 2020, 707, 136168. [Google Scholar] [CrossRef]
  47. Bowles, T.M.; Atallah, S.S.; Campbell, E.E.; Gaudin, A.C.M.; Wieder, W.R.; Grandy, A.S. Addressing agricultural nitrogen losses in a changing climate. Nat. Sustain. 2018, 1, 399–408. [Google Scholar] [CrossRef]
  48. Hansen, S.; Jensen, H.E.; Nielsen, N.E.; Svendsen, H. Simulation of nitrogen dynamics and biomass production in winter wheat using the Danish simulation model DAISY. Nutr. Cycl. Agroecosyst. 1991, 27, 245–259. [Google Scholar] [CrossRef]
Figure 1. Frequency distributions of (A,C) temperature and (B,D) average accumulated precipitation for the winter wheat and summer maize growing seasons for the baseline (1981–2010), RCP4.5, and RCP8.5 climate scenarios. The mean value for the RCP4.5 and RCP8.5 climate scenarios was averaged from three general circulation models: BCC-CSM1.1 (m), CSIRO-Mk3.6.0, and HadGEM2-AO.
Agronomy 10 00786 g001
Figure 2. Correlation matrix for growing season accumulated precipitation, transpiration (T a ), soil water drainage, crop N uptake, soil nitrate leaching, and yield for winter wheat (A) and summer maize (B) based on the mean of all climate scenarios of baseline (red), RCP4.5 (green), RCP8.5 (blue) climate scenarios, respectively. Note: *** Significant at the 0.001 probability level, ** Significant at the 0.01 probability level, * Significant at the 0.05 probability level.
Agronomy 10 00786 g002
Table 1. Sowing date and optimized field management measures of winter wheat and summer maize.
Field Management StageWinter WheatSummer Maize
Date
(Month/Day)
Fertilization
(kg N ha−1)
Irrigation (mm)Date
(Month/Day)
Fertilization (kg N ha−1)Irrigation (mm)
Sowing10/106006/20250
Seedling10/15060 00
Jointing3/3090607/201250
Flowering4/28060 00
Filling5/14060 00
Table 2. Mean growth period, yield, water drainage, and nitrate leaching of winter wheat and summer maize under different climate scenarios.
ItemWinter WheatSummer Maize
BaselineRCP4.5RCP8.5BaselineRCP4.5RCP8.5
Water balance (mm)Irrigation240240240000
Precipitation190 a240 b256 b496 a541 a518 a
Evaporation166 a170 a174 a122 a148 b153 c
Transpiration203 a208 a206 a291 a245 b234 b
Evapotranspiration369 a378 a381 a413 a393 b387 b
Water drainage21 a43 b40 b109 a155 b153 b
Runoff00013 a7 a5 a
Water balance41 a59 a78 b−38 a−14 a−26 a
N balance (kg N ha−1)N fertilizer150150150150150150
Straw mulching37.537.537.537.537.537.5
N in irrigation water6.06.06.0000
N in wet sedimentation1.3 a1.7 b1.8 b3.5 a3.8 a3.6 a
Net mineralization52.9 a25.1 b24.2 b71.8 a25.3 b23.1 b
Crop N uptake189.0 a167.2 b168.2 b205.0 a142.6 b142.5 b
Nitrate leaching8.6 a9.2 a9.3 a72.8 a36.5 b33.5 b
Denitrification5.5 a4.3 a4.6 a21.1 a13.3 b13.2 b
Ammonia volatilization11.2 a4.8 b5.3 c9.5 a7.5 b7.4 b
N balance33.3 a34.9 a33.1 a−45.6 a17.7 b17.1 b
Growth period (d)252 a234 b229 c104 a91 b88 c
Yield (kg ha−1)8110 a7879 a7815 a8657 a6878 b6986 b
Note: Means followed by a letter in common are not significantly different at the 5% level.

