Article

Soil Loss Estimation for Conservation Planning in the Welmel Watershed of the Genale Dawa Basin, Ethiopia

by
Yared Mesfin Tessema
1,2,
Justyna Jasińska
3,
Lemma Tiki Yadeta
2,4,
Marcin Świtoniak
3,
Radosław Puchałka
5,6,* and
Eyob Gebrehiwot Gebregeorgis
5,7,*
1
Department of forestry, College of agriculture and environmental sciences, Arsi University, Assela, Oromia P.O.Box 193, Ethiopia
2
Department of Natural Resource Management, Mada Walabu University, Robe P.O. Box 247, Ethiopia
3
Department of Soil Science and Landscape Management, Faculty of Earth Sciences and Spatial Management, Nicolaus Copernicus University, 87-100 Toruń, Poland
4
Department of Natural Resources Management, Ambo University, Ambo P.O.Box 19, Ethiopia
5
Department of Ecology and Biogeography, Faculty of Biological and Veterinary Sciences, Nicolaus Copernicus University, Lwowsk 1, 87-100 Toruń, Poland
6
Centre for Climate Change Research, Nicolaus Copernicus University, 87-100 Toruń, Poland
7
Department of Plant Biology and Biodiversity Management, Addis Ababa University, Addis Ababa P.O. Box 3434, Ethiopia
*
Authors to whom correspondence should be addressed.
Agronomy 2020, 10(6), 777; https://doi.org/10.3390/agronomy10060777
Submission received: 18 April 2020 / Revised: 20 May 2020 / Accepted: 25 May 2020 / Published: 30 May 2020
(This article belongs to the Section Soil and Plant Nutrition)

Abstract

:
As a form of environmental degradation, soil degradation directly or indirectly affects many lives through decreased agricultural yields, increased flooding and habitat loss. Soil loss has been increasing in most parts of the world and is most pronounced in tropical developing countries where there is poor or zero soil and water conservation (SWC) planning and management activities. Identifying areas prone to soil erosion has also been inadequate, having not been informed by dedicated scientific studies. This is true of the poorly understood watershed of Welmel in the Oromia region of Ethiopia, where most livelihoods heavily rely upon agriculture. To plan effective SWC management techniques, a solid knowledge of spatial variations across different climate, land use and soil erosion is essential. This study has aimed at identifying potential areas needing SWC practices through conducting a spatial modeling of soil erosion within the Welmel watershed’s Genale Dawa basin using a geographic information system (GIS), remote sensing (RS), multiple factors as land uses and climate. The Welmel catchment is located in southeastern Ethiopia and extends between 5°0′0″ N–7°45′00″ N and 39°0′0″ E–41°15′0″ E. The revised universal soil loss equation (RUSLE), which was previously adapted to Ethiopian conditions, was used to estimate potential soil loss. It used information on interpolated rainfall erosivity (R), soil erodibility (K), vegetation cover (C) and topography (LS) from a digital elevation model (DEM) and that of conservation practices (P) from satellite images. The study demonstrates that the RUSLE using GIS and RS considering different climates and land management practices provides a great advantage in that it allows one to spatially analyze multilayer data in order to identify soil erosion-prone areas and thereby develop the most appropriate watershed management strategy. The mean soil loss was determined to be 31 tons ha−1 year−1 and it varied between 0 and 169 tons ha−1 year−1. About 79% of the watershed lies within the tolerable level of 11 tons ha−1 year−1. However, the remaining 21% has a high soil truncation trait, mainly due to its steeper slope and use as cultivated land. Our study identifies cultivated and deforested areas of the watershed as the potential SWC practice demanding areas. Thus, the application of RUSEL using GIS across different land management practices and climate zones is a potential tool for identifying SWC demanding sites. This remains helpful in efforts towards sustainable land management practices for the sustainable livelihood of the local human population.

1. Introduction

Global environmental problems are affecting the whole world at different scales of intensity, but with a much higher destruction than predicted [1,2]. Among environmental degradation types, soil degradation is one of the most widely experienced. Since most life forms are directly or indirectly dependent on soil, soil degradation—especially due to erosion—is one of the major environmental threats to many sectors of human activity [3,4,5], mainly agricultural productivity [6,7]. Globally, in the past four decades, one third of total arable land has been lost to soil erosion and this loss is still increasing [8,9,10,11,12]. This is more pronounced in sub-Saharan developing nations, due to: poor soil conservation planning, intensive farming, cultivation on steep slopes, the clearing of vegetation, (e.g., by deforestation and overgrazing, population growth and extensive settlement [13,14,15,16,17,18]), more intense rainfall and high soil erosivity induced by relatively shallow soil depth and low structural stability and high precipitation [19,20].
Ethiopia is known for its excellent cultural soil and water conservation (SWC) practices like the famous Konso stone terraces [21]. However, it suffers from soil erosion [22,23], which has resulted in soil degradation [24,25]. As in most tropical developing nations, the unsustainable and exploitative land use practices have accelerated soil erosion in many parts of Ethiopia [26] by reducing the protective plant cover and exposing the topsoil to the high-intensity rainfall. In the highlands of Ethiopia, annual soil loss is estimated to be up to 300 tons ha−1 year−1 [24,25] and 42.29 tons ha−1 year−1 from cultivated fields [27]. The country’s mean annual soil loss amounts to 12 tons ha−1, with about 43% of the nation’s highlands experiencing a higher rate of loss of 20 tons ha−1. The impact of soil erosion in Ethiopia is immense, in that, an average of 42 tons ha−1 year−1 of cropland soil is lost and a total of up to two billion tons ha−1 year−1 that is worth one billion USD is lost [8,28]. Ethiopia has one of the lowest crop productivities per plot of land than international standards [8]. This is mainly due to the removal of topsoil by erosion, which always implies nutrient loss and a reduction in rooting depth, water and nutrient storage capacity, resulting in low crop production [13,25,29].
To solve the aforementioned problems wider conservation programs were launched in Ethiopia, specifically after the famines of the 1970s and 1980s [30]. As a result, huge areas have been covered with terraces and millions of trees have been planted. However, this has not yielded any significant effect to help solve the problem of land degradation and the success rate has been minimal [31]. The reasons for failures include poor watershed management approaches that were especially focus on physical soil and water conservation practices, but not based on scientific reasoning like constructing structure without determining the amount of runoff expected [32].
In developing countries such as Ethiopia where the livelihood of about 85% of the population is based on subsistent farming [33,34], experiencing recurrent droughts [35] coupled with the negligible use of fertilizers due to their lack of affordability [36], makes maintaining soil fertility and productivity a crucial issue [34]. In order to maintain these, we need to identify areas and land use types with high risk of soil erosion in order to plan and implement the best-suited soil and water resource management measures, which requires reliable environmental data such as soil loss rate.
There are various soil erosion models, e.g.,: the European soil erosion model (EUROSEM) [37], the water erosion prediction project (WEPP) [38], the Limberg soil erosion model (LISEM) [39], the chemical runoff and erosion from agricultural management system (CREAMS), the universal soil loss equation (USLE) and its revised version—the revised universal soil loss equation (RUSLE) [40]. According to Morgan [41], the models used to compute soil erosion are categorized as physical, stochastic and empirical ones. Empirical soil erosion models such as USLE/RUSLE estimate soil loss by taking climate, topography, soil type and land use practices into consideration [40]. USLE was the most widely used erosion model [42] for decades. RUSLE accompanied with a computer program that facilitates calculations [42] has improved the means of computing soil erosion than USLE. The advancements are due to its improved soil texture-based erodibility factor, its consideration of conservation-practice values, slope and it has an improved cover-management factor that enables it to compute long term average annual soil erosion [40].
RUSLE, however, has a few drawbacks such as, its output quality is mainly determined by the input data and the directions it is given by the expert during processing, which could lead to personal bias and error [43]. RUSLE fails to take effects of gully erosion and dispersive soils into account [44]. According to a comparative study of various soil erosion models, RUSLE’s sensitivity is far less to rainfall than to land cover than process-based models [43]. RUSLE’s application is limited to the estimation of annual soil loss in longer time period for smaller areas [44]. Kinnell [45] noted that RUSLE/USEL model lacks runoff factor, consequentially it may overestimate soil loss. In addition, it does not consider various parts and decomposition states of plant materials in its decomposition parameter [46]. Moreover, it does not predict sediment pathways from hill slopes to water bodies [47].
RUSLE does not only offer an input type of response [48], rather it provides a privilege of adopting it to local conditions which made it to be a widely applicable tool in the prediction of erosion [40,47,48]. The RUSLE model works equally well for general estimation and comparison of water erosion on the scale of continents or large regions [49,50] and for smaller individual catchment areas [51,52]. It has a wide application in predicting soil erosion and in assessing the spatial patterns of soil loss [26,53,54,55] and has a wide application in many parts of the world [26,47,48,53,54,56,57,58,59,60,61,62]. It has been used in various modifications in all climatic zones [63]. Many studies tested this model in regions where erosion can easily contribute to severe soil degradation—like rangelands [64,65] or sub-Saharan Africa [66], tropical areas with heavy rains [67]. RUSLE has been adopted to Ethiopian conditions [68]. It is eventually applied in estimating soil erosion [54,69,70] and in exploring the impact of land use land cover change on soil erosion [13,71]. Moreover, it is known for giving the best overall results, especially on such small watersheds. Soil erosion models integrated with GIS are used to assess the spatial distribution of soil loss, to identify areas of concern and to simulate possible management scenarios [53,70].
We targeted the Welmel catchment in the Genale Dawa Basin because, we wanted to assess potential areas for SWC practices across different topographic, climatic and land uses practices across the watershed. Although soil erosion has already been widely studied in Ethiopia, in this particular part of the country, despite the presence of soil loss, the rate of soil loss and its impacts are poorly understood [72], which hinders the development of strategic planning for soil conservation and sustaining a planned project across the river basin. Furthermore, soil sensitivity to erosion varies across the landscape due to the differences in the geomorphologic and land cover attributes. Therefore, we have tested that RUSLE can be used in identifying high soil loss areas in relation to land use practices and climate. It could equip decision-makers with the information required to develop and implement sustainable soil management strategies. Thus, this study has aimed at evaluating the rate of soil loss in the Welmel catchment for different geomorphologic and land cover types.

2. Materials and Methods

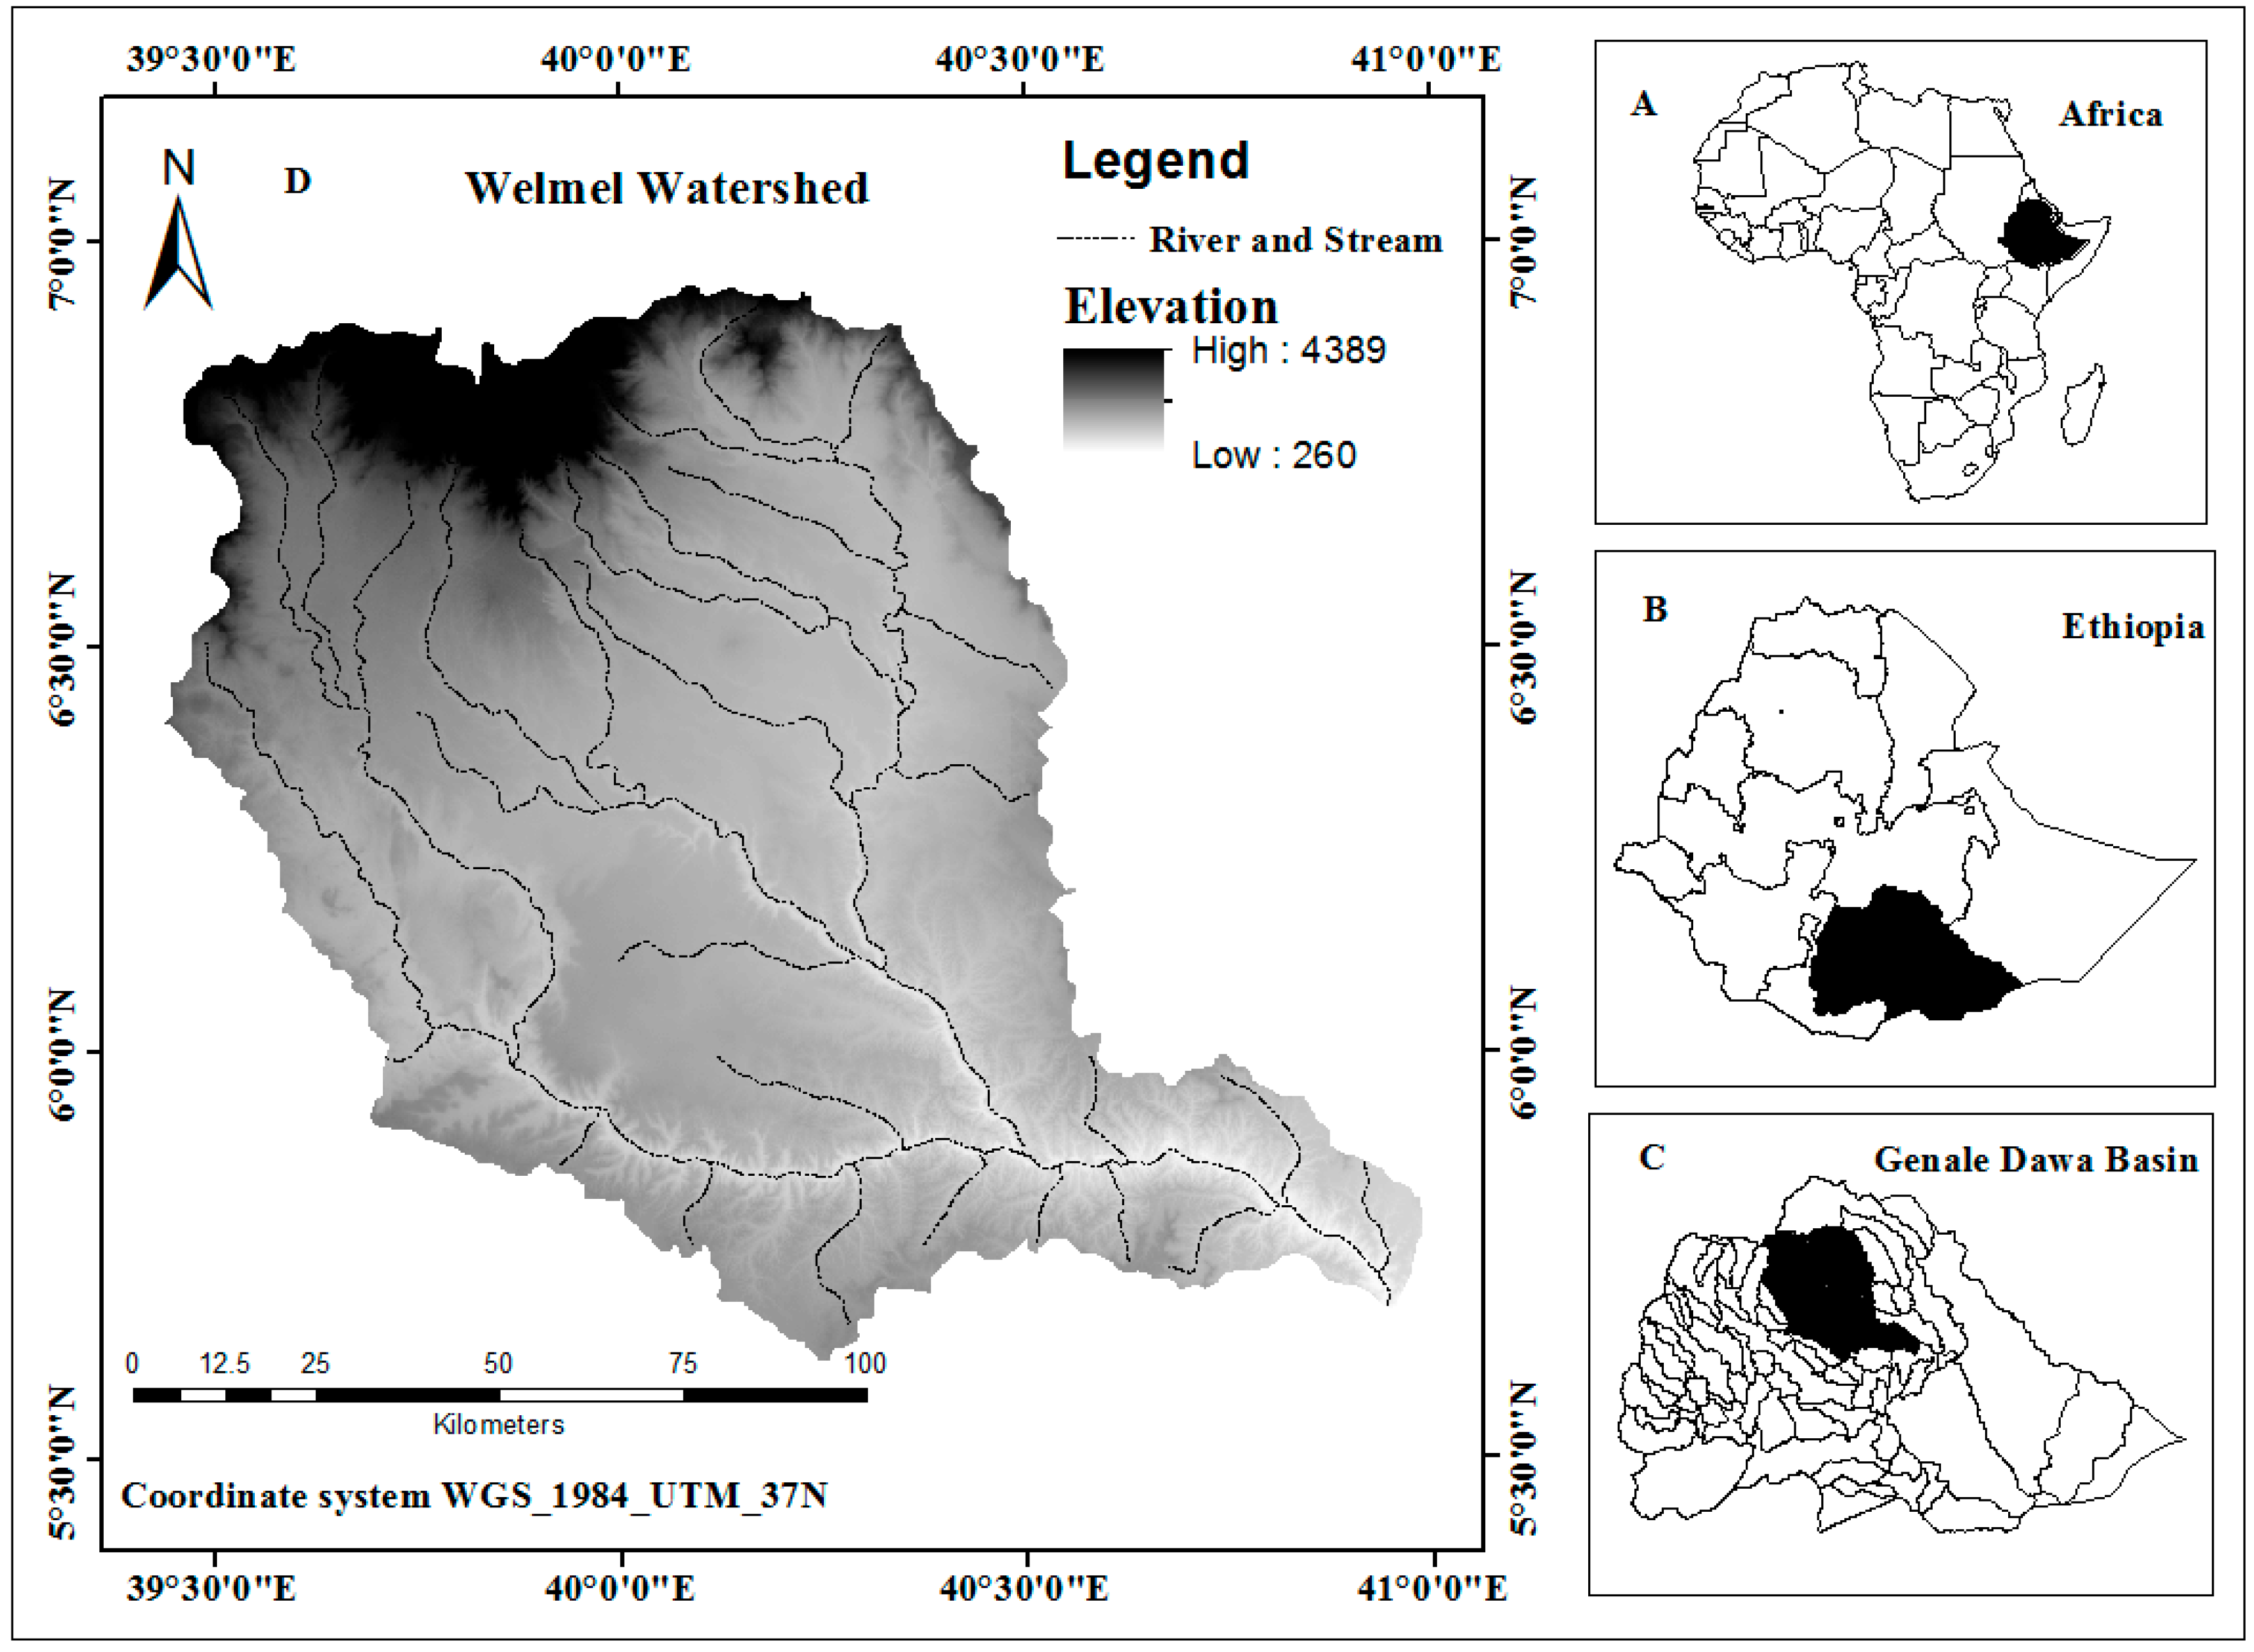
2.1. Description of the Study Area

The Welmel watershed covers an area of 14,055 km2 extending between 5°0′0″ N–7°45′00″ N latitude and 39°0′0″ E–41°15′0″ E longitude with an elevation ranging from 260 to 4389 m ASL. It crosses the Adaba, Berberi, Goba, Delomana, Harena, Madawalabu and Gura-Damelo administrative districts of Oromia regional state, southeastern Ethiopia (Figure 1). Most parts of it have an arid or semi-arid climate that is prone to drought and erratic rainfall [4,73]. The northern part of the watershed has a bimodal rainfall distribution as in most parts of southeastern Ethiopia—from February to May (the “short rains”) with a peak in April, and from June to September (the “long rains”) with a peak in August [74]. The land cover of the watershed encompasses dense forest in the northern part and open forest in the middle of the watershed; however, the lower altitude southern part of the study area is characterized by shrublands, grasslands and degraded bare grounds [73].

2.2. Data Collection and Source

Primary and secondary data sources were used in the process of estimating soil loss in the Welmel watershed. Satellite images of the watershed were obtained from Landsat 8. Two hundred and eighty-five training data points were collected from field visits, using a global positioning system (GPS). Seventeen-year-long (2000 to 2016) monthly rainfall data were obtained from the National Meteorology Agency (NMA) of Ethiopia for three meteorological stations in the Welmel watershed (Figure 1). The satellite images were captured in January of the year 2016 and its characteristics are presented in Table 1.

2.3. Interpolation for Precipitation

Various convenient interpolation methods have been developed to simulate precipitation spatially [75,76]. The Thiessen Polygon (TP) and Inverse Separate Weighted (IDW) methods are the foremost well-known deterministic and both have been utilized at changing spatial and transient scales due to their straightforward nature [77]. Geostatistical methods, such as the Ordinary Kriging (OK), Co-Kriging (CK) and all the kriging variants, use the spatial correlation structure among observed data to estimate the spatial distribution of precipitation [77,78].

2.4. Soil Erosion Model Selection Criteria and Erosion Modeling

The RUSLE model, since the late twentieth century, is extensively being used to estimate soil erosion [16,25,33] and to prioritize soil erosion risk areas [34,35]. It represents how land use, soil, climate and topography could affect rill as well as interrill soil erosion caused by raindrop [37]. Soil erosion conservation plan and development guides for different land-cover conditions such as crop land and forest have extensively used the revised universal soil loss equation (RUSLE) model outputs [59]. Moreover, RUSLE’s advantages stem from its compatibility with GIS and the use of existing data [59]. When utilized in conjunction with raster-based GIS, the RUSLE can identify areas of soil loss on a cell-by-cell premise and classify the extent of soil loss within the watershed [59]. Thus, we used the RUSLE model to estimate soil loss adapted to Ethiopian conditions by Hurni [68].
RUSLE equation:
A = R ∗ K ∗ LS ∗ C ∗ P
where:
  • A = computed average annual soil loss in tons ha−1 year−1
  • R = rainfall-runoff erosivity factor (MJ mm ha−1 h1 year−1)
  • K = soil erodibility factor (tons ha h ha−1 MJ−1 mm−1)
  • LS = slope length and steepness factor (dimensionless)
  • C = cover management factor (dimensionless, ranges from zero to one)
  • P = conservation practice factor (dimensionless, ranges from zero to one)

2.4.1. Rainfall Erosivity (R) Factor

The obtained seventeen-year series of monthly rainfall data were interpolated to assign a unique 30-m gridded value across the catchment after computing the mean annual rainfall (Table 1). Afterwards, the Rainfall erosivity factor (R) was computed using Hurni’s empirical equation for Ethiopian conditions [68], given as:
R = −8.12 + (0.562 ∗ P)
where: P = annual rainfall (mm year−1)
The inversed distance weighting (IDW) toolset in ArcGIS 10.3 (Environmental Systems Research Institute (ESRI), Release, Redlands, CA (https://www.esri.com) software was used to generate an estimated surface from this scattered set of point data.

2.4.2. Soil Erodibility (K) Factor

Soil erodibility relies on soil and/or geological characteristics, such as parent material, texture (mainly silt fraction), structure/porosity of surface horizons and organic matter content. Erodibility (K) factor values were taken from the Food and Agriculture Organization of the United Nations (FAO) soil data [79]. The erodibility of a soil is an expression of its inherent resistance to particle detachment and transport by rainfall [40]. We computed the K-factor value for the study area as suggested by [80] and [68] based on soil color, in conjunction with the type of soil unit (Table 2). Soil types were determined according to IUSS [81].

2.4.3. Topographic (LS) Factors

Amount of soil loss per unit area is directly proportional to the length of the slope (L). The length of the slope is defined as the distance from the point of origin of the overland flow to the point at which either the slope decreases to the degree that deposition begins or runoff water enters a well-defined canal. Soil loss is highly influenced by slope steepness than slope length and soil loss has maximized with an increase in steepness [42]. In the RUSLE model, the influence of topography on soil erosion is estimated by slope length (L) and slope steepness (S) combined as a single index, which expresses the ratio of soil loss [73].
Using Equation (3), the topographic (LS) factor was computed from a slope map and a flow accumulation map, which provided us with the LS-factor layer [82]. The standard slope steepness of 9% and slope length of 22.6 m is used to represent the ratio of topographiC-factor.
L S = [ Q a M 22.13 ] y × ( 0.065 + 0.045 × S g + 0.0065 × S g 2 )
where LS = topographic factors; Qa = flow accumulation grid; Sg = grid slope percentage; M = grid size (x*y), y = dimensionless exponent that assumes the value of 0.2–0.5 [42] The values of exponent M for different slopes depends on slope steepness, for slope exceeding 45% has an M value of 0.5 and for slopes 3%–4.5%, 1%–3% and less than 1% M has a value of 0.4, 0.3 and 0.2, respectively.
Initially, the 30-m-resolution digital elevation model (DEM) data obtained from ASTER GDEM version 2 (30 m) [83] A product of METI and NASA ASTER DEM [84], was cropped to our zone of interest. From this, a depression-less DEM was generated and used in the process of determining flow accumulation. After determining the length and steepness for each grid cell, the LS-factor was then computed by multiplying L and S values to produce the LS-factor layer. Slope length is the horizontal distance from the origin of overland flow to the point where deposition begins [40]. However, soil loss induced by overland flow depends on the area per unit of contour length contributing runoff to that point, and therefore may bear little relation with the distance to the upslope border of the field. For this reason, we had to replace the slope length unit with the unit-contributing area [61]. The upslope contributing area is the area from which the water flows within a given grid cell [85].

2.4.4. Cover (C) Factor

The cover (C) factor is defined as the ratio of soil loss from land of a particular vegetation cover to the corresponding soil loss from continuously fallow land [42]. For the preparation of land use land cover (LULC) map and cover factor (C) values of the study area Landsat 8 satellite image of 30-m resolution, which was captured in January 2016 from (www.usgs.com), was used (Table 3). The classified image accuracy was evaluated using 285 ground truth points collected across the watershed. We used satellite imagery with minimum cloud cover (<5%), which ensures sufficient image clarity to detect vegetation cover. The Enhanced Thematic Mapper Plus (ETM+) acquired in January 2016 was used. In total, three satellite images were combined to form a mosaic, in order to cover the study area and thereafter the study area was extracted from the mosaic. The descriptions of the acquired image data are presented (Table 1).
Several steps were employed in processing the images, including pre-processing, designing of classification scheme, preparation of normalized difference vegetation index (NDVI) and supervised and unsupervised classification of the images. These applications were carried out using ERDAS IMAGINE 9.1 [86]. While undertaking an image classification procedure (Figure 2), classification accuracy was cross-checked using the ground control points (GCP) collected from the watershed area (Leica Geosystems, 2003). The cover factor value (C) for each land use and land cover type was assigned based on different previous studies (Table S1).
For the LULC classification, an overall accuracy and kappa (k^) of 93.19% and 0.91, respectively, were achieved. The highest accuracy was achieved for forest and the lowest for grassland, due to pixel confusion with agricultural or fallow land (Table S2)

2.4.5. Supporting Conservation Practice Factor (P)

The supporting practice factor (P) is the ratio of corresponding soil loss to a specific cultivation practice, with upslope and downslope tillage modifying the flow pattern, direction and volume of runoff [40]. Thus, its values were assigned to each local soil management practice and corresponding values as suggested by [68]. In the absence of permanent management factor and management practice data, the value of the conservation factor (P) was derived from a combination of land use and slope data [42,54,61].
To derive the P-factor, LULC maps were divided into two classes, i.e., agricultural and non-agricultural classes, where, the value P = 1 is assigned to agricultural land and other different values to non-agricultural land (Table 2). The agricultural land was extracted from the other LULC classes and then classified according to their corresponding slopes and P-factor values were assigned as suggested by [42]. By merging the two criteria, i.e., LULC class and slope, the conservation factor map layer was produced.

2.5. Soil Loss Potential Map Based on Maps of R, K, LS, C and P-Factor

Based on the criteria set, all RUSLE factors were generated and multiplied using the ArcGIS 10.3 software raster calculator to get the annual soil loss of the Welmel catchment based on Equation (1). Figure 3 shows the methodology flow chart for the RUSLE model, which estimates soil loss.
For the estimation and mapping of the spatial distribution of soil loss in the study area, all five parameter maps, with a similar coordinate system, were discretized to a grid with 30 × 30-m cell size. The layers were then multiplied pixel-by-pixel, using Equation (1) and the raster calculator Geoprocessing tool in the Arc GIS 10.3 environment.
In identifying priority areas for conservation planning, the study area’s soil loss potential was first categorized into different severity classes according to FAO’s basis of classification [89]. The Soil Loss Tolerance (SLT) value was used as a basis for the categorization of the severity classes. Accordingly, the study area was divided into seven different SLT severity classes [40].

3. Results

3.1. Rainfall Erosivity (R) Factor

Annual average precipitation of the study area amounted to 835.2 mm year−1, varying between 690.0 mm year−1 and 939.7 mm year−1 (Table 1). In particular, the northern part of the watershed experiences higher rainfall. The northern part of the watershed exhibited high values of Rainfall Erosivity factor (R) which was estimated to be from 441 to 518 MJ mm ha−1 h1 year−1 (Figure 4a).

3.2. Soil Erodibility (K) Factor

The Welmel catchment area has eight soil types (Table 2), i.e., eutric cambisols, chromic cambisolscambisols, leptosols (formerly lithosols), rendzic leptosols—developed from limestones (formerly rendzinas), chromic luvisols, pellic vertisols and chromic vertisols. The largest area is occupied by chromic vertisols and rendzic leptosols (altogether, 49% of the studied area; Table 2). Their K-factors are 0.24 and 0.26 tons ha−1 MJ−1 mm−1, respectively (Table 2, Figure 4b). eutric cambisols have the highest K-factor (0.34 tons ha−1 MJ−1 mm−1) and cover a considerable part of the watershed, i.e., 13.07% of the studied area (Table 2), mostly in the southwest of the studied area (Figure 4b). Congruous susceptibility to erosion (K values) was given by Kidane and colleagues [90] for similar soil classification units occurring within Abay basin in central part of Ethiopia.

3.3. Topographic (LS) Factors

The LS-factor value of the study area ranged from 0.19 to 19 (Figure 4c). The northern and southern parts of the study area are characterized by steep slopes and some fragmented hills, while the extended part of the watershed from east to west has gentle slopes. The largest area with the highest LS-factor of about 19 was observed in the northern and southern parts of the watershed (Figure 4c).

3.4. Cover and Management (C) FACTOR

Using the Landsat image, the study area was classified into seven major LULC classes, i.e., forest, settlement, open grassland, agricultural land, degraded forest, open woodland and bare land (Table 3). Agricultural land has the greatest coverage of the Welmel watershed (23.61%), followed by open woodland (19.42%) and forest (16.49%), while bare land occupies the least (6.32%) (Table 3). The largest areas with the lowest C-factor are seen in the north of the watershed, which is covered by forest and open grassland (Table 3, Figure 4d).

3.5. Supporting Conservation Practice Factor (P)

A combination of LULC classes and slope was used in computing P factor and provided us with conservation factor maps for the watershed (Figure 4e). The P-factor for the agricultural land appeared to be the highest for the steepest slopes (Table 4). The lowest P-factor value was observed in the central part of the watershed (Figure 4e).

3.6. Soil Loss Potential

The amount of average annual soil loss in the Welmel watershed is estimated at 31 t ha−1 year−1 (Table 5) The study area was divided into seven different soil loss potential (SLT) severity classes (Table 5; Figure 4f). About 11,284 km2 (80.3%) of the Welmel watershed has a total annual soil loss not exceeding 11 tons ha−1 year−1. The rest of the land, which covers 2771 km2 (19.7%), is classified as having high to extremely high SLT, where soil loss ranges between 11 and 168 tons ha−1 year−1 (Table 5; Figure 4f).

4. Discussion

4.1. Soil Loss Potential

The average annual soil loss estimated for the Welmel watershed, i.e., 31 tons ha−1 year−1 (Figure 4f, Table 5), is comparable to the average annual losses calculated on a global scale estimated in the range 30–40 tons ha−1 year−1 [7]. However, it is over 3 times higher than in European countries—Italy, Austria or Slovenia—most exposed to erosion [50] and it is comparable to that of erosion prone hillslope farmlands of mountainous catchments in Poland [91]. Similarly, a much lower rate of erosion than at our study area, amounting to around 7 tons ha−1 year−1, was estimated within Soummam watershed in Northeast Algeria, which was proposed to be attributed to much less rainfall and lower Rainfall Erosivity (R) factor (70.64 MJ mm ha−1 h1 year−1) than that at Welmel [92]. Higher erosion rate than at Welmel was commonly registered in some rangeland areas. For instance, in Northern Iran, the average yearly sediment load was estimated to be about 51 tons ha−1 year−1 [93]. In another example, average annual soil loss, of about 44 tons ha−1 year−1, is reported within the heavily eroded lands in the northern part of Morocco [94]. High soil loss values (66–77 tons ha−1 year−1) were also obtained for the agricultural areas of Spain, where olive groves cover leads to intensification of erosion processes [95]. Similarly, in areas most threatened by erosion, such as Chinese Loess Plateau, average soil erosion of a watershed can reach almost 80 tons ha−1 year−1 [96]. Moreover, in extreme cases in this region the mean value of annual soil loss exceeds 130 tons ha−1 year−1 [97].
The average annual soil loss observed at the study area is much higher than the “tolerable” soil loss in Ethiopia, which should be less than 18 tons ha−1 year−1 [68]. Nevertheless, it is very close to the mean soil loss in the country (29.9 tons ha−1 year−1) [72]. However, the soil loss profile over Ethiopia shows strong spatial variation. Hence, the estimated average value at Welmel is moderate in comparison to that estimated by similar studies conducted in various parts of Ethiopia [22,26,54,55,69,98,99,100,101]. The lowest soil loss estimates for Ethiopia were observed at the Medego watershed, 9.63 tons ha−1 year−1 [69], while the highest ones were observed at the Chemoga watershed in the river Blue Nile’s (Abbay) basin, 93 tons ha−1 year−1 [32]. An area’s soil loss value varies depending on land use and land cover. For instance, Hurni [99] estimated the soil loss for the Ethiopian highlands to be 12 tons ha−1 year−1 and that of cultivated fields (cropland) in the highlands to be 42 tons ha−1 year−1, whereas the estimated average annual soil loss of the South Wollo highlands for the entire Borena Woreda is 27 tons ha−1 year−1 [26]. In addition, Gelagay and colleagues [55] estimated the average annual soil loss at the Koga watershed to be 47.4 tons ha−1 year−1. Amdihun and colleagues [102] estimate the average annual soil loss in the Blue Nile (Abay) basin at 67.7 tons ha−1 year−1. However, it should be noted that the amount of soil loss varies over time depending on land management type [100].
Welmel watershed being part of the Bale ecoregion of Ethiopia, hosted a large scale conversion of forest land into cropland between the years 1973 and 2015, which intensified soil erosion and eventually resulted in gully erosion [73]. Similarly, in Medego watershed in Northern Tigray, Ethiopia, the highest soil loss was recorded in croplands and steeper slopes (>300) with poor vegetation cover [69]. A similar finding has also been witnessed in Wendo Genet watershed, Ethiopia [70]. A comparative study using seven erosion models in humid (west of Leuven, Belgium) and semi-arid (Arizona, USA) watersheds has shown that vegetation cover appeared to be one of the most influential factors determining soil erosion [46]. Multiple studies have demonstrated that conversion of forest land into other land use, mainly to cropland, intensifies soil loss [26,54,89].
Even though the estimated soil loss in the Welmel watershed is moderate in comparison to estimates elsewhere in Ethiopia, it exceeded the maximum tolerable soil loss, i.e., the Soil Loss Tolerance (SLT) [42], denoting the presence of a soil erosion problem. SLT denotes the maximum allowable soil loss that will sustain optimum agricultural productivity [42]. The threshold level of SLT is controversial and different sources propose different permissible values: Morgan [41] estimated its maximum to be 15–20 tons ha−1 year−1, a generally acceptable mean tolerable soil loss to be 11 tons ha−1 year−1, and the recommended value for sensitive areas to be below 2 tons ha−1 year−1. For instance, in many European countries, the tolerated soil loss is set at 2 tons ha−1 year−1, depending on the vulnerability of the soil to erosion [41]. In the Welmel watershed, the most common severity class of soil loss is the low soil loss class, i.e., soil loss in 66.8% of the studied area is below 5 tons ha−1 year−1 (Figure 4f, Table 5). It should be noted that a large share of these areas occurs in the north-western part of the catchment. The observed low value of soil losses in the study area is mainly due to the presence of forests which protects the soil from eroding. Both the rainfall erosivity (R) as topographic (LS) factors indicates the high possibility of occurrence of erosion following any deforestation at the watershed, especially if the land is going to be converted into agricultural land. By contrast, the area of the extremely severe class, i.e., soil loss exceeding 60 tons ha−1 year−1, is large, covering 11.6% of the studied area (Figure 4f, Table 5), which may result in severe environmental and agricultural problems affecting the local population unless effective adaptation and mitigation measures are taken by the authorities. This can be a significant problem because the areas classified as severely affected by erosion have the largest share and concentration in the most densely populated fragments of the Welmel watershed. Moreover, they overlap the regions covered by the most erodible soils—eutric cambisols.

4.2. R, K, LS, C and P-Factor

High variation in the amount of soil loss, i.e., seven different soil loss potentials, was observed in different parts of the Welmel watershed (Figure 4f, Table 5). This variation is induced by the studied factors included in Equation (1) (R, K, LS, C and P-factor). We believe that these factors are closely interdependent. For instance, rainfall erosivity (R) (Figure 4a) is highly dependent on the spatial distribution of rainfall in the watershed (Table 1), which is also significantly influenced by topographic variability [41]. The northern part of the studied area has higher R and LS values (Figure 4a and Figure 3c). The observed high value of R in the northern part of Welmel is much higher than that of Kalu Ganga River Basin in Sri Lanka, which ranged from 269.70 to 454.07 MJ mm ha−1 h1 year−1 [103]. On the other hand our finding is comparable to that observed in Blue Nile’s basin of Ethiopia [66]. Further, values of soil erodibility (K) were determined by soil type (Table 2), which is also related to its characteristic properties. The K-factor is determined by the cohesive force between the soil particles and may vary depending on the development of its structure [41,104]. The K-factor increases with increasing intensity of soil cultivation practices, as is widely observed in the tropics [103,105]. It may also vary depending on the vegetation cover [41], i.e., the C-factor. The higher the erodibility value of the soil, the more erosion it suffers when exposed to the same intensity of rainfall, splash or surface flow [106]. The relatively low values of topographic (LS) factors (Figure 3c) we observed contradict the common assumption that topographic (LS) factors must be proportional to slope gradient. However, LS-factor affects the cover and management factor (C) and the supporting conservation practice factor (P), which determine the way runoff flows on slopes [105]. The C and P-factors are closely related to the final result of the soil loss, which can be seen on the obtained result maps (Figure 4d, and Figure 3e,f). Area management type determines multiple processes related to loss and degradation of soil. Thus, from the above it follows that the impact of particular factors on soil loss is highly complex. Similar relationship was reported by multiple studies conducted in environments similar to the study site [66,103].

4.3. Causes of Soil Loss

The Welmel watershed’s erosion risks varied significantly across different land use, slope and rainfall regimes (Table 1, Table 2, Table 3, Table 4 and Table 5; Figure 4). A higher risk of erosion occurs in the interface between agricultural and vegetated landscapes, where forest cover is currently being converted to cropland and settlement (Table 3). Thus, erosion is lower in areas under natural vegetation cover, such as forest [54]. Therefore, working on each coefficient specifically on management practices are very essential to improve the land cover dynamics of the watershed and then soil erodibility of the area by modifying soil characteristics and improving infiltration rate of water.
The soil erosion in these landscapes must have been aggravated by the fact that the forest canopy has started to open up, slopes are steep and rainfall intensity is high. Similar findings were reported for the Medego watershed of Northern Tigray, where the highest soil loss is recorded in steeper slopes (>30°) and low in flat areas (<2°) [69]. Likewise, in open and steep slope areas in the north of the Welmel watershed, soil erosion is high. On the other hand, modest erosion is observed in flat farmlands. Most of the cultivated landscapes of the watershed are in very flat to gentle slope areas and as a result are not affected by sheet and rill erosion.

4.4. Consequences of Soil Loss

Soil loss is a major factor in causing food insecurity in Ethiopia [107]. The impact of soil erosion is great in several different sectors, but is particularly acute in relation to agricultural productivity and may cause a 2%–3% average annual reduction in agricultural gross domestic product (GDP) [23]. The country loses about $106 million annually due to soil erosion [13]. Soil loss causes a decline in crop yields by reducing rooting depth and soil water holding capacity and depleting soil organic matter and nutrients, which eventually causes soil acidity [41]. In the investigated watershed, soil erosion and thereby a decrease in the soil’s productivity may lead to the conversion of arable land to rangelands. As intensive grazing and soil compaction by livestock are factors that can significantly accelerate soil erosion in these environmental conditions [108], it may lead to a further increase in the pace of slope processes.

5. Conclusions and Future Prospects

In our study, of the Welmel watershed, erosion risks vary significantly across different categories of land use, slope and rainfall. A high risk of soil erosion occurs at the interface between agricultural and vegetated landscape, where forest cover is currently being converted to cropland and settlement. Previous studies confirm that human activity is the main erosion factor in the scale of Ethiopia [13,72,90].
However, soil erosion from farmlands in flat lands is modest. Nevertheless, croplands located in the interface between the extensively cultivated landscape and the vegetated landscape is highly affected by sheet and rill erosion.
The results obtained after the application of the RUSLE model indicate that the lowest actual erosion threat currently occurs in the northern part of the basin—the least populated and most covered with forests. Higher threat of erosion on the largest scale occurs in the southwest and southeast of the watershed. A further growth of population in this region along with a decrease in productivity of eroded soils may lead to an increase in the amount of cultivated areas in north-western part of Welmel watershed. Due to the high potential erosion risk as indicated by high values of rainfall erosivity (R) and slope (LS) factors, this can be a significant threat to this part of the watershed.
For long-term soil resource conservation and erosion prevention, especially in steeper slopes, protection and conservation of existing vegetation cover and/or replanting forest in cultivated lands is deemed necessary for the sustainability of soil and other natural resources in the study area. It would be particularly effective if these measures were incorporated into government soil and water conservation (SWC) planning. In the areas currently exposed to slope processes, anti-erosion actions already used in Ethiopia should be promoted: the stone bunds with protective walls or trenches (terracing), agroforestry in croplands, exclosures on steep slopes (protection from humans and livestock) and check dams in gullies [72]. Further studies should be undertaken to reveal the main drivers of soil erosion losses in the farming system, i.e., socio-economic, agronomic and biophysical factors that trigger soil erosion, in order to establish the best soil and water conservation measures that should be implemented in these areas and the watershed as a whole. As stated by a study carried out in central Ethiopia [109], local community’s indigenous knowledge on soil erosion processes and solutions should also be considered as important part of any anti-erosional soil protection and land restoration program. This is necessary to gain knowledge about rational land use and preserve the usability of agricultural land in many areas of tropical Africa. Furthermore, the results obtained with the application of the presented model should also be evaluated on selected representative research plots in the field.

Supplementary Materials

The following are available online at https://www.mdpi.com/2073-4395/10/6/777/s1, Table S1: Cropping and land-cover (C) factor values used based on previous studies. Table S2: Land Use Land Cover (LULC) classification accuracy and Kappa.

Author Contributions

Conceptualization, E.G.G., and Y.M.T.; validation, E.G.G., Y.Y. and J.J.; formal analysis, Y.M.T.; investigation, E.G.G.; resources, Y.M.T.; data curation, L.T.Y., Y.M.T.; writing—original draft preparation, Y.M.T., E.G.G., and J.J.; writing—review and editing, R.P., M.Ś. and E.G.G.; visualization, J.J. and Y.M.T.; supervision, E.G.G.; project administration, E.G.G.; funding acquisition, E.G.G., L.T.Y., Y.M.T. and R.P. All authors have read and agreed to the published version of the manuscript.

Funding

This work was financially supported by the internal grant and transportation and logistics were provided by Mada Walabu University, Ethiopia.

Acknowledgments

We would like to acknowledge Mada Walabu University for financial and in-kind support. We would like to acknowledge the local administration in the Welmel watershed and the National Meteorological Agency of Ethiopia for their kind cooperation and help. We would like to acknowledge Megersa Tafesse who also helped us in administrative issues at Mada Walabu University. We acknowledge Justyna Boniecka, John Clarke and Samuel Owusu for their help on the text.

Conflicts of Interest

The authors declare no conflict of interest. The funders had no role in the design of the study; in the collection, analyses or interpretation of data; in the writing of the manuscript or in the decision to publish the results.

References

  1. McCarthy, J.J.; Canziani, O.F.; Leary, N.A.; Dokken, D.J.; White, K.S. IPCC Climate Change 2001: Impacts, Adaptation, and Vulnerability; Cambridge University Press: Cambridge, UK, 2001; pp. 1–94. [Google Scholar]
  2. Stocker, T.F.; Qin, D.; Plattner, G.K.; Tignor, M.; Allen, S.K.; Boschung, J.; Nauels, A.; Xia, Y.; Bex, V.; Midgley, P.M. IPCC Climate change 2013: The physical science basis. In Working Group I Contribution to the Fifth Assessment Report of the Intergovernmental Panel on Climate Change; Cambridge University Press: Cambridge, UK, 2013; pp. 1–570. [Google Scholar]
  3. Hansen, H.S. PSSD-Planning System for Sustainable Development; NERI Technical Report No.351; National Environmental Research Institute: Roskilde, Denmark, 2001; pp. 1–110. [Google Scholar]
  4. Gebrehiwot, S.G.; Bewket, W.; Gärdenäs, A.I.; Bishop, K. Forest cover change over four decades in the Blue Nile Basin, Ethiopia: Comparison of three watersheds. Reg. Environ. Chang. 2014, 14, 253–266. [Google Scholar] [CrossRef]
  5. Dotterweich, M.; Stankoviansky, M.; Minár, J.; Koco, Š.; Papčo, P. Human induced soil erosion and gully system development in the Late Holocene and future perspectives on landscape evolution: The Myjava Hill Land, Slovakia. Geomorphology 2013, 201, 227–245. [Google Scholar] [CrossRef]
  6. Tully, K.; Sullivan, C.; Weil, R.; Sanchez, P. The State of soil degradation in sub-Saharan Africa: Baselines, trajectories, and solutions. Sustainability 2015, 7, 6523–6552. [Google Scholar] [CrossRef] [Green Version]
  7. Pimentel, D.; Harvey, C.; Resosudarmo, P.; Sinclair, K.; Kurz, D.; Mcnair, M.; Crist, S.; Shpritz, L.; Fitton, L.; Saffouri, R.; et al. Environmental and Economic Costs of Soil Erosion and Conservation Benefits. Science 1995, 267, 1117–1123. [Google Scholar] [CrossRef] [PubMed] [Green Version]
  8. Ma, X.; He, Y.; Xu, J.; Van Noordwijk, M.; Lu, X. Spatial and temporal variation in rainfall erosivity in a Himalayan watershed. Catena 2014, 121, 248–259. [Google Scholar] [CrossRef]
  9. Wynants, M.; Kelly, C.; Mtei, K.; Munishi, L.; Patrick, A.; Rabinovich, A.; Nasseri, M.; Gilvear, D.; Roberts, N.; Boeckx, P.; et al. Drivers of increased soil erosion in East Africa’s agro-pastoral systems: Changing interactions between the social, economic and natural domains. Reg. Environ. Chang. 2019, 19, 1909–1921. [Google Scholar] [CrossRef] [Green Version]
  10. De Alba, S.; Lindstrom, M.; Schumacher, T.E.; Malo, D.D. Soil landscape evolution due to soil redistribution by tillage: A new conceptual model of soil catena evolution in agricultural landscapes. Catena 2004, 58, 77–100. [Google Scholar] [CrossRef] [Green Version]
  11. Van Oost, K.; Quine, T.A.; Govers, G.; De Gryze, S.; Six, J.; Harden, J.W.; Ritchie, J.C.; McCarty, G.W.; Heckrath, G.; Kosmas, C.; et al. The impact of agricultural soil erosion on the global carbon cycle. Science 2007, 318, 626–629. [Google Scholar] [CrossRef]
  12. Dotterweich, M. The history of human-induced soil erosion: Geomorphic legacies, early descriptions and research, and the development of soil conservation-A global synopsis. Geomorphology 2013, 201, 1–34. [Google Scholar] [CrossRef]
  13. Bekele, T. Effect of Land Use and Land Cover Changes on Soil Erosion in Ethiopia. Int. J. Agric. Sci. Food Technol. 2019, 5, 26–34. [Google Scholar] [CrossRef] [Green Version]
  14. Bayramin, İ.; Dengiz, O.; Baskan, O.; Mehmet, P. Soil Erosion Risk Assessment with ICONA Model; Case Study: Beypazarı Area. Turk. J. Agric. For. 2003, 27, 105–116. [Google Scholar]
  15. Pimentel, D.; Burgess, M. Soil Erosion Threatens Food Production. Agriculture 2013, 3, 443–463. [Google Scholar] [CrossRef] [Green Version]
  16. Reusing, M.; Schneider, T.; Ammer, U. Modelling soil loss rates in the Ethiopian Highlands by integration of high resolution MOMS-02/D2-stereo-data in a GIS. Int. J. Remote Sens. 2000, 21, 1885–1896. [Google Scholar] [CrossRef]
  17. Schiettecatte, W.; Gabriels, D.; Cornelis, W.M.; Hofman, G. Enrichment of Organic Carbon in Sediment Transport by Interrill and Rill Erosion Processes. Soil Sci. Soc. Am. J. 2008, 72, 50. [Google Scholar] [CrossRef] [Green Version]
  18. Nkonya, E.; Johnson, T.; Kwon, H.Y.; Kato, E. Economics of Land Degradation in Sub-Saharan Africa. In Economics of Land Degradation and Improvement—A Global Assessment for Sustainable Development; Nkonya, E., Mirzabaev, A., von Braun, J., Eds.; Springer: New York, NY, USA, 2016; pp. 215–260. [Google Scholar]
  19. Usman, S.; Omar, G.; Onokebhagbe, V. Soil problems in dryland environment of sub-Saharan Africa: A review of the impact on soil erosion and desertification. Biol. Environ. Sci. J. Trop. 2017, 14, 1–7. [Google Scholar]
  20. Eaton, D. The economics of soil erosion: A model of farm decision-making. Int. Inst. Environ. Dev. 1996, 1–48. [Google Scholar] [CrossRef]
  21. Lower Valley of the Omo. Available online: https://whc.unesco.org/en/list/17/ (accessed on 19 May 2020).
  22. FAO. Ethiopian Highlands Reclamation Study; Final Report; FAO: Rome, Itay, 1986; Volume 1, pp. 1–334. [Google Scholar]
  23. FAO. The State of Food and Agriculture Social Protection and Agriculture: Breaking the Cycle of Rural Poverty; FAO: Rome, Italy, 2015; Volume 81, pp. 1–129. [Google Scholar]
  24. Stewart, Z.P.; Pierzynski, G.M.; Middendorf, B.J.; Prasad, P.V.V. Approaches to improve soil fertility in sub-Saharan Africa. J. Exp. Bot. 2020, 71, 632–641. [Google Scholar] [CrossRef] [PubMed] [Green Version]
  25. Haileslassie, A.; Priess, J.; Veldkamp, E.; Teketay, D.; Lesschen, J.P. Assessment of soil nutrient depletion and its spatial variability on smallholders’ mixed farming systems in Ethiopia using partial versus full nutrient balances. Agric. Ecosyst. Environ. 2005, 108, 1–16. [Google Scholar] [CrossRef]
  26. Shiferaw, A. Estimating soil loss rates for soil conservation planning in the Borena Woreda of South Wollo Highlands, Ethiopia. J. Sustain. Dev. Afr. 2011, 13, 87–106. [Google Scholar]
  27. Hurni, H.; Herweg, K.; Portner, B.; Liniger, H. Soil Erosion and Conservation in Global Agriculture. In Land Use and Soil Resources; Braimoh, A.K., Vlek, P.L.G., Eds.; Springer: New York, NY, USA, 2008; pp. 41–71. [Google Scholar]
  28. Sonneveld, B.G.; Keyzer, M.A.; Albersen, P.J. A Non-Parametric Analysis of Qualitative and Quantitative Data for Erosion Modeling: A Case Study for Ethiopia. In Sustaining the Global Farm, Proceedings of the 10th International Soil Conservation Organization Meeting, West Lafayette, IN, USA, 24–29 May 1999; Stott, D.E., Mohtar, R.H., Steinhardt, G.C., Eds.; Purdue University and the USDA-ARS National Soil Erosion Research Laboratory: West Lafayette, IN, USA, 1999; pp. 979–993. [Google Scholar]
  29. Sertu, S. Degraded Soil of Ethiopia and their management. Proceeding of FAO/ISCW expert consultation on management of degraded soils in Southern and East Africa. In Proceedings of the 2nd Network Meeting, Pretoria, South Africa, 18–22 September 2000. [Google Scholar]
  30. Bewket, W. Soil and water conservation intervention with conventional technologies in northwestern highlands of Ethiopia: Acceptance and adoption by farmers. Land Use Policy 2007, 24, 404–416. [Google Scholar] [CrossRef]
  31. Desta, L.; Carucci, V.; Wendem-Ageňehu, A.; Abebe, Y. Community Based Participatory Watershed Development: A Guideline; Ministry of Agriculture and Rural Development: Addis Ababa, Ethiopia, 2005; pp. 1–62.
  32. Adimassu, Z.; Mekonnen, K.; Yirga, C.; Kessler, A. Effect of soil bunds on runoff, soil and nutrient losses, and crop yield in the central highlands of ethiopia. Land Degrad. Dev. 2014, 25, 554–564. [Google Scholar] [CrossRef]
  33. Baye, T.G. Poverty, peasantry and agriculture in Ethiopia. Ann. Agrar. Sci. 2017, 15, 420–430. [Google Scholar] [CrossRef]
  34. Tamene, L.; Vlek, P.L.G. Soil erosion studies in Northern Ethiopia. Land Use Soil Resour. 2008, 180, 73–100. [Google Scholar]
  35. Gebregeorgis, E.G.; Robertson, I.; Koprowski, M.; Zhou, L.P.; Gao, P.; Williams, A.P.; Eshetu, Z.; Wils, T.H.G. Historical droughts recorded in extended Juniperus procera ring-width chronologies from the Ethiopian Highlands. Int. J. Biometeorol. 2020, 64, 739–753. [Google Scholar] [CrossRef] [Green Version]
  36. Otsuka, K.; Larson, D.F. An African Green Revolution: Finding Ways to Boost Productivity on Small Farms; Springer: New York, NY, USA, 2013; pp. 1–281. [Google Scholar]
  37. Morgan, R.P.C.; Quinton, J.N.; Smith, R.E.; Govers, G.; Prosen, J.W.A.; Auerswald, K.; Chisci, G.; Torri, D.; Styczen, M.E.; Folley, A.J.V. The European Soil Erosion Model. (EUROSEM): Documentation and User Guide; Silsoe College, Cranfield University: Silsoe, UK, 1998; pp. 1–30. [Google Scholar]
  38. Laflen, J.M.; Lane, L.J.; Water, G.R. WEPP A new generation of erosion prediction technology. J. Soil Water Conserv. 1991, 46, 34–38. [Google Scholar]
  39. Boardman, J.; Favis-Mortlock, D. Modelling Soil Erosion by Water; Springer Verlag: Berlin/Heidelberg, Germany, 1998; Volume 55, pp. 1–6. [Google Scholar]
  40. Renard, K.; Foster, G.; Weesies, G.; McCool, D.; Yoder, D. Predicting Soil Erosion by Water: A Guide to Conservation Planning with the Revised Universal Soil Loss Equation (RUSLE); Handbook No. 703; Department of Agriculture, Agriculture: Washington, DC, USA, 1997; pp. 1–384.
  41. Morgan, R.P.C. Soil Erosion and Conservation, 3rd ed.; Blackwell Publishing Ltd.: Malden, MA, USA; Oxford, UK; Victoria, Australia, 2005; pp. 1–298. [Google Scholar]
  42. Wischmeier, W.H.; Smith, D.D. Predicting Rainfall Erosion Losses—a Guide to Conservation Planning; USDA, Science and Education Administration: Hyattsville, MD, USA, 1978; Volume 46, pp. 34–38.
  43. Nearing, M.A. A Single, Continuous Function for Slope Steepness Influence on Soil Loss. Soil Sci. Soc. Am. J. 1997, 61, 917–919. [Google Scholar] [CrossRef]
  44. Rowlands, L. Erosion and Sediment Control-WSUD During the Construction Phase of Land Development. In Approaches to Water Sensitive Urban Design: Potential, Design, Ecological Health, Urban Greening, Economics, Policies, and Community Perceptions; Sharma, A.K., Gardner, T., Begbie, D., Eds.; Elsevier Inc.: Cambridge, USA, 2018; pp. 163–176.45. [Google Scholar]
  45. Kinnell, P.I.A. Why the universal soil loss equation and the revised version of it do not predict event erosion well. Hydrol. Process. 2005, 19, 851–854. [Google Scholar] [CrossRef]
  46. Nearing, M.A.; Jetten, V.; Baffaut, C.; Cerdan, O.; Couturier, A.; Hernandez, M.; Le Bissonnais, Y.; Nichols, M.H.; Nunes, J.P.; Renschler, C.S.; et al. Modeling response of soil erosion and runoff to changes in precipitation and cover. Catena 2005, 61, 131–154. [Google Scholar] [CrossRef]
  47. Cohen, M.J.; Shepherd, K.D.; Walsh, M.G. Empirical reformulation of the universal soil loss equation for erosion risk assessment in a tropical watershed. Geoderma 2005, 124, 235–252. [Google Scholar] [CrossRef]
  48. Erol, A.; Koşkan, Ö; Başaran, M.A. Socioeconomic modifications of the universal soil loss equation. Solid Earth 2015, 6, 1025–1035. [Google Scholar] [CrossRef] [Green Version]
  49. Panagos, P.; Borrelli, P.; Poesen, J.; Ballabio, C.; Lugato, E.; Meusburger, K.; Montanarella, L.; Alewell, C. The new assessment of soil loss by water erosion in Europe. Environ. Sci. Policy 2015, 54, 438–447. [Google Scholar] [CrossRef]
  50. Fenta, A.A.; Tsunekawa, A.; Haregeweyn, N.; Poesen, J.; Tsubo, M.; Borrelli, P.; Panagos, P.; Vanmaercke, M.; Broeckx, J.; Yasuda, H.; et al. Land susceptibility to water and wind erosion risks in the East Africa region. Sci. Total Environ. 2020, 703, 1–20. [Google Scholar] [CrossRef] [PubMed]
  51. Ganasri, B.P.; Ramesh, H. Assessment of soil erosion by RUSLE model using remote sensing and GIS—A case study of Nethravathi Basin. Geosci. Front. 2016, 7, 953–961. [Google Scholar] [CrossRef] [Green Version]
  52. Phinzi, K.; Ngetar, N.S. The assessment of water-borne erosion at catchment level using GIS-based RUSLE and remote sensing: A review. Int. Soil Water Conserv. Res. 2019, 7, 27–46. [Google Scholar] [CrossRef]
  53. Amsalu, T.; Mengaw, A. GIS Based Soil Loss Estimation Using RUSLE Model: The Case of Jabi Tehinan Woreda. Nat. Resour. 2014, 5, 616–626. [Google Scholar] [CrossRef] [Green Version]
  54. Bewket, W.; Teferi, E. Assessment of soil erosion hazard and prioritization for treatment at the watershed level: Case study in the Chemoga watershed, Blue Nile basin, Ethiopia. Land. Degrad. Dev. 2009, 20, 609–622. [Google Scholar] [CrossRef]
  55. Gelagay, H.S.; Minale, A.S. Soil loss estimation using GIS and Remote sensing techniques: A case of Koga watershed, Northwestern Ethiopia. Int. Soil Water Conserv. Res. 2016, 4, 126–136. [Google Scholar] [CrossRef] [Green Version]
  56. Beskow, S.; Mello, C.R.; Norton, L.D.; Curi, N.; Viola, M.R.; Avanzi, J.C. Soil erosion prediction in the Grande River Basin, Brazil using distributed modeling. Catena 2009, 79, 49–59. [Google Scholar] [CrossRef]
  57. Galdino, S.; Sano, E.E.; Andrade, R.G.; Grego, C.R.; Nogueira, S.F.; Bragantini, C.; Flosi, A.H.G. Large-scale Modeling of Soil Erosion with RUSLE for Conservationist Planning of Degraded Cultivated Brazilian Pastures. Land Degrad. Dev. 2016, 27, 773–784. [Google Scholar] [CrossRef] [Green Version]
  58. Karaburun, A. Estimation of C factor for soil erosion modeling using NDVI in Buyukcekmece watershed. Ozean J. Appl. Sci. 2010, 3, 77–85. [Google Scholar]
  59. Millward, A.A.; Mersey, J.E. Adapting the RUSLE to model soil erosion potential in a mountainous tropical watershed. Catena 1999, 38, 109–129. [Google Scholar] [CrossRef]
  60. Naqvi, H.R.; Mallick, J.; Devi, L.M.; Siddiqui, M.A. Multi-temporal annual soil loss risk mapping employing Revised Universal Soil Loss Equation (RUSLE) model in Nun Nadi Watershed, Uttrakhand (India). Arab. J. Geosci. 2013, 6, 4045–4056. [Google Scholar] [CrossRef]
  61. Shi, Z.H.; Cai, C.F.; Ding, S.W.; Wang, T.W.; Chow, T.L. Soil conservation planning at the small watershed level using RUSLE with GIS: A case study in the Three Gorge Area of China. Catena 2004, 55, 33–48. [Google Scholar] [CrossRef]
  62. Terranova, O.; Antronico, L.; Coscarelli, R.; Iaquinta, P. Soil erosion risk scenarios in the Mediterranean environment using RUSLE and GIS: An application model for Calabria (southern Italy). Geomorphology 2009, 112, 228–245. [Google Scholar] [CrossRef]
  63. Ghosal, K.; Das Bhattacharya, S. A Review of RUSLE Model. J. Indian Soc. Remote Sens. 2020, 48, 689–707. [Google Scholar] [CrossRef]
  64. Renard, K.G.; Simanton, J.R. Application of RUSLE to rangelands. In Watershed Planning and Analysis in Action. In Proceedings of the IR Conference Watershed Mgt/IR Div/; ASCE: Durango, CO, USA, 1990; pp. 164–173. [Google Scholar]
  65. Spaeth, K.E.; Pierson, F.B.; Weltz, M.A.; Blackburn, W.H. Evaluation of USLE and RUSLE estimated soil loss on rangeland. J. Range Manag. 2003, 56, 234–246. [Google Scholar] [CrossRef]
  66. Tamene, L.; Le, Q.B. Estimating soil erosion in sub-Saharan Africa based on landscape similarity mapping and using the revised universal soil loss equation (RUSLE). Nutr. Cycl. Agroecosyst. 2015, 102, 17–31. [Google Scholar] [CrossRef]
  67. Ranzi, R.; Le, T.H.; Rulli, M.C. A RUSLE approach to model suspended sediment load in the Lo river (Vietnam): Effects of reservoirs and land use changes. J. Hydrol. 2012, 422–423, 17–29. [Google Scholar] [CrossRef]
  68. Hurni, H. An Ecosystem Approach to Soil Conservation. In Soil Erosion and Conservation; Swaify, E.L., Samir, A., Moldenhauer, W.C., Eds.; Soil Conservation Society of America: Ankeny, IA, USA, 1985; Volume 73, pp. 759–771. [Google Scholar]
  69. Brhane, G.; Mekonen, K. Estimating Soil Loss Using Universal Soil Loss Equation (USLE) for Soil Conservation planning at Medego Watershed, Northern Ethiopia Gebreyesus. J. Am. Sci. 2009, 5, 58–69. [Google Scholar]
  70. Sisay, A.; Chalie, N.; Girmay, Z.; Takele, G.; Tolera, A. Landscape-scale soil erosion modeling and risk mapping of mountainous areas in eastern escarpment of Wondo Genet Watershed, Ethiopia. Int. Res. J. Agric. Sci. Soil Sci. 2014, 4, 107–116. [Google Scholar] [CrossRef]
  71. Tadesse, L.; Suryabhagavan, K.V.; Sridhar, G.; Legesse, G. Land use and land cover changes and Soil erosion in Yezat Watershed, North Western Ethiopia. Int. Soil Water Conserv. Res. 2017, 5, 85–94. [Google Scholar] [CrossRef] [Green Version]
  72. Haregeweyn, N.; Tsunekawa, A.; Nyssen, J.; Poesen, J.; Tsubo, M.; Tsegaye Meshesha, D.; Schütt, B.; Adgo, E.; Tegegne, F. Soil erosion and conservation in Ethiopia: A review. Prog. Phys. Geogr. 2015, 39, 750–774. [Google Scholar] [CrossRef] [Green Version]
  73. Danano, D.; Grunder, M.; Hurni, H.; Goshu, K.; Wolde-Aregay, B.; Chadhokar, P.; Zeleke, G. Guidelines for Development Agents on Soil and Water Conservation in Ethiopia, 2nd ed.; Centre for Development and Environment (CDE), University of Bern, with Bern Open Publishing (BOP): Bern, Switzerland, 2016; pp. 1–132. [Google Scholar]
  74. Degefu, M.A.; Rowell, D.P.; Bewket, W. Teleconnections between Ethiopian rainfall variability and global SSTs: Observations and methods for model evaluation. Meteorol. Atmos. Phys. 2017, 129, 173–186. [Google Scholar] [CrossRef] [Green Version]
  75. Bayat, B.; Zahraie, B.; Taghavi, F.; Nasseri, M. Evaluation of spatial and spatiotemporal estimation methods in simulation of precipitation variability patterns. Theor. Appl. Climatol. 2013, 113, 429–444. [Google Scholar] [CrossRef]
  76. Xu, W.; Zou, Y.; Zhang, G.; Linderman, M. A comparison among spatial interpolation techniques for daily rainfall data in Sichuan Province, China. Int. J. Climatol. 2015, 35, 2898–2907. [Google Scholar] [CrossRef]
  77. Ly, S.; Charles, C.; Degré, A. Different methods for spatial interpolation of rainfall data for operational hydrology and hydrological modeling at watershed scale: A review. Biotechnol. Agron. Soc. Env. 2013, 17, 392–406. [Google Scholar]
  78. Li, J.; Heap, A.D. Spatial interpolation methods applied in the environmental sciences: A review. Environ. Model. Softw. 2014, 53, 173–189. [Google Scholar] [CrossRef]
  79. FAO Declaration of the World Summit on Food Security. Available online: http://www.fao.org/fileadmin/templates/wsfs/Summit/Docs/FinalDeclaration/WSFS09_Declaration.pdf. (accessed on 12 December 2014).
  80. Helldén, U. An Assessment of Woody Biomass, Community Forests, Land Use and Soil Erosion in Ethiopia. A Feasibility Study on the Use of Remote Sensing and GIS [Geographical Information System]-Analysis for Planning Purposes in Developing Countries; Lund University Press: Lund, Sweden, 1987; p. 75. [Google Scholar]
  81. IUSS. World Reference Base for Soil Resources 2014, update 2015. In International Soil Classification System for Naming Soils and Creating Legends for Soil Map; IUSS: Rome, Italy, 2015; p. 75. [Google Scholar]
  82. Griffin, M.L.; Beasley, D.B.; Fletcher, J.J.; Foster, G.R. Estimating soil loss on topographically nonuniform field and farm units. J. Soil Water Conserv. 1988, 43, 326–331. [Google Scholar]
  83. ASTER Global Digital Elevation Model (GDEM). Available online: https://ssl.jspacesystems.or.jp/ersdac/GDEM/E/4.html (accessed on 27 May 2020).
  84. ASTER Global Digital Elevation Map Announcement. Available online: https://asterweb.jpl.nasa.gov/gdem.asp (accessed on 27 May 2020).
  85. Mitasova, H.; Hofierka, J.; Zlocha, M.; Iverson, L.R. Modelling topographic potential for erosion and deposition using GIS. Int. J. Geogr. Inf. Syst. 1996, 10, 629–641. [Google Scholar] [CrossRef]
  86. Hexagon Geospatial. Available online: https://www.hexagongeospatial.com (accessed on 27 May 2020).
  87. Jensen, J.R. Introductory Digital Image Processing: A Remote Sensing Perspective, 2nd ed.; Prentice Hall Inc.: Upper Saddle River, NJ, USA, 1995; pp. 1–318. [Google Scholar]
  88. Kayet, N.; Pathak, K.; Chakrabarty, A.; Sahoo, S. Evaluation of soil loss estimation using the RUSLE model and SCS-CN method in hillslope mining areas. Int. Soil Water Conserv. Res. 2018, 6, 31–42. [Google Scholar] [CrossRef]
  89. FAO/UNEP. Provisional Methodology for Assessment and Mapping of Desertification; FAO/UNEP: Rome, Italy, 1984. [Google Scholar]
  90. Kidane, M.; Bezie, A.; Kesete, N.; Tolessa, T. The impact of land use and land cover (LULC) dynamics on soil erosion and sediment yield in Ethiopia. Heliyon 2019, 5, 1–13. [Google Scholar] [CrossRef] [PubMed] [Green Version]
  91. Kijowska-Strugała, M.; Bucała-Hrabia, A.; Demczuk, P. Long-term impact of land use changes on soil erosion in an agricultural catchment (in the Western Polish Carpathians). Land Degrad. Dev. 2018, 29, 1871–1884. [Google Scholar] [CrossRef]
  92. Sahli, Y.; Mokhtari, E.; Merzouk, B.; Laignel, B.; Vial, C.; Madani, K. Mapping surface water erosion potential in the Soummam watershed in Northeast Algeria with RUSLE model. J. Mt. Sci. 2019, 16, 1606–1615. [Google Scholar] [CrossRef]
  93. Jafarian, Z.; Beshtar, V.; Kavian, A. Simulation Effects of Improvement and Restoration Operations of Rangeland on Soil Loss using RUSLE Model. Phys. Geogr. Res. Q. 2017, 49, 8–9. [Google Scholar]
  94. El Aroussi, O.; Mesrar, L.; Lakrim, M.; El Garouani, A.; Jabrane, R. Methodollogicall approach for assessing the potentiall risk of soil erosion using remote sensing and GIS in the Oued Ell Malllleh watershed (Pre-Rif, Morocco). J. Mater. Environ. Sci. 2011, 2, 433–438. [Google Scholar]
  95. Barriuso-Mediavilla, A.; Del-Bosque-González, I.; Salas-Tovar, E.; Sanz-Cañada, J. GIS Model for Potential Soil Erosion with the Optimization of RUSLE Equation. Case of Study: Olive Oil PDO in Aragón and Andalucía Regions; Agile: Wageningen, The Netherlands, 2017; pp. 9–12. [Google Scholar]
  96. Pan, J.; Wen, Y. Estimation of soil erosion using RUSLE in Caijiamiao watershed, China. Nat. Hazards 2014, 71, 2187–2205. [Google Scholar] [CrossRef]
  97. Tang, Q.; Xu, Y.; Bennett, S.J.; Li, Y. Assessment of soil erosion using RUSLE and GIS: A case study of the Yangou watershed in the Loess Plateau, China. Environ. Earth Sci. 2015, 73, 1715–1724. [Google Scholar] [CrossRef] [Green Version]
  98. Adugna, A.; Abegaz, A.; Cerdà, A. Soil erosion assessment and control in Northeast Wollega, Ethiopia. Solid Earth Discuss. 2015, 7, 3511–3540. [Google Scholar] [CrossRef]
  99. Hurni, H. Degradation and Conservation of the Resources in the Ethiopian Highlands. Mt. Res. Dev. 1988, 8, 123–130. [Google Scholar] [CrossRef]
  100. Munro, R.N.; Deckers, J.; Haile, M.; Grove, A.T.; Poesen, J.; Nyssen, J. Soil landscapes, land cover change and erosion features of the Central Plateau region of Tigrai, Ethiopia: Photo-monitoring with an interval of 30 years. Catena 2008, 75, 55–64. [Google Scholar] [CrossRef]
  101. Ostovari, Y.; Ghorbani-Dashtaki, S.; Bahrami, H.A.; Naderi, M.; Dematte, J.A.M. Soil loss prediction by an integrated system using RUSLE, GIS and remote sensing in semi-arid region. Geoderma Reg. 2017, 11, 28–36. [Google Scholar] [CrossRef]
  102. Amdihun, A.; Gebremariam, E.; Rebelo, L.M.; Zeleke, G. Suitability and scenario modeling to support soil and water conservation interventions in the Blue Nile Basin, Ethiopia. Theor. Chem. Acc. 2014, 3, 1–13. [Google Scholar] [CrossRef] [Green Version]
  103. Panditharathne, D.L.D.; Abeysingha, N.S.; Nirmanee, K.G.S.; Mallawatantri, A. Application of revised universal soil loss equation (Rusle) model to assess soil erosion in “kalu Ganga” River Basin in Sri Lanka. Appl. Environ. Soil Sci. 2019, 1–15. [Google Scholar] [CrossRef] [Green Version]
  104. Pimentel, D. Soil erosion: A food and environmental threat. Environ. Dev. Sustain. 2006, 8, 119–137. [Google Scholar] [CrossRef]
  105. Angima, S.D.; Stott, D.E.; O’Neill, M.K.; Ong, C.K.; Weesies, G.A. Soil erosion prediction using RUSLE for central Kenyan highland conditions. Agric. Ecosyst. Environ. 2003, 97, 295–308. [Google Scholar] [CrossRef]
  106. Bryan, R.B. Soil erodibility and processes of water erosion on hillslope. Geomorphology 2000, 32, 385–415. [Google Scholar] [CrossRef]
  107. Bekele, W.; Drake, L. Soil and water conservation decision behavior of subsistence farmers in the Eastern Highlands of Ethiopia: A case study of the Hunde-Lafto area. Ecol. Econ. 2003, 46, 437–451. [Google Scholar] [CrossRef]
  108. Taye, G.; Poesen, J.; Vanmaercke, M.; Van Wesemael, B.; Martens, L.; Teka, D.; Nyssen, J.; Deckers, J.; Vanacker, V.; Haregeweyn, N.; et al. Evolution of the effectiveness of stone bunds and trenches in reducing runoff and soil loss in the semi-arid Ethiopian highlands. Z. Geomorphol. 2015, 59, 477–493. [Google Scholar] [CrossRef]
  109. Nigussie, Z.; Tsunekawa, A.; Haregeweyn, N.; Adgo, E.; Nohmi, M.; Tsubo, M.; Aklog, D.; Meshesha, D.T.; Abele, S. Farmers’ Perception about Soil Erosion in Ethiopia. Land Degrad. Dev. 2017, 28, 401–411. [Google Scholar] [CrossRef]
Figure 1. (A) Relative location of Ethiopia to Africa, (B) Genale Dawa Basin relative location with Ethiopia, (C) Welmel Watershed in darker color, relative location with Genale Dawa Basin, and (D) Welmel watershed location map.
Agronomy 10 00777 g001
Figure 2. Satellite image processing flow chart for Land Use Land Cover ((LULC)) map preparation [87].
Agronomy 10 00777 g002
Figure 3. Methodology flow chart showing revised universal soil loss equation (RUSLE) model for soil loss estimation [88].
Agronomy 10 00777 g003
Figure 4. R-factor map (a), K-factor map (b), LS-factor map (c), C-factor map (d), P-factor map (e) and soil loss map (f) of the Welmel catchment.
Agronomy 10 00777 g004
Table 1. Acquired Landsat satellite image characteristics.
Image Captured MonthYear 2016
JanuaryPathRowPathRowPathRow
167551675616855
Table 2. Soil group and K-factor values of Welmel watershed.
Major Soil GroupCoverage in km2Coverage in %K Value
Eutric cambisols183813.070.34
Chromic cambisols9636.850.28
Leptosols8776.240.2
Rendzic leptosols3373240.26
Calcic cambisols140.0990.05
Chromic luvisols2528180.2
Pellic vertisols8896.330.24
Chromic vertisols3573250.24
Total14,055100
Table 3. Land use land cover (LULC) and C-factor values of the Welmel watershed.
LULC ClassesCoverage in km2Coverage in %C Value
Forest231716.490.01
Settlement198714.130.99
Open grassland11137.910.01
Agricultural land331823.610.15
Degraded forest170212.110.05
Open woodland273019.420.06
Bare land8886.320.6
Total14,055100Total
Table 4. Conservation factor (p) value.
Land Use TypeSlope (%)p-Factor
Agricultural land0–50.11
5–100.12
10–200.14
20–300.22
30–500.31
50–1000.43
Other landAll1.00
Source: Wischmeier and Smith [42].
Table 5. Soil loss severity in the Welmel watershed.
Soil Loss (Tons ha−1 Year−1)Severity ClassPriority ClassArea (km2)Total Area Coverage (%)
0–5LowVII938466.8
5–11ModerateVI190013.5
11–20HighV490.35
20–30Very highIV1651.17
30–45SevereIII4913.5
45–60Very severeII4032.9
>60Extreme severeI166311.6
Total14,055100

