Article

Long-Term Fertilization with Potassium Modifies Soil Biological Quality in K-Rich Soils

1
College of Natural Resources and Environment, Northwest A&F University, Yangling 712100, China
2
Key Laboratory of Plant Nutrition and the Agri-Environment in Northwest China, Ministry of Agriculture, Northwest A&F University, Yangling 712100, China
*
Author to whom correspondence should be addressed.
Agronomy 2020, 10(6), 771; https://doi.org/10.3390/agronomy10060771
Submission received: 2 April 2020 / Revised: 24 May 2020 / Accepted: 26 May 2020 / Published: 28 May 2020
(This article belongs to the Special Issue Effects of Agricultural Management on Soil Properties and Health)

Abstract

:
Imbalanced fertilization without potassium (K) is a worldwide phenomenon in K-rich soils, but its long-term effects on soil quality are poorly understood. Here, in a wheat–fallow system with K-rich soil, soil nutrients and enzyme activities involved in C, N, P, and S cycling and microbial community composition were studied in a 27-year field study with three treatments: no fertilizer (CK); mineral N and P fertilizer (NP); and mineral N, P, and K fertilizer (NPK). Results revealed that long-term NP and NPK fertilization significantly increased soil quality index (SQI) scores and wheat grain yield by mediating soil fertility, which was characterized by a significant decline in soil pH and increase in soil organic carbon (SOC), total N, available N (AN), available P (AP), enzymatic activities, and the abundance of total bacteria, fungi, and actinomycetes, when compared to CK. NP exhibited significantly higher SOC, AN, AP, microbial biomass C (MBC) and N (MBN), N-acetyl-glucosaminidase, total bacteria, and fungi values compared to NPK; the opposite was true for soil pH and available K. Notably, the differences in wheat grain yield were not statistically significant, while SQI scores in NP (0.86 ± 0.02) were appreciably higher than NPK (0.79 ± 0.03), which was attributed to the differences in MBC, MBN, and microbial communities. Redundancy analysis (RDA) indicated that SOC was the key variable affecting enzymatic activities and microbial community composition. The partial least squares path model (PLS-PM) revealed that fertilization-induced changes in SQI were primarily associated with soil microbiological properties (e.g., microbial community composition), while fertilization-driven increases in wheat grain yield were regulated by the soil nutrients. These results suggest that long-term NPK fertilization decreases soil biological quality in K-rich soils, and further studies are required to elucidate the underlying mechanisms by which K affects soil quality in agricultural systems.

1. Introduction

Fertilization is the most effective strategy to maintain soil fertility and boost crop production [1]. Primarily, nitrogen (N), phosphorus (P), and potassium (K) are the added nutrients, largely as inorganic fertilizers [2]. However, imbalanced fertilization without N, P, or K remains a worldwide phenomenon [3]. Although crop uptake of K is almost equal to or greater than N uptake, worldwide fertilizer use remains skewed toward N and P; thus, the K status in agricultural soils is decreasing globally [4]. Numerous studies demonstrate that imbalanced fertilization without K is widely employed globally, particularly in areas with K-rich soils, such as Iran [5], Pakistan [6], India [7], and Northwest China [8].
Wheat–fallow is the dominant cropping system in Northwest China, and covers an area of 2 × 10⁶ ha [9]. In this system, smallholder farmers use large amounts of N and P fertilizers, but use little or no K fertilizer [8,10], which is primarily associated with the inconspicuous symptoms of K deficiency and the general notion that soils have adequate K levels [4]. The equivalent crop yields obtained for NP and NPK fertilizers in several long-term field experiments appear to support the practice of imbalanced fertilization without K fertilizer (i.e., conventional fertilization practice, NP) [11,12]. However, long-term fertilization with only N and P can markedly reduce soil K reserves [11,13], implying that such imbalanced fertilization is an unsustainable agricultural practice in the long run. Repeated application of N and P fertilizers resulted in a substantial surplus of these nutrients in agricultural soils [14,15]. Accordingly, substantial soil fertility changes have inevitably occurred in soils as result of N and P accumulation and K depletion, especially soil microbial biomass and diversity [16,17]. However, previous studies have reported inconsistent responses of soil microbial properties to K addition, including positive [18,19] and negative [20,21] effects. Therefore, it is now urgent to comprehensively evaluate soil quality changes in response to long-term imbalanced fertilization without K.
Soil quality is an integrated measure of soil physical, chemical, and biological properties, and a better understanding of soil quality is crucial for maintaining soil fertility and productivity [22]. Nevertheless, soil physicochemical properties are the focus of many long-term field experiments investigating imbalanced fertilization [7,11,13], although soil biological parameters are increasingly used to evaluate soil quality [23,24,25]. A few studies have characterized the long-term effects of imbalanced fertilization on soil microbial properties in grasslands [26], spring wheat–fallow [27], pepper–fallow [28], and winter wheat–summer maize [17] cropping systems, but have paid little attention to K, although most of these studies were conducted in K-deficient soils. Moreover, these previous studies did not use the obtained results to establish a soil quality index (SQI) or analyze the relationships between crop yield and various soil quality parameters.
Long-term K addition could lead to a buildup of available K in soil, particularly in areas with high K reserves [7,11,13,29]. As a consequence of such high levels of soil available K, soil salinity can increase and soil structure can deteriorate [30,31,32,33], which in turn can suppress microbial activity. However, such negative impacts have received less attention [33,34]. In previous studies, the response of soil microbial properties to repeated imbalanced fertilization was measured in soils with low K availability (<100 mg kg−1) [17,28]. Although the response may be completely different when measured in K-rich soils (>150 mg kg−1), direct tests of the response of soil microbial activities to K addition remain rare [35]. Thus, in areas with K-rich soils, a comprehensive evaluation of changes in soil biological properties in response to long-term NP and NPK fertilization is crucial to assess the development of soil quality and to optimize fertilization practices.
Phospholipid fatty acid (PLFA) analysis is a powerful tool for discerning differences in microbial communities affected by management practices and soil factors, when compared with molecular approaches [36,37]. Long-term fertilization experiments are also a powerful tool to better understand how changes in soil fertility and nutrient cycling processes affect croplands [38]. Therefore, in this study, soil chemical variables, enzymatic activities involving C, N, P, and sulfur (S) cycling, and microbial community composition using PLFA analysis were determined in an ongoing long-term 27-year experiment with three fertilizer treatments: balanced fertilizer with N, P, and K (NPK), imbalanced fertilizer with N and P (NP), and no fertilizer (CK). The present study aims to determine whether soil enzymatic activities and microbial community composition had different responses to balanced (i.e., NPK) and conventional fertilization (i.e., NP) in K-rich soil, and to develop an SQI for assessing the current fertilization strategies. The study will contribute to improving K fertilizer management in the K-rich regions such as northwest China.

2. Materials and Methods

2.1. Site and Treatment Description

The study was a long-term field experiment that was established in October 1990 at the Chinese National Soil Fertility and Fertilizer efficiency Monitoring Base for Loessial Soil in Yangling, northwest China (34°17′51″ N, 108°00′48″ E) (520 m a. s. l.). The site has a warm temperate continental monsoon climate with an annual average temperature of 13.0 °C and an annual precipitation of 550 mm. The soil is silty loam (clay, 16.8%; silt, 51.6%; sand, 31.6%) and is derived from loess material and classified as a Eumorphic Anthrosol. The major chemical properties of the 0–20 cm soil layer at the experimental site in 1990 were the following: pH, 8.62; soil organic carbon (SOC), 7.44 g kg−1; total N (TN), 0.93 g kg−1; total P, 0.61 g kg−1; available P (AP, Olsen P), 9.57 mg kg−1; and available K (AK), 191 mg kg−1.
The field experiment included seven treatments in total, which were cropped with a winter wheat–summer fallow system, and were randomly arranged. However, all the treatments were designed without replicates due to practical reasons, thus resulting in statistical problems [39]. Fortunately, the field was not fertilized for two years (1989−1990) to ensure homogeneous soil fertility before the start of the experiment. As a result, the spatial heterogeneity of the representative soil properties (i.e., bulk density, pH, SOC, and TN) was small (coefficient of variance ≤ 6%, n = 33) across the plots at the beginning of the experiment in October, 1990 [39]. There is a relatively large area (21 m × 19 m) for each experimental treatment, thus providing a chance to form a pseudoreplication by dividing each plot into three subplots (7 m × 19 m). Importantly, a uniform fertilizer management and cropping system (winter wheat–summer fallow) had been applied to the field for several decades. Considering the efforts made in 1988 to reduce the spatial variability in soil chemical properties, the size of the plots allowed for subplots, the long-term uniform cropping system, and the 27-year known fertilization history, we believe this is an acceptable rationale for the differences ascribed in each parameter between the CK, NP, and NPK to treatment effects. In order to evaluate soil fertility changes in response to long-term imbalanced fertilization without K and N, P, K balanced fertilization, three of the seven treatments were employed: (1) unfertilized control (CK); (2) imbalanced fertilization: 135 kg N ha−1 yr−1 and 108 kg P2O5 ha−1 yr−1 (NP, similar to the local fertilization practice [39]); and (3) balanced fertilization: 135 kg N ha−1 yr−1, 108 kg P2O5 ha−1 yr−1 and 67.5 kg K2O ha−1 yr−1 (NPK). Fertilizers types were urea, superphosphate, and potassium sulfate for N, P, and K, respectively. All fertilizers were applied as basal fertilization, which was spread on the surface and tilled into the soil with a rotary tiller in early October. Winter wheat was immediately sown following soil tillage and harvested in the following June. At maturity, wheat was harvested manually with sickles from 8 m2 (2 m × 4 m) in each subplot (7 m × 19 m) to determine wheat grain yield (adjusted to a moisture content of 12.5%), according to Liu et al. [40]. Wheat grain yields were calculated as kg ha−1.

2.2. Soil Sampling

Soil samples (0−20 cm) were collected on 10 June 2017, one week after wheat harvest. Each experimental plot was divided into three subplots of approximately equal size (7 m × 19 m) to make the sample numbers meet statistical requirements (n mve, and five soil cores (5 cm diameter) were collected from each subplot and well mixed to form a composite subsample, giving three subsamples per treatment. All samples were immediately transported to the laboratory on ice. The soils were passed through a 2 mm sieve to remove impurities (i.e., roots and stones) and then stored at room temperature for chemical analyses, at 4 °C for enzyme measurements, and at −20 °C for PLFA analysis.

2.3. Soil Property Measurements

Soil pH (soil:water, 1:2.5, Sartorius Basic pH meter PB-10, Goettingen, Germany), SOC (K2Cr2O7 external heating method), TN (Kjeldahl method), available N (AN; the sum of NO3-N and NH4+-N, 2 M KCl extraction, AA3, SEAL, Norderstedt, Germany), AP (0.5 M NaHCO3 extraction, UV2550, Shimadzu, Kyoto, Japan), and AK (1.0 M CH3COONH4 extraction, flame photometer, Aopu, Shanghai, China) were determined following the methods described by Lu [41]. Importantly, the analytical methods of selected chemical properties were same as to these used in 1990. Microbial biomass carbon (MBC) and microbial biomass N (MBN) were analyzed using the chloroform fumigation-incubation methods; the experimentally derived conversion factors were 0.45 for MBC and 0.54 for MBN [42]. For soil enzyme activity, peroxidase (Perox) and phenol oxidase (PhOx) activities were measured spectrophotometrically in a clear 96-well microplate. The potential activities of α-Glucosidase (αG), β-Glucosidase (βG), phosphatase (Pho), sulfatase (Sul), cellobiohydrolase (CBH), and N-Acetyl-glucosaminidase (NAG) were analyzed using microplate fluorometric protocols (Table 1) [16]. The enzymatic activities are expressed in units of nmol h−1 g−1.

2.4. PLFA Analysis

Microbial community structure was determined by a PLFA analysis following the methods described by Ai et al. [16]. To indicate microbial abundance, the concentrations of PLFAs were calculated and expressed in units of nmol g−1. The PLFAs were divided into various taxonomic groups based on previously published PLFA biomarker data [43].

2.5. Developing the SQI

The total data set (TDS) method was used to develop the SQI due to its more accurate assessment compared to the minimum dataset method [24]. According to Andrews et al. [23], a standard scoring function (SSF) was employed to score the TDS indicators and to normalize their observations to a value between 0 and 1.0. Soil chemical properties including pH, SOC, TN, AN, AP, and AK were scored and normalized using the SSF equations described by Liu et al. [24] and Qi et al. [25]. The biological variables without a certain threshold value (i.e., MBC, MBN, enzymatical activities and microbial properties) were taken as “higher is better”. For each biological indicator, the highest value is scored as 1, and observations for other treatments were divided by the highest value to normalize them. After all measured soil properties were scored and weighted, the SQI was calculated using the quality index equation described by Doran and Parkin [22]:
S Q I = i = 1 n W i × S i
where Wi is the assigned weight of each indicator, Si is the indicator score, and n is the number of variables.

2.6. Statistical Analysis

Statistical analyses were conducted using SPSS v18.0 (IBM Corp., New York, NY, USA). For each variable measured, treatment means were compared using Tukey’s multiple comparisons test (p ≤ 0.05), and all data were presented as means ± standard errors of means (n = 3). According to Blair et al. [44], the assumption of randomness in the one-way analysis of variance (ANOVA) cannot be met due to the lack of replication in the field experiment; interpretation of differences between treatments in the ANOVA assumed that there was no systematic variation across the study site because of low initial soil chemical variability. To determine whether soil enzymatic activity and community composition were correlated with soil properties, a redundancy analysis (RDA) was conducted using Canoco for Windows v5.0. Partial least squares path modeling (PLS-PM) was employed to disentangle relationships between soil nutrients, biological properties, crop yield, and SQI scores. Path coefficients were validated using R v.3.3.3 (R Development Core Team, Vienna, Australia) with the plspm package (1000 bootstrap replicates). All figures were plotted using SigmaPlot v12.5 (Systat Software Inc., San Jose, CA, USA).

3. Results

3.1. Effect of Fertilization Regimes on Soil Characteristics

3.1.1. Soil Chemical Properties

Soil chemical properties differed significantly among the CK, NP, and NPK treatments (p < 0.05) (Table 2). Fertilization significantly decreased soil pH, with the values decreasing by 0.24 units in NP and by 0.14 units in NPK, compared with the CK. Noticeably, the pH in NP was typically lower than that in NPK. The SOC content was also significantly different among the three fertilizer treatments, but in contrast to pH, SOC was highest in NP, followed by that in NPK and CK. The pattern was the same for AN and AP, with the highest values in NP and significant differences among all treatments. The TN content was not different between NP and NPK treatments, but in both, it was significantly higher than that in the CK. As expected, the highest AK contents were recorded in the NPK treatment; whereas the difference in AK between NP and CK was not significant. Relative to the initial values in 1990, the CK treatment was characterized by a slight increase in SOC and TN, while the opposite was true of pH, AP, and AK. With the exception of AP, similar trends were observed for pH, SOC, and TN in soils treated with NP and NPK. Notably, compared with the initial value of 191 mg kg−1, the buildup in AK in the NPK treatment was considerable (306.9 mg kg−1), whereas a slight depletion of AK was observed in the NP (178.7 mg kg−1) and the CK (170.3 mg kg−1) treatments.

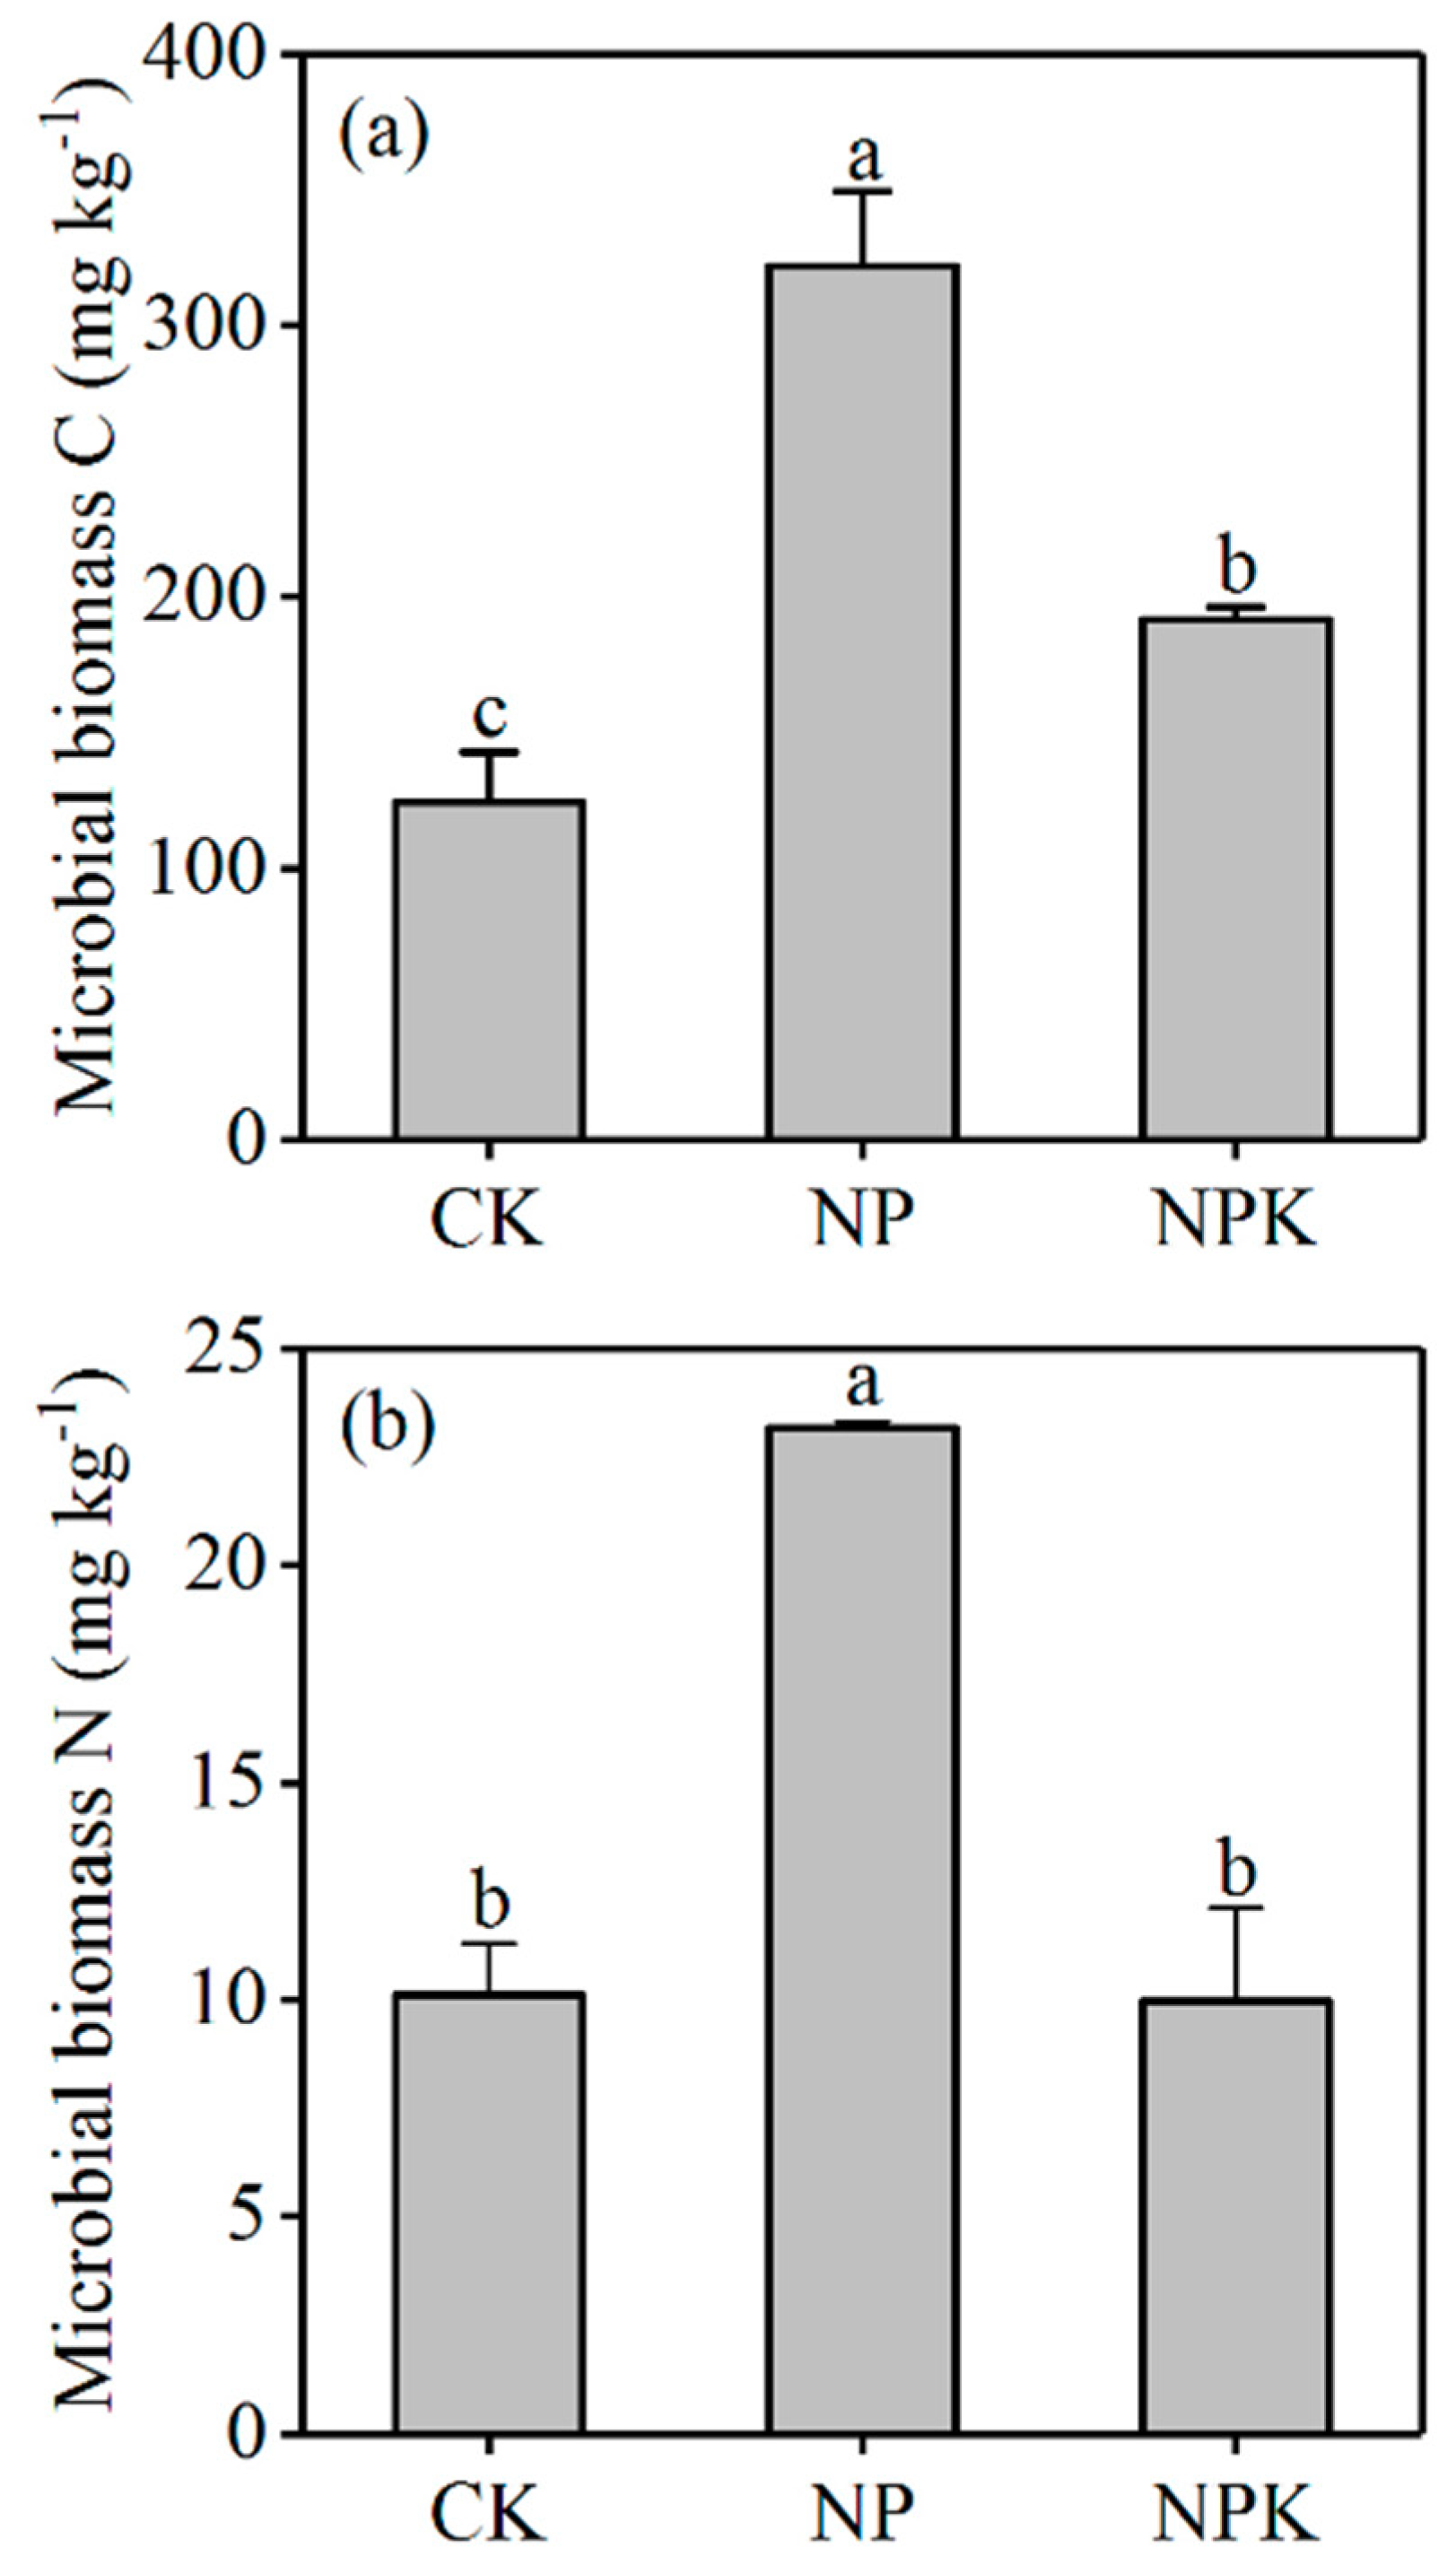
3.1.2. Microbial Biomass C and N

The NP treatment had the highest concentrations of MBC (321 mg kg1) and MBN (23.2 mg kg1), which were significantly higher than those in the CK and notably higher than those in the NPK treatment (Figure 1). The MBC in the NPK treatment was significantly higher than that in the CK, although their MBN values were equivalent.

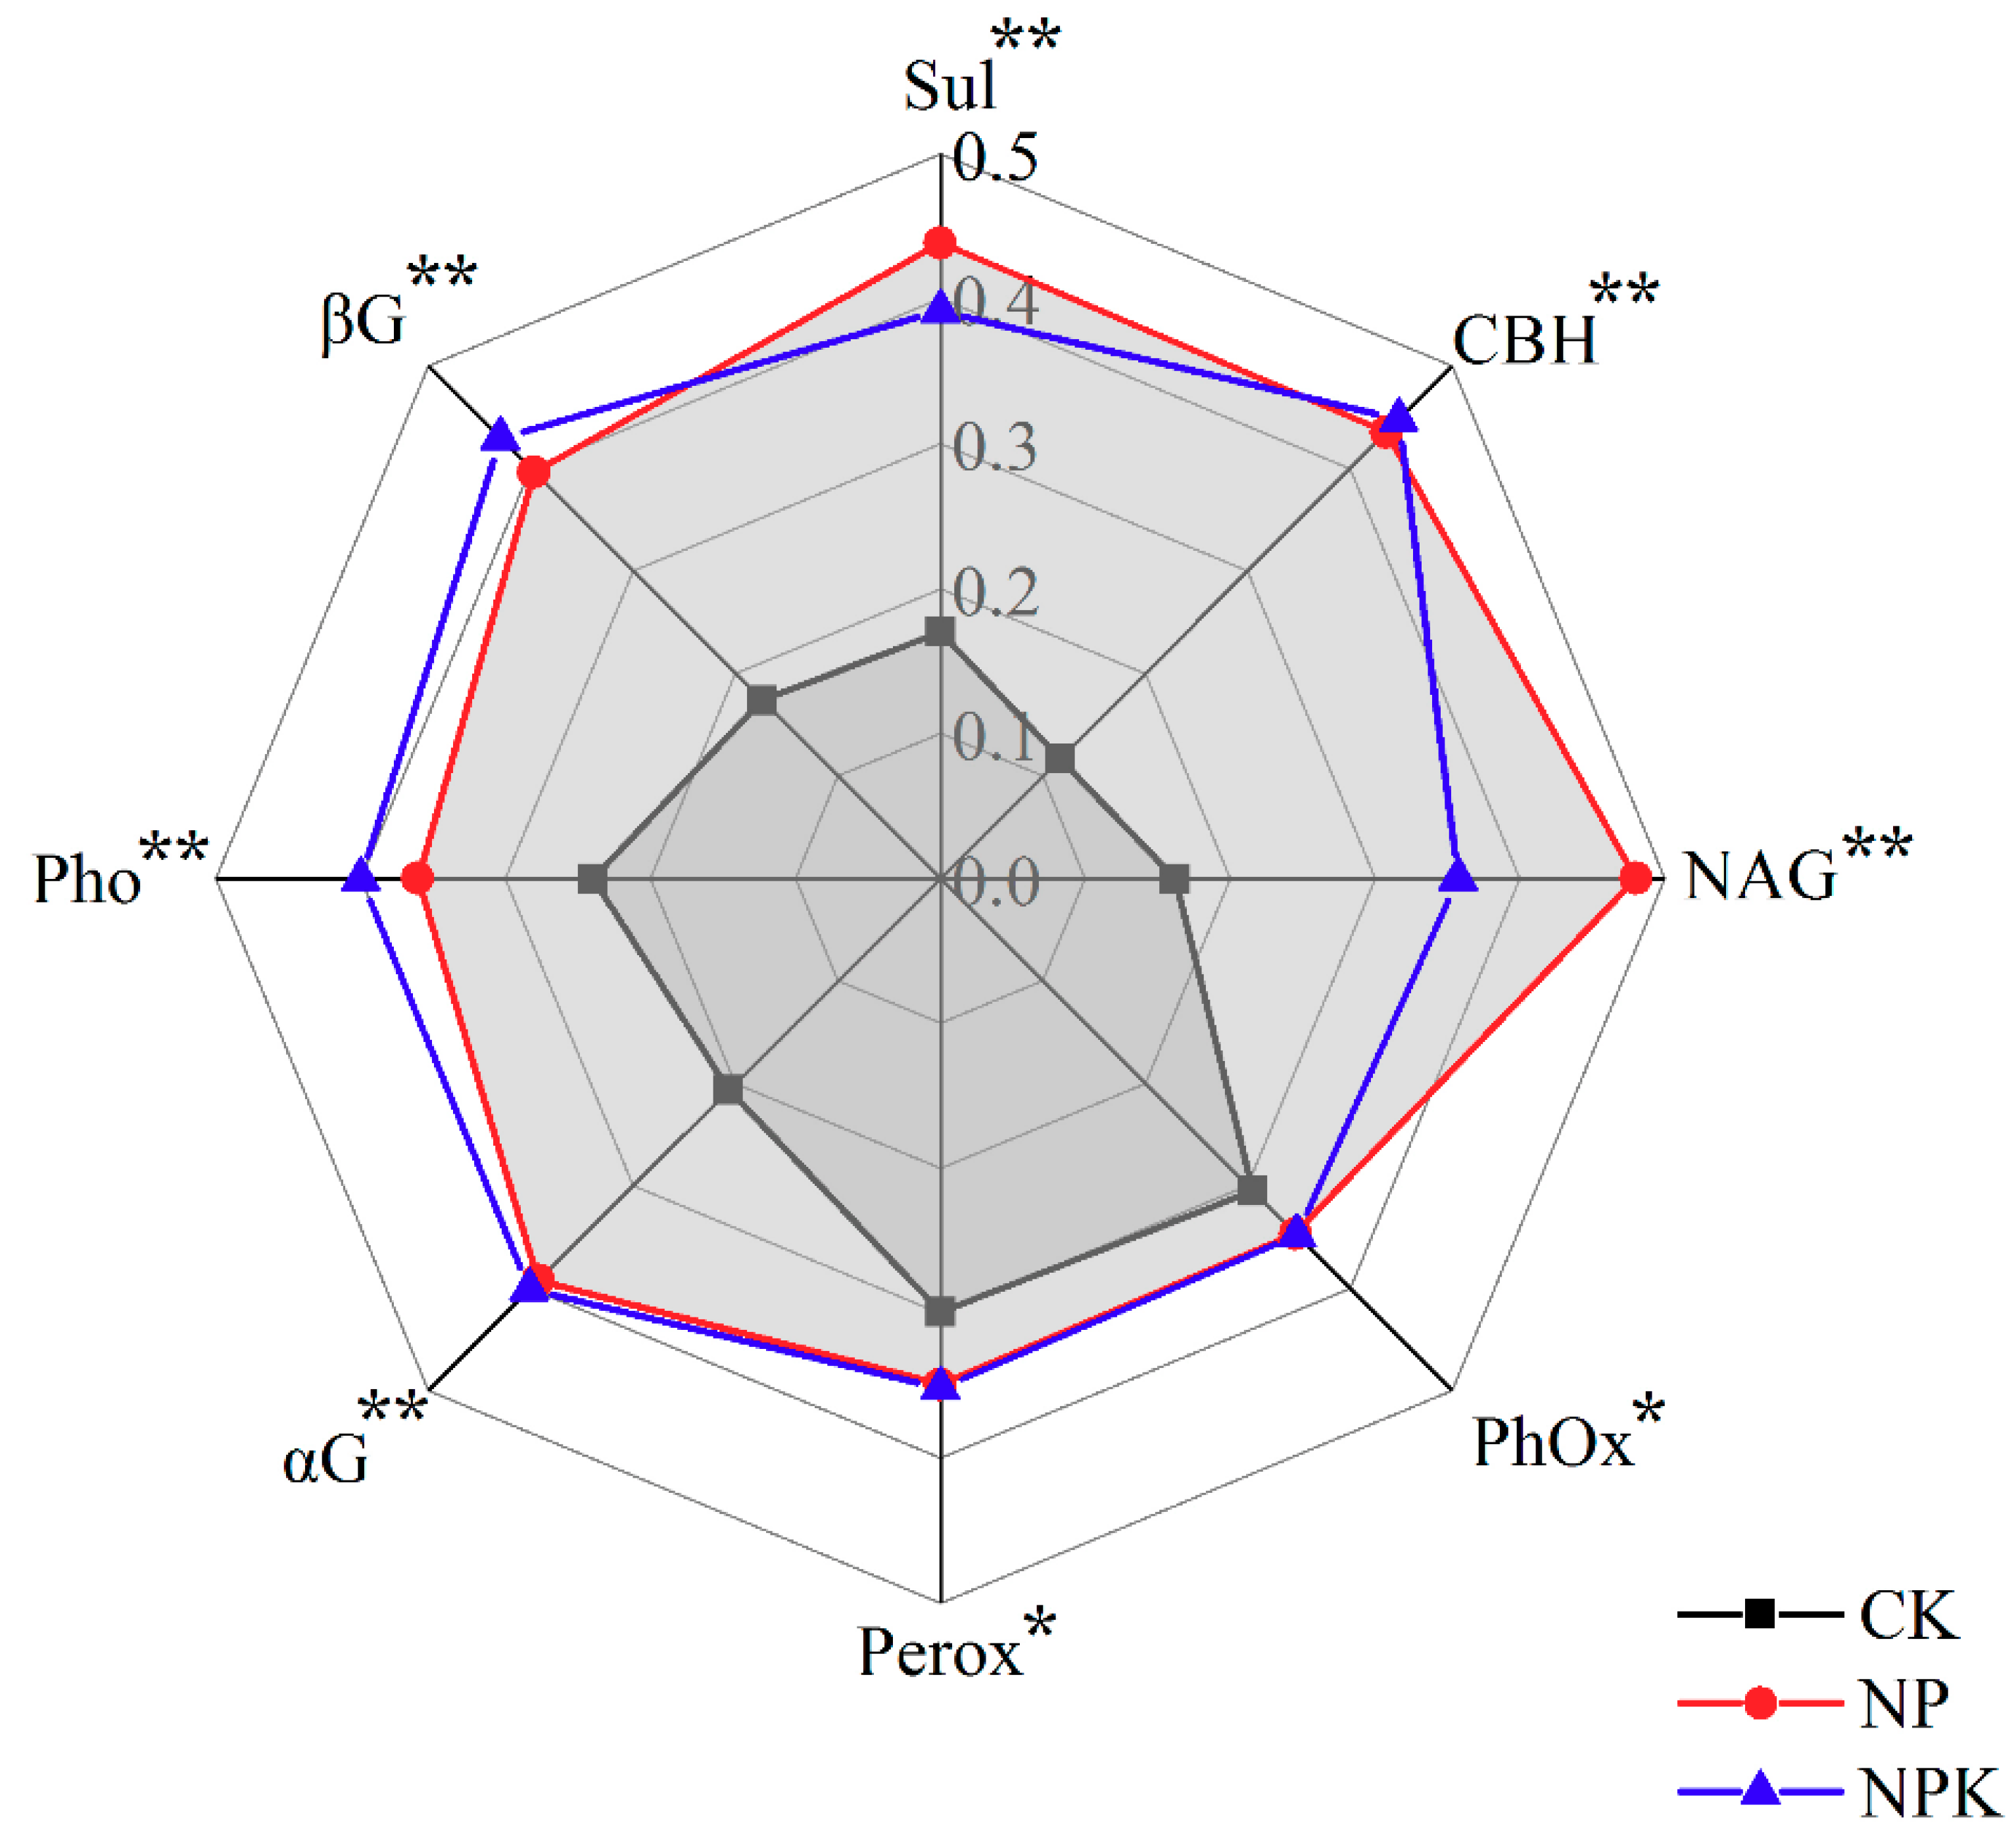
3.1.3. Enzymatic Activities

Both NP and NPK significantly increased the activities of α-glucosidase, β-glucosidase, cellobiohydrolase, phenol oxidase, peroxidase, phosphatase, sulfatase, and N-acetyl-glucosaminidase (Figure 2) when compared to CK. The differences in enzyme activities were not significant between NP and NPK, except for the activity of N-acetyl-glucosaminidase, which was significantly higher in NP than in NPK.
PCA further illustrated the differences in soil enzymatic activities between the CK and the NP and NPK treatments, which were well separated by the PC scores (Figure 3a). The ordination of treatments was primarily related to PC1, which separated the samples into the two distinct groups. According to the RDA, SOC (F = 9.8, p = 0.006) was significantly correlated with soil enzymatic activities and explained 58.4% of the total enzymatic variability (Figure 3b).

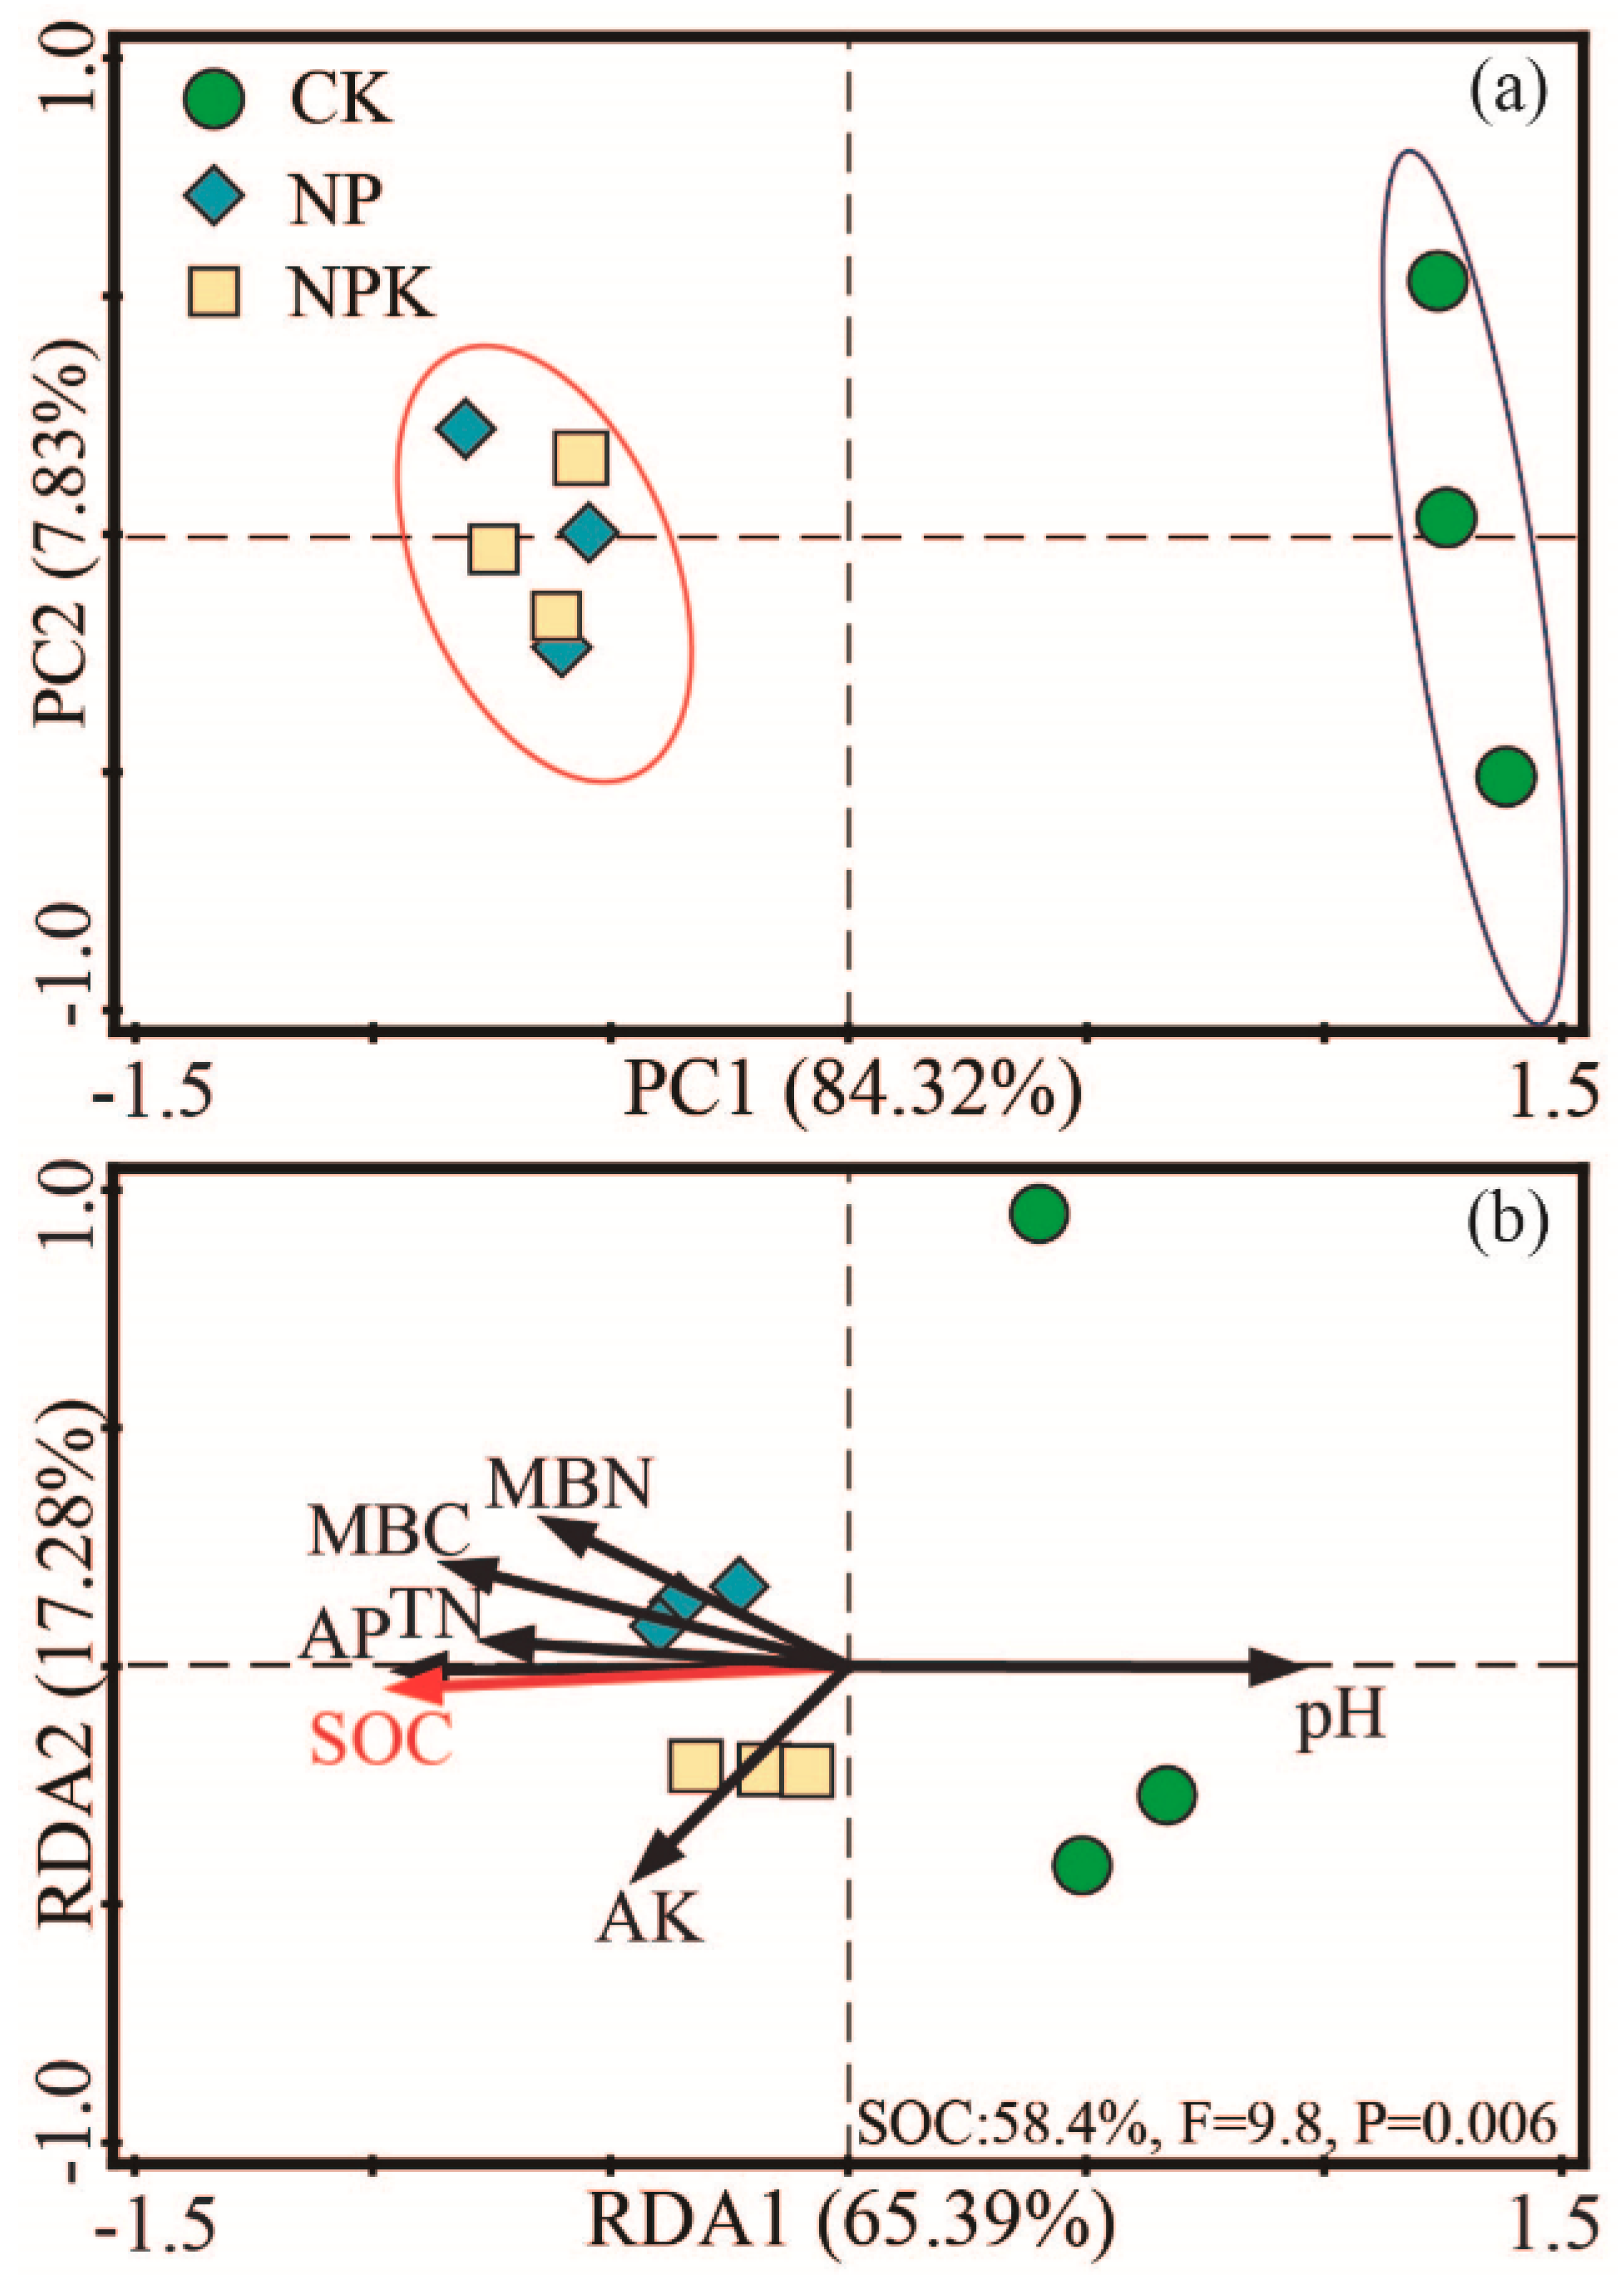
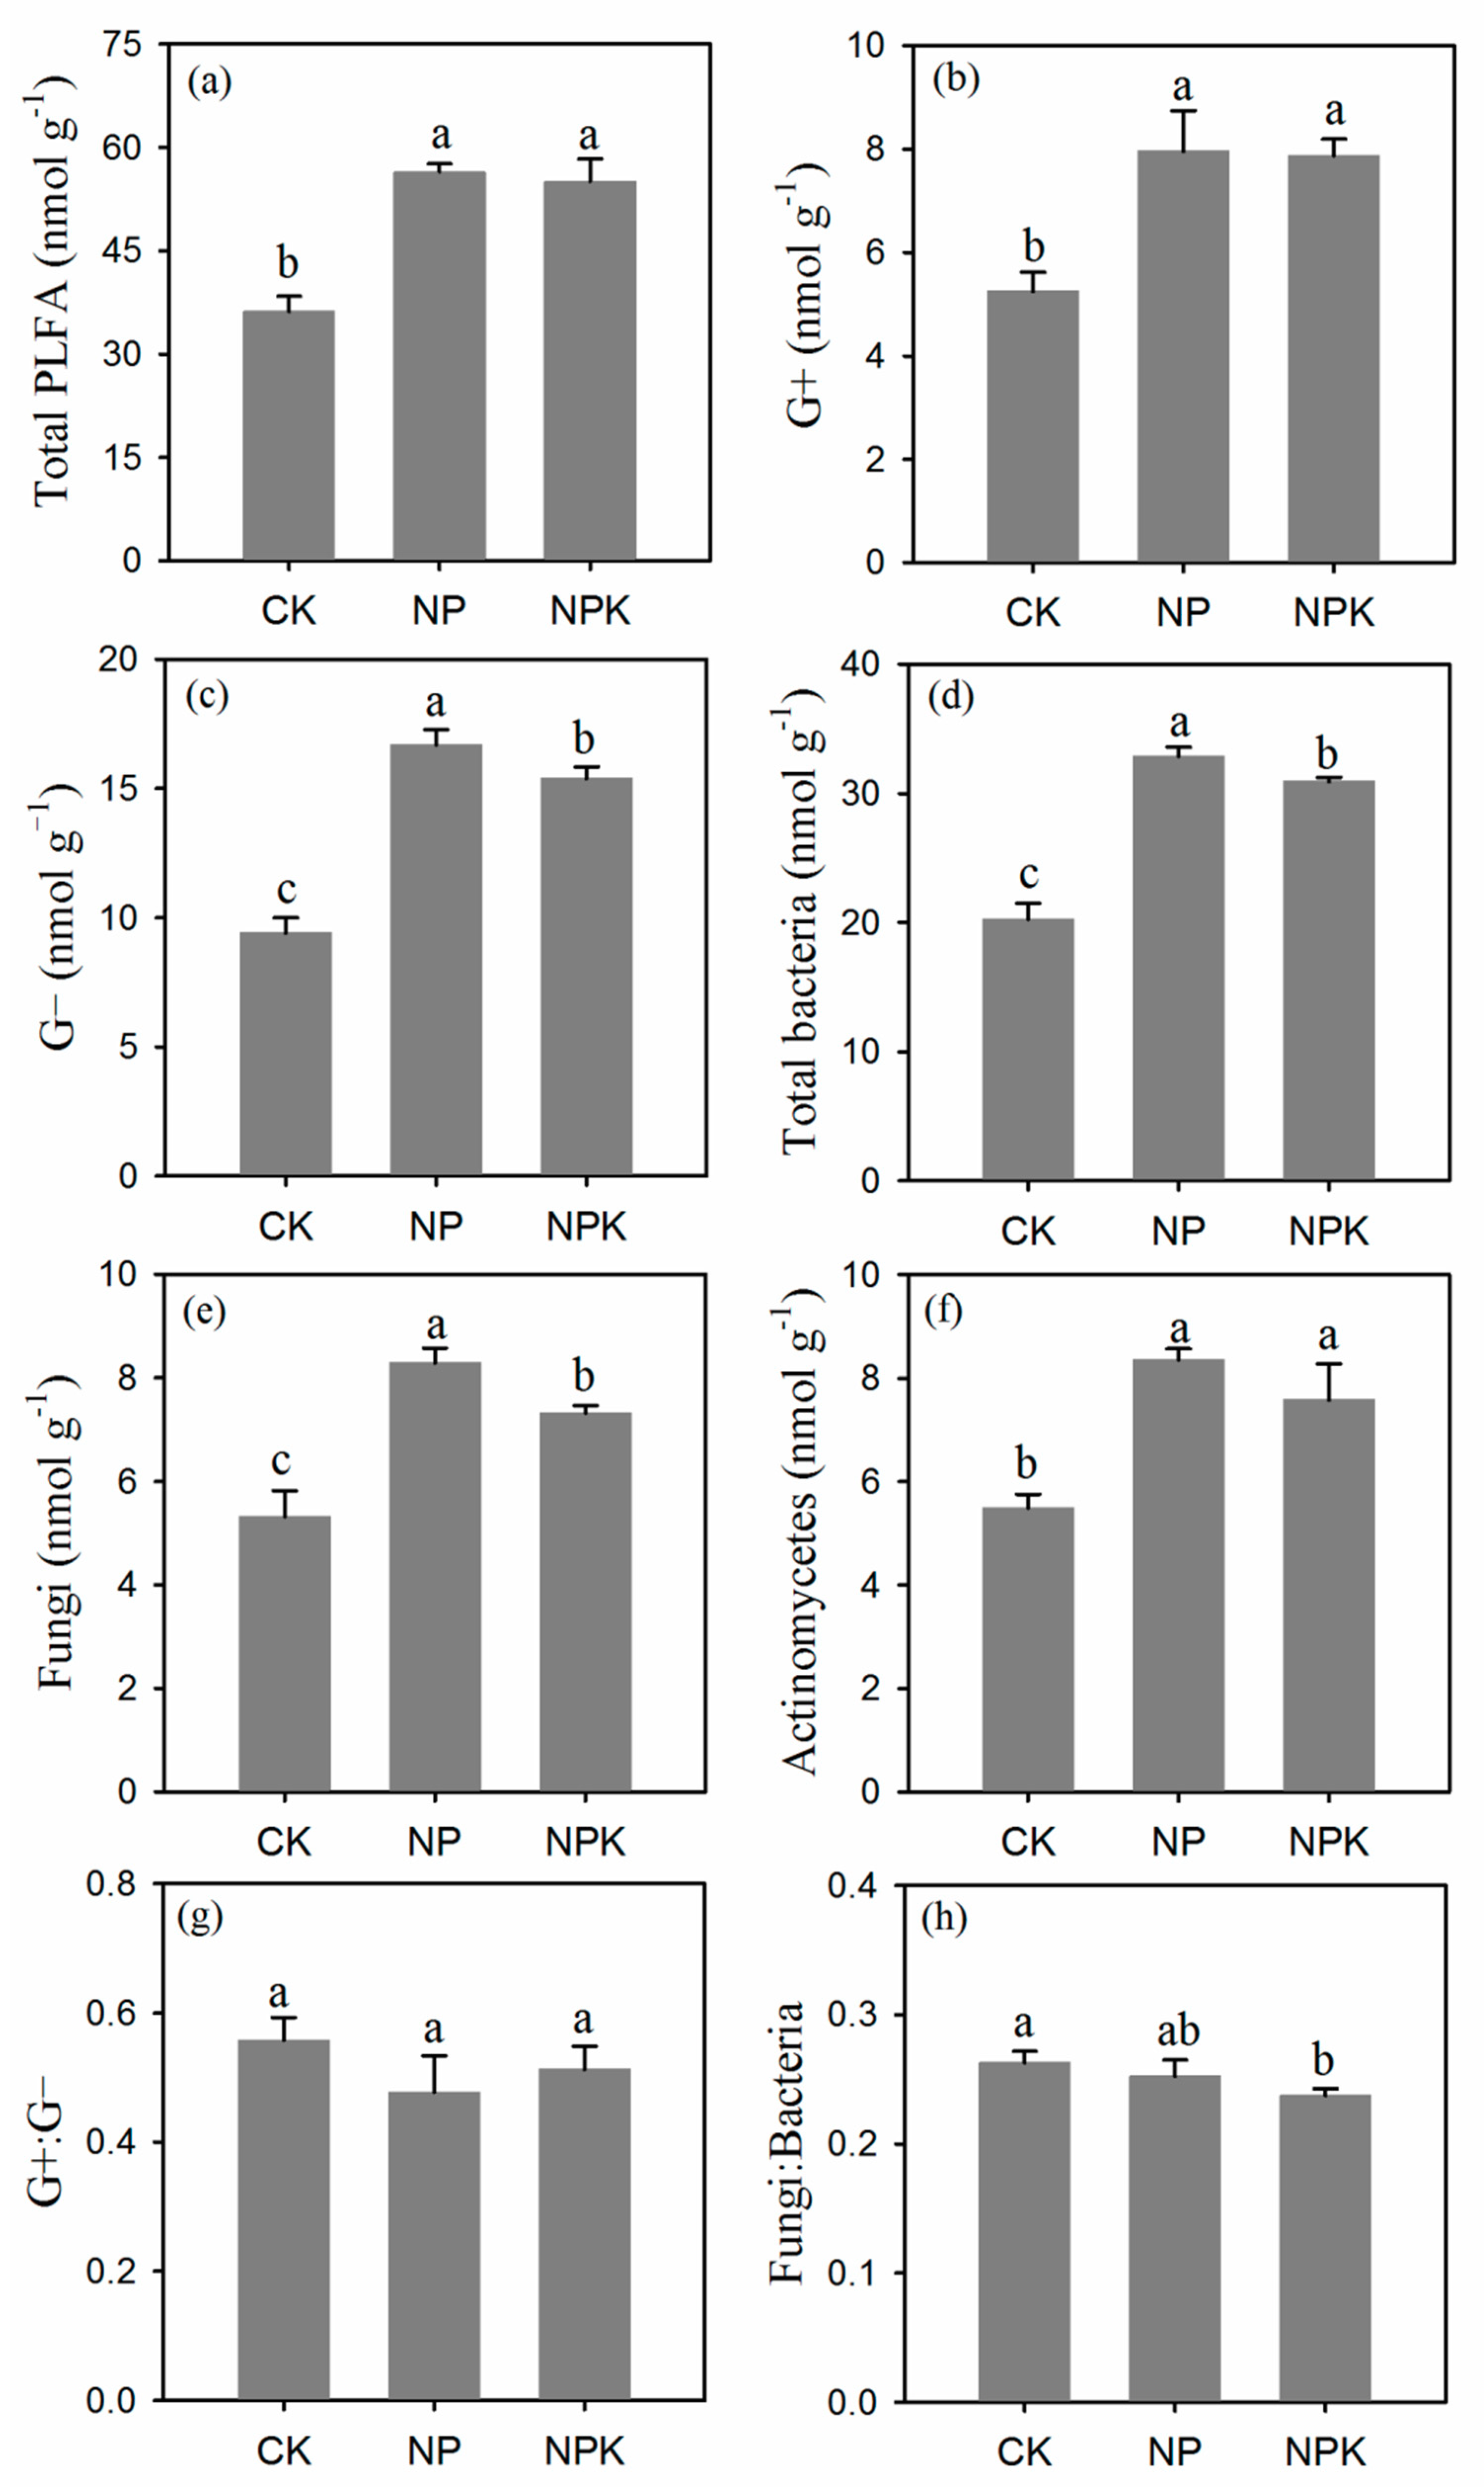
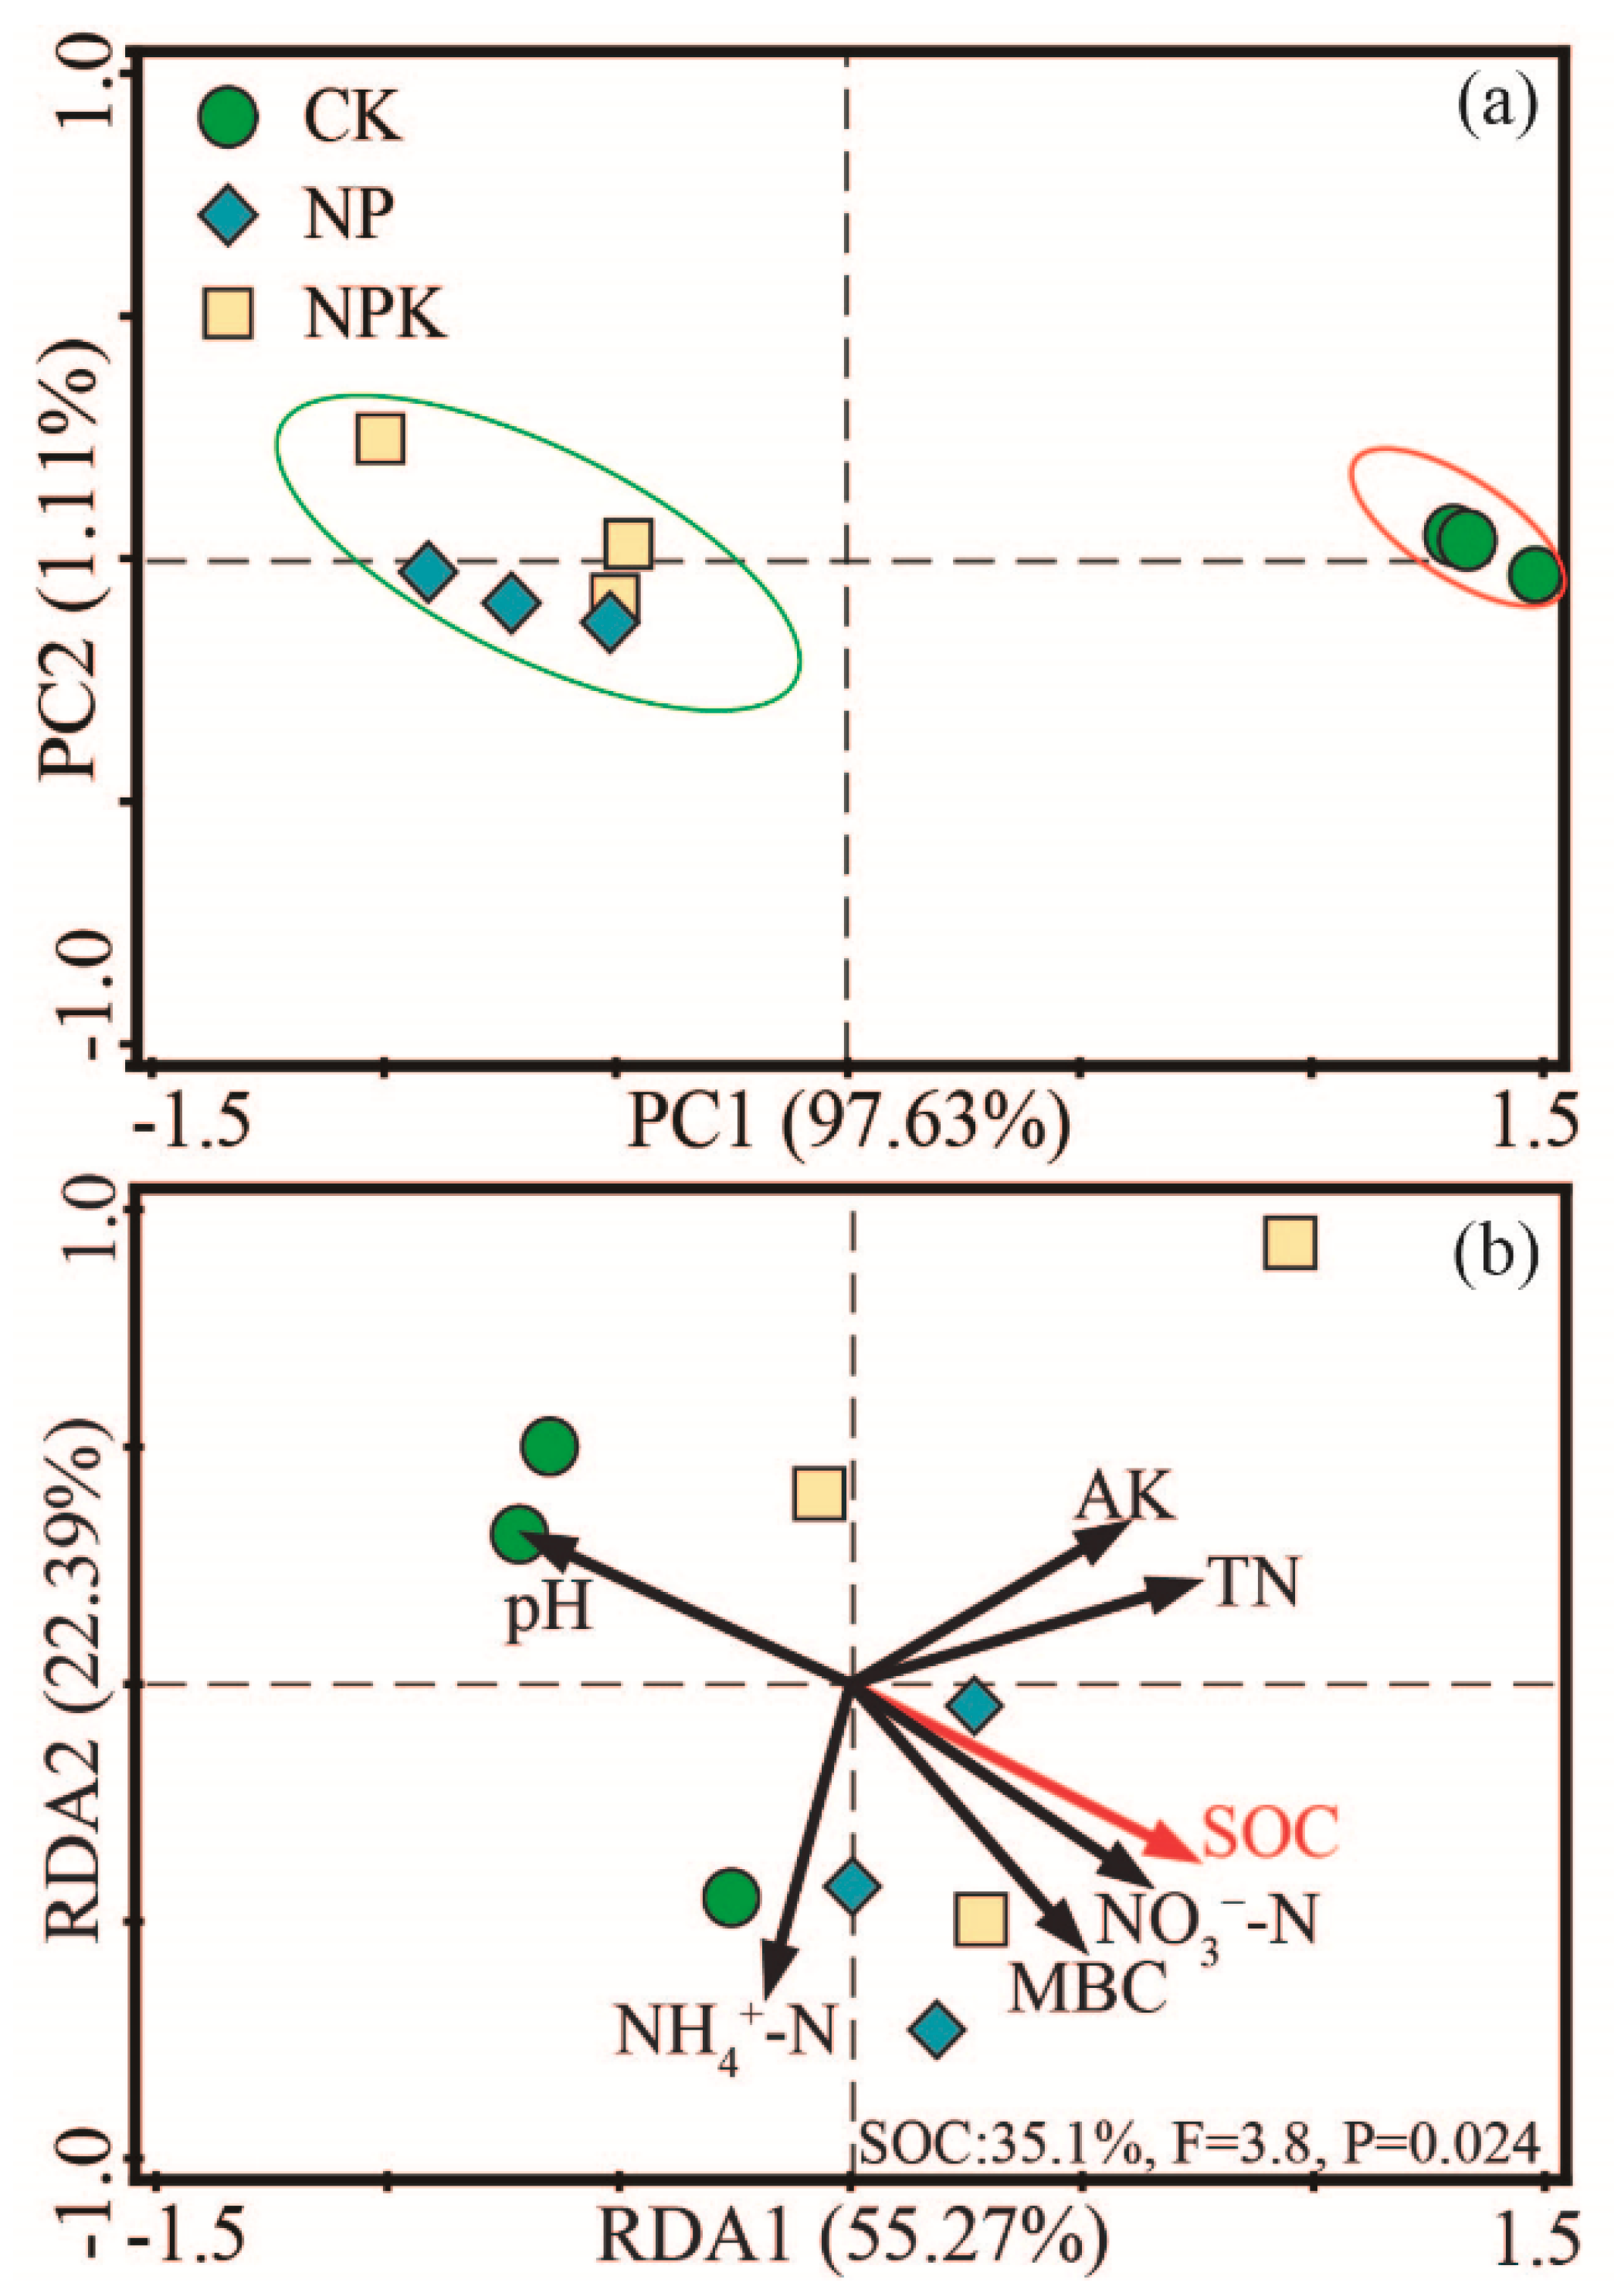
3.1.4. Microbial Community Composition

Long-term fertilization significantly affected soil microbial community composition (Figure 4). The concentration of total PLFAs ranged from 33.75 to 58.77 nmol g−1 and was significantly higher in NP and NPK than in CK, although the difference was not significant between NP and NPK (Figure 4a). The trends were similar for the abundances of Gram-positive (G+) bacteria (Figure 4b) and actinomycetes (Figure 4f). The abundances of Gram-negative (G−) bacteria (Figure 4c), total bacteria (Figure 4d), and fungi (Figure 4e) were also significantly affected by the fertilization regimes, with the highest average values in NP, followed by NPK and then the CK. The fungi:bacteria ratio was significantly higher in the CK than in the NPK treatment, but the ratio in NP was not different from that in the CK and NPK (Figure 4h). No significant differences were observed for the G+:G− ratio among CK, NP, and NPK treatments (Figure 4g). The PCA indicated that the microbial communities in NP and NPK were distinguished from those in unfertilized soil and were primarily associated with PC1 (97.63%; Figure 5a). According to the RDA, SOC significantly affected soil microbial community structure, explaining 35.1% of the total community variability (Figure 5b).

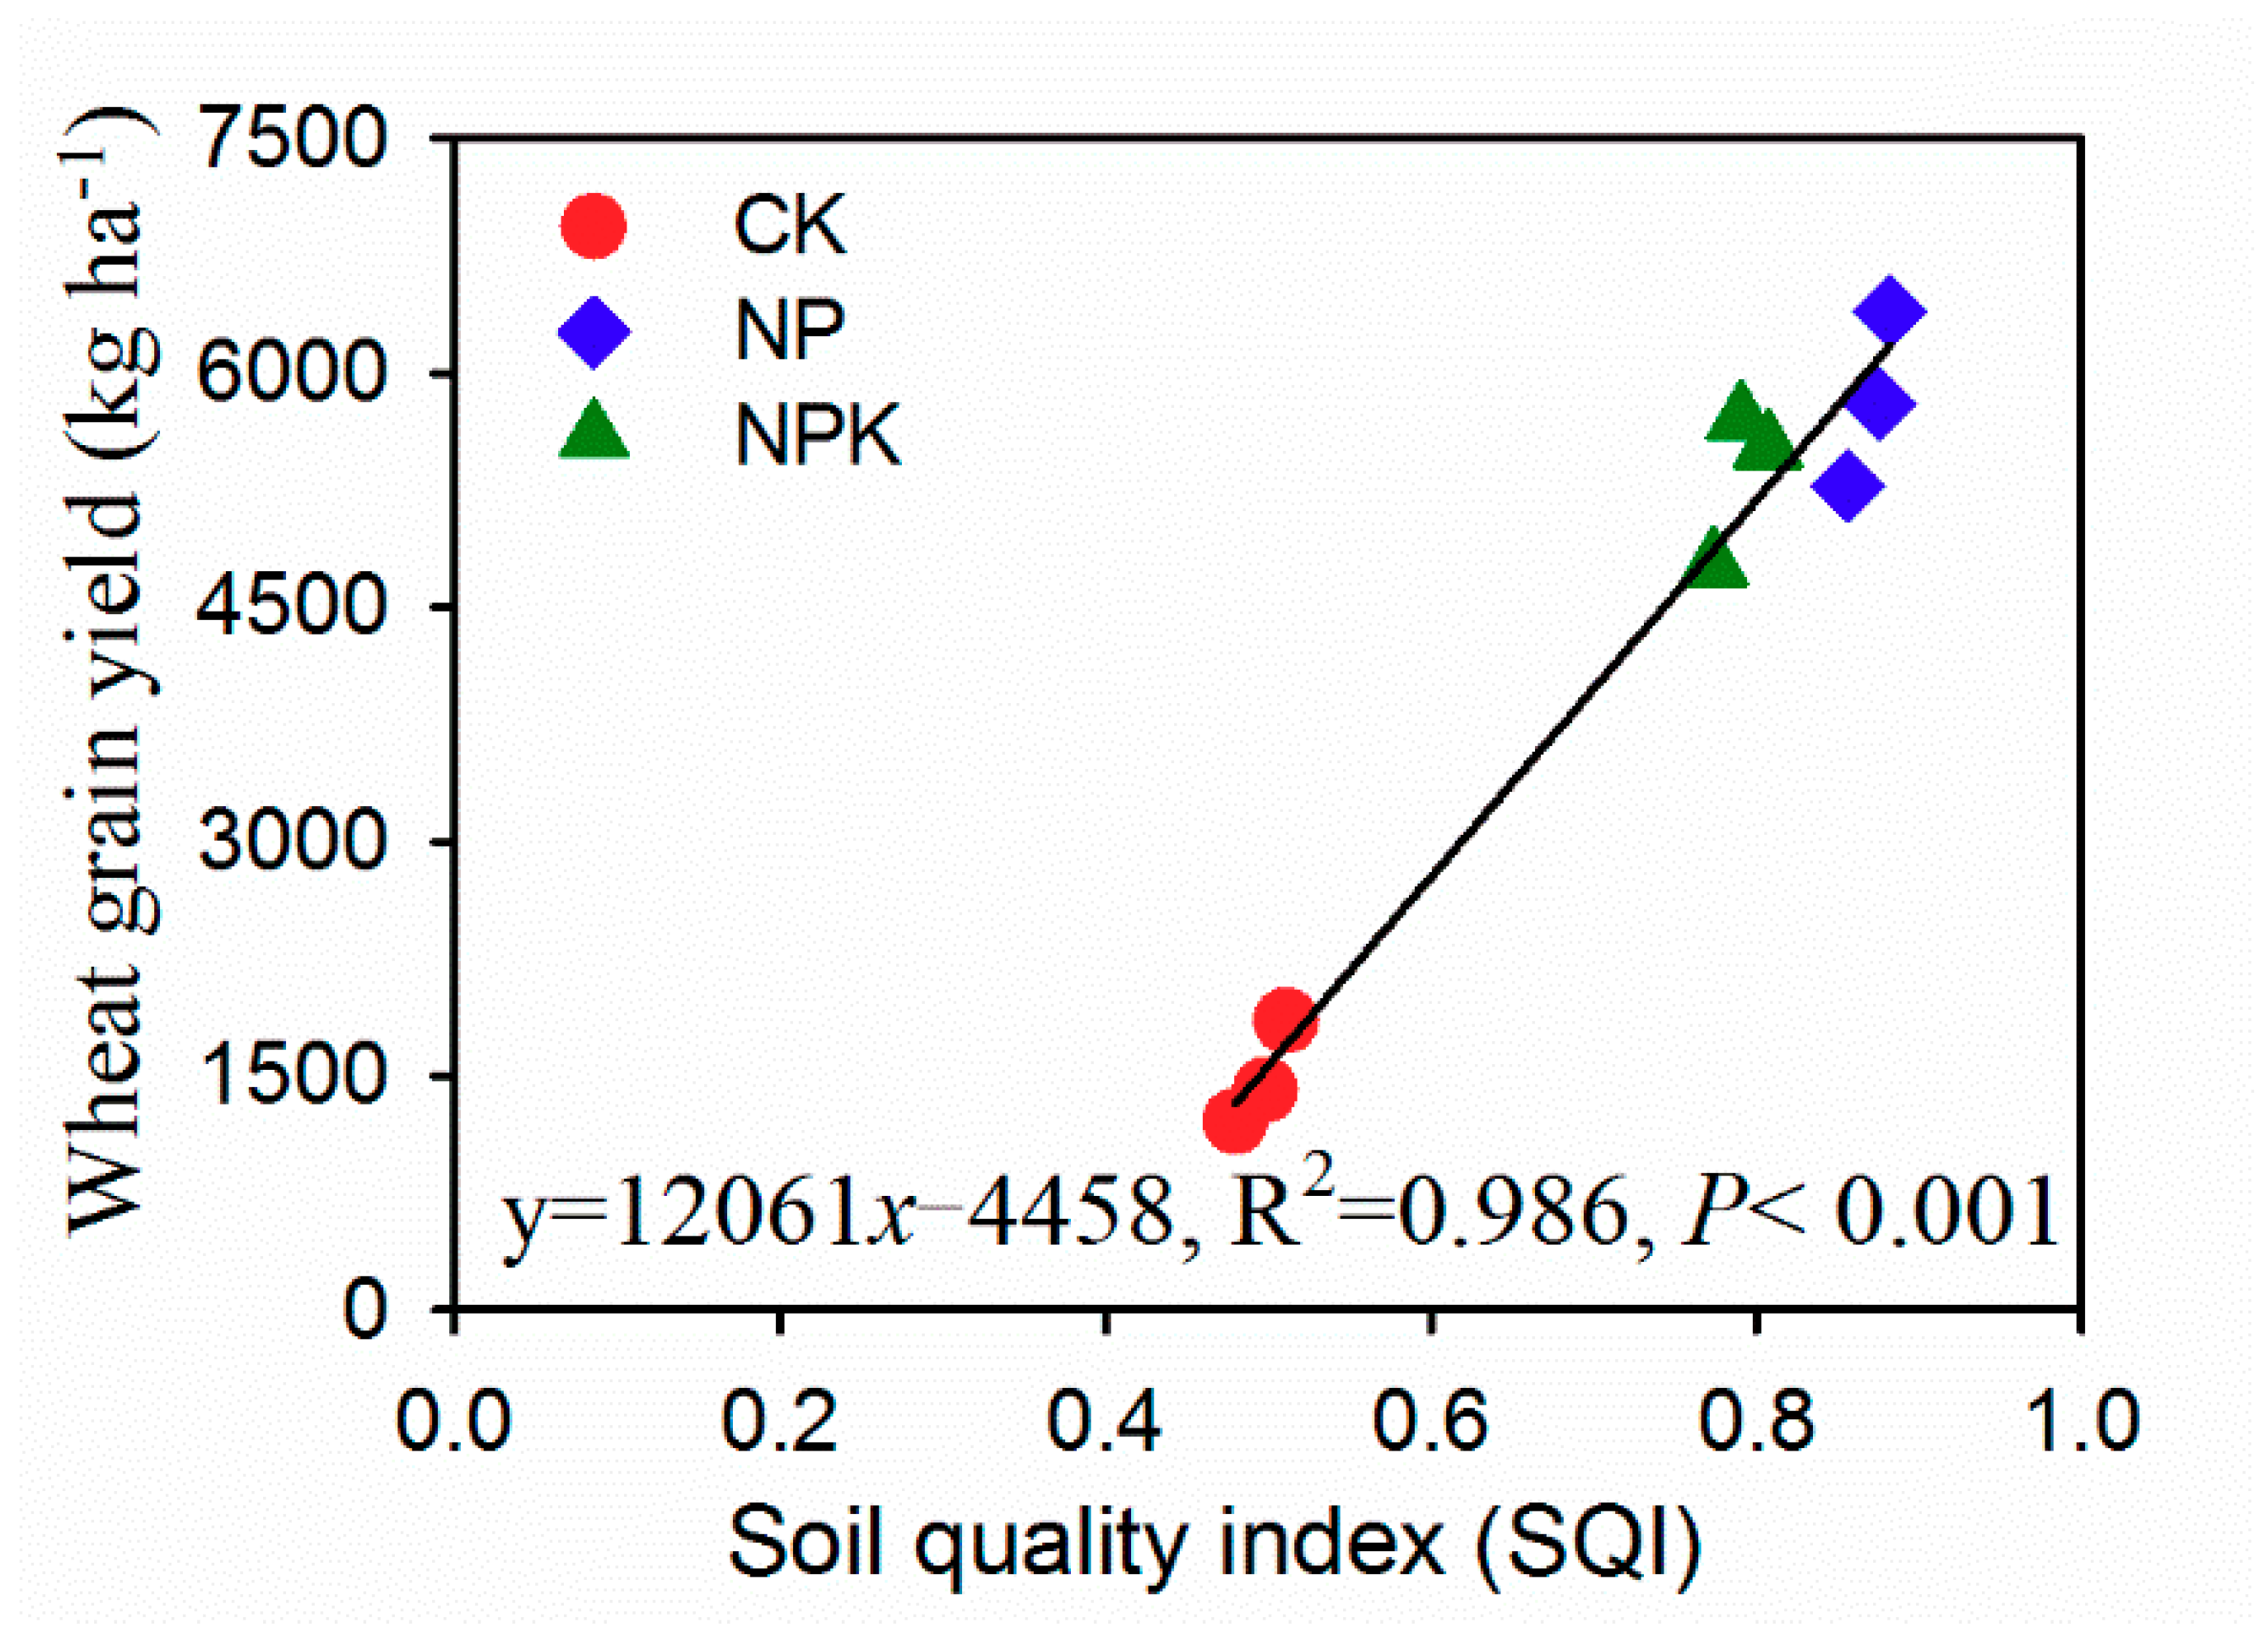
3.2. Soil Quality Index (SQI)

The integrated SQI was the highest in NP (0.86 ± 0.02), followed by NPK (0.79 ± 0.03) and CK (0.48 ± 0.02) treatments (Figure 6). The trend was similar for the SQI scores obtained from biological variables, with the SQI significantly higher in NP than in NPK (Figure 6). By contrast, the SQI scores from chemical or enzymatic variables in NP were comparable to those in NPK, although their scores were all considerably higher than those in CK. To further investigate differences between NP and NPK, SQI scores were calculated for these treatments using MBC and MBN (SQIMBC-MBN). The SQIMBC-MBN scores were higher in NP than NPK, and a similar trend was also detected when SQI was developed from the microbial community groups (Figure 6).
The fertilized treatments significantly improved wheat grain yield compared to CK, but there was no statistical difference between NP and NPK treatments (Figure S1). Notably, the wheat grain yields of NP and NPK treatments were equivalent to the local farmers’ average [8] and the observations obtained by previous studies [12]. More importantly, the SQI scores were significantly (p < 0.001) correlated to wheat grain yields, which were well-fit by a linear model (Figure 7).

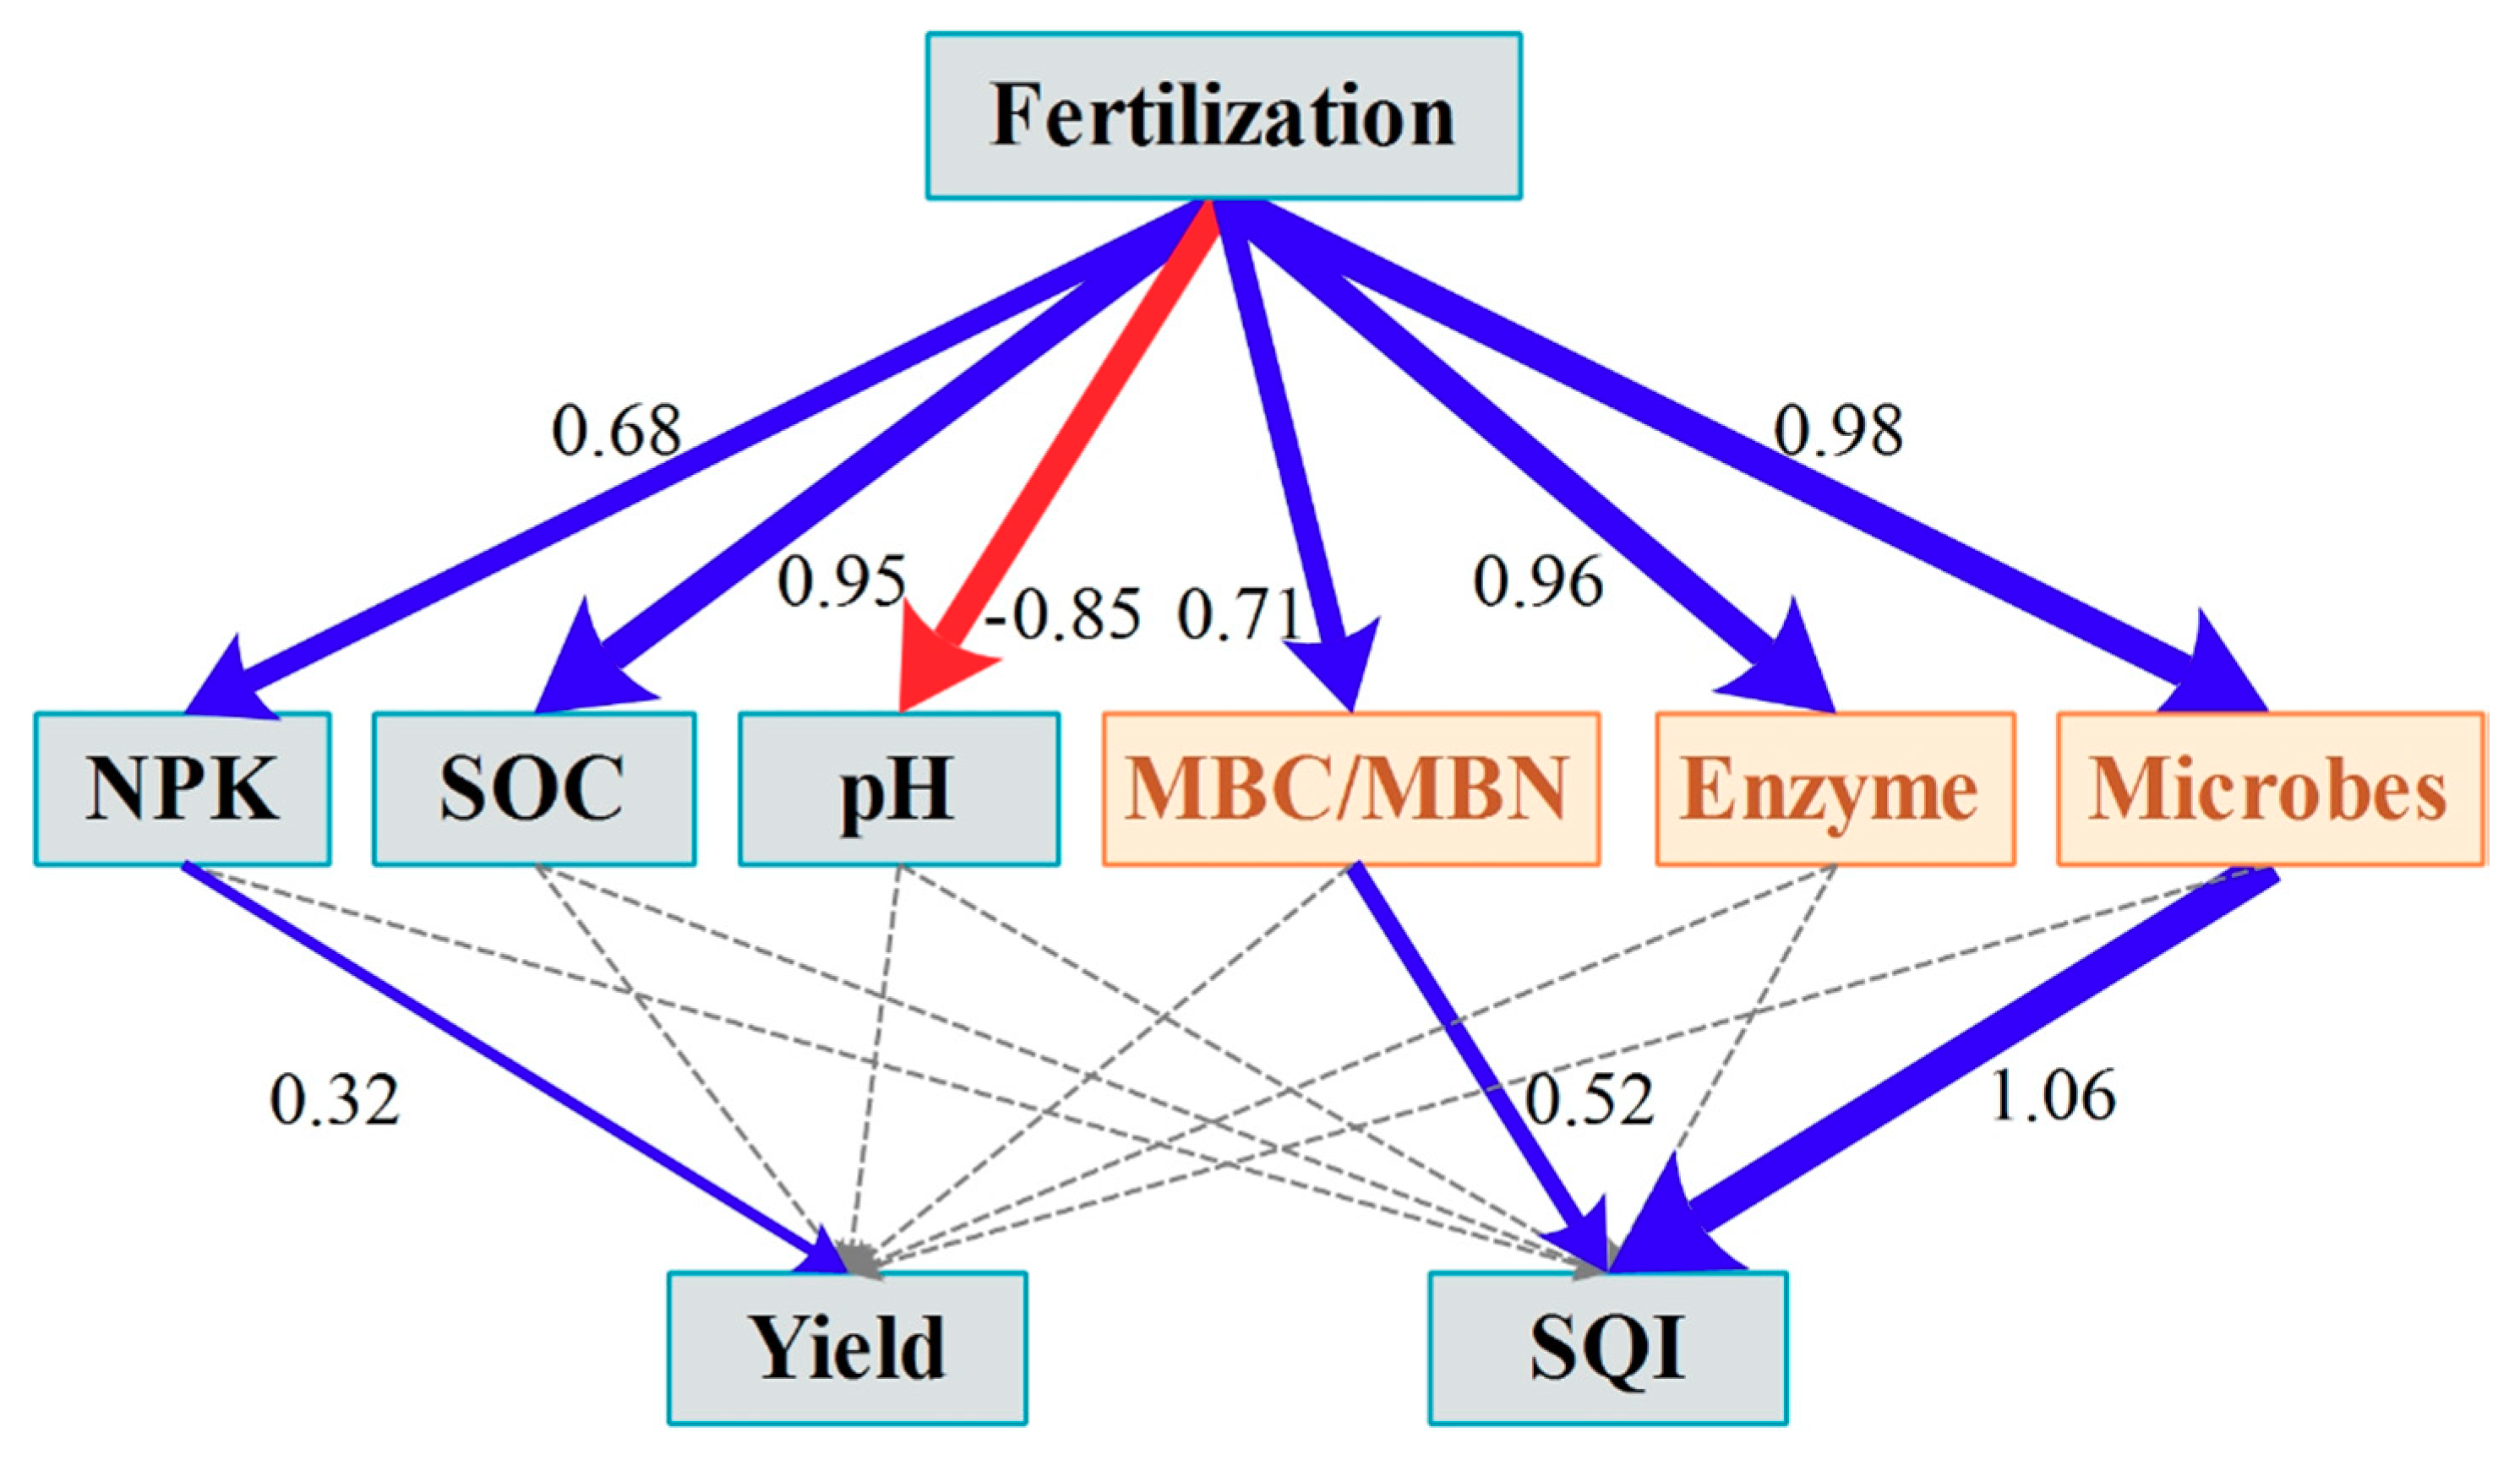
3.3. PLS-PM Analysis

PLS-PM was employed to identify the effects of different variables on SQI scores and crop yields (Figure 8). Results revealed that fertilization had direct and positive effects on all the studied soil properties, except soil pH, which was negatively affected by fertilization regimes. Wheat grain yields were significantly and positively associated with soil nutrients. In contrast, biological properties, rather than soil nutrients and enzyme activities, had an important direct effect on SQI scores. This indirect fertilization effect was mediated by the MBC-MBN and microbial community structure. More importantly, microbial community structure had a larger direct effect than MBC-MBN on SQI scores.

4. Discussion

Long-term field experiments play an important role in elucidating the evolution of soil quality in response to different fertilization regimes [45]. The field experiment in this study was designed without replicates for practical purposes in 1988 with efforts made at that time to reduce the spatial variability in soil chemical properties. The low initial soil chemical variability does not compensate for the lack of randomization and replication, which could reduce or enhance treatment differences observed. However, the results of this long-term study demonstrate changes over 27 years in soil chemical, biological, and microbial parameters, indicating a role for balanced or imbalanced K fertilization on soil quality, particularly on soils with inherent high soil K similar to this soil type. The insights gained on the long-term effects of K addition on soil quality would be conducive to getting more attention to K fertilization and optimizing K fertilization management, especially in areas with K-rich soils, although they are very site specific.

4.1. Soil Chemical Properties

Long-term fertilization significantly affected soil chemical properties. Relative to the initial value of 8.62 in 1990, soil pH decreased by 0.28 units in the CK-treated soils. This may be due to the high N deposition that occurs in this regional ecosystem [46]. N fertilization (NP and NPK) accelerated soil acidification, which could be ascribed to the capacity of N addition reducing soil base cations (especially Ca and Mg) [47]. In particular, pH values in NP-treated soils were significantly lower than those in NPK-treated soils. A similar result was also recorded in a calcareous fluvo-aquic soil on the North China Plain by Meng [48], who ascribed the relatively high pH under NPK to low accumulation of soil N resulting from increased plant N uptake as a result of K application. Ji et al. [49] found that the increase in SOC contributed to maintaining soil acidity due to the large number of acid functional groups, which may partially explain the pH changes observed in the CK, NP, and NPK treatments in this study (Table 2).
SOC increased significantly in NP and NPK compared to CK, which was likely due to the elevated inputs of organic materials (e.g., roots and shoot litter) to soils in the fertilized treatments [39]. Notably, the SOC content in the NPK treatment was slightly, but significantly, lower than that in the NP treatment, which may be related to lower levels of available N in NPK (Table 2), as N shortage is the main factor that limits soil productivity in the Loess Plateau [50]. However, an opposite trend was observed for SOC between NP and NPK treatments in a calcareous fluvo-aquic soil with K-deficiency (<80 mg kg−1) [17]. The distinct responses of SOC to K addition may be associated with the large differences in soil AK, as K addition can reduce community-level fine root biomass [51,52], implying that K addition may be unfavorable for SOC sequestration in K-rich soils.
The expectation was that the long-term application of N and P fertilizers (i.e., NP and NPK) would significantly increase the levels of soil TN, AN, and AP. Grain N, P, and K removed from these treatment plots would confirm the influence of K on plant N and P uptake. In the absence of these data, previous research at this site by Yang et al. [12] noted that the amounts of N and P uptake by wheat plants were higher in NPK than in NP, which may explain the relatively low AN and AP values observed in soils treated with NPK. According to Khan et al. [53], the critical levels of soil Olsen P for optimal crop yield and the P leaching change-point are 16.1 mg kg−1 and 39.9 mg kg−1, respectively. Accordingly, in both NP and NPK, a considerable surplus in AP was observed, with a risk of leaching soil AP evident in the NP treatment, suggesting that the rate of 108 kg P2O5 ha−1 exceeded the wheat’s requirement in the study area. Relative to the initial value of 191 mg kg−1 in 1990, AK substantially accumulated in soils treated with NPK, while slightly declined in CK and NP treated soils. However, an adequate level of AK (>150 mg kg−1) remained in the NP treatment, which is the conventional fertilization practice of local farmers. Moreover, nonsignificant differences in wheat grain yield between NP and NPK treatments between 1991 and 2010 confirmed that K is not a yield-limiting nutrient in the study area [54]. However, the slight decrease in soil AK over 27 years implied that NP fertilization may not be a permanently sustainable option for areas with K-rich soils. Liu et al. [40] reported similar results and noted that straw return alone is not sufficient for maintaining soil K balance. Therefore, chemical K fertilizer application is likely to be essential for preventing further declines in soil K availability.

4.2. Enzymatic Activities and Microbiological Properties

Soil microbial biomass is an important indicator of soil health and environmental sustainability [24]. Surprisingly, compared to the levels in the NPK treatment, MBC and MBN increased significantly in the NP imbalanced fertilization treatment. This result is consistent with the findings in wheat–maize [20], apple orchard [29], and cotton [21] systems, in which soils were sufficient in AK (>150 kg ha−1). By contrast, the opposite trend was observed in a fluvo-aquic soil [18], as well as a red paddy soil [19], in which the contents of soil AK were low (~80 kg ha−1). In previous studies, high soil K availability led to an increase in soil salinity and degradation of soil structure, thereby inhibiting the metabolic processes of microorganisms and decreasing MBC and MBN [30,31,32,33,34]. Accordingly, the inconsistent reports on the differences in MBC and MBN between NP and NPK treatments may be associated with large differences in soil AK. Our result provided a new evidence that there are significant and negative relationships between AK and both MBC and MBN in K-rich soil (>150 kg ha−1) (Figure S2). Additionally, as reported by Wang et al. [55], the significant increase in MBC and MBN in NP is associated with improvements in SOC, as well as soil nutrient status (Table 2), and soil moisture (data not shown).
Soil enzymes play vital roles in nutrient cycling and in maintaining soil fertility and quality [56]. Compared with the CK, the activities of the eight soil enzymes involved in C, N, P, and S cycling in this study increased significantly, which could be attributed to the increase in abundance of microbial communities (Figure 4a), according to Das and Varma [57]. Bragazza et al. [58] report that the activity of soil enzymes can indicate microbial nutrient limitation. Thus, the result that all enzymatic activities, except for N-acetyl-glucosaminidase activity, were not significantly different between the NP and NPK treatment implied that N deficiency may be a constraint limiting soil fertility. Additionally, in several long-term experiments, the activities of urease, protease, phosphatase, sulfatase, β-glucosidase, β-cellobiosidase, β-xylosidase, catalase, phenol oxidase, peroxidase, and invertase in NP are comparable to those in NPK on the North China Plain in K-deficient soils (~80 mg kg−1) [59,60], suggesting that K has minimal effects on soil enzymatic activity. N-acetyl-glucosaminidase catalyzes chitin into mineral N in soil, and its high activity in NP may partially explain the relatively higher AN contents compared with NPK. However, Ai et al. [59] recorded no significant differences in the activity of N-acetyl-glucosaminidase between NP and NPK-treated soils. This inconsistency between studies may be due to the different levels of AN (19.3 mg kg−1 [59] vs. 6.9 mg kg−1 in this study) in the experimental soils. By contrast, Zhang et al. [61] observed generally higher activities of enzymes involved in C, N, P, and S cycling in NP than in NPK in a 34-year paddy field experiment. Evidently, soil enzymatic activities respond differently to different soil types and land uses [62]. Fungi are responsible for the production of chitinase in soils [57], which may explain the higher activity of N-acetyl-glucosaminidase in NP-treated soils when compared with the NPK treatment. Similar to the conclusion of Zhang et al. [61], in this study, SOC was the major factor that affected soil enzyme activity, mainly by contributing to the formation of suitable conditions (e.g., energy) for soil enzymes [63]. By contrast, in short-term experiments, the total variability in enzymatic activities was primarily explained by MBC [64,65]. These results [64,65] are consistent with those of a separate study in which MBC was found to be more sensitive to small changes in soil [66].
Compared with the CK, the contents of total PLFAs and those associated with total bacteria, fungi, and actinomycetes were significantly higher in the NP and NPK treatments (Figure 4a,d–f), which could be attributed to alleviation of nutrient shortages after fertilizer application [67]. In the NPK treatment, the abundance of G− and total bacteria decreased significantly when compared with the NP treatment (Figure 4c,d), indicating that G− bacteria are a sensitive indicator of bacterial community structure [68]. Importantly, a significant and negative relationship between soil AK and the phylum Proteobacteria was previously observed by Guo et al. [69]. Eo and Park [28] further noted that the abundance of two genera of the phylum Proteobacteria (i.e., EU786132_g and DQ395705_g) decreased markedly under NPK when compared with the abundance under NP. However, Ma et al. [17] found that K deficiency had minimal effects on bacterial groups. By contrast, high soil K availability may indirectly impose adverse effects on the bacterial community. In this study, MBC was significantly and positively correlated with G− bacteria and fungi (Figure S3), and both G− bacteria and fungi in NP increased significantly compared with abundance in NPK (Figure 4c,e). This result is supported by previous reports that active SOC fractions (e.g., MBC) are preferentially utilized by G− bacteria and fungi, leading to increased growth of G− bacteria and fungi [70]. Furthermore, the proportions of G− bacteria usually increase following a shift from oligotrophic to copiotrophic conditions [71]. Accordingly, the higher nutrient availability (i.e., SOC, AN, and AP) may explain the relatively higher abundance of G− bacteria in NP (Table 2). The RDA result confirmed the previous finding that SOC is the most important chemical property contributing to the dominance of some microbial populations [58,69]. Similar results were recorded in the brown soil of Northwest China [72], which were attributed to the capacity of SOC to provide energy and substrates and thereby promote biological diversity [73].

4.3. Soil Quality Assessment

Developing SQI is an effective tool for evaluating soil management effects [23]. In this study, SQI scores were positively and significantly related to wheat grain yield, confirming the previous finding that SQI scores developed by the TDS method are accurate for indicating soil productivity [24]. As expected, NP and NPK significantly improved SQI scores, but NP had higher SQI scores than those in NPK. This result was primarily associated with soil biological quality, as a result of the similar and significant changes in MBC, MBN, and microbial community structure (Figure 5). The PLS-PM further confirmed this hypothesis (Figure 8). The nonsignificant differences observed between wheat grain yields and SQI scores developed from the soil chemical properties between NP and NPK indicated that soil nutrients were not the factor that limited soil fertility or productivity. In contrast, MBC, MBN, and microbial community structure were responsible for the variations in SQI scores, supporting recent findings that soil biological properties are more sensitive than chemical properties to anthropogenic and natural disturbances and therefore are often the best indicators of soil quality and function [24,74].

5. Conclusions

Long-term fertilization significantly affected soil chemical and biological properties. Noticeably, NP and NPK exhibited distinct effects on soil nutrients, enzyme activities, and microbial communities in this study area with K-rich soil. Relative to NPK, imbalanced NP fertilization resulted in slight soil acidification and K depletion but coupled with a significant increase in SOC, AN, AP, N-acetyl-glucosaminidase, MBC, MBN, total bacteria, and fungi. More importantly, NP fertilization resulted in similar wheat grain yields compared to NPK and significantly improved SQI scores, which was attributed to the differences in soil biological properties. Obviously, relative to the NPK treatment, the conventional fertilization practice without K addition (i.e., NP) may be a viable alternative practice for the Guanzhong Plain and other areas with K-rich reserves. However, repeated NP application posed a potential of P leaching risk and an ongoing decline in K, and thus farmers should reduce the application rate of P fertilizer to alleviate accumulations of soil P, and apply a little amount of K fertilizer to maintain soil K balance. Thus, further studies are needed to investigate the rate of K addition that would not result in the P accumulation observed in NP, and to confirm these results for other K rich soils and sites, thus understanding the mechanisms underlying the observed behaviors, especially the responses of soil microbial properties to K addition.

Supplementary Materials

The following are available online at https://www.mdpi.com/2073-4395/10/6/771/s1, Figure S1: Comparison of wheat grain yield after 27 years of fertilization treatments (CK: no fertilizer; NP: nitrogen and phosphorous fertilizer; NPK: nitrogen: phosphorus: and potassium fertilizer) in a wheat–fallow system. Figure S2: Linear relationship between soil available K and microbial biomass C (a) and microbial biomass N (b), Figure S3: Relation analysis between MBC and the microbial community groups.

Author Contributions

Conceptualization, Z.L. and Q.C.; Methodology, Q.C. and Y.X.; Resources, Z.L.; Supervision, Z.L.; Writing–original draft, Q.C.; Writing–review & editing, Z.L. and Q.C. All authors have read and agreed to the published version of the manuscript.

Acknowledgments

This work was supported by the National Natural Science Foundation of China (No. 31801937).

Conflicts of Interest

The authors declare no conflict of interest.

References

  1. Zhang, F.S.; Cui, Z.L.; Chen, X.P.; Ju, X.T.; Shen, J.B.; Chen, Q.; Liu, X.J.; Zhang, W.F.; Mi, G.H.; Fan, M.S.; et al. Integrated Nutrient Management for Food Security and Environmental Quality in China. Adv. Agron. 2012, 116, 1–40. [Google Scholar] [CrossRef]
  2. Stewart, W.M.; Dibb, D.W.; Johnston, A.E.; Smyth, T.J. The Contribution of Commercial Fertilizer Nutrients to Food Production. Agron. J. 2005, 96, 1–6. [Google Scholar] [CrossRef] [Green Version]
  3. Vitousek, P.M.; Naylor, R.; Crews, T.; David, M.B.; Drinkwater, L.E.; Holland, E.; Johnes, P.J.; Katzenberger, J.; Martinelli, L.A.; Matson, P.A.; et al. Nutrient imbalances in agricultural development. Science 2009, 324, 1519–1520. [Google Scholar] [CrossRef]
  4. Römheld, V.; Kirkby, E.A. Research on potassium in agriculture: Needs and prospects. Plant Soil 2010, 335, 155–180. [Google Scholar] [CrossRef]
  5. Fatemi, A. Kinetics of Soil Potassium Release Under Long-Term Imbalanced Fertilization in Calcareous Soils. Pedosphere 2017, 27, 1105–1115. [Google Scholar] [CrossRef]
  6. Sattar, A.; Naveed, M.; Ali, M.; Zahir, Z.A.; Nadeem, S.M.; Yaseen, M.; Meena, V.S.; Farooq, M.; Singh, R.; Rahman, M.; et al. Perspectives of potassium solubilizing microbes in sustainable food production system: A review. Appl. Soil Ecol. 2019, 133, 146–159. [Google Scholar] [CrossRef]
  7. Das, D.; Dwivedi, B.S.; Datta, S.P.; Datta, S.C.; Meena, M.C.; Agarwal, B.K.; Shahi, D.K.; Singh, M.; Chakraborty, D.; Jaggi, S. Potassium supplying capacity of a red soil from eastern India after forty-two years of continuous cropping and fertilization. Geoderma 2019, 341, 76–92. [Google Scholar] [CrossRef]
  8. Zhao, H.B.; Wang, Z.H.; Gao, Y.J.; Zhang, W.F. Investigation and evaluation of household wheat fertilizer application in Shaanxi Province. Plant Nutr. Fertil. Sci. 2016, 22, 245–253. [Google Scholar] [CrossRef]
  9. Zhang, D.B.; Yao, P.W.; Na, Z.; Cao, W.D.; Zhang, S.Q.; Li, Y.Y.; Gao, Y.J. Soil Water Balance and Water Use Efficiency of Dryland Wheat in Different Precipitation Years in Response to Green Manure Approach. Sci. Rep. 2016, 6, 26856. [Google Scholar] [CrossRef] [Green Version]
  10. Chen, W.; Sun, J.H.; Zhao, J.H. Analysis and evaluation of fertilization situation for wheat in Gansu Province. Agric. Res. Arid Areas 2013, 31, 23–27. [Google Scholar]
  11. Tan, D.S.; Jin, J.Y.; Huang, S.W. Effect of long-term K fertilizer application and returning wheat straw to soil on crop yield and soil K under different planting systems in northwestern China. Plant Nutr. Fertil. Sci. 2008, 14, 886–893. [Google Scholar] [CrossRef]
  12. Yang, Y.; Zhang, S.L.; Yang, X.Y.; Sun, B.H. Effect of long-term fertilization on wheat yield, nutrient use efficiency and nutrient balance in rainfed Lou soil. Chin. J. Soil Sci. 2017, 48, 1162–1168. [Google Scholar] [CrossRef]
  13. Ge, W.J.; Chang, Y.L.; Liu, J.M.; Zhang, S.L.; Sun, B.H.; Yang, X.Y. Potassium balance and pool as influenced by long-term fertilization under continuous winter wheat-summer maize cropping system. Plant Nutr. Fertil. Sci. 2012, 18, 629–636. [Google Scholar] [CrossRef]
  14. Ma, J.C.; He, P.; Xu, X.P.; He, W.T.; Liu, Y.X.; Yang, F.Q.; Chen, F.; Li, S.T.; Tu, S.H.; Jin, J.Y.; et al. Temporal and spatial changes in soil available phosphorus in China (1990–2012). Field Crops Res. 2016, 192, 13–20. [Google Scholar] [CrossRef]
  15. Zhang, C.; Ju, X.T.; Powlson, D.; Oenema, O.; Smith, P. Nitrogen Surplus Benchmarks for Controlling N Pollution in the Main Cropping Systems of China. Environ. Sci. Technol. 2019, 53, 6678–6687. [Google Scholar] [CrossRef]
  16. Ai, C.; Liang, G.Q.; Sun, J.W.; Wang, X.B.; He, P.; Zhou, W.; He, X.H. Reduced dependence of rhizosphere microbiome on plant-derived carbon in 32-year long-term inorganic and organic fertilized soils. Soil Biol. Biochem. 2015, 80, 70–78. [Google Scholar] [CrossRef]
  17. Ma, L.; Zhao, B.Z.; Guo, Z.B.; Wang, D.Z.; Li, D.D.; Xu, J.S.; Li, Z.Q.; Zhang, J.B. Divergent responses of bacterial activity, structure, and co-occurrence patterns to long-term unbalanced fertilization without nitrogen, phosphorus, or potassium in a cultivated vertisol. Environ. Sci. Pollut. Res. 2019, 26, 12741–12754. [Google Scholar] [CrossRef]
  18. Chen, J.; Zhao, B.Z.; Zhang, J.B.; Shen, L.L.; Wang, M.N.; Qin, S.W. Effect of long-term fertilization on microbial biomass and activity in fluvo-aquic soil during maize growth period. Acta Pedol. Sin. 2010, 47, 122–130. [Google Scholar] [CrossRef]
  19. Deng, C.; Bi, L.D.; Qin, J.T.; Zhang, T.L.; Yu, X.C. Effects of long-term fertilization on soil property changes and soil microbial biomass. Soils 2013, 45, 888–893. [Google Scholar] [CrossRef]
  20. Ma, X.X.; Wang, L.L.; Li, Q.H.; Li, H.; Zhang, S.L.; Sun, B.H.; Yang, X.Y. Effects of long-term fertilization on soil microbial biomass carbon and nitrogen and enzyme activities during maize growing season. Acta Ecol. Sin. 2012, 32, 5502–5511. [Google Scholar] [CrossRef] [Green Version]
  21. Liu, L.P. Effects of Potassium Application Rate and Matter on Soil Fertility and Potassium Use Efficiency in Cotton. Master’s Thesis, Nanjing Agricultural University, Nanjing, China, 2014. [Google Scholar]
  22. Doran, J.W.; Parkin, T.B. Defining and assessing soil quality. In Defining Soil Quality for a Sustainable Environment; Doran, J.W., Ed.; Soil Science Society of America Special Publication: Madison, WI, USA, 1994; pp. 3–21. [Google Scholar]
  23. Andrews, S.S.; Mitchell, J.P.; Mancinelli, R.; Karlen, K.L.; Hartz, T.K.; Horwath, W.R.; Prttygrove, F.S.; Scow, K.M.; Munk, D.S. On-farm assessment of soil quality in California’s central valley. Agron. J. 2002, 94, 12–23. [Google Scholar] [CrossRef] [Green Version]
  24. Liu, Z.J.; Zhou, W.; Shen, J.B.; Li, S.T.; Ai, C. Soil quality assessment of yellow clayey paddy soils with different productivity. Biol. Fertil. Soils. 2014, 50, 537–548. [Google Scholar] [CrossRef]
  25. Qi, Y.B.; Darilek, J.L.; Huang, B.; Zhao, Y.C.; Sun, W.X.; Gu, Z.Q. Evaluating soil quality indices in an agricultural regional of Jiangsu Province, China. Geoderma 2009, 149, 325–334. [Google Scholar] [CrossRef]
  26. Ling, N.; Chen, D.M.; Guo, H.; Wei, J.X.; Bai, Y.F.; Shen, Q.R.; Hu, S.J. Differential responses of soil bacterial communities to long-term N and P inputs in a semi-arid steppe. Geoderma 2017, 292, 25–33. [Google Scholar] [CrossRef]
  27. Zhou, J.; Guan, D.W.; Zhou, B.K.; Zhao, B.S.; Ma, M.C.; Qin, J.; Jiang, X.; Chen, S.F.; Cao, F.M.; Shen, D.; et al. Influence of 34-years of fertilization on bacterial communities in an intensively cultivated black soil in northeast China. Soil Biol. Biochem. 2015, 90, 42–51. [Google Scholar] [CrossRef]
  28. Eo, J.; Park, K. Long-term effects of imbalanced fertilization on the composition and diversity of soil bacterial community. Agric. Ecosyst. Environ. 2016, 231, 176–182. [Google Scholar] [CrossRef]
  29. Li, B.Z.; Wang, G.F.; Qin, X.F.; Zhang, L.S.; Han, M.Y.; Zhang, L. Effect of application of biogas slurry with potassium on orchard soil properties and soil microorganism and fruit quality. Sci. Agric. Sin. 2010, 43, 4671–4677. [Google Scholar] [CrossRef]
  30. Jose, T.A.S.; Lourival, F.C.; Jarisson, C.N.; Francisco, T.C.B.; Juliete, A.d.S.N.; Aldeir, R.S.; Denizard, O.; Adailza, G.C. Effect of saline water, bovine biofertilizer and potassium on yellow passion fruit growth after planting and on soil salinity. Afr. J. Agric. Res. 2016, 11, 2994–3003. [Google Scholar] [CrossRef]
  31. Wichern, J.; Wichern, F.; Joergensen, R.G. Impact of salinity on soil microbial communities and the decomposition of maize in acidic soils. Geoderma 2006, 137, 100–108. [Google Scholar] [CrossRef]
  32. Setia, R.; Marschner, P.; Baldock, J.; Chittleborough, D.; Verma, V. Relationships between carbon dioxide emission and soil properties in salt-affected landscapes. Soil Biol. Biochem. 2011, 43, 667–674. [Google Scholar] [CrossRef]
  33. Farahani, E.; Emami, H.; Keller, T.; Fotovat, A.; Khorassani, R. Impact of monovalent cations on soil structure. Part I. Results of an Iranian soil. Int. Agrophys. 2018, 32, 57–67. [Google Scholar] [CrossRef]
  34. Rengasamy, P.; Tavakkoli, E.; Mcdonald, G.K. Exchangeable cations and clay dispersion: Net dispersive charge, a new concept for dispersive soil. Eur. J. Soil Sci. 2016, 67, 659–665. [Google Scholar] [CrossRef]
  35. Mori, T.; Wang, S.H.; Wang, Z.H.; Wang, C.; Mo, H.; Mo, J.M.; Lu, X.K. Testing potassium limitation on soil microbial activity in a sub-tropical forest. J. For. Res. 2018, 30, 2341–2347. [Google Scholar] [CrossRef]
  36. Mann, C.; Lynch, D.; Fillmore, S.; Mills, A. Relationships between field management, soil health, and microbial community composition. Appl. Soil Ecol. 2019, 144, 12–21. [Google Scholar] [CrossRef]
  37. Orwin, K.H.; Dickie, I.A.; Holdaway, R.; Wood, J.R. A comparison of the ability of PLFA and 16S rRNA gene metabarcoding to resolve soil community change and predict ecosystem functions. Soil Biol. Biochem. 2018, 117, 27–35. [Google Scholar] [CrossRef]
  38. Dong, W.Y.; Zhang, X.Y.; Dai, X.Q.; Fu, X.L.; Yang, F.T.; Liu, X.Y.; Sun, X.M.; Wen, X.F.; Schaeffer, S. Changes in soil microbial community composition in response to fertilization of paddy soils in subtropical China. Appl. Soil Ecol. 2014, 84, 140–147. [Google Scholar] [CrossRef]
  39. Yang, X.Y.; Ren, W.D.; Sun, B.H.; Zhang, S.L. Effects of contrasting soil management regimes on total and labile soil organic carbon fractions in a loess soil in China. Geoderma 2012, 177–178, 49–56. [Google Scholar] [CrossRef]
  40. Liu, Z.J.; Chen, Z.J.; Ma, P.Y.; Meng, Y.; Zhou, J.B. Effects of tillage, mulching and N management on yield, water productivity, N uptake and residual soil nitrate in a long-term wheat-summer maize cropping system. Field Crops Res. 2017, 213, 154–164. [Google Scholar] [CrossRef]
  41. Lu, R.K. Analytical Methods of Soil and Agro-Chemistry; China Agricultural Science and Technology Press: Beijing, China, 2000. [Google Scholar]
  42. Joergensen, R.G.; Mueller, T. The fumigation-extraction method to estimate soil microbial biomass: Calibration of the kEC value. Soil Biol. Biochem. 1996, 28, 33–37. [Google Scholar] [CrossRef]
  43. Moeskops, B.; Sukristiyonubowo; Buchan, D.; Sleutel, S.; Herawaty, L.; Husen, E.; Saraswati, R.; Setyorini, D.; De Neve, S. Soil microbial communities and activities under intensive organic and conventional vegetable farming in West Java, Indonesia. Appl. Soil Ecol. 2010, 45, 112–120. [Google Scholar] [CrossRef]
  44. Blair, N.; Faulkner, R.D.; Till, A.R.; Korschens, M.; Schulz, E. Long-term management impacts on soil C, N and physical fertility. Soil Tillage Res. 2006, 91, 39–47. [Google Scholar] [CrossRef]
  45. Johnston, A.E.; Poulton, P.R. The importance of long-term experiments in agriculture: Their management to ensure continued crop production and soil fertility; the Rothamsted experience. Eur. J. Soil Sci. 2018, 69, 113125. [Google Scholar] [CrossRef] [PubMed] [Green Version]
  46. Liang, T.; Tong, Y.A.; Liu, X.J.; Xu, W.; Luo, X.S.; Christie, P. High nitrogen deposition in an agricultural ecosystem of Shaanxi, China. Environ. Sci. Pollut. Res. 2016, 23, 13210–13221. [Google Scholar] [CrossRef] [PubMed]
  47. Lu, X.K.; Vitousek, P.M.; Mao, Q.G.; Gilliam, F.S.; Luo, Y.Q.; Zhou, G.Y.; Zou, X.M.; Bai, E.; Scanlon, T.M.; Hou, E.Q.; et al. Plant acclimation to long-term high nitrogen deposition in an N-rich tropical forest. Proc. Natl. Acad. Sci. USA 2018, 115, 5187–5192. [Google Scholar] [CrossRef] [Green Version]
  48. Meng, H.Q. Characteristics and Mechanisms for Soil Acidification under Long-Term Fertilization in Chinese Croplands. Ph.D. Thesis, Northwest A&F University, Xianyang, China, 2009. [Google Scholar]
  49. Ji, C.J.; Yang, Y.H.; Han, W.X.; He, Y.F.; Smith, J.; Smith, P. Climate and edaphic controls on soil pH in Alpine grassland on the Tibetan Plateau, China: A quantitative analysis. Pedosphere 2014, 24, 39–44. [Google Scholar] [CrossRef]
  50. Guo, S.L.; Zhu, H.H.; Dang, T.H.; Wu, J.S.; Liu, W.Z.; Hao, M.D.; Li, Y.; Syers, J.K. Winter wheat grain yield associated with precipitation distribution under long-term nitrogen fertilization in the semiarid Loess Plateau in China. Geoderma 2012, 189–190, 442–450. [Google Scholar] [CrossRef]
  51. Wright, S.J.; Yavitt, J.B.; Wurzburger, N.; Turner, B.L.; Tanner, E.V.; Sayer, E.J.; Santiago, L.S.; Kaspari, M.; Hedin, L.O.; Harms, K.E.; et al. Potassium, phosphorus, or nitrogen limit root allocation, tree growth, or litter production in a lowland tropical forest. Ecology 2011, 92, 1616–1625. [Google Scholar] [CrossRef]
  52. Liu, L. Biomass Estimation and Spatial Distribution of Maize Root in China. Ph.D. Thesis, China Agricultural University, Beijing, China, 2016. [Google Scholar]
  53. Khan, A.; Lu, G.Y.; Ayaz, M.; Zhang, H.T.; Wang, R.J.; Lv, F.L.; Yang, X.Y.; Sun, B.H.; Zhang, S.L. Phosphorus efficiency, soil phosphorus dynamics and critical phosphorus level under long-term fertilization for single and double cropping systems. Agrics. Ecosyst. Environ. 2018, 256, 1–11. [Google Scholar] [CrossRef]
  54. Yang, Y.; Zhang, S.L.; Yang, X.Y. Effects of long-term fertilization on winter wheat yield and soil nutrients in rainfed Loess soil. Chin. J. Soil Sci. 2018, 49, 402–408. [Google Scholar] [CrossRef]
  55. Wang, W.; Lai, D.Y.F.; Wang, C.; Pan, T.; Zeng, C. Effects of rice straw incorporation on active soil organic carbon pools in a subtropical paddy field. Soil Tillage Res. 2015, 152, 8–16. [Google Scholar] [CrossRef]
  56. Nannipieri, P.; Giagnoni, L.; Renella, G.; Puglisi, E.; Ceccanti, B.; Masciandaro, G.; Fornasier, F.; Moscatelli, M.C.; Marinari, S. Soil enzymology: Classical and molecular approaches. Biol. Fertil. Soils. 2012, 48, 743–762. [Google Scholar] [CrossRef]
  57. Das, S.; Varma, A. Role of enzymes in maintaining soil health. In Soil Enzymology; Shukla, G., Varma, A., Eds.; Springer: Heidelberg, Germany, 2011; pp. 25–42. [Google Scholar]
  58. Bragazza, L.; Robroek, B.J.M.; Jassey, V.E.J.; Arif, M.S.; Marchesini, R.; Guglielmin, M.; Cannone, N. Soil microbial community structure and enzymatic activity along a plant cover gradient in Victoria Land (continental Antarctica). Geoderma 2019, 353, 144–151. [Google Scholar] [CrossRef]
  59. Ai, C.; Liang, G.Q.; Sun, J.W.; Wang, X.B.; Zhou, W. Responses of extracellular enzyme activities and microbial community in both the rhizosphere and bulk soil to long-term fertilization practices in a fluvo-aquic soil. Geoderma 2012, 173–174, 330–338. [Google Scholar] [CrossRef]
  60. Li, J.; Cooper, J.M.; Lin, Z.A.; Li, Y.T.; Yang, X.D.; Zhao, B.Q. Soil microbial community structure and function are significantly affected by long-term organic and mineral fertilization regimes in the North China Plain. Appl. Soil Ecol. 2015, 96, 75–87. [Google Scholar] [CrossRef]
  61. Zhang, Q.; Zhou, W.; Liang, G.Q.; Sun, J.W.; Wang, X.B.; He, P. Distribution of soil nutrients, extracellular enzyme activities and microbial communities across particle-size fractions in a long-term fertilizer experiment. Appl. Soil Ecol. 2015, 94, 59–71. [Google Scholar] [CrossRef]
  62. Acosta-Martínez, V.; Mikha, M.M.; Vigil, M.F. Microbial communities and enzyme activities in soils under alternative crop rotations compared to wheat–fallow for the Central Great Plains. Appl. Soil Ecol. 2007, 37, 41–52. [Google Scholar] [CrossRef]
  63. Li, J.; Tong, X.G.; Awasthi, M.K.; Wu, F.Y.; Ha, S.; Ma, J.Y.; Sun, X.H.; He, C. Dynamics of soil microbial biomass and enzyme activities along a chronosequence of desertified land revegetation. Ecol. Eng. 2018, 111, 22–30. [Google Scholar] [CrossRef]
  64. Gao, J.T.; Wang, E.X.; Ren, W.L.; Liu, X.F.; Chen, Y.; Shi, Y.W.; Yang, Y.S. Effects of simulated climate change on soil microbial biomass and enzyme activities in young Chinese fir (Cunninghamia lanceolata) in subtropical China. Acta Ecol. Sin. 2017, 37, 272–278. [Google Scholar] [CrossRef]
  65. Liu, Z.J.; Rong, Q.L.; Zhou, W.; Liang, G.Q. Effects of inorganic and organic amendment on soil chemical properties, enzyme activities, microbial community and soil quality in yellow clayey soil. PLoS ONE 2017, 12, e0172767. [Google Scholar] [CrossRef]
  66. Pabst, H.; Kühnel, A.; Kuzyakov, Y. Effect of land-use and elevation on microbial biomass and water extractable carbon in soils of Mt. Kilimanjaro ecosystems. Appl. Soil Ecol. 2013, 67, 10–19. [Google Scholar] [CrossRef] [Green Version]
  67. Zhao, S.C.; Qiu, S.J.; Xu, X.P.; Ciampitti, I.A.; Zhang, S.Q.; He, P. Change in straw decomposition rate and soil microbial community composition after straw addition in different long-term fertilization soils. Appl. Soil Ecol. 2019, 138, 123–133. [Google Scholar] [CrossRef]
  68. Shi, P.; Wang, S.P.; Jia, S.G.; Gao, Q. Effect of 25-year fertilization on soil microbial biomass and community structure in a continuous corn cropping system. Arch. Agron. Soil Sci. 2015, 61, 1303–1317. [Google Scholar] [CrossRef]
  69. Guo, A.N.; Zhao, Z.Q.; Zhang, P.F.; Yang, Q.; Li, Y.F.; Wang, G.Y. Linkage between soil nutrient and microbial characteristic in an opencast mine, China. Sci. Total Environ. 2019, 671, 905–913. [Google Scholar] [CrossRef] [PubMed]
  70. Fanin, N.; Kardol, P.; Farrell, M.; Nilsson, M.-C.; Gundale, M.J.; Wardle, D.A. The ratio of Gram-positive to Gram-negative bacterial PLFA markers as an indicator of carbon availability in organic soils. Soil Biol. Biochem. 2019, 128, 111–114. [Google Scholar] [CrossRef]
  71. Kramer, C.; Gleixner, G. Soil organic matter in soil depth profiles: Distinct carbon preferences of microbial groups during carbon transformation. Soil Biol. Biochem. 2008, 40, 425–433. [Google Scholar] [CrossRef]
  72. Luo, P.Y.; Han, X.R.; Wang, Y.; Han, M.; Shi, H.; Liu, N.; Bai, H.Z. Influence of long-term fertilization on soil microbial biomass, dehydrogenase activity, and bacterial and fungal community structure in a brown soil of northeast China. Ann. Microbiol. 2015, 65, 533–542. [Google Scholar] [CrossRef] [Green Version]
  73. Guimarães, D.V.; Gonzaga, M.I.S.; da Silva, T.O.; da Silva, T.L.; da Silva Dias, N.; Matias, M.I.S. Soil organic matter pools and carbon fractions in soil under different land uses. Soil Tillage Res. 2013, 126, 177–182. [Google Scholar] [CrossRef] [Green Version]
  74. Ananbeh, H.; Stojanovic, M.; Pompeiano, A.; Voberkova, S.; Trasar-Cepeda, C. Use of soil enzyme activities to assess the recovery of soil functions in abandoned coppice forest systems. Sci. Total Environ. 2019, 694, 133692. [Google Scholar] [CrossRef]
Figure 1. Comparison of soil microbial biomass C (a) and microbial biomass N (b) after 27 years of fertilization treatments (CK, no fertilizer; NP, nitrogen and phosphorous fertilizer; NPK, nitrogen, phosphorus, and potassium fertilizer) in a wheat–fallow system. Vertical bars represent the standard error (n = 3). Different lowercase letters indicate significant differences among fertilizer treatments (p < 0.05).
Agronomy 10 00771 g001
Figure 2. Radar graph of the relative responses of enzymatic activities to long-term fertilization treatments (CK, no fertilizer; NP, nitrogen and phosphorous fertilizer; NPK, nitrogen, phosphorus, and potassium fertilizer). Asterisks indicate significant differences among fertilizer treatments (* p < 0.05; ** p < 0.01). Pho: phosphatase; αG: α-glucosidase; βG: β-glucosidase; CBH: cellobiohydrolase; NAG: N-acetyl-glucosaminidase; Sul: sulfatase; Perox: peroxidase; PhOx: phenol oxidase.
Agronomy 10 00771 g002
Figure 3. Principal components analysis (PCA) of enzymatic activities in soils from different long-term fertilizer treatments (CK, no fertilizer; NP, nitrogen and phosphorous fertilizer; NPK, nitrogen, phosphorus, and potassium fertilizer). The circled symbols indicate significant groupings. (a) Redundancy analysis (RDA) of the correlations between soil chemical parameters and soil enzyme profiles (b) The red arrow indicates that SOC had a strong and significant effect on enzymatic activities (p < 0.05), explaining 58.4% of the variability. TN: total N; AP: available P; AK: available K; SOC: soil organic carbon; MBC: microbial biomass C; MBN: microbial biomass N.
Agronomy 10 00771 g003
Figure 4. Comparisons of total PLFAs (a) and those for G+ (b) and G− bacteria (c), total bacteria (d), fungi (e), actinomycetes (f), and the ratios of G+:G− bacteria (g) and fungi:bacteria (h) in soils from different long-term fertilizer treatments (CK, no fertilizer; NP, nitrogen and phosphorous fertilizer; NPK, nitrogen, phosphorus, and potassium fertilizer). Microbial abundance is expressed as nmol g−1. Vertical bars represent the standard error (n = 3). Different lowercase letters indicate significant differences among fertilizer treatments (p < 0.05).
Agronomy 10 00771 g004
Figure 5. Principal components analysis (PCA) of microbial communities in soils from different long-term fertilizer treatments (CK, no fertilizer; NP, nitrogen and phosphorous fertilizer; NPK, nitrogen, phosphorus, and potassium fertilizer) (a). The circled symbols indicate significant groupings. Redundancy analysis (RDA) of the correlations between soil parameters and microbial community components (b). The red arrow indicates that SOC had a strong and significant effect on enzymatic activities (p < 0.05), explaining 35.1% of the variability. TN: total N; AK: available K; SOC: soil organic carbon; MBC: microbial biomass C.
Agronomy 10 00771 g005
Figure 6. Comparison of SQI scores among different long-term fertilizer treatments (CK, no fertilizer; NP, nitrogen and phosphorous fertilizer; NPK, nitrogen, phosphorus, and potassium fertilizer). Vertical bars represent the standard error (n = 3). Different lowercase letters indicate significant differences among fertilizer treatments for the SQI scores obtained from each group with similar variables (p < 0.05). Different uppercase letters indicate significant differences among fertilizer treatments for the total SQI scores obtained from the combined groups (p < 0.05).
Agronomy 10 00771 g006
Figure 7. Linear relationship between soil quality index (SQI) and wheat grain yield (kg ha–1) across different long-term fertilizer treatments (CK—no fertilizer; NP—nitrogen and phosphorous fertilizer; NPK—nitrogen, phosphorus, and potassium fertilizer). The relationship is described by the regression equation y = 12061x−4458; R2 = 0.986; p < 0.001. R2 is the coefficient of determination.
Agronomy 10 00771 g007
Figure 8. Partial least squares path model (PLS-PM) showing the multivariate effects on SQI and crop yield. Solid blue and red arrows represent significant (p < 0.05) positive and negative paths, respectively; arrow widths denote the magnitude of these effects. Dashed lines indicate nonsignificant (p > 0.05) pathways. Numbers near the lines represent the standard path coefficients. The model was assessed using the Goodness of Fit (GoF) statistic; the GoF value was 0.77. Notes: NPK: soil nutrient (total N; available N; available P; available K); SOC: soil organic carbon; Enzyme: enzyme activity; Microbes: microbial community; SQI: soil quality index.
Agronomy 10 00771 g008
Table 1. Enzymes with corresponding enzyme commission (EC) numbers and substrates. 4-MUB, 4-methylumbelliferyl; L-DOPA, L-3,4-dihydroxyphenylalanine.
EnzymeAbbreviationSubstrateEC
PhosphatasePho4-MUB-phosphate3.1.3.1
SulfataseSul4-MUB-sulfate3.1.6.1
β-GlucosidaseβG4-MUB-β-d-glucoside3.2.1.21
CellobiohydrolaseCBH4-MUB-β-d-cellobioside3.2.1.91
N-Acetyl-glucosaminidaseNAG4-MUB-N-acetyl-β-d-glucosaminide3.2.1.30
α-GlucosidaseαG4-MUB-α-d-glucoside3.2.1.20
Phenol oxidasePhOxL-DOPA1.10.3.2
PeroxidasePeroxL-DOPA1.11.1.7
Table 2. Soil pH and nutrient concentrations after long-term fertilization (CK, no fertilizer; NP, nitrogen and phosphorous fertilizer; NPK, nitrogen, phosphorus, and potassium fertilizer). Data are presented as the mean ± standard error (n = 3). Different letters indicate significant differences among fertilizer treatments (p < 0.05).
TreatmentpHSoil Organic C
(g kg−1)
Total N
(g kg−1)
Available N
(mg kg−1)
Available P
(mg kg−1)
Available K
(mg kg−1)
CK8.34 ± 0.02a8.18 ± 0.35c1.05 ± 0.18b3.87 ± 0.10c4.13 ± 0.67c170.27 ± 26.57b
NP8.10 ± 0.04c10.94 ± 0.32a1.30 ± 0.16a6.92 ± 0.41a47.50 ± 2.86a178.73 ± 29.56b
NPK8.20 ± 0.04b10.34 ± 0.12b1.44 ± 0.19a5.40 ± 0.10b32.80 ± 3.40b306.93 ± 6.35a

