Article

Potential Use of Rice Husk Biochar and Compost to Improve P Availability and Reduce GHG Emissions in Acid Sulfate Soil

1
Graduate School of Bio-Applications and Systems Engineering, Tokyo University of Agriculture and Technology, Tokyo 184-8588, Japan
2
Department of Soil Science, Can Tho University, Campus II, 3-2 street, Can Tho 900100, Vietnam
3
School of Biosciences, University of Nottingham, Sutton Bonington Campus, Loughborough, Leicestershire LE12 5RD, UK
4
Institute of Agriculture, Tokyo University of Agriculture and Technology, Tokyo 183-8509, Japan
*
Author to whom correspondence should be addressed.
Agronomy 2020, 10(5), 685; https://doi.org/10.3390/agronomy10050685
Submission received: 6 April 2020 / Revised: 9 May 2020 / Accepted: 11 May 2020 / Published: 12 May 2020
(This article belongs to the Section Soil and Plant Nutrition)

Abstract

:
Acid sulfate soil (ASS) has major problems related to phosphorus deficiency and high potential for N2O emissions, as well as strong acidity. The objective of this study was to evaluate the effects of rice husk biochar and compost on P availability and greenhouse gas (GHG) emissions in ASS in in vitro incubation studies. An ASS was amended with two types of rice husk biochar (at rates of 0 g kg−1, 20 g kg−1, and 50 g kg−1, equivalent to 0 Mg ha−1, 20 Mg ha−1, and 50 Mg ha−1, assuming that bulk density was 1 g cm−3 and evenly applied for 10 cm in depth) and compost (at rates of 0 g kg−1, 10 g kg−1, and 20 g kg−1, equivalent to 0 Mg ha−1, 10 Mg ha−1, and 20 Mg ha−1) and incubated. Application of compost increased labile P by 100% and 200% at rates of 10 g kg−1 and 20 g kg−1, respectively. Both biochars showed an increase in NaHCO3-soluble inorganic P by 16% to 30%, decreases in NaOH-soluble inorganic P and NaHCO3-soluble organic P. N2O emissions were significantly decreased by 80% by a biochar with a higher surface area and higher NH4+ adsorption capacity at a rate of 50 g kg−1 as compared with those in un-amended soil. In contrast, compost amendment at a rate of 10 g kg−1 significantly increased N2O emission by 150%. These results suggest that in ASS, whilst compost is more effective in improving P availability, biochar is more effective in mitigating GHG emissions, emphasizing that fundamental characteristics of organic amendments influenced the outcomes in terms of desirable effects.

1. Introduction

Acid sulfate soil (ASS) is the most dominant soil in the Mekong Delta (MD), covering 41% of the total area [1]. This soil brings many difficulties for crop production because of its strong acidity and high proportion of Fe and Al compounds which can lead to a deficiency of available P [2,3]. The major limitation of ASS is that significant amounts of P fertilizer become unavailable to plant due to high P sorption capacity [4]. P sorption in soil comprises both precipitation/dissolution and adsorption/desorption processes. Fe and Al dominate the precipitation of P at acidic pH. Adsorption/desorption of P in soil occurs on the surface of Fe and Al (hydrous) oxides and at the edge of clay minerals, and the adsorption/desorption processes are controlled by pH and the competition between different anions for exchange sites.
Managing soil properties such as pH, ion composition and limiting the active Fe and Al in ASS can increase P availability and enhance the efficiency of P fertilizers. In general, organic-based amendments increase the pH in acid soils and can provide additional benefits such as providing available and balanced nutrients, including P, hence saving inorganic fertilizers as well as improvement of soil physical properties. In acid soils, organic fertilizer plays important roles in improvement of cation exchange capacity (CEC) and soil organic carbon, reduction of Al and Fe toxicity as well as a supply of available P [5,6]. Phosphorus availability is improved in several ways via the application of organic matter. Guppy et al. [5] illustrated that in soil with a high P sorption capacity, organic compounds competitively inhibit P sorption, and hence release P into soil. Furthermore, metal complexation and dissolution reactions from Fe and Al-bound P could release P for plant uptake [5,7].
Agriculture is a major greenhouse gas (GHG) emission source, producing 60% and 50% of total anthropogenic N2O and CH4 emissions, respectively [8]. Agricultural production in the MD is facing difficulties related to water scarcity due to climate change-induced salinity intrusion [9]. In order to adapt to water limitation and salinity, a part of paddy rice has been converted to upland crops. N2O emissions, however, are burgeoning in upland crop systems and need to be better managed. In the case of ASS, once converted to upland cropping systems, potential N2O emissions from fertilizers can increase 10-fold compared to those in non-ASS [10,11]. Mitigation of agricultural GHG by agricultural practices is found to be a cost-efficient option as compared with non-agricultural options [12]. Mitigation of CH4 and N2O emissions from soils contributes to global long-term mitigation goals.
Recently, the application of biochar (a solid material produced from biomass pyrolysis under a low/no oxygen environment) has received attention in agriculture. Biochar amendment to soil has been described as a promising tool to improve soil quality, sequester carbon and mitigate GHG emissions [13,14]. Biochar has potential to alter P availability in soil by several mechanisms. Biochar effects on soil pH can alter the precipitation/dissolution and adsorption/desorption of P [4]. P can be sorbed onto compounds such as Ca, Mg, Fe, or Al in biochar [15,16,17], and consequently, P availability may be decreased. Biochar brings available P into soils, the amounts and forms of which depend on the production method, particularly pyrolysis temperature and materials [18,19]. Through positive effects on phosphate-solubilizing bacteria, particularly in acid soil, biochar could contribute to increasing P availability [20]. In addition, silicon found in high content in some biochars [21] contributes to form Al–Si compounds [22] and mobilizes Fe(III)-P phases from mineral surfaces [23]. These results suggest that biochar containing a high concentration of silicon, like rice husk biochar, may improve P availability in soil. In general, the application of biochar decreases exchangeable Al and soluble Fe in acid soils [24,25], but there are not many studies on using biochar to improve P availability in ASS.
In addition, biochar has been considered as a potential way to create a carbon sink, to increase soil water holding capacity, and to reduce emissions of NOx and CH4 [26,27,28]. However, the effects of biochar on reducing GHG emissions, particularly N2O emission, are variable and strongly depend on the attributes of both the soil and the biochar [29]. Not all types of biochar have a similar impact on a particular soil and a particular biochar may not be equally effective on all soil types [13,30,31] because of the influence of pyrolysis conditions and feedstock on biochar properties [32]. The surface area and pore volume of biochar increase with the increase of pyrolytic temperature [33,34], while low pyrolytic temperature may produce biochars which are appropriate for regulating the release of potential plant nutrients [35]. The adsorption ability of biochar to metals and some other nutrients is correlated with the surface area, porosity, and functional groups [36,37]. The objectives of this study were to investigate the effects of biochar and compost, both of which were derived from agricultural by-products available in the MD, on P fractions and GHG emissions in an acid sulfate soil originating from a rice cropping system in the MD. We utilized two forms of biochar, commercially or laboratory-produced, since both were made from rice husk in different ways and showed different resultant properties.

2. Materials and Methods

2.1. Materials

Acid sulfate soil originating from a rice cropping system in Ben Tre Province, the Mekong Delta, Vietnam (9°57’48.5” N, 106°31’40.6” E) was used for incubation experiments. The soil has been classified as Gleyi Thionic Fluvisols according to the International Union of Soil Sciences (IUSS) Working Group World Reference Base for Soil Resources (WRB) (2015), containing jarosite within 50 cm. The land has been used for paddy rice cultivation for more than 10 years. Soil was collected from the surface layer (0–20 cm), air-dried and sieved though a 5 mm screen before incubation. A commercially available compost from sugarcane filter cake and two kinds of rice husk biochar were used in this study. Biochar A was produced using a simple technology with a biochar chamber pyrolysis unit with a nominal peak temperature of 600–700 °C at the College of Environment and Natural Resources, Can Tho University, Vietnam. Biochar B was produced industrially at around 600 °C. Characteristics of the soil and organic amendments are presented in Table 1 and Table 2.

2.2. Incubation Experiment

The incubation experiment was performed at 25 °C with units consisting of 80 g of dry soil (control) or 80 g of dry soil + amendment (biochar or compost) in a 250 mL jar. The experiment was laid out in three replicates with three rates of amendment as in Table 3. The biochar or compost was thoroughly mixed with dry soil to obtain a completely homogeneous mixture. Subsequently, a solution containing inorganic N, P and K was added to attain the required moisture from analytical grade NH4NO3 and K2HPO4 (equivalent to the recommended dose for sesame in the MD). Soil moisture was adjusted to be equivalent to 70% of the maximum water holding capacity (MWHC) of the initial soil, following other studies [39,40], and at this moisture level both nitrification and denitrification are expected to occur. The incubation experiment was conducted without adjusting bulk density. At this moisture level and without compacting, soil thicknesses were around 30 mm (for Cont, Comp10, and Comp20), 31 mm (for CharA20 and CharB20), and 33 mm (for CharA50 and CharB50). During the incubation period, the jars were covered with a parafilm sheet that allows gas exchange but minimizes evaporation. Soil moisture was kept constant by adding deionized water every day in the first 10 days, then every two days in the next 35 days, and every 3–4 days until the end of the experiment.

2.3. Gas Sampling and Measurement

Gas samples were collected at day 0, 1, 2, 3, 5, 10, and 20 of incubation to measure GHGs (CO2, CH4, and N2O). For each gas sampling time, jars were closed 40 min before collecting gas samples by robber covers with stopcocks. Headspace gas samples (10 mL) were collected by using 25 mL polypropylene syringes connected to stopcocks and transferred to 3 mL vials with a previously made vacuum. The concentrations of CO2, CH4 and N2O at each collecting time were measured by manually injecting 0.5 mL, 1 mL, and 1 mL of the headspace gases into a gas chromatograph (GC, Shimadzu GC-8A, Japan) with a thermal conductivity detector (TCD), GC (Shimadzu GC-14B, Japan) with a flame ionization detector (FID) and GC (Shimadzu GC-2014, Japan) with an electron capture detector (ECD), respectively. GHG fluxes were calculated based on linear increase during the accumulation period from closing (0 min, 15 min, 30 min, and 45 min) [41].
Cumulative CO2, CH4 and N2O emissions were weighted by the time intervals between two sampling dates (Equation (1)) [42].
C u m u l a t i v e = i = 1 7 f i + f i + 1 2   x   24   x   d i + d i + 1
where fi is the CO2, CH4 or N2O flux at the ith sampling (CO2: μg CO2 kg1 soil h1; CH4: μg CH4 kg1 soil h1; N2O: μg N2O kg1 soil h1) and di denotes the day of the ith sampling.

2.4. Soil Sampling for Chemical Analysis

Soil pH and electrical conductivity (EC) were measured after 1.5 months of incubation. Soils were collected to sequential fractionation for phosphorus after 1.5 and 6 months of incubation, following other studies [43,44].
A parallel incubation was set up using 20 g of soil in a 50 mL jar with the same rates of amendment and inorganic fertilizers to determine the dynamics of soil ammonium (NH4+) and nitrate (NO3) contents at day 0, 1, 2, 5, and 45 of incubation because the N2O emission occurred mainly in the first 5 days.

2.5. Chemical Analysis

Soil pH (H2O) and EC were determined by extracting soil with deionized water at a ratio of 1:5 (soil:water, w:v) and shaking for 1 h at 120 rpm. The extracts were measured using a pH meter (Metrohm 744) and an EC meter (Horiba B-173). Ammonium and nitrate contents were determined by extracting 2.5 g soil with 25 mL of 2 M KCl. The extracts were analyzed for NO3 content by UV-VIS spectrometry at 220 nm and NH4+ content was measured with the indo-blue method [45]. Iodine number was determined by extracting 0.5 g biochar with an iodine solution followed the method described by American Society for Testing and Materials (ASTM) International [46]. Total N and C were determined using a CN Corder MT-700 apparatus (Yanaco Co., Japan). Soluble Na, K, and Ca were determined by extracting with deionized water at a ratio of 1:10 (soil:water) and shaking for 1 h at 120 rpm. The mixture was centrifuged at 8000× g and passed through filter paper (Advantec No. 5C) and ions in the filtrate were determined with flame photometry (Flame Photometers, BWB). Exchangeable Na, K, and Ca were obtained by subtracting soluble cations from extractable cations. Extractable cations were analyzed by extracting soil samples (2.5 g) three times with 0.1 M BaCl2 solution (each time in 30 mL, shaking for 1 h at 120 rpm) and determined with flame photometry [45]. P fractions were analyzed followed the Hedley method [38]. Fresh soil samples equivalent to 0.5 g of oven-dried soil were sequentially fractionated into the following forms: H2O, 0.5 M NaHCO3 (pH 8.5), 0.1 M NaOH, 0.1 N HCl, and residual P. For each extraction step, 30 mL of extraction solution was added into a centrifuge tube containing a 0.5 g soil sample. The centrifuge tube was shaken for 16 h, centrifuged at 8000× g, and inorganic P (Pi) in the solution was measured (H2O-P, NaHCO3-Pi, NaOH-Pi, and HCl-Pi). The remaining residue was kept for the next extraction. The extraction solution was topped up from 5 mL to 10 mL in the digestion tube, and the extract was digested with 4 mL condensed H2SO4 and 30% of H2O2 at 250 °C until the solution became transparent. Aliquots of extractions and digestions were adjusted to pH 7 by adding NaOH or HCl and made up to 50 mL before the measurement of total P (Pt). Organic P (Po) fraction was calculated by the difference between Pt and Pi (Equation (2)). The final residue was digested by adding 6 mL condensed H2SO4:HClO4 (1:2, v:v) for residual P.
P o = P t P i
where Po (mg P kg−1) is organic P, Pt (mg P kg−1) is total P (for each fraction), and Pi (mg P kg−1) is inorganic P.

2.6. Adsorption Ability

The adsorption abilities of biochar to NH4+, NO3, and PO43− were determined separately. Samples (0.2 g) were collected into centrifuge tubes (50 mL of volume) and mixed with 25 mL of NH4+, NO3, and PO43− solutions at different concentrations (0 mg L−1, 2 mg L−1, 10 mg L−1, and 100 mg L−1). The centrifuge tubes were shaken for 24 h at 120 rpm, centrifuged at 8000× g in 10 min, and the supernatant was filtered through filter paper (Advantec No. 5C). The adsorption capacity of biochar was calculated based on the concentration of NH4+, NO3, and PO43− remaining in the filtered solution (Equation (3)).
A C = C i C f m   x   V
where AC (mg g1) is the capacity of biochar in adsorbing NH4+, NO3 or PO43−, and Ci (mg L1) and Cf (mg L1) are the initial and final concentrations of each ion before and after biochar addition, respectively. V (L) is the volume of ion solution, and m (g) is the dosage of biochar.

2.7. Data Analysis

Significant differences (p < 0.05) between treatments were identified by one-way ANOVA followed by Fisher’s test. A normality test was conducted for residuals of data for every parameter. If the normality was not met as assessed by Kolmogorov–Smirnov’s test, the data were log-transformed prior to ANOVA. The average of replicates (n = 3) is presented with standard deviation in all tables and figures. Pearson’s correlation analysis together with regression tests were used to investigate the relationships between gas emissions and chemical characteristics of the soil. All statistical tests were conducted with Minitab (Version 18) software.

3. Results

3.1. Change in Soil Chemical Properties with Biochar and Compost Amendment

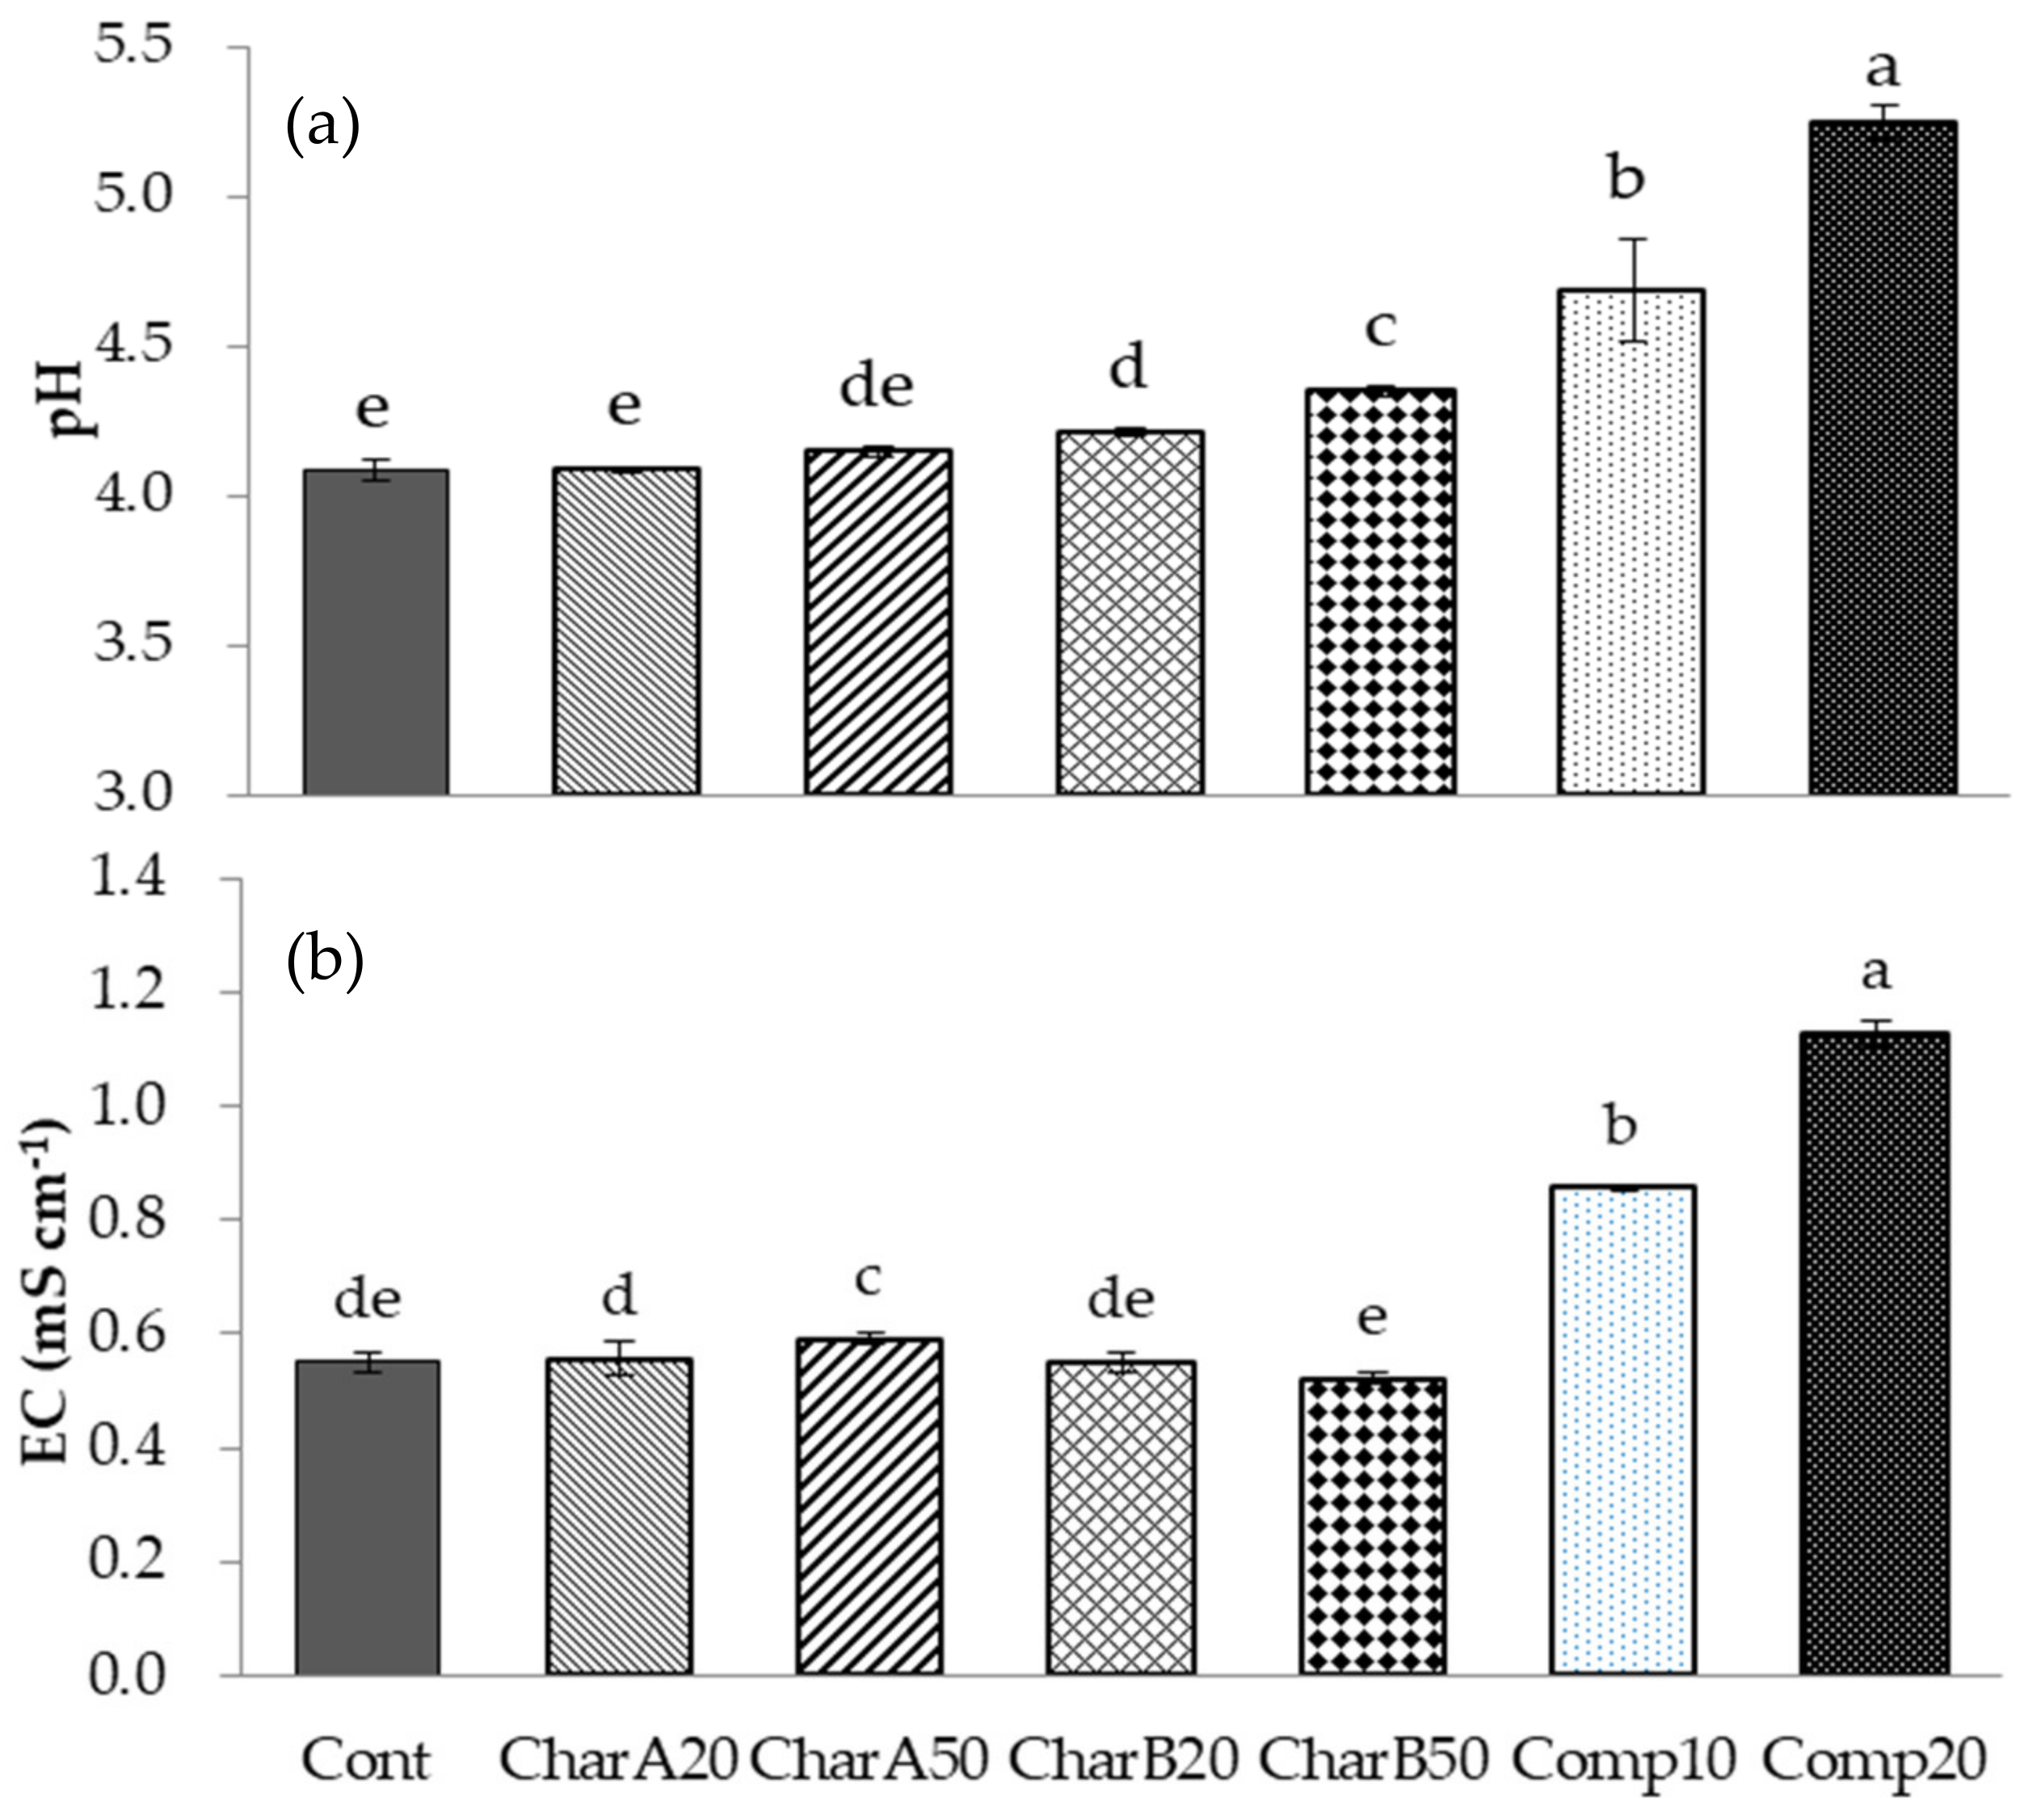
3.1.1. Soil pH and EC

Soil pH and EC were significantly higher (p < 0.05) in soil amended with compost, while biochar increased soil pH but not EC (Figure 1a,b). Soil pH increased commensurate with the increased dosages of compost and biochar. The highest increase in pH value was recorded in the treatment applied with compost. Compared to Biochar A, amending with Biochar B resulted in higher pH value. There was a significant increase in EC in compost treatments, with the values raised up from 0.55 mS cm−1 to 0.86 mS cm−1 and 1.13 mS cm−1. As for the remaining treatments, the EC values varied between 0.5 mS cm−1 and 0.6 mS cm−1.

3.1.2. Phosphorus Factions

The P fractions were significantly affected by both compost and biochar amendments. Amending compost significantly increased all P fractions except for NaHCO3-Po, and the highest values were found for the Comp20 treatment (Table 4). Labile P, as a sum of H2O-P and NaHCO3-Pi, was increased by 100% and 200% compared to unamended soil when applying 10 g kg−1 and 20 g kg−1 soil, respectively (Table 4). The biggest increases were in NaHCO3-Pi in the Comp20 treatment, at 81.5 mg P kg−1 and 141 mg P kg−1 after 1.5-month and 6-month incubations, respectively. Amendment with biochar also increased NaHCO3-Pi at the dosage of 50 g kg−1, but the differences between Biochar A and Biochar B were not significant (Table 4). The NaOH-Pi form decreased with the increase of biochar application dosage irrespective of biochar type after 1.5 months of incubation, but not after 6 months of incubation. Similarly, both biochars reduced NaHCO3-Po significantly compared to both compost amended and unamended treatments after 6 months. Labile P in all treatments increased with time of incubation (p < 0.001) (Table 4), and the increase in labile P was appropriate with the increase in NaHCO3-Pi and the decrease in H2O-P and NaHCO3-Po.

3.1.3. Ammonium and Nitrate in Soil

In the first five days of incubation, the NH4+ concentrations increased in all treatments except for the first day. After the starting incubation, CharA50 showed a decrease in NH4+ concentration compared to day 0, while other treatments showed an unchanged or increased trend in the first day (Table 5). Nitrate concentrations increased in the first day and then decreased in all treatments until day 5 of incubation (Table 5). After a 1.5-month incubation, the NH4+ concentrations decreased significantly in all treatments compared to prior to incubation, with the biggest decrease in the Comp20 treatment. The NO3 concentrations slightly increased with the application of Biochar A and compost (with an increase of around 10 mg NO3-N kg−1), but decreased in soil amended with Biochar B after 1.5 months. In particular, in compost amended treatments, NH4+ decreased from 313 mg NH4+-N kg−1 to 161 mg NH4+-N kg−1 and 560 mg NH4+-N kg−1 to 302 mg NH4+-N kg−1, but the increase of NO3 was only 5 mg NO3-N kg−1 and 6 mg NO3-N kg−1 by applying 10 g kg−1 and 20 g kg−1, respectively.

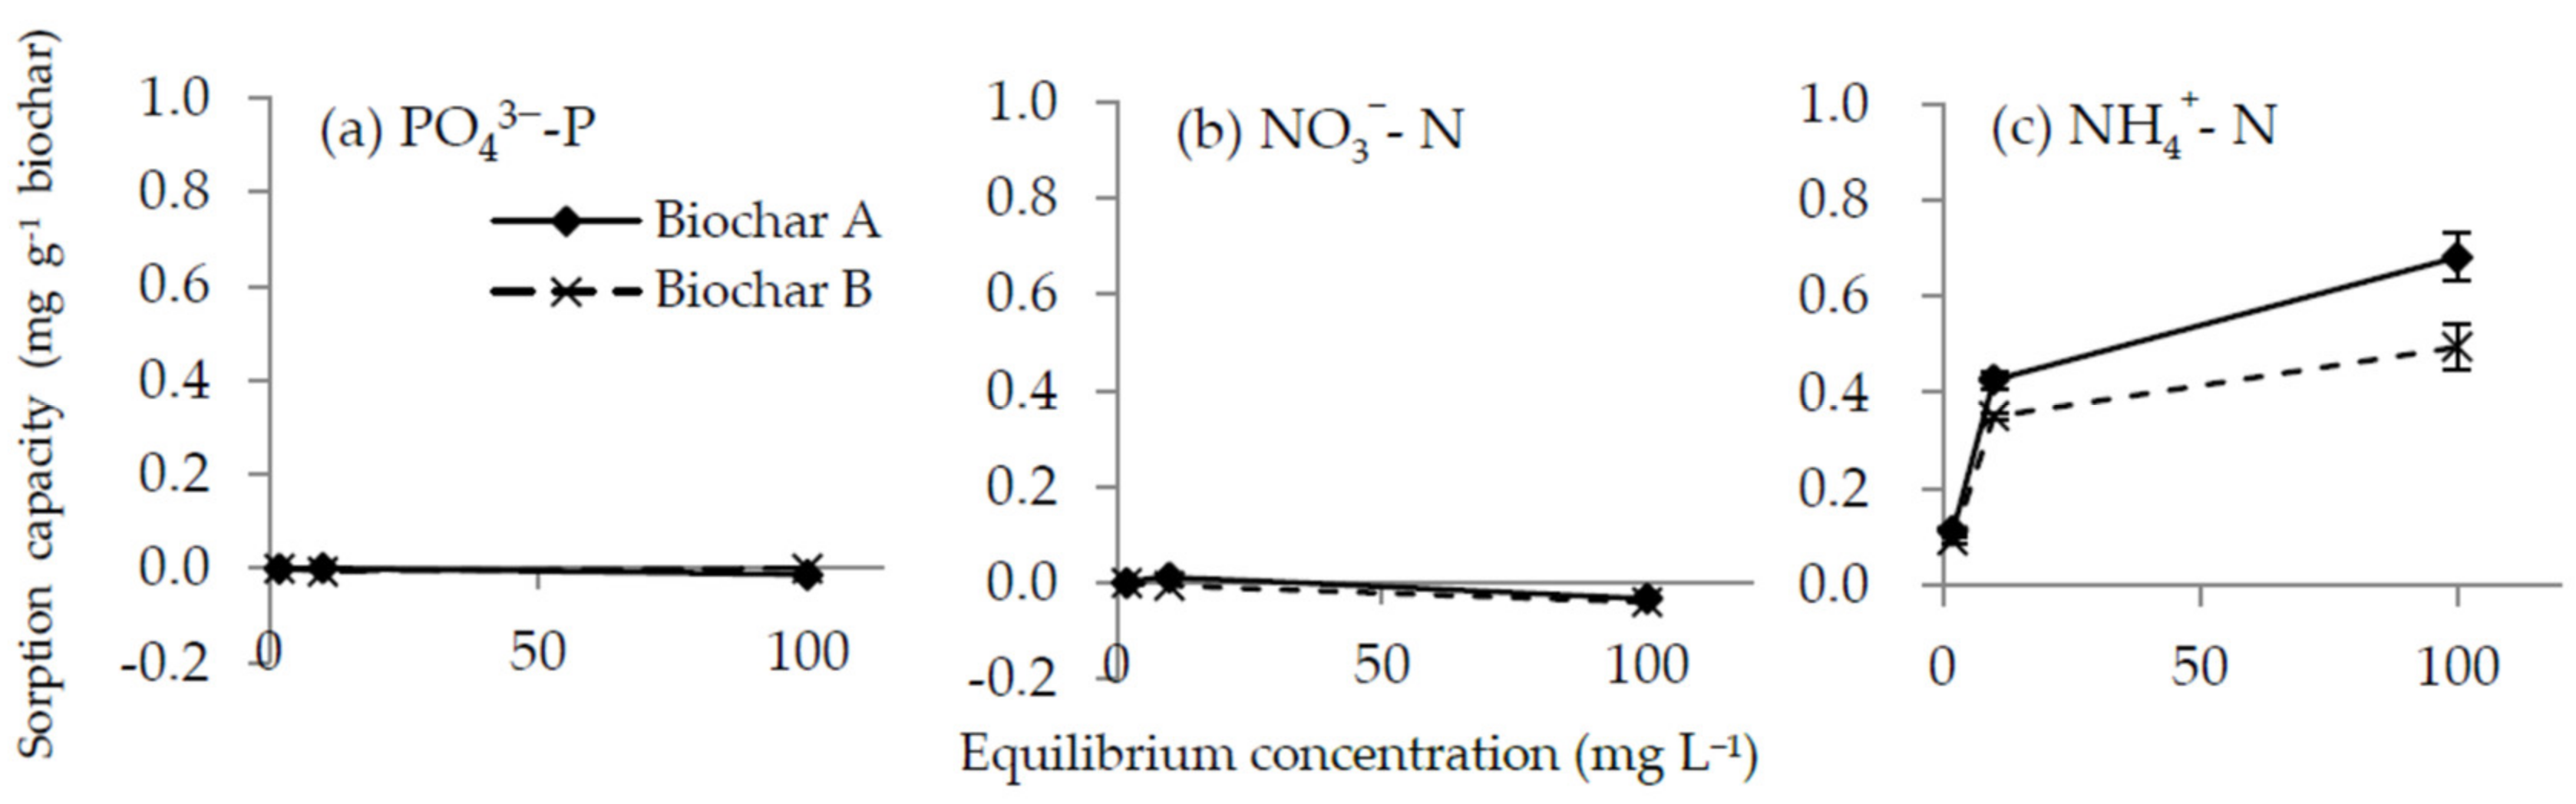
3.2. Biochar Adsorption Capacity
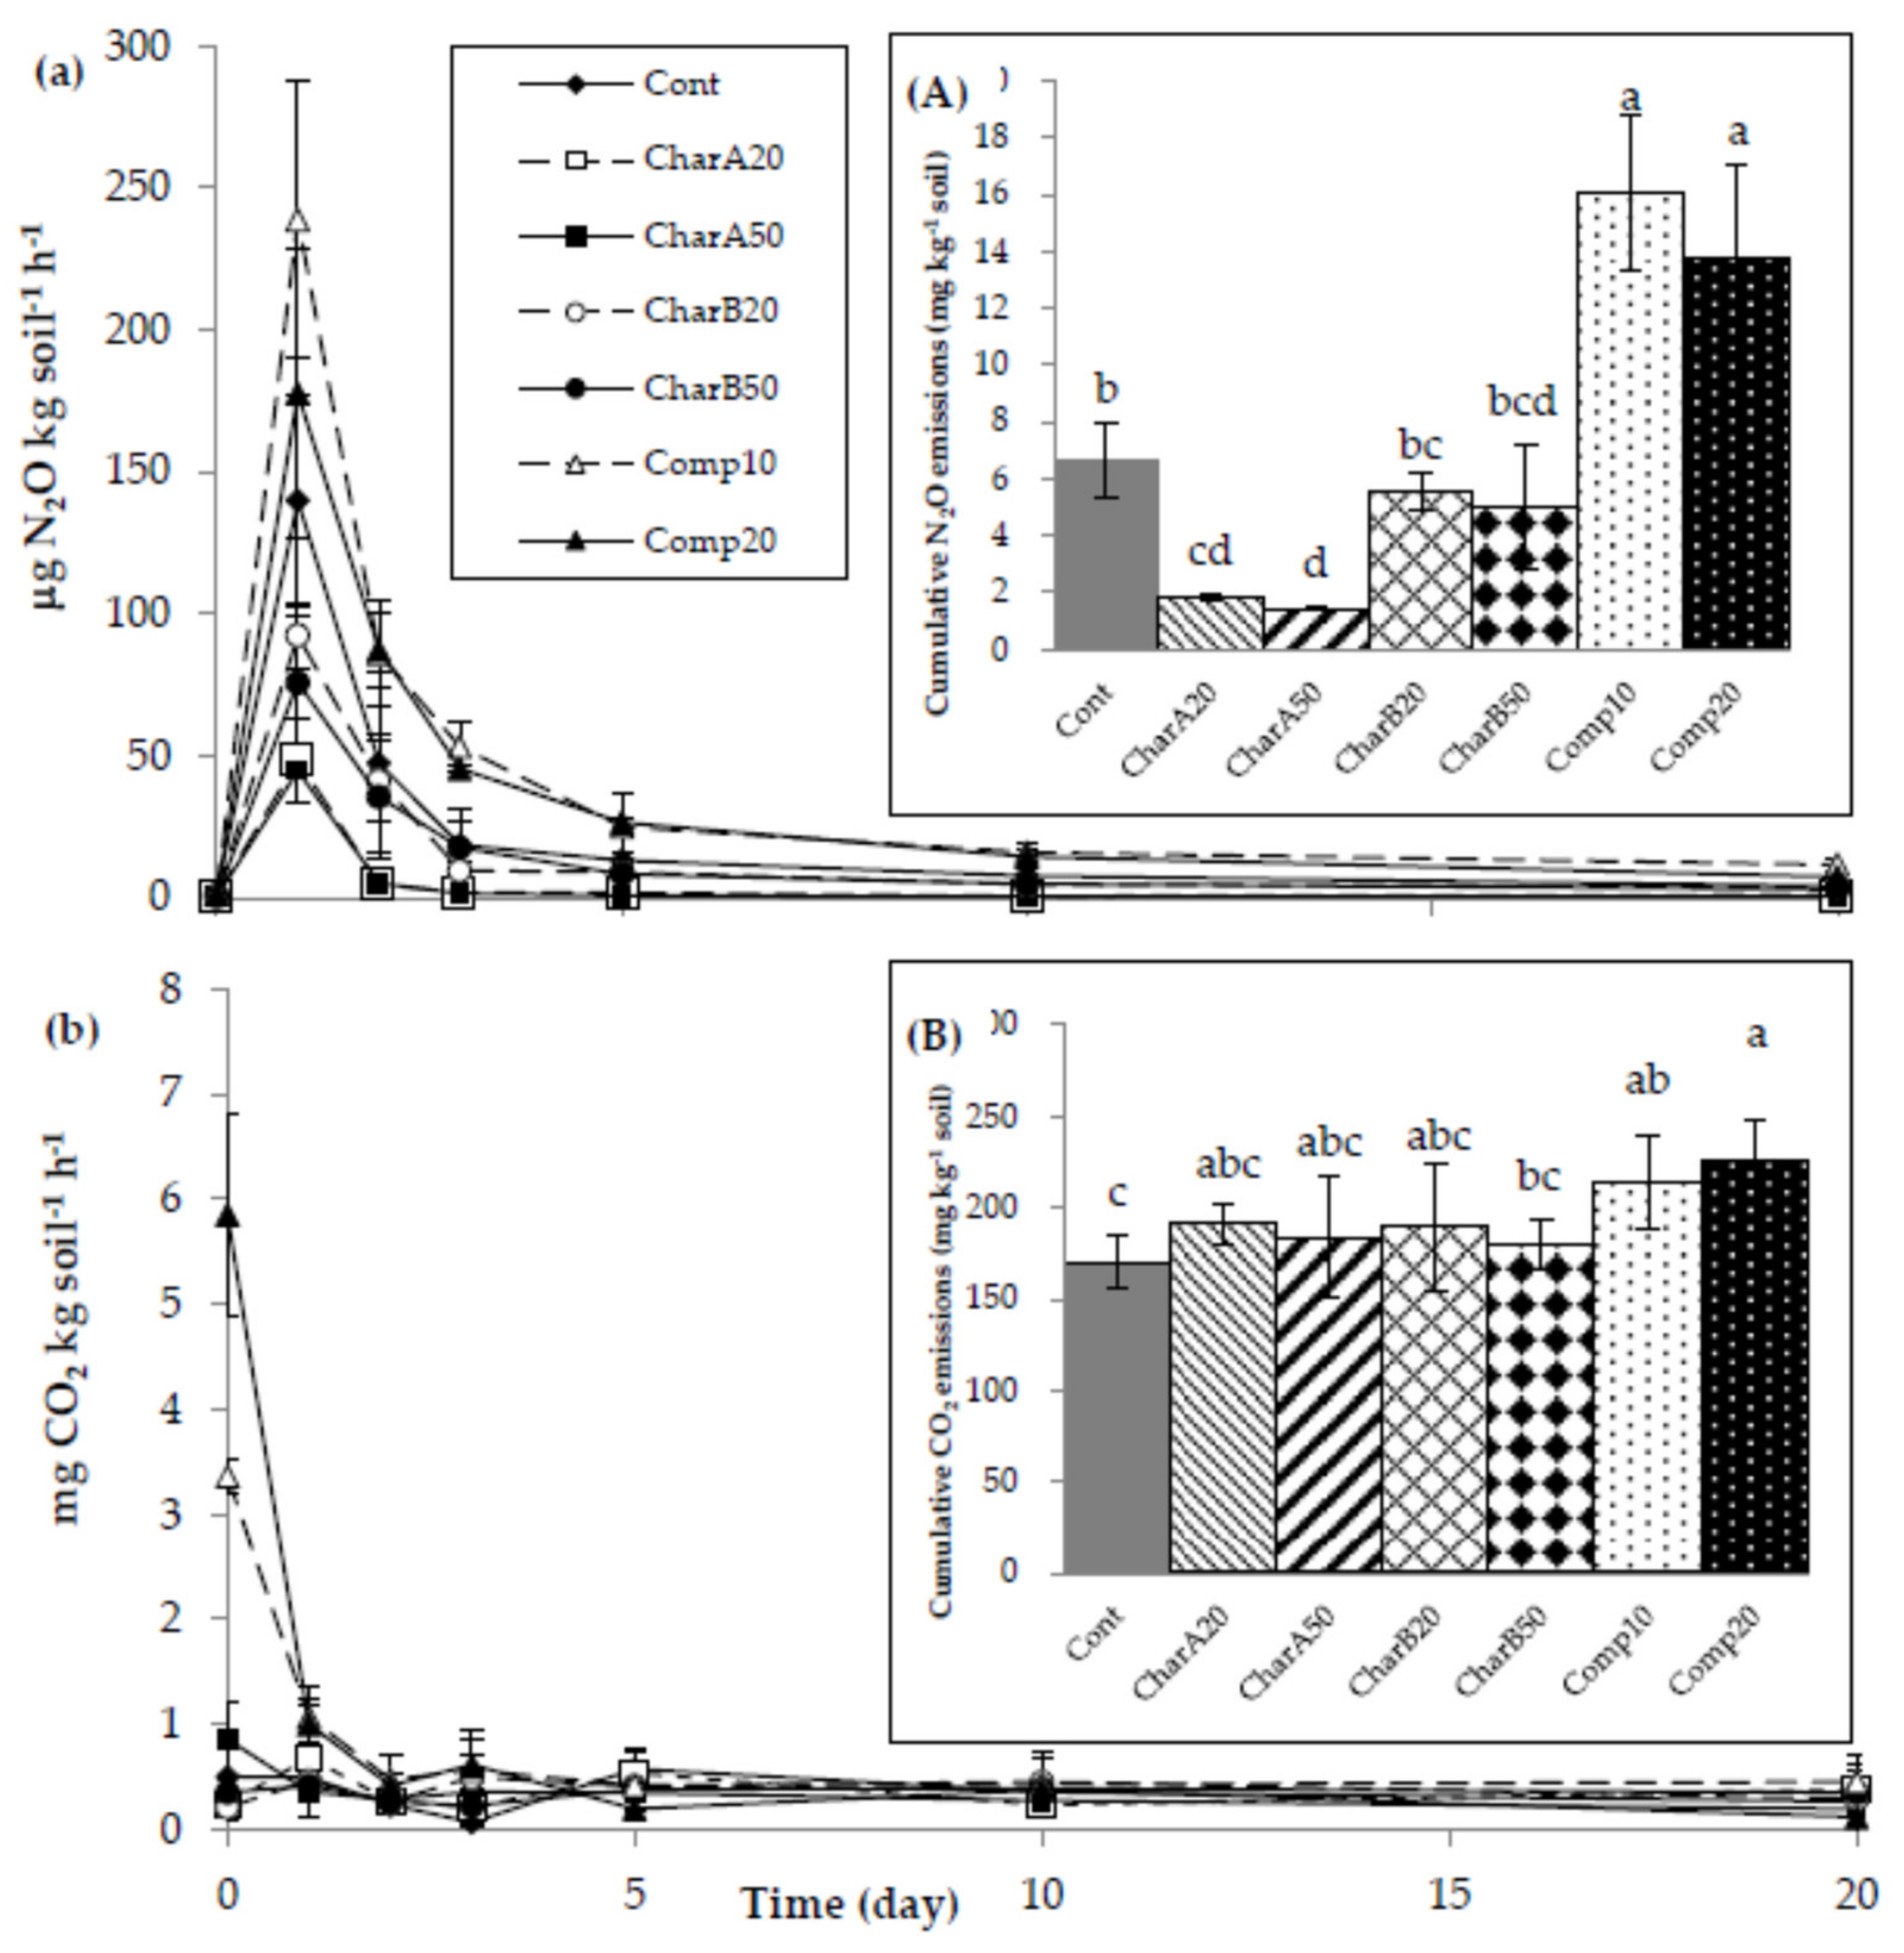
Both types of biochar effectively adsorbed NH4+, but neither adsorbed PO43− nor NO3 (Figure 2). The NH4+ adsorption capacity was significantly higher (p < 0.001) for Biochar A than for Biochar B.

3.3. Gas Emissions

During incubation, N2O emissions changed significantly with time (Figure 3a). Rapid N2O emissions occurred in the first day of incubation. After reaching the peak, N2O emissions in all treatments declined rapidly in the next two days and then slightly declined during incubation. The N2O emissions were influenced by amended materials. The greatest N2O emission was observed in compost amended treatments, followed by the unamended treatment. Of the three amendments, only compost showed a significant increase in cumulative N2O emission (an increase of 140% and 106% compared to unamended soil for Comp10 and Comp20, respectively). A significant reduction was observed in Biochar A treatments but not in Biochar B treatments. The lowest cumulative N2O emissions were observed when applying 50 g kg−1 Biochar A (80% reduction compared to the unamended soil).
Except for the significantly high CO2 emissions from compost treatments in the first three days, there was no difference in CO2 emissions between different amended materials (Figure 3b). Cumulative CO2 emissions of compost amended treatments were significantly higher than those of unamended soil but there were no differences between biochar amended and unamended treatments (Figure 3B). There was no detectable CH4 emission from any of the treatments.
Pearson’s correlation analysis showed that cumulative N2O emission had a significantly negative correlation with C:N ratio, significantly positive correlations with total N, WFPS, NH4+ concentration and NO3 concentration of soil prior to incubation, and soil pH after incubation (Table 6).

4. Discussion

4.1. Phosphorus Fractions of Soil

Labile P, as a sum of H2O-P and NaHCO3-Pi, was increased by the application of biochar and particularly by compost amendment. The increase in labile P derives from labile P fractions in the amended materials. Due to the high level of labile P in compost, the highest increase in labile P was observed in the Comp20 treatment. Both types of biochar used in this study had a high value of labile P (181 mg kg−1 to 397 mg kg−1), compared to a basal 33 mg P kg−1 in the soil. Compost contained even greater available P (1500 mg kg−1) than biochar, which contributed to the increase in labile P.
The availability of P changes with time because of the mineralization of soil organic P to inorganic P, and consequent decrease in NaHCO3-Po [47,48]. These studies explained the microbially-mediated mineralization of soil organic P to inorganic P, and this rate was faster than that of P sorption by soils, resulting in an increase in available P. Indeed, an increase in labile P and decrease in organic P with time were also observed in this study. P solubilizing bacteria may be involved in the processes [20]. This is supported by the study of Molla et al. [43], who reported that a maximum amount of phosphate mineralized by organisms was obtained only at the 60th day, not the 45th, 30th, or 15th days. In addition, a high concentration of K and a low concentration of Na in both types of biochar could contribute to phosphatase activities since phosphatase activities can have a positive correlation with K and negative correlation with Na [49,50]. Thus, biochar application in this study may have accelerated the transformation from organic P to inorganic P, which provided labile P. In terms of contributing to the conversion of organic P to inorganic P, compost and biochar had nearly similar tendencies (35 mg kg−1 to 40 mg kg−1 decrease in organic P during the six month incubation after the application of biochar or compost).
Another mechanism involved in the increase in P availability is the release of P from Fe and Al-binding P forms or the prevention of forming Fe and Al-bound P. Both types of biochar in this study did not absorb P (Figure 2). This result agreed with results found by Zheng et al. [51], who reported that biochar produced at low temperatures (up to 600 °C) did not adsorb PO43−, while some other studies have reported that P can be adsorbed by biochar produced under 600 °C [52]. Rice husk biochars used in this study had negative charges and a capacity to adsorb positively charged ions such as NH4+ and Na+ [53]. The application of biochar could initiate complex formation with Fe and Al in ASS and inhibit the formation of Fe and Al-bound P [54]. This hypothesis was confirmed by lower NaOH-Pi in CharA50 and CharB50 soil compared to that in unamended soil after a 1.5-month incubation. This result was similar to previous studies which reported that the sorption of metal ions (Fe3+ and Al3+) on biochar surfaces released the trapped P in those metal oxides by reducing the amount of free Fe3+ and Al3+ ions in soil solutions [24,55]. A high content of silicon in rice husk biochar could also have a positive correlation with phosphorus mobilization in soil [23]. Wang et al. [21] reported that rice husk biochar produced at 500–700 °C contained 22–26% SiO2. Therefore, a high availability of silicon in rice husk biochar might also contribute to immobilize Al and Fe in soil to release available P [22,23]. Further study is necessary to confirm this aspect. In addition, the reduction in the amount of NaOH-Pi may come from the increase in pH by applying biochar, like the previous findings by Atkinson et al. [56] and Hong and Lu [57], who reported that the soil pH was increased by the addition of biochar, thus reducing the amount of P precipitated with Fe and Al. In this incubation study, the Fe- and Al-bound P (NaOH-Pi) increased with time. In cropping systems, plants will continuously use P in available forms and thus this phenomenon might be prevented.

4.2. Nitrous Oxide Emissions

This study was conducted under the moisture conditions of 70% of MWHC, which would favor both nitrification and denitrification [4]. This was supported by the positive correlations between N2O emission and both NH4+ and NO3 concentrations (Table 6). The results indicate that both nitrification and denitrification may be involved in N2O production in this study. In the first day of incubation, nitrification happened, which was represented by an increase in NO3. Ammonium increased in Cont, CharB20, and CharB50 in the first day of incubation by mineralization. In Biochar A amended soils, there was no increase in NH4+ (ther was even a decrease in CharA50). This proved that Biochar A trapped NH4+ by its sorption capacity or stimulated nitrogen immobilization on the first day, and that limiting the NH4+ source for nitrification might have resulted in the lowest N2O emission. One possible mechanism for reduced N2O emissions by biochar is that NH4+ was adsorbed onto the negative sites in the biochars, thus reducing the amount of N sources for N2O production [58]. Both types of biochar in this study had some NH4+ sorption capacity (Figure 2). The application of biochar could lead to a reduction in the source of NH4+ for nitrification, resulting in reduced N2O emission. This may be supported by less N2O emission in soils amended with Biochar A, having a higher NH4+ adsorption capacity than Biochar B. In this study, biochar may not have suppressed denitrification through decreased availability of NO3 since both types of biochar did not adsorb NO3 (Figure 2). This result was consistent with other studies by Yao et al. [59] and Zheng et al. [51] which showed that biochars produced at ≤ 600 °C did not adsorb NO3.
The C:N ratio also negatively correlated with N2O emission (Table 6). Biochar with a higher C:N ratio limits the release of ammonium N, resulting in less N2O emission. This result is supported by a previous study by Huang et al. [60], who reported that the amendment of organic matter with a lower C:N ratio stimulated N2O emission.
Total N2O emission over 20 days showed that only Biochar A decreased N2O emission significantly. Although both Biochar A and B were produced from rice husk, Biochar A had a higher MWHC (580% (water/dried material) compared with 340% of Biochar B). These differences would have led to different water-filled pore spaces (WFPSs) in biochar amended soils, which was 51% WFPS in CharA50 and 60% WFPS in CharB50, compared to 70% WFPS in unamended soil. It is well known that the magnitude of N2O emissions increased with increasing WFPS [61,62] and reached a peak of emission at 90% WFPS [41,63]. Therefore, Biochar A, with a higher value of MWHC and a lower moisture content, decreased WFPS in soil and may have reduced N2O emission.
In all treatments, the sharp peak in N2O flux was observed on the first day of incubation (Figure 3a). This trend is similar to previous studies [39,64,65] that reported that emissions typically occur rapidly after N addition. The significantly higher N2O emission from compost application in this study was consistent with previous results [64,66]; that is, available NH4+ from compost was the driving force of N2O emission. Compost used in this study contained a high amount of NH4+-N and NO3-N (20,870 mg kg−1 and 2500 mg kg−1, respectively). The high content of inorganic N and the low C:N ratio in compost increased N2O emission from the compost amended soils. The positive correlations between N2O emission and total N, NH4+, and NO3 concentrations also supported this result (Table 6). In addition, in compost amended treatments, comparing to day 0, NH4+ decreased by 152 mg NH4+-N kg−1 and 258 mg NH4+-N kg−1, but the increase of NO3 was only 14 mg NO3-N kg−1 and 6 mg NO3-N kg−1 at day 45 of incubation by applying compost at 10 g kg−1 and 20 g kg−1, respectively. In general, NH3 volatilization does not occur in acid soil with pH < 7, and NO2 concentration was negligible in acid soil [4,67]. These indicate the loss of NO3 via denitrification in compost treatments.
Taken together, our results suggest that both compost and biochar can be effective in enhancing P availability and to overcome P deficiency in ASS in the MD. Amendment of compost with a higher P content could increase available P more than that of biochar. On the other hand, Biochar A with a higher MWHC, surface area and NH4+ adsorption capacity mitigated N2O emissions, whilst compost increased such emissions. Further study could address the effects of combining biochar and compost to investigate if such combinations could meet the goals of improving nutrients and mitigating GHG emissions.

5. Conclusions

In this study, we investigated the effects of rice husk biochar and compost on P fractions and mitigating GHG emission from ASS. The application of compost increased labile P and also increased N2O emission. Biochars enhanced labile P by bringing available P into soil, converting a part of organic P to inorganic P as well as preventing the formation of Fe and Al-bound P. These results suggest that the constraints of P limitation due to P bound to Fe and Al in ASS could be resolved by applying biochar. The application of biochar with a high surface area, MWHC and NH4+ adsorption capacity reduced N2O emission, and as such it would be desirable to formulate and prescribe biochar with such properties for utilization in scenarios with ASS. Therefore, biochar amendment has the potential to ameliorate P availability in ASS, whilst compost amendment will likely compromise GHG mitigation in such soils.

Author Contributions

N.T.K.P. conceptualized the study; N.T.K.P. and N.V.S. conducted the experiments, collected data and did data analysis; N.T.K.P., M.T., K.R., and K.T. validated data; N.T.K.P. wrote the paper—original draft; N.T.K.P., K.R., C.M.K., and K.T. reviewed, edited, and finalized the paper. All authors have read and agreed to the published version of the manuscript.

Funding

This study was funded in part by the Can Tho University Improvement Project VN14-P6, supported by a Japanese ODA loan.

Acknowledgments

We thank the College of Environment and Natural Resources, Can Tho University for providing biochar and the Department of Soil Science, College of Agriculture, Can Tho University for collecting soil for our experiment.

Conflicts of Interest

The authors declare no conflict of interest.

References

  1. Torell, M.; Salamanca, A.M. Wetlands management in Vietnam’s Mekong Delta: An overview of the pressures and responses. In Wetlands Management in Vietnam: Issues and Perspectives; Torell, M., Salamanca, A.M., Ratner, B.D., Eds.; WorldFish: Penang, Malaysia, 2003. [Google Scholar]
  2. Hedley, M.J.; Kirk, G.J.R.; Santos, M.B. Phosphorus efficiency and the forms of soil phosphorus utilized by upland rice cultivars. Plant Soil 1994, 158, 53–62. [Google Scholar] [CrossRef]
  3. Linquist, B.; Singleton, P.; Yost, R.; Cassman, K. Aggregate size effects on the sorption and release of phosphorus in an ultisol. Soil Sci. Soc. Am. J. 1997, 61, 160–166. [Google Scholar] [CrossRef]
  4. Brady, N.C.; Weil, R.R. The Nature and Properties of Soils, 14th ed.; Pearson Prentice Hall: Upper Saddle River, NJ, USA, 2008. [Google Scholar]
  5. Guppy, C.N.; Menzies, N.; Moody, P.W.; Blamey, F. Competitive sorption reactions between phosphorus and organic matter in soil: A review. Soil Res. 2005, 43, 189–202. [Google Scholar] [CrossRef]
  6. Viễn, D.M.; Gương, V.T.; Đông, N.M.; Phượng, N.T.K. Application of compost from sugarcane filter cake to alleviate al toxicity and to improve P availability on acid sulfate soil. Can Tho Uni. J. Sci. 2006, 6, 118–125. [Google Scholar]
  7. Maurice, P.A.; Hochella, M.F.; Parks, G.A.; Sposito, G.; Schwertmann, U. Evolution of hematite surface microtopography upon dissolution by simple organic acids. Clay. Clay Miner. 1995, 43, 29–38. [Google Scholar] [CrossRef]
  8. Smith, P.; Martino, D.; Cai, Z.; Gwary, D.; Janzen, H.; Kumar, P.; McCarl, B.; Ogle, S.; O’Mara, F.; Rice, C.; et al. Agriculture. In Climate Change 2007: Mitigation. Contribution of Working Group III to the Fourth Assessment Report of the Intergovernmental Panel on Climate Change; Metz, B., Davidson, O.R., Bosch, P.R., Dave, R., Meyer, L.A., Eds.; Cambridge University Press: Cambridge, UK; New York, NY, USA, 2007. [Google Scholar]
  9. CGIAR. The Drought and Salinity Intrusion in the Mekong River Delta of Vietnam-Assessment Report; Research Program on Climate Change Agriculture and Food Security-Southeast Asia (CCAFS-SEA): Ha Noi, Vietnam, 2016. [Google Scholar]
  10. Denmead, O.T.; Macdonald, B.; Bryant, G.; Wang, W.; White, I. Nitrous Oxide Emission from Acid Sulfate Sugarcane Soils on the Coastal Lowlands; Australian Society of Sugar Cane Technologists: Queensland, Australia, 2007; pp. 95–105. [Google Scholar]
  11. Denmead, O.T.; Macdonald, B.; Naylor, T.; Wang, W.; Salter, B.; White, I.; Wilson, S.; Griffith, D.; Moody, P. Whole-of-Season Greenhouse Gas Emissions from Australian Sugarcane Soils; Australian Society of Sugar Cane Technologists: Queensland, Australia, 2008; pp. 105–114. [Google Scholar]
  12. IPCC. Mitigation of Climate Change; IPCC: Geneva, Switzerland, 2014; p. 151. [Google Scholar]
  13. Ding, Y.; Liu, Y.; Liu, S.; Li, Z.; Tan, X.; Huang, X.; Zeng, G.; Zhou, L.; Zheng, B. Biochar to improve soil fertility. A review. Agron. Sustain. Dev. 2016, 36, 36. [Google Scholar] [CrossRef] [Green Version]
  14. Spokas, K.A.; Reicosky, D.C. Impacts of sixteen different biochars on soil greenhouse gas production. Ann. Environ. Sci. 2009, 3, 179–193. [Google Scholar]
  15. Chen, T.; Zhou, Z.; Han, R.; Meng, R.; Wang, H.; Lu, W. Adsorption of cadmium by biochar derived from municipal sewage sludge: Impact factors and adsorption mechanism. Chemosphere 2015, 134, 286–293. [Google Scholar] [CrossRef]
  16. Shepherd, J.G.; Joseph, S.; Sohi, S.P.; Heal, K.V. Biochar and enhanced phosphate capture: Mapping mechanisms to functional properties. Chemosphere 2017, 179, 57–74. [Google Scholar] [CrossRef] [Green Version]
  17. Yao, Y.; Gao, B.; Chen, J.; Yang, L. Engineered biochar reclaiming phosphate from aqueous solutions: Mechanisms and potential application as a slow-release fertilizer. Environ. Sci. Technol. 2013, 47, 8700–8708. [Google Scholar] [CrossRef]
  18. Bornø, M.L.; Müller-Stöver, D.S.; Liu, F. Contrasting effects of biochar on phosphorus dynamics and bioavailability in different soil types. Sci. Total Environ. 2018, 627, 963–974. [Google Scholar] [CrossRef] [PubMed]
  19. Zhang, H.; Chen, C.; Gray, E.M.; Boyd, S.E.; Yang, H.; Zhang, D. Roles of biochar in improving phosphorus availability in soils: A phosphate adsorbent and a source of available phosphorus. Geoderma 2016, 276, 1–6. [Google Scholar] [CrossRef]
  20. Liu, S.; Meng, J.; Jiang, L.; Yang, X.; Lan, Y.; Cheng, X.; Chen, W. Rice husk biochar impacts soil phosphorous availability, phosphatase activities and bacterial community characteristics in three different soil types. Appl. Soil Ecol. 2017, 116, 12–22. [Google Scholar] [CrossRef]
  21. Wang, Y.; Xiao, X.; Chen, B. Biochar impacts on soil silicon dissolution kinetics and their interaction mechanisms. Sci. Rep. 2018, 8, 8040. [Google Scholar] [CrossRef] [PubMed] [Green Version]
  22. Qian, L.; Chen, B.; Chen, M. Novel alleviation mechanisms of aluminum phytotoxicity via released biosilicon from rice straw-derived biochars. Sci. Rep. 2016, 6, 29346. [Google Scholar] [CrossRef] [PubMed] [Green Version]
  23. Schaller, J.; Faucherre, S.; Joss, H.; Obst, M.; Goeckede, M.; Planer-Friedrich, B.; Peiffer, S.; Gilfedder, B.; Elberling, B. Silicon increases the phosphorus availability of arctic soils. Sci. Rep. 2019, 9. [Google Scholar] [CrossRef] [Green Version]
  24. Masulili, A.; Utomo, W.H.; Syechfani, M. Rice husk biochar for rice based cropping system in acid soil 1. The characteristics of rice husk biochar and its influence on the properties of acid sulfate soils and rice growth in West Kalimantan, Indonesia. J. Agric. Sci. 2010, 2, 39–47. [Google Scholar] [CrossRef] [Green Version]
  25. Yao, L.; Yu, X.; Huang, L.; Zhang, X.; Wang, D.; Zhao, X.; Li, Y.; He, Z.; Kang, L.; Li, X.; et al. Responses of phaseolus calcaltus to lime and biochar application in an acid soil. PeerJ 2019, 7, e6346. [Google Scholar] [CrossRef] [Green Version]
  26. Petter, F.A.; Borges de Lima, L.; Marimon Júnior, B.H.; Alves de Morais, L.; Marimon, B.S. Research article: Impact of biochar on nitrous oxide emissions from upland rice. J. Environ. Manag. 2016, 169, 27–33. [Google Scholar] [CrossRef]
  27. Singh, B.P.; Hatton, B.J.; Singh, B.; Cowie, A.L.; Kathuria, A. Influence of biochars on nitrous oxide emission and nitrogen leaching from two contrasting soils. J. Environ. Qual. 2010, 39, 1224–1235. [Google Scholar] [CrossRef]
  28. Watanabe, A.; Ikeya, K.; Kanazaki, N.; Makabe, S.; Sugiura, Y.; Shibata, A. Five crop seasons’ records of greenhouse gas fluxes from upland fields with repetitive applications of biochar and cattle manure. J. Environ. Manag. 2014, 144, 168–175. [Google Scholar] [CrossRef] [PubMed]
  29. Fan, C.; Chen, H.; Li, B.; Xiong, Z. Biochar reduces yield-scaled emissions of reactive nitrogen gases from vegetable soils across China. Biogeosciences 2017, 14, 2851–2863. [Google Scholar] [CrossRef] [Green Version]
  30. Lehmann, J.; Joseph, S. Biochar for Environmental Management: Science, Technology and Implementation; Routledge: New York, NY, USA, 2015. [Google Scholar]
  31. Van Zwieten, L.; Kimber, S.; Morris, S.; Chan, K.; Downie, A.; Rust, J.; Joseph, S.; Cowie, A. Effects of biochar from slow pyrolysis of papermill waste on agronomic performance and soil fertility. Plant Soil 2010, 327, 235–246. [Google Scholar] [CrossRef]
  32. Gaskin, J.W.; Speir, R.A.; Harris, K.; Das, K.; Lee, R.D.; Morris, L.A.; Fisher, D.S. Effect of peanut hull and pine chip biochar on soil nutrients, corn nutrient status, and yield. Agron. J. 2010, 102, 623–633. [Google Scholar] [CrossRef] [Green Version]
  33. Hammes, K.; Smernik, R.J.; Skjemstad, J.O.; Schmidt, M.W. Characterisation and evaluation of reference materials for black carbon analysis using elemental composition, colour, BET surface area and 13C NMR spectroscopy. Appl. Geochem. 2008, 23, 2113–2122. [Google Scholar] [CrossRef]
  34. Tushar, M.S.H.K.; Mahinpey, N.; Khan, A.; Ibrahim, H.; Kumar, P.; Idem, R. Production, characterization and reactivity studies of chars produced by the isothermal pyrolysis of flax straw. Biomass Bioenergy 2012, 37, 97–105. [Google Scholar] [CrossRef]
  35. Cantrell, K.B.; Hunt, P.G.; Uchimiya, M.; Novak, J.M.; Ro, K.S. Impact of pyrolysis temperature and manure source on physicochemical characteristics of biochar. Bioresour. Technol. 2012, 107, 419–428. [Google Scholar] [CrossRef]
  36. Li, H.; Dong, X.; da Silva, E.; De Oliveira, L.; Chen, Y.; Ma, L. Mechanisms of metal sorption by biochars: Biochar characteristics and modifications. Chemosphere 2017, 178, 466–478. [Google Scholar] [CrossRef]
  37. Haseena, P.V.; Padmavathy, K.; Krishnan, R.; Madhu, G. Adsorption of ammonium nitrogen from aqueous systems using chitosan-bentonite film composite. Proc. Technol. 2016, 24, 733–740. [Google Scholar] [CrossRef] [Green Version]
  38. Hedley, M.; White, R.; Nye, P. Plant-Induced changes in the rhizosphere of rape (Brassica napus Var. Emerald) seedlings: III. Changes in L value, soil phosphate fractions and phosphatase activity. New Phytol. 1982, 91, 45–56. [Google Scholar] [CrossRef]
  39. Ameloot, N.; Maenhout, P.; De Neve, S.; Sleutel, S. Biochar-induced N2O emission reductions after field incorporation in a loam soil. Geoderma 2016, 267, 10–16. [Google Scholar] [CrossRef]
  40. De Carvalho, M.T.M.; Madari, B.E.; Bastiaans, L.; van Oort, P.A.J.; de Leal, W.G.O.; de Souza, D.M.; dos Santos, R.C.; Matsushige, I.; de Maia, A.H.N.; Heinemann, A.B.; et al. Nitrogen availability, water-filled pore space, and N2O-N fluxes after biochar application and nitrogen fertilization. Pesqui. Agropecu. Bras. 2016, 51, 1203–1212. [Google Scholar] [CrossRef] [Green Version]
  41. Cayuela, M.L.; Sánchez-Monedero, M.A.; Roig, A.; Hanley, K.; Enders, A.; Lehmann, J. Biochar and denitrification in soils: When, how much and why does biochar reduce N2O emissions? Sci. Rep. 2013, 3, 1732. [Google Scholar] [CrossRef] [PubMed] [Green Version]
  42. Xiang, J.; Liu, D.; Ding, W.; Yuan, J.; Lin, Y. Effects of biochar on nitrous oxide and nitric oxide emissions from paddy field during the wheat growth season. J. Clean. Prod. 2015, 104, 52–58. [Google Scholar] [CrossRef]
  43. Molla, M.A.Z.; Chowdhury, A.A.; Islam, A.; Hoque, S. Microbial mineralization of organic phosphate in soil. Plant Soil 1984, 78, 393–399. [Google Scholar] [CrossRef]
  44. Zulkifli, H.; Tarmizi, A. Phosphorus fractions in soil amended with empty fruit bunches and phosphate fertilizer-an incubation study. J. Oil Palm Res. 2010, 22, 823–834. [Google Scholar]
  45. Houba, V.J.G.; Vanderlee, J.J.; Novozamsky, I. Soil and plant analysis: A series of syllabi. In Part 5B Soil Analysis Procedures Other Procedures, 6th ed.; Wageningen Agricultural University, Department of Soil Science and Plant Nutrition: Wageningen, The Netherlands, 1995. [Google Scholar]
  46. ASTM. Standard test method for determination of iodine number of activated carbon. In ASTM Annual Book; ASTM International: West Conshohocken, PA, USA, 1999; Volume 4. [Google Scholar]
  47. Opala, P.A.; Okalebo, J.R.; Othieno, C.O. Effects of organic and inorganic materials on soil acidity and phosphorus availability in a soil incubation study. ISRN Agronomy 2012, 2012, 10. [Google Scholar] [CrossRef] [Green Version]
  48. Spychaj-Fabisiak, E.; Długosz, J.; Zamorski, R. The effect of the phosphorus dosage and incubation time on the process of retarding available phosphorus forms in a sandy soil. Pol. J. Soil Sci. 2005, 38, 23–30. [Google Scholar]
  49. Banerjee, A.; Sanyal, S.; Sen, S. Soil phosphatase activity of agricultural land: A possible index of soil fertility. Agric. Sci. Res. J. 2012, 2, 412–419. [Google Scholar]
  50. Nannipieri, P.; Giagnoni, L.; Landi, L.; Renella, G. Role of phosphatase enzymes in soil. In Phosphorus in Action: Biological Processes in Soil Phosphorus Cycling; Bünemann, E., Oberson, A., Frossard, E., Eds.; Springer: Berlin/Heidelberg, Germany, 2011; pp. 215–243. [Google Scholar]
  51. Zheng, H.; Wang, Z.; Deng, X.; Zhao, J.; Luo, Y.; Novak, J.; Herbert, S.; Xing, B. Characteristics and nutrient values of biochars produced from giant reed at different temperatures. Bioresour. Technol. 2013, 130, 463–471. [Google Scholar] [CrossRef]
  52. Chen, B.; Chen, Z.; Lv, S. A novel magnetic biochar efficiently sorbs organic pollutants and phosphate. Bioresour. Technol. 2011, 102, 716–723. [Google Scholar] [CrossRef] [PubMed]
  53. Phuong, N.T.K.; Khoi, C.M.; Van Sinh, N.; Chiem, N.H.; Toyota, K. Effects of rice husk biochar and calcium amendment on remediation of saline soil from rice-shrimp cropping system in Vietnamese Mekong Delta. JEAI 2019, 39, 1–12. [Google Scholar] [CrossRef]
  54. Jan, J.; Borovec, J.; Kopáček, J.; Hejzlar, J. Assessment of phosphorus associated with Fe and Al (hydr) oxides in sediments and soils. J. Soils Sed. 2015, 15, 1620–1629. [Google Scholar] [CrossRef]
  55. DeLuca, T.H.; Gundale, M.J.; MacKenzie, M.D.; Jones, D.L. Biochar effects on soil nutrient transformations. In Biochar for Environmental Management: Science, Technology and Implementation; Lehmann, J., Joseph, S., Eds.; Taylor & Francis Group: London, UK; New York, NY, USA, 2015; Volume 2, pp. 421–454. [Google Scholar]
  56. Atkinson, C.J.; Fitzgerald, J.D.; Hipps, N.A. Potential mechanisms for achieving agricultural benefits from biochar application to temperate soils: A review. Plant Soil 2010, 337, 1–18. [Google Scholar] [CrossRef]
  57. Hong, C.; Lu, S. Does biochar affect the availability and chemical fractionation of phosphate in soils? Environ. Sci. Pollut. Res. 2018, 25, 8725–8734. [Google Scholar] [CrossRef]
  58. Clough, T.; Condron, L.; Kammann, C.; Müller, C. A review of biochar and soil nitrogen dynamics. Agronomy 2013, 3, 275. [Google Scholar] [CrossRef] [Green Version]
  59. Yao, Y.; Gao, B.; Zhang, M.; Inyang, M.; Zimmerman, A.R. Effect of biochar amendment on sorption and leaching of nitrate, ammonium, and phosphate in a sandy soil. Chemosphere 2012, 89, 1467–1471. [Google Scholar] [CrossRef]
  60. Huang, Y.; Zou, J.; Zheng, X.; Wang, Y.; Xu, X. Nitrous oxide emissions as influenced by amendment of plant residues with different C:N ratios. Soil Biol. Biochem. 2004, 36, 973–981. [Google Scholar] [CrossRef]
  61. Abbasi, M.K.; Adams, W.A. Gaseous n emission during simultaneous nitrification–denitrification associated with mineral N fertilization to a grassland soil under field conditions. Soil Biol. Biochem. 2000, 32, 1251–1259. [Google Scholar] [CrossRef]
  62. Skiba, U.; Ball, B. The effect of soil texture and soil drainage on emissions of nitric oxide and nitrous oxide. Soil Use Manag. 2002, 18, 56–60. [Google Scholar] [CrossRef]
  63. Nguyen, D.H.; Grace, P.R.; Scheer, C.; Rowlings, D. Determining gas sampling timelines for estimating emissions in small chamber incubation experiments. IOSRJEN 2014, 4, 14–16. [Google Scholar] [CrossRef]
  64. Li, P.; Lang, M.; Li, C.; Hao, X. Nitrous oxide and carbon dioxide emissions from soils amended with compost and manure from cattle fed diets containing wheat dried distillers’ grains with solubles. Can. J. Soil Sci. 2016, 97, 522–531. [Google Scholar] [CrossRef] [Green Version]
  65. Malghani, S.; Kim, J.; Lee, S.-H.; Yoo, G.-Y.; Kang, H. Application of two contrasting rice-residue-based biochars triggered gaseous loss of nitrogen under denitrification-favoring conditions: A short-term study based on acetylene inhibition technique. Appl. Soil Ecol. 2018, 127, 112–119. [Google Scholar] [CrossRef]
  66. Takakai, F.; Takeda, M.; Kon, K.; Inoue, K.; Nakagawa, S.; Sasaki, K.; Chida, A.; Sekiguchi, K.; Takahashi, T.; Sato, T. Effects of preceding compost application on the nitrogen budget in an upland soybean field converted from a rice paddy field on gray lowland soil in Akita, Japan. Soil Sci. Plant Nutr. 2010, 56, 760–772. [Google Scholar] [CrossRef]
  67. Van Cleemput, O.; Samater, A.H. Nitrite in soils: Accumulation and role in the formation of gaseous N compounds. Fertil. Res. 1995, 45, 81–89. [Google Scholar] [CrossRef]
Figure 1. Soil pH (a) and electrical conductivity (EC) (b) after 45 days of incubation in response to different amendments. The bar on the columns indicates the standard deviation of three replicates (n = 3) for each treatment. Columns with different letters indicate a significant difference (p < 0.05) among treatments. Cont, soil without amendment; CharA20, soil + 20 g kg−1 of Biochar A; CharA50, soil + 50 g kg−1 of Biochar A; CharB20, soil + 20 g kg−1 of Biochar B; CharB50, soil + 50 g kg−1 of Biochar B; Comp10, soil + 10 g kg−1 of compost; Comp20, soil + 20 g kg−1 of compost.
Agronomy 10 00685 g001
Figure 2. Sorption isotherm of two different types of biochar to PO43− (a), NO3 (b) and NH4+ (c). Error bars indicate the standard deviation of four replicates (n = 4).
Agronomy 10 00685 g002
Figure 3. Fluxes of N2O (a) and CO2 (b) emissions from soil amended with biochar or compost. Bar charts represent cumulative N2O (A) and CO2 (B) emissions over 20 days. Emission rates are expressed as average values from three replicates. Columns with different letters indicate a significant difference (p < 0.05) among treatments. Error bars indicate the standard deviation of three replicates (n = 3) for each treatment. Cont, soil without amendment; CharA20, soil + 20 g kg−1 of Biochar A; CharA50, soil + 50 g kg−1 of Biochar A; CharB20, soil + 20 g kg−1 of Biochar B; CharB50, soil + 50 g kg−1 of Biochar B; Comp10, soil + 10 g kg−1 of compost; Comp20, soil + 20 g kg−1 of compost.
Agronomy 10 00685 g003
Table 1. Characteristics of soil and amendments used in the experiment.
SoilBiochar ABiochar BCompost
pH (H2O) (1:5)5.07.69.08.7
Electrical conductivity (EC) (mS cm1) (1:5)0.420.500.8917.1
NH4+-N (mg kg−1)14.33.69ND20,900
NO3-N (mg kg−1)2.912.2ND2530
Soluble Na (cmolc kg−1)1.690.210.371.75
Soluble K (cmolc kg−1)0.182.514.1741.1
Soluble Ca (cmolc kg−1)0.150.240.782.98
Exchangeable * Na (cmolc kg−1)1.31ND0.060.64
Exchangeable * K (cmolc kg−1)1.082.305.4314.5
Exchangeable * Ca (cmolc kg−1)3.151.121.3141.4
Total C (mg g−1)10.4479471154
Total N (mg g−1)0.851.514.7226.0
Total P (mg kg−1) 455771110011,500
C:N12.23171005.9
MWHC, g water g−1 0.705.83.4
Moisture content, %2.58.444.626.8
Iodine number, mg g−1 173110
Values were based on oven-dried weight, except for moisture content (g water 100 g−1 fresh weight). ND, not detected; *, exchangeable cations were determined by subtracting soluble cations from total extractable cations; MWHC, maximum water holding capacity; Biochar A, a laboratory product; Biochar B, an industrial product.
Table 2. Phosphorus contents (mg P kg−1) in different P fractions in soil and amendments.
H2O-PNaHCO3-PiNaHCO3-PoNaOH-PiNaOH-PoHCl-PiResidual-P
Soil13.120.219.612941.640.0191
Biochar A126 54.9ND11283.3142253
Biochar B314 83.3ND81.356.7192371
Compost468 1123 16531961544 4624369
ND, not detected; Pi, inorganic P; Po, organic P; P fractions were extracted followed the Hedley method [38].
Table 3. Application rate of organic materials and chemical fertilizers for the 250 mL jars (corresponding field application rates).
Soil, gBiochar A, g (Mg ha−1)Biochar B, g (Mg ha−1)Compost, g (Mg ha−1)N-P2O5-K2O, mg (kg ha−1)
Cont80.0 4.8-4.8-3.2 (60-60-40)
CharA2078.41.6 (20) 4.8-4.8-3.2 (60-60-40)
CharA5076.04.0 (50) 4.8-4.8-3.2 (60-60-40)
CharB2078.4 1.6 (20) 4.8-4.8-3.2 (60-60-40)
CharB5076.0 4.0 (50) 4.8-4.8-3.2 (60-60-40)
Comp1079.2 0.8 (10)4.8-4.8-3.2 (60-60-40)
Comp2078.4 1.6 (20)4.8-4.8-3.2 (60-60-40)
All the values were based on oven-dry weight. Cont, soil without amendment; CharA20, soil + 20 g kg−1 of Biochar A; CharA50, soil + 50 g kg−1 of Biochar A; CharB20, soil + 20 g kg−1 of Biochar B; CharB50, soil + 50 g kg−1 of Biochar B; Comp10, soil + 10 g kg−1 of compost; Comp20, soil + 20 g kg−1 of compost. In parentheses, application rate as converting to Mg ha−1 for biochar and compost and kg ha−1 for inorganic NPK fertilizers, assuming application for 10 cm in depth with a bulk density of 1 g cm−3.
Table 4. Effects of different organic amendments on P contents (mg P kg−1) in different P fractions in soil after 1.5 months and 6 months of incubation.
H2O-PNaHCO3-PiNaHCO3-PoNaOH-PiNaOH-Po
1.5 months
Cont11.2 c23.7 d17.9 a,b,c151 c,d22.9 c,d
CharA2010.4 c25.6 d16.6 b,c146 d,e29.0 c
CharA5011.2 c27.6 c,d22.5 a,b144 e17.4 d
CharB205.9 e28.5 c,d22.7 a,b151 c18.8 d
CharB508.4 d31.0 c19.7 a,b,c146 e19.8 d
Comp1013.4 b62.2 b15.7 c211 b44.5 b
Comp2027.2 a82.5 a23.9 a218 a53.9 a
6 months
Cont1.9 c51.6 d9.2 a,b155 c,d18.3 b
CharA201.5 c60.2 c,d4.4b c152 c,d18.1 b
CharA501.8 c62.8 c3.4 c147 d19.8 b
CharB202.4 b,c60.1 c,d4.0 b,c155 c19.7 b
CharB504.7 b65.8 c3.7 c154 c,d19.6 b
Comp101.6 c102 b11.7 b209 b43.5 a
Comp208.5 a141 a12.9 a242 a39.9 a
Different letters in the same column indicate significant difference at p < 0.05 based on Fisher’s test. Cont, soil without amendment; CharA20, soil + 20 g kg−1 of Biochar A; CharA50, soil + 50 g kg−1 of Biochar A; CharB20, soil + 20 g kg−1 of Biochar B; CharB50, soil + 50 g kg−1 of Biochar B; Comp10, soil + 10 g kg−1 of compost; Comp20, soil + 20 g kg−1 of compost.
Table 5. Change in NH4+-N and NO3--N contents (mg N kg−1) in soil amended with Biochar A, Biochar B or compost at rates of 10 g kg−1, 20 g kg−1, or 50 g kg−1 during 45 days of incubation.
Sampling Day:012545
NH4+-N
Cont42.7 c50.5 b60.5 a61.4 a23.2 d
CharA2044.4 c47.3 c56.0 b58.8 a17.4 d
CharA5047.5 d46.3 c54.1 b59.5 a6.6 e
CharB2043.3 c47.6 b62.9 a63.0 a20.2 b
CharB5041.2 d46.9 c55.3 b61.0 a9.2 e
Comp10313 a,b300 b313 a,b322 a161 c
Comp20560 a557 a523 b540 a,b302 c
NO3-N
Cont34.4 b44.6 a43.9 a35.2 b31.3 c
CharA2033.6 d42.4 b40.2 c33.9 d45.6 a
CharA5032.7 d40.4 b39.2 c31.2 e46.6 a
CharB2034.7 c42.0 a39.5 b29.6 d24.3 e
CharB5035.4 b40.0 a36.2 b25.1 c18.6 d
Comp1040.1 d50.1 b47.5 c39.9 d54.5 a
Comp2046.5 c56.0 a54.4 a,b45.9 c52.1 b
Different letters indicate significant difference between days of incubation in the same treatment at p < 0.05 based on Fisher’s test. Cont, soil without amendment; CharA20, soil + 20 g kg−1 of Biochar A; CharA50, soil + 50 g kg−1 of Biochar A; CharB20, soil + 20 g kg−1 of Biochar B; CharB50, soil + 50 g kg−1 of Biochar B; Comp10, soil + 10 g kg−1 of compost; Comp20, soil + 20 g kg−1 of compost.
Table 6. Pearson’s correlation coefficients of cumulative N2O and CO2 emissions to different soil properties in non-amended and amended soils (n = 21) at day 0 and day 45.
Day 0 IncubationDay 45 Incubation
VariableTotal NC:NWFPSNO3-NNH4+-NNO3-NNH4+-NpH (H2O)
CO20.56 **−0.37 ns0.25 ns0.65 **0.67 **0.47 ns0.64 **0.63 **
N2O0.73 ***−0.74 ***0.68 **0.80 ***0.79 ***0.42 ns0.79 ***0.75 ***
WFPS, water-filled pore space; **, p < 0.01, ***; p < 0.001; ns, not significant.

