Article

Management Intensity Controls Nitrogen-Use-Efficiency and Flows in Grasslands—A 15N Tracing Experiment

by
Marcus Zistl-Schlingmann
,
Steve Kwatcho Kengdo
,
Ralf Kiese
and
Michael Dannenmann
*
Karlsruhe Institute of Technology (KIT), Institute of Meteorology and Climate Research-Atmospheric Environmental Research (IMK-IFU), Kreuzeckbahnstrasse 19, 82467 Garmisch-Partenkirchen, Germany
*
Author to whom correspondence should be addressed.
These authors contributed equally to this study.
Agronomy 2020, 10(4), 606; https://doi.org/10.3390/agronomy10040606
Submission received: 6 March 2020 / Revised: 17 April 2020 / Accepted: 19 April 2020 / Published: 23 April 2020
(This article belongs to the Section Grassland and Pasture Science)

Abstract

:
The consequences of land use intensification and climate warming on productivity, fates of fertilizer nitrogen (N) and the overall soil N balance of montane grasslands remain poorly understood. Here, we report findings of a 15N slurry-tracing experiment on large grassland plant–soil lysimeters exposed to different management intensities (extensive vs. intensive) and climates (control; translocation: +2 °C, reduced precipitation). Surface-applied cattle slurry was enriched with both 15NH4+ and 15N-urea in order to trace its fate in the plant–soil system. Recovery of 15N tracer in plants was low (7–17%), while it was considerably higher in the soil N pool (32–42%), indicating N stabilization in soil organic nitrogen (SON). Total 15N recovery was only 49% ± 7% indicating substantial fertilizer N losses to the environment. With harvest N exports exceeding N fertilization rates, the N balance was negative for all climate and management treatments. Intensive management had an increased deficit relative to extensive management. In contrast, simulated climate change had no significant effects on the grassland N balance. These results suggest a risk of soil N mining in montane grasslands under land use intensification based on broadcast liquid slurry application.

1. Introduction

Grasslands in Germany cover about 30% of the total national agricultural area. One fifth of these grasslands are located in the alpine and pre-alpine belt in southern Germany [1]. Due to a predominantly cool-moist climate and traditional organic fertilization over the last centuries, permanent grassland soils in the pre-alpine region represent a large storage pool of soil organic carbon (SOC) and total nitrogen (TN) [2]. Furthermore, the traditional extensive management [3] remains common and is vital for the maintenance of ecosystem services such as biodiversity and socioeconomic services [4,5]. High SOC and TN contents are a crucial factor in the provisioning of ecological soil functions such as nutrient retention and groundwater protection, while also facilitating high plant productivity [6,7].
Increasing demand for meat and dairy products [8] in turn increases demand for both forage production and adequate disposal areas for animal waste. With climate warming, biomass production of grasslands in the alpine and pre-alpine region may increase [9,10], thus enabling farmers to achieve higher yields and to expand the intensive management from the lowlands into montane regions. This is of special interest in the European alpine and pre-alpine regions, where climate warming is occurring at twice the rate compared to global average, a trend, projected to continue during the next decades [11,12,13,14,15]. Changes in seasonal precipitation and in precipitation extremes are also expected, but the direction and magnitude of effects in the Alps may vary strongly across regions and elevation [12,14,15,16,17].
Another driver of intensification may originate from recent changes in the legislation. The new German fertilizer ordinance, which became operative in June 2017, limits use of organic fertilizer to 170 kg N ha−1 year−1 in order to reduce nitrate leaching rates to groundwater bodies. Beforehand, slurry application rates in the pre-alpine region were up to 305 kg N ha−1 year−1 [18]. The new legal constraints for organic fertilizer could cause farmers to take the now excess slurry from intensively managed grasslands (five fertilization-harvest events per season) and apply it to extensively used grasslands that previously received only 1–2 slurry applications, equaling ca. 30–80 kg N ha−1 year−1.
Earlier studies have indicated that climate change in the alpine and pre-alpine grassland region could lead to SOC loss [2] and nitrogen (N) mining (when N export exceeds input causing a depletion of soil N) from extensively managed grassland soils [19]. This is mainly activated by increased mineralization of soil organic matter (SOM) and associated liberation of nutrients, thereby stimulating both N losses and grassland productivity [2,15,20]. This can be relevant for the overall N balance because harvest export is the dominant N loss pathway in montane grasslands [21].
Various studies have investigated the impact of warming and management on grassland biomass production [10,22,23], N leaching losses [20,24] and nitrous oxide (N2O) emissions [25,26,27,28]. However, little is known on the fates of slurry N in the grassland plant–soil system and how it is partitioned to plant nutrition, storage in soil, total leaching and gaseous N losses. Hence, consequences of intensification for the N balance under a warming climate are largely unclear. Understanding the fate of fertilizer N while considering plant N-use-efficiency and total N losses is therefore important for the development of sustainable and climate adapted management strategies.
Most available literature on the fate of N fertilization examined arable systems [29,30,31] and focused on the use of mineral fertilizers or urea rather than cattle slurry [30,32,33,34,35]. Furthermore, most of the available literature only reported short term N-use-efficiency rather than tracing the fate of fertilizer N during a complete growing season. This knowledge gap prevents adequate adaptation of grassland management to future climates.
In order to provide a comprehensive insight into fates of slurry N in a typical montane grassland system, we applied 15N labeled slurry to large lysimeters over a full growing season. This was done for two management intensities (extensive vs. intensive) and two climate treatments (ambient climate as control, experimentally simulated climate change via translocation to a lower elevation) in a full factorial design. Our climate change treatment represented a realistic future scenario of increased temperature with reduced precipitation but was unable to parse these effects. We traced fertilizer N fates into plant biomass and soil (down to 60 cm) and derived N balances for the four treatments.
We hypothesized that climate change would increase productivity, which will result in increased N exports and thus, negative ecosystem N balances and risk of N mining from SOM. Furthermore, we expected that intensive management would counteract the risk of N mining by increased N addition and stabilization in soil.

2. Materials and Methods

2.1. Study Sites and Experimental Design

The study was conducted in the TERENO pre-alpine observatory in the Ammer river catchment in southern Germany at the sites of Graswang and Fendt [36]. The Graswang site (860 m ASL, 47°57′ N, 11°03′ E, the control site herein referred to as high elevation (HE) is characterized by a mean annual temperature (MAT) of 6.9 °C and mean annual precipitation (MAP) of 1347 mm (2014–2017). The soil at HE is characterized as C and N rich Haplic Cambisol according to World Reference Base for Soil Resources [37] with neutral pH. The Fendt site (600 m ASL, 47°83′ N, 11°07′ E, herein referred to as low elevation “LE”), is characterized by a MAT of 8.9 °C and 956 mm MAP and was used to simulate climate change conditions for intact lysimeters translocated within a space-for-time approach from Graswang to the Fendt site. This climate change treatment represents projected temperature increases of +2 °C and summer precipitation reduction as projected by regional climate modeling of the mid-21st century [12,13,14,15,16]. However, it does not include free air CO2 enrichment.
In 2011, a total of 12 large intact soil cores (112 cm diameter, 1.5 m height) from three replicated sites within a 5 km distance from the HE site were excavated without disturbance of plants and soil [38]. Half remained at HE and half were transferred to LE. Lysimeters operated since the end of 2011 and organized in sets of six surrounding a service unit that hosted all steering and data recording devices. For further details of Lysimeter sampling, setup and instrumentation see [20,38]. Immediately after translocation, half of the lysimeters were exposed to extensive management (two to three cuts and one to two fertilization events with liquid cattle slurry surface application). This followed the previous management regime at HE. The other half underwent an intensive management regime with four to five fertilization-cutting cycles per year. These management regimes correspond to regional farmers practice. The present study was conducted in 2017 after an operational period of almost six years and used an application of 15N labeled slurry for all fertilization events and all treatments.

2.2. Production and Use of 15N Labeled Cattle Slurry

The 15N labeling of the lysimeters was conducted via the application of 15N enriched liquid cattle slurry. Slurry was supplied by the local farmer at the Fendt field site and analyzed by a commercial laboratory (Raiffeisen-Laborservice, Ormont, Germany). The intended 15N enrichment of the slurry was ca. 5%, executed via the addition of 99% 15N enriched Ammonium sulfate and Urea in equal N-amounts. The cattle slurry contained on average 4.2% total N, which was 53% NH4+-N and 47% organic-N (including urea). Addition of the 15N label slightly increased the N content of slurry by an average of 3.5%, which was accounted for in the N balance calculations.
Immediately prior to fertilization of the lysimeters, the 15N tracer was added to the slurry in a polyethylene barrel and vigorously shaken to ensure a homogenous 15N labeling of the slurry. Each lysimeter was fertilized with 1.8 L of liquid slurry per fertilization event, representing the regional farmers’ practice of an addition of 18 m3 ha−1. This resulted in an addition of 253 mg 15N in excess of natural abundance per lysimeter and fertilization event. For application of 15N labeled slurry, we followed actual farmers’ practices, which resulted in four fertilization/labeling events and five cuts for intensive management. Extensive management involved one fertilization/labeling event in spring and three harvests. Both management treatments received another unlabeled fertilization event after the final November sampling that was considered in the N balance calculations.

2.3. Sampling and Sample Preparation

Sampling of aboveground biomass (AGB) was conducted at each cutting event by cutting the vegetation of each lysimeter at ground level. Samples were transported to the facilities of KIT/IMK-IFU in Garmisch-Partenkirchen, Germany for further processing and analysis. Plant biomass yield and N export was measured during 2012–2017, while analysis of 15N recovery was only conducted during labeling with 15N enriched slurry in 2017.
Soil sampling of all lysimeters was conducted during October 2017, i.e., the end of the growing season. For this purpose, three soil cores per lysimeter were retrieved using an auger filled with clear PVC soil liner in order to preserve the integrity of the soil cores. Soil cores were sampled at a distance of at least 30 cm to the edge of the lysimeter, to avoid edge effects. For each lysimeter, sampled soil columns were cut into four depths (0–5; 5–15; 15–30 and 30–60 cm), cleaned of displaced material and homogenized. Three replicated samples of each depth were pooled to one representative sample that was subsequently processed and analyzed. Soil samples and aboveground biomass were dried at 55 °C until a constant weight and subsequently analyzed for TN concentrations and 15N enrichment as described in detail by [21].
The ratio of N isotopes in soil and plant samples were analyzed using an isotope ratio mass spectrometer (Delta PlusXP, Thermo Scientific, Waltham, MA, USA) coupled to an elemental analyzer (Flash EA, Thermo Scientific, Waltham, MA, USA) (EA-IRMS) at the Center for Stable Isotope Analysis (CSI) at KIT/IMK-IFU in Garmisch-Partenkirchen, Germany [39].

2.4. Calculation of 15N Recovery

Excess 15N amount (mg) in all investigated pools was calculated using the following Equation (1).
N p o o l ( A P E 100 )
where Npool is the amount of N in mg in the plant or depth-specific soil N pool and (atomic percent excess) APE is the 15N excess enrichment (atom% 15N measured minus the natural abundance atom% 15N) of the respective N pool. Natural 15N abundance in plants were determined for plant samples of the lysimeters used in this study but from 2016, the year prior to labeling. Natural abundance of soil N was determined in 2011 using soil from the sampling locations of the lysimeters.
Excess 15N recovery at the sampling time, expressed as a percentage, was calculated by dividing the excess amount of 15N in the analyzed pools by the cumulative 15N excess addition following slurry fertilization at the sampling time (253 mg 15N excess per fertilization event).
All results were scaled to the lysimeters by multiplying the calculated 15N excess (mg kg−1 sdw) by the respective sdw (kg) of the lysimeter layer sampled. Tracer recovery in AGB was always calculated with cumulated 15N excess, thereby accounting for the previously exported 15N excess across multiple seasonal biomass harvests.

2.5. Nitrogen Balance

Slurry-N-input, plant-N-harvest exports (N withdrawn via plant harvest for forage production) and total slurry-N-loss (the percentage of unrecovered 15N multiplied by N input via slurry application) of the N balance were calculated with the data gathered during the experiment. N deposition rates of 33 ± 7 kg N ha−1 year−1 were taken from measurements of dry and wet deposition at three comparable, fertilized grassland sites in southern Bavaria, located within a distance of 100 km from our study sites [40]. Biologic nitrogen fixation (BNF) was estimated based on the measured contribution of legumes to total plant biomass yield and previously published relationships between legume abundance and BNF rates [41] from comparable grassland sites in Switzerland. In the latter study, a contribution of 5% to 15% of legume abundance lead to a contribution of fixed N to plant biomass N ranging from 9–16%, equaling 1–26 kg N ha−1. Applying these relationships, the observed proportion of legumes to total dry matter yield (2% and 3% for intensive and extensive management, respectively) translated into BNF estimates of 10 (extensive) and 15 kg N ha−1 year−1 (intensive).
The origin of plant N was calculated based on the recovery rate of excess 15N in plants multiplied by the total amount of applied slurry N. This amount was divided by total plant N, giving the share of slurry N in plant N. The rest of plant N was considered to originate predominantly from SOM mineralization.

2.6. Statistical Analysis

Each lysimeters (N = 3) was used as a statistical replicate in this study. Results were tested for the ANOVA requirements of normality and homoscedasticity. Since these requirements were not met, the non-parametric Kruskal–Wallis test was carried out to test for significant effects of climate and management treatments on measured parameters. All statistical analyses were carried out with IBM SPSS 25.0 (IBM, Armonk, NY, USA).

3. Results

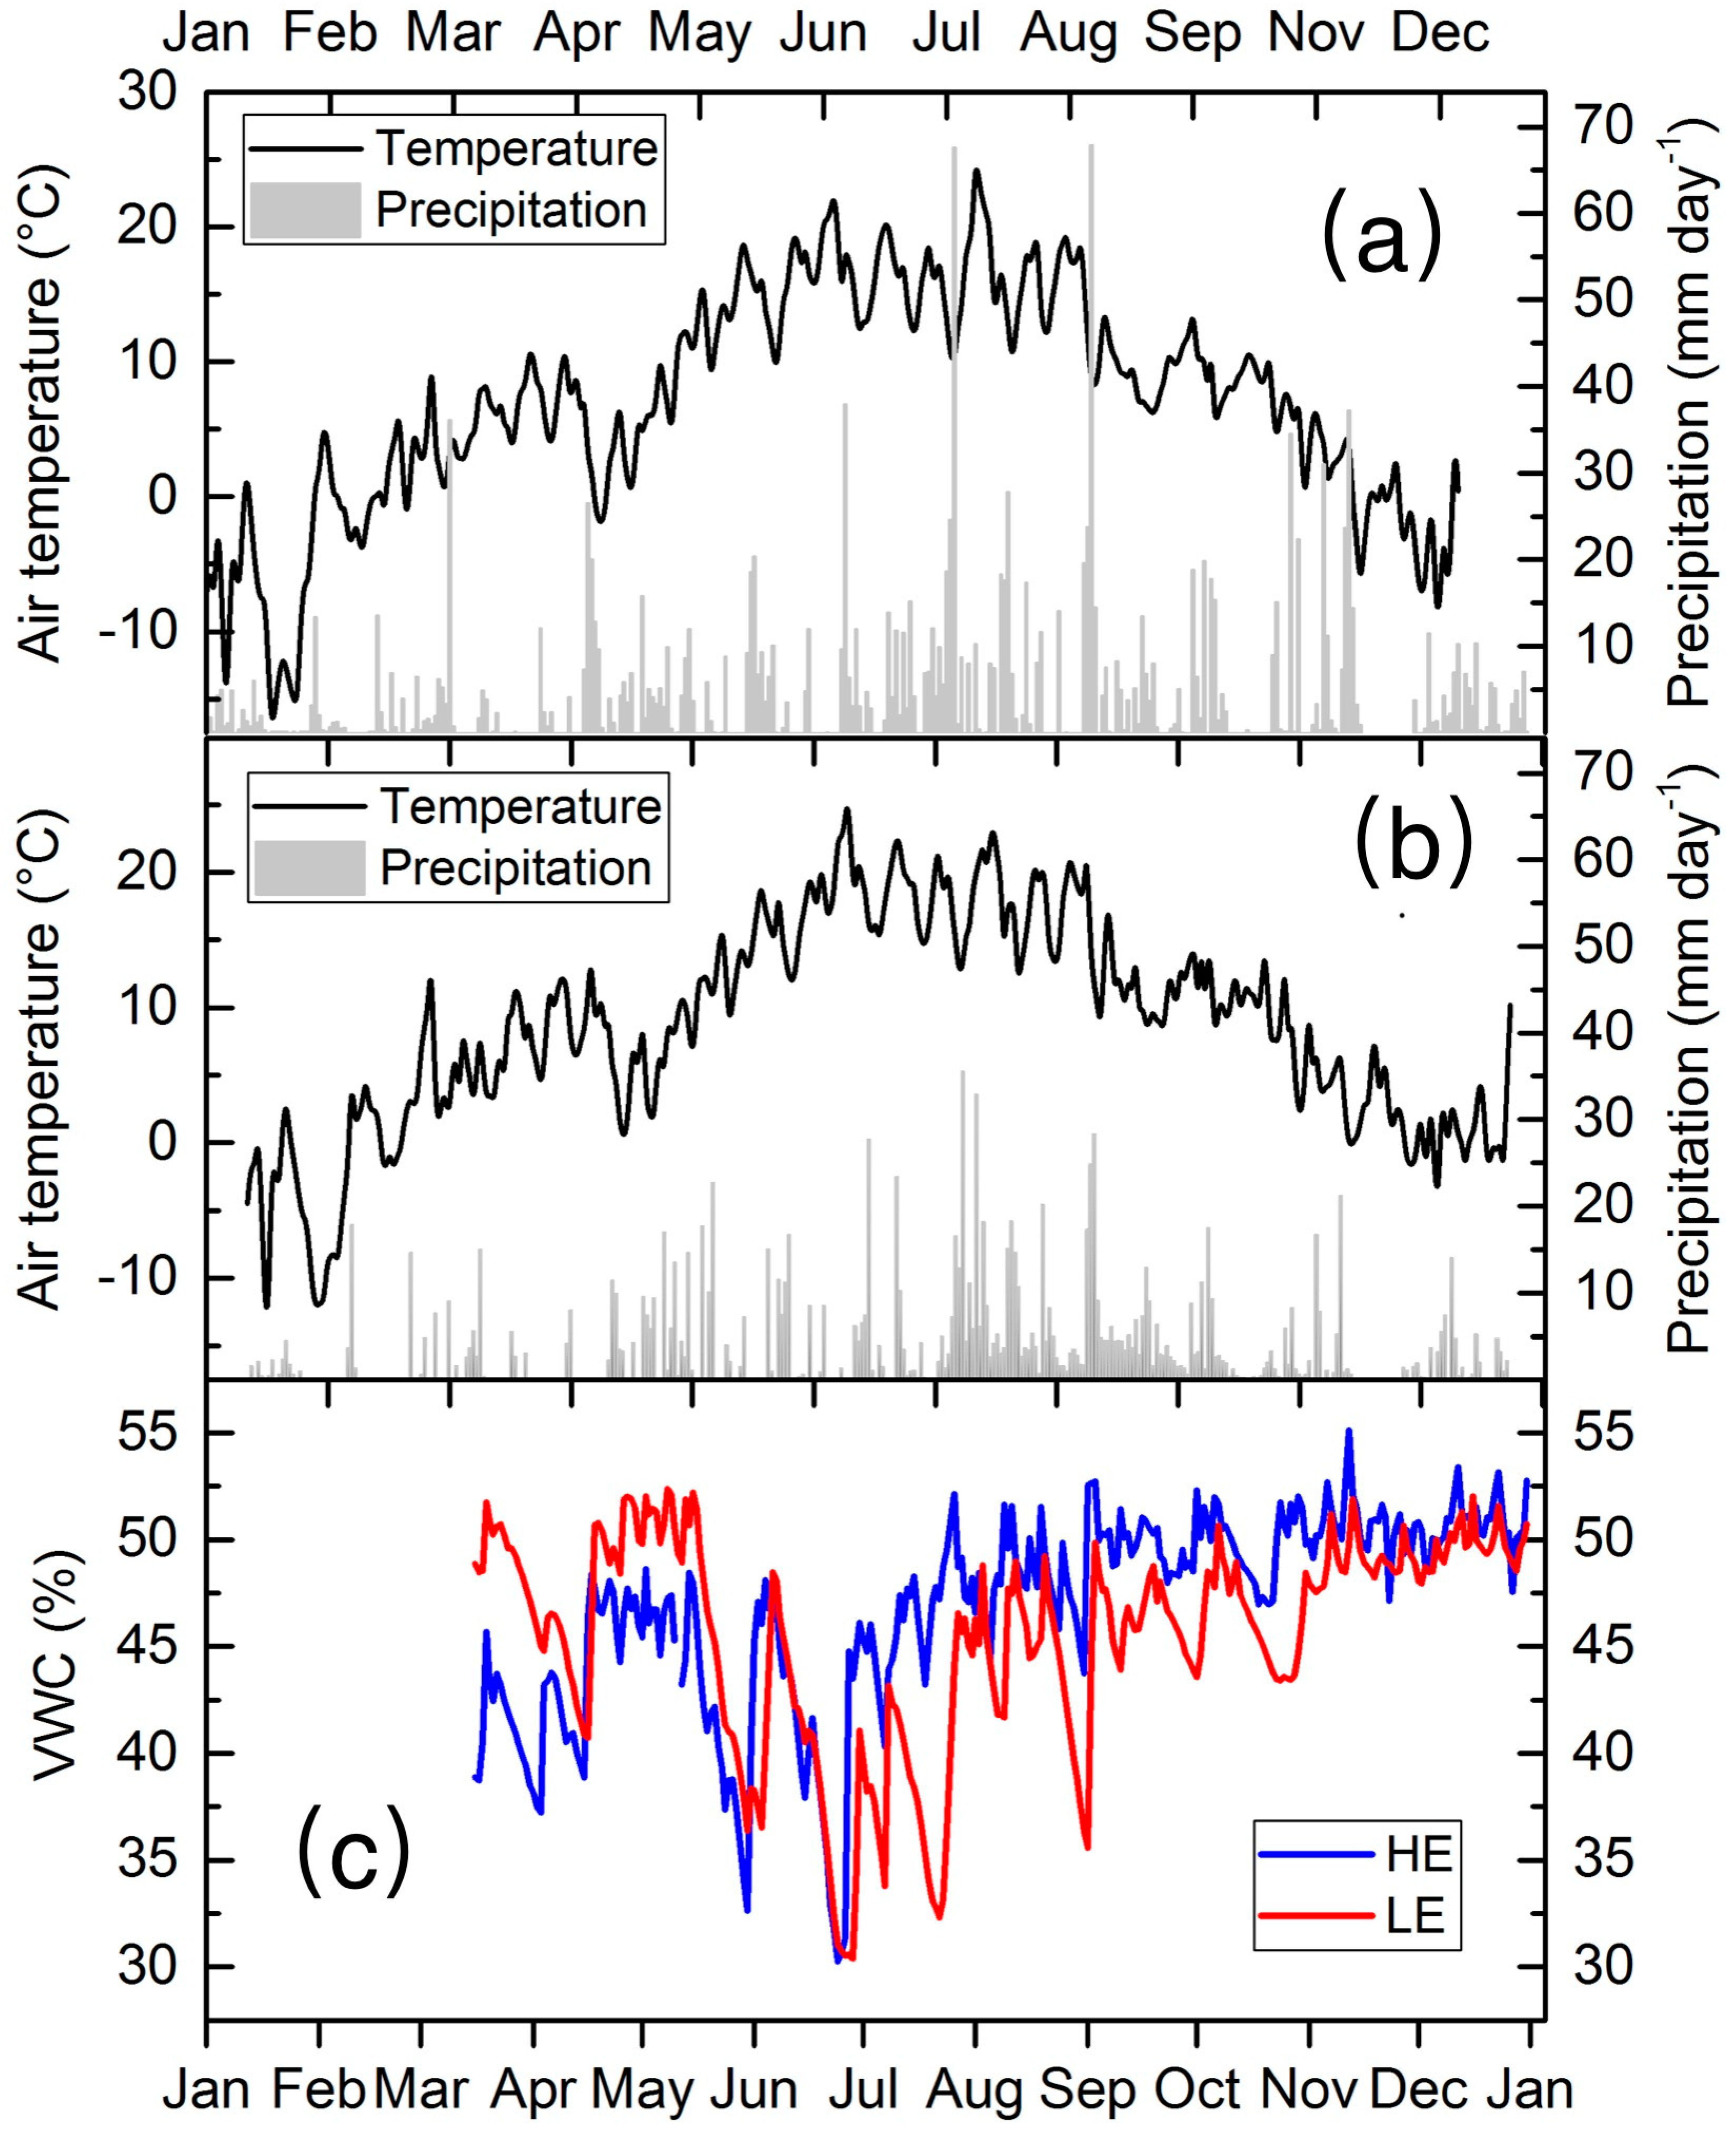
3.1. Meteorological Conditions

During the experimental year 2017, annual temperature for HE and LE were 7.1 °C and 8.7 °C, respectively. Precipitation was higher at HE with 1571 mm, compared to 1249 mm at LE. The translocated lysimeters were therefore exposed to a warming of 1.6 °C and a precipitation decrease of 322 mm. Summer precipitation was higher than winter precipitation (Figure 1a,b). The vegetation period (average daily air Temperature > 5 °C) was 212 and 235 days long with an average air temperature of 12.3 and 13.3 °C, at HE and LE, respectively.
Soil moisture showed generally similar temporal dynamics at HE and LE, albeit with several key seasonal treatment effects (Figure 1c). Spring snow cover and a later snow melt led to reduced soil moisture at HE compared to LE (March-April), while the opposite pattern was observed in the summer months (June, July and August), which generally showed more pronounced variations in soil moisture with several distinct drying and wetting cycles at LE.

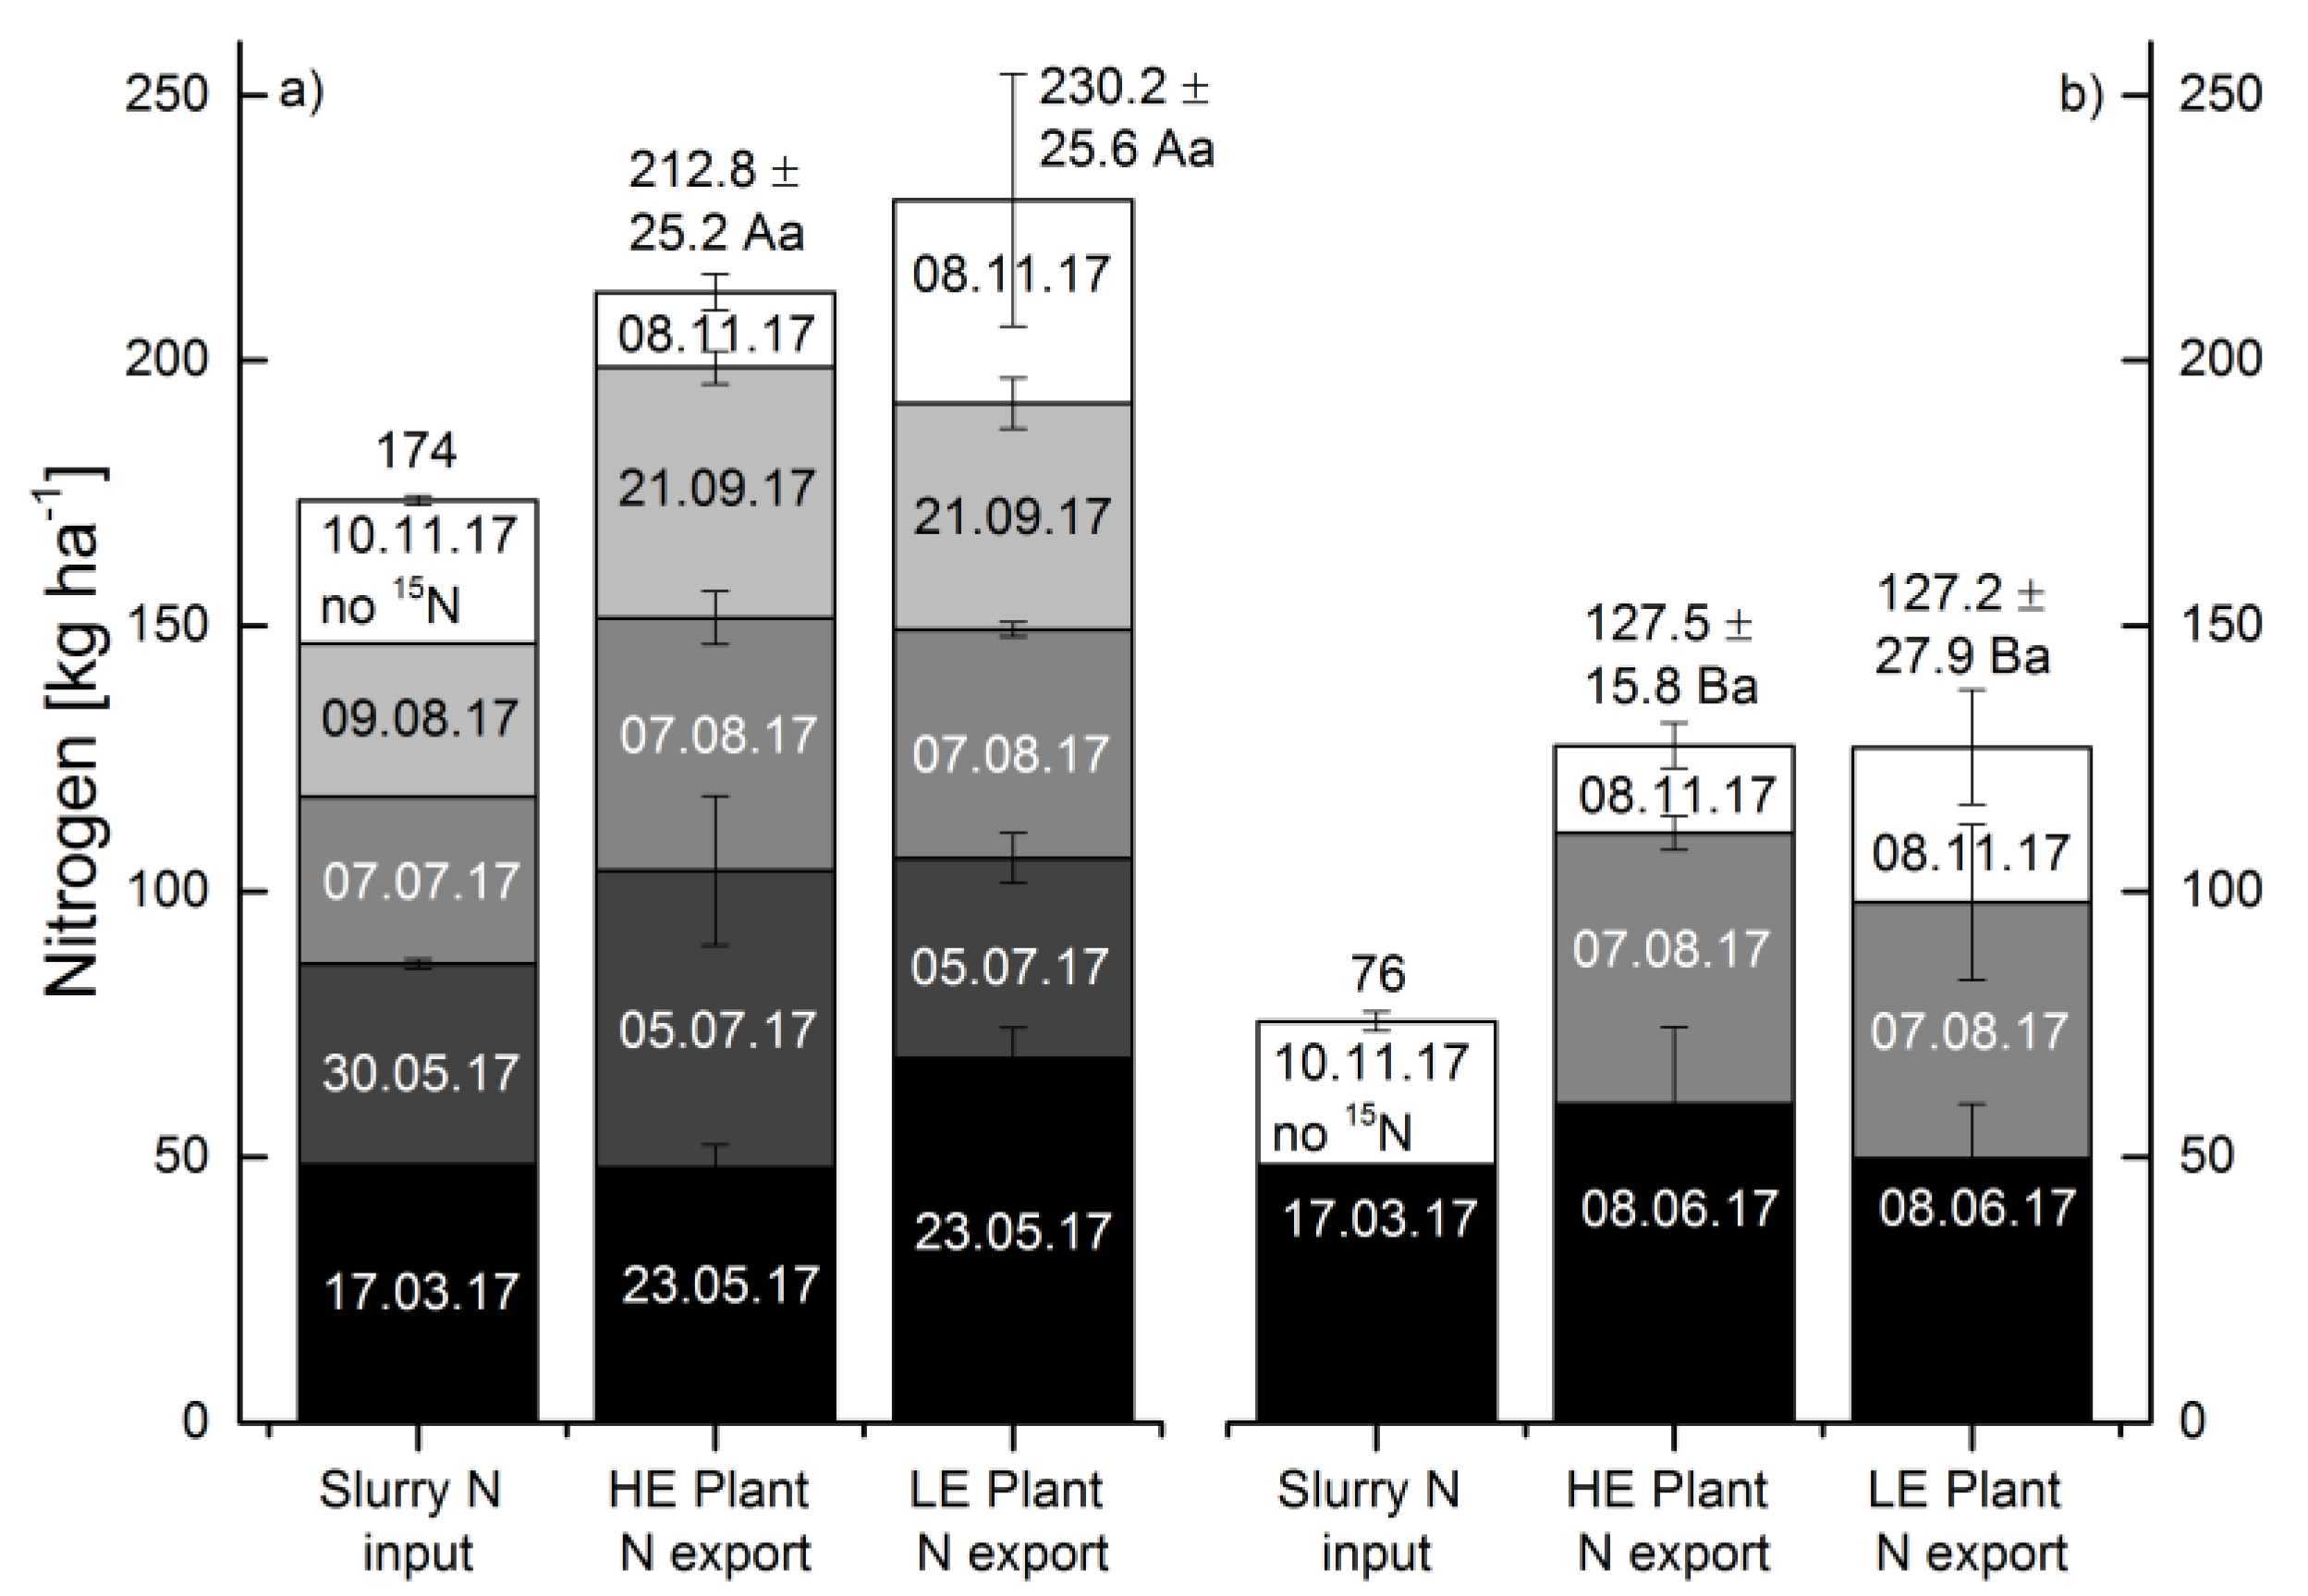
3.2. Plant Biomass Yields, N Content and Associated N Export

In 2017, cumulative plant biomass yields for the complete growing season ranged from 7.5 to 11.6 t ha−1 across treatments (Table 1). Intensive management increased biomass production in both climate treatments by 30% at the HE site and 39% at the LE site. Simulated climate change increased dry matter yield under intensive management by 20% (Table 1).
Intensive management significantly increased plant-N concentrations (Table 2) and N export rates between 2012–2017 (Figure 2, Table 3) compared to extensive management. However, N export rates for single harvest events in 2017 did not show major differences between treatments. Rather, the increased number of harvests accounted for increased cumulative N export under intensive management (Figure 2). Exports persistently exceeded fertilizer N addition for single dates in 2017 (Figure 2). Climate change did not affect cumulative annual N export (Figure 2, Table 3).

3.3. Slurry N Input

Slurry N input showed a constant decline during the year 2017, with the highest N addition occurring during the first application in spring and subsequently decreasing throughout the year via a decrease in slurry N content. Analyses of slurry samples revealed a constant decline in dry matter in the slurry, from 8% during the first sampling period down to 2% in the slurry applied in November.

3.4. 15N Recovery from Labeled Fertilizer

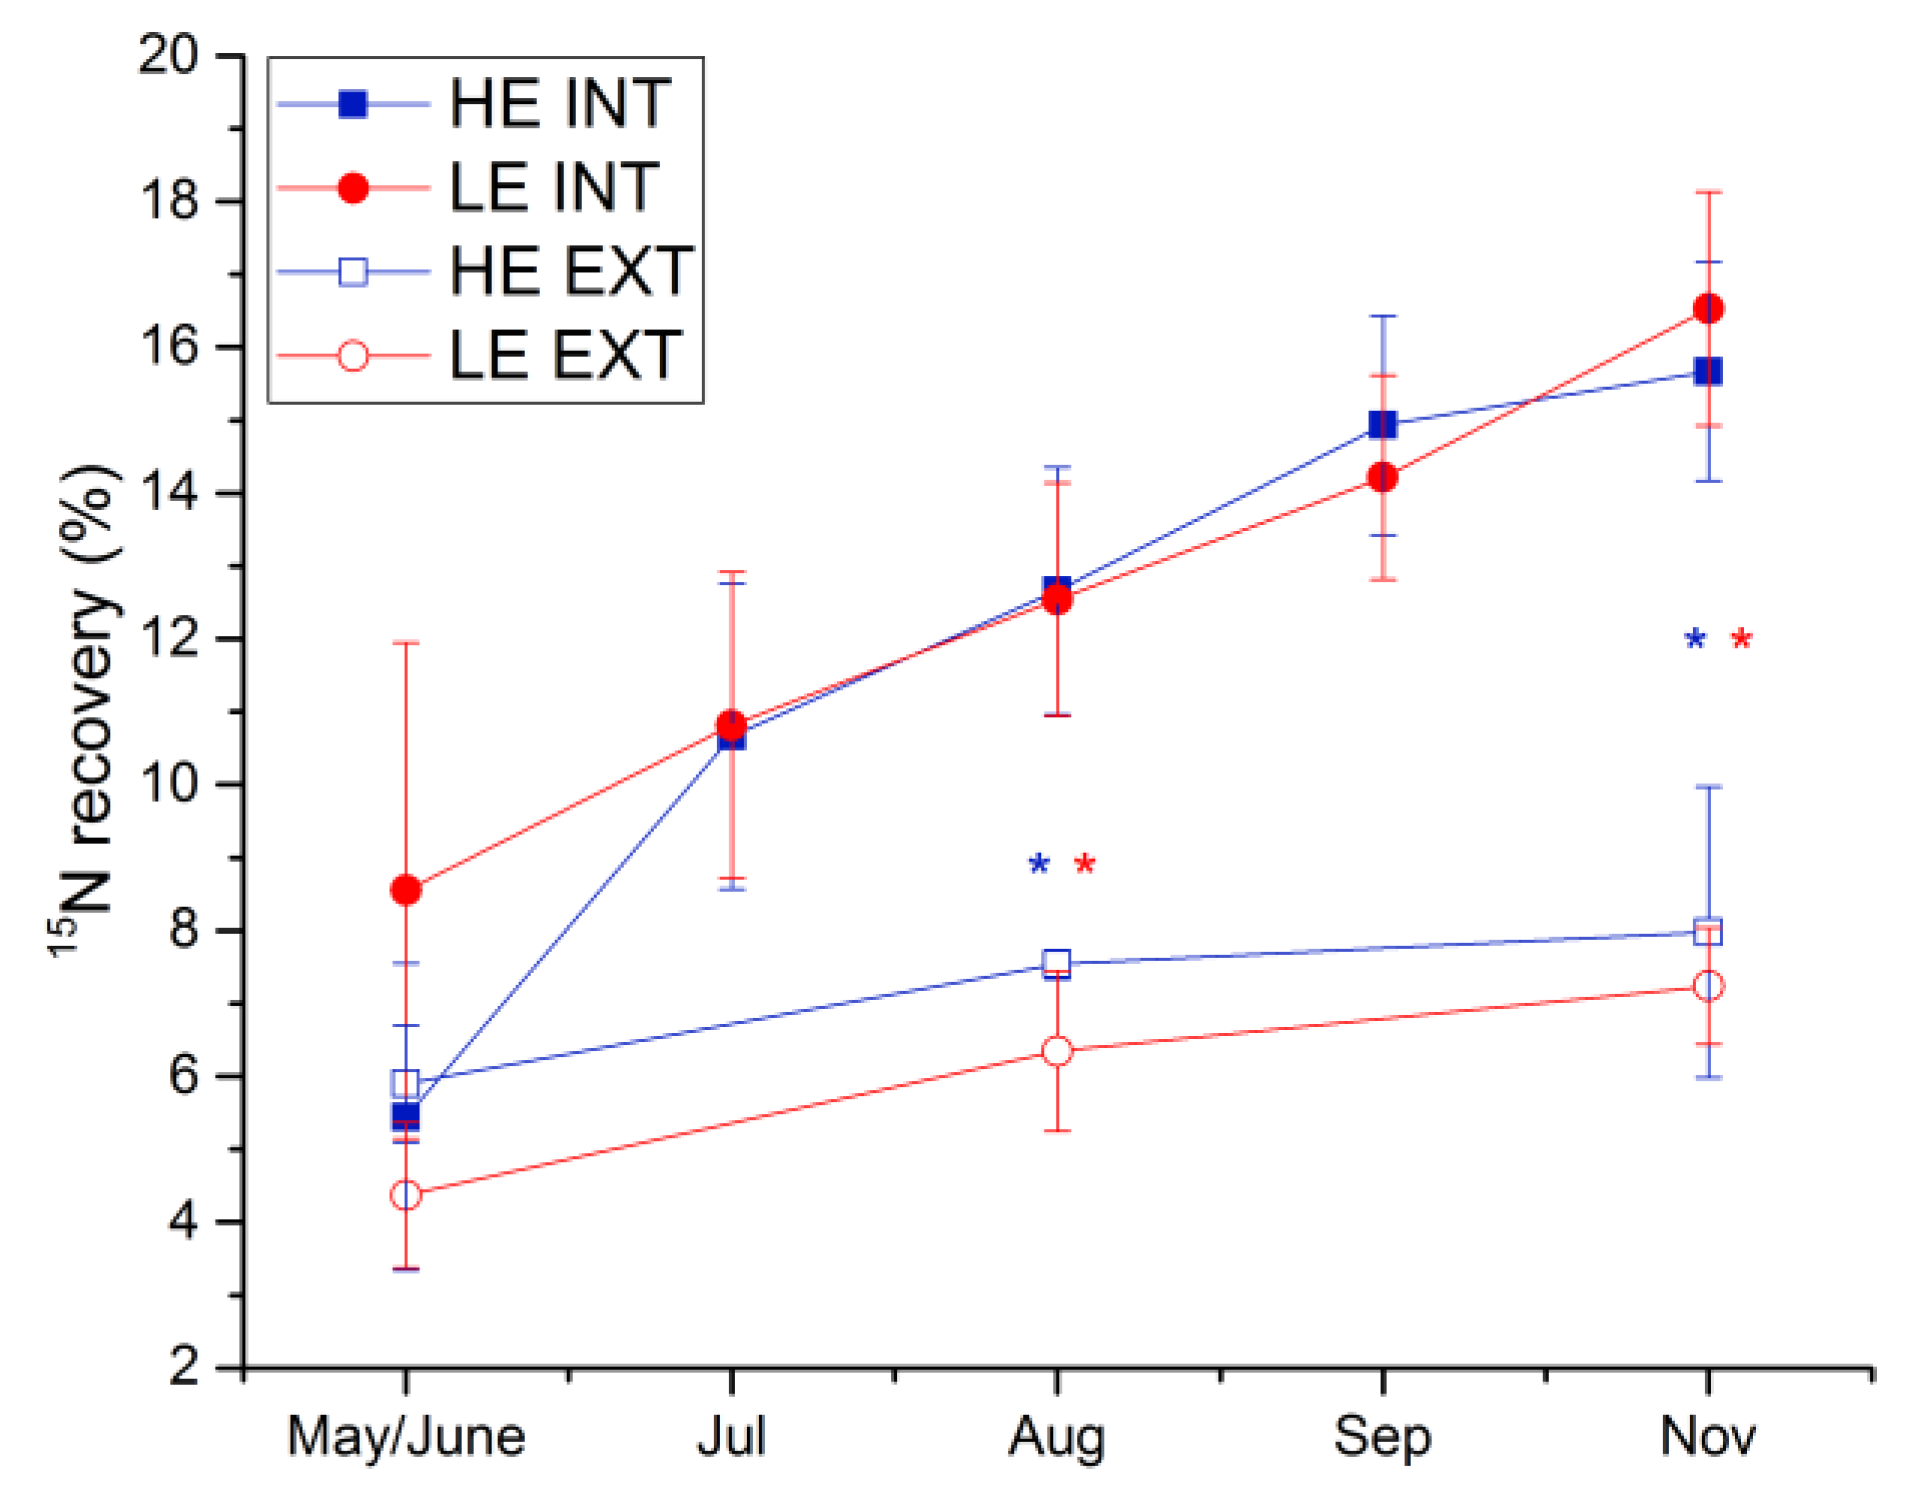
3.4.1. Plant 15N Recovery

Recovery of excess 15N in plant biomass was significantly higher under intensive management throughout the entire growing season, except for the first sampling date (Figure 3). In the intensive treatment, even considering the continuous addition of 15N labeled slurry, percent recovery of excess 15N increased during the growing season with a maximum recovery in November of 15.7% and 16.5% at HE and LE, respectively. Recovery under extensive management only marginally increased during the year with a maximum of 7.2% and 8.0% at LE and HE, respectively. Climate change did not show any significant effects on 15N recovery in plant biomass.
The contribution of slurry N to harvested plant biomass N was 3.0% ± 0.3% under extensive management. This contribution increased more than threefold to 10.7% ± 0.8% for plant biomass of the intensively managed lysimeters (Table 4).

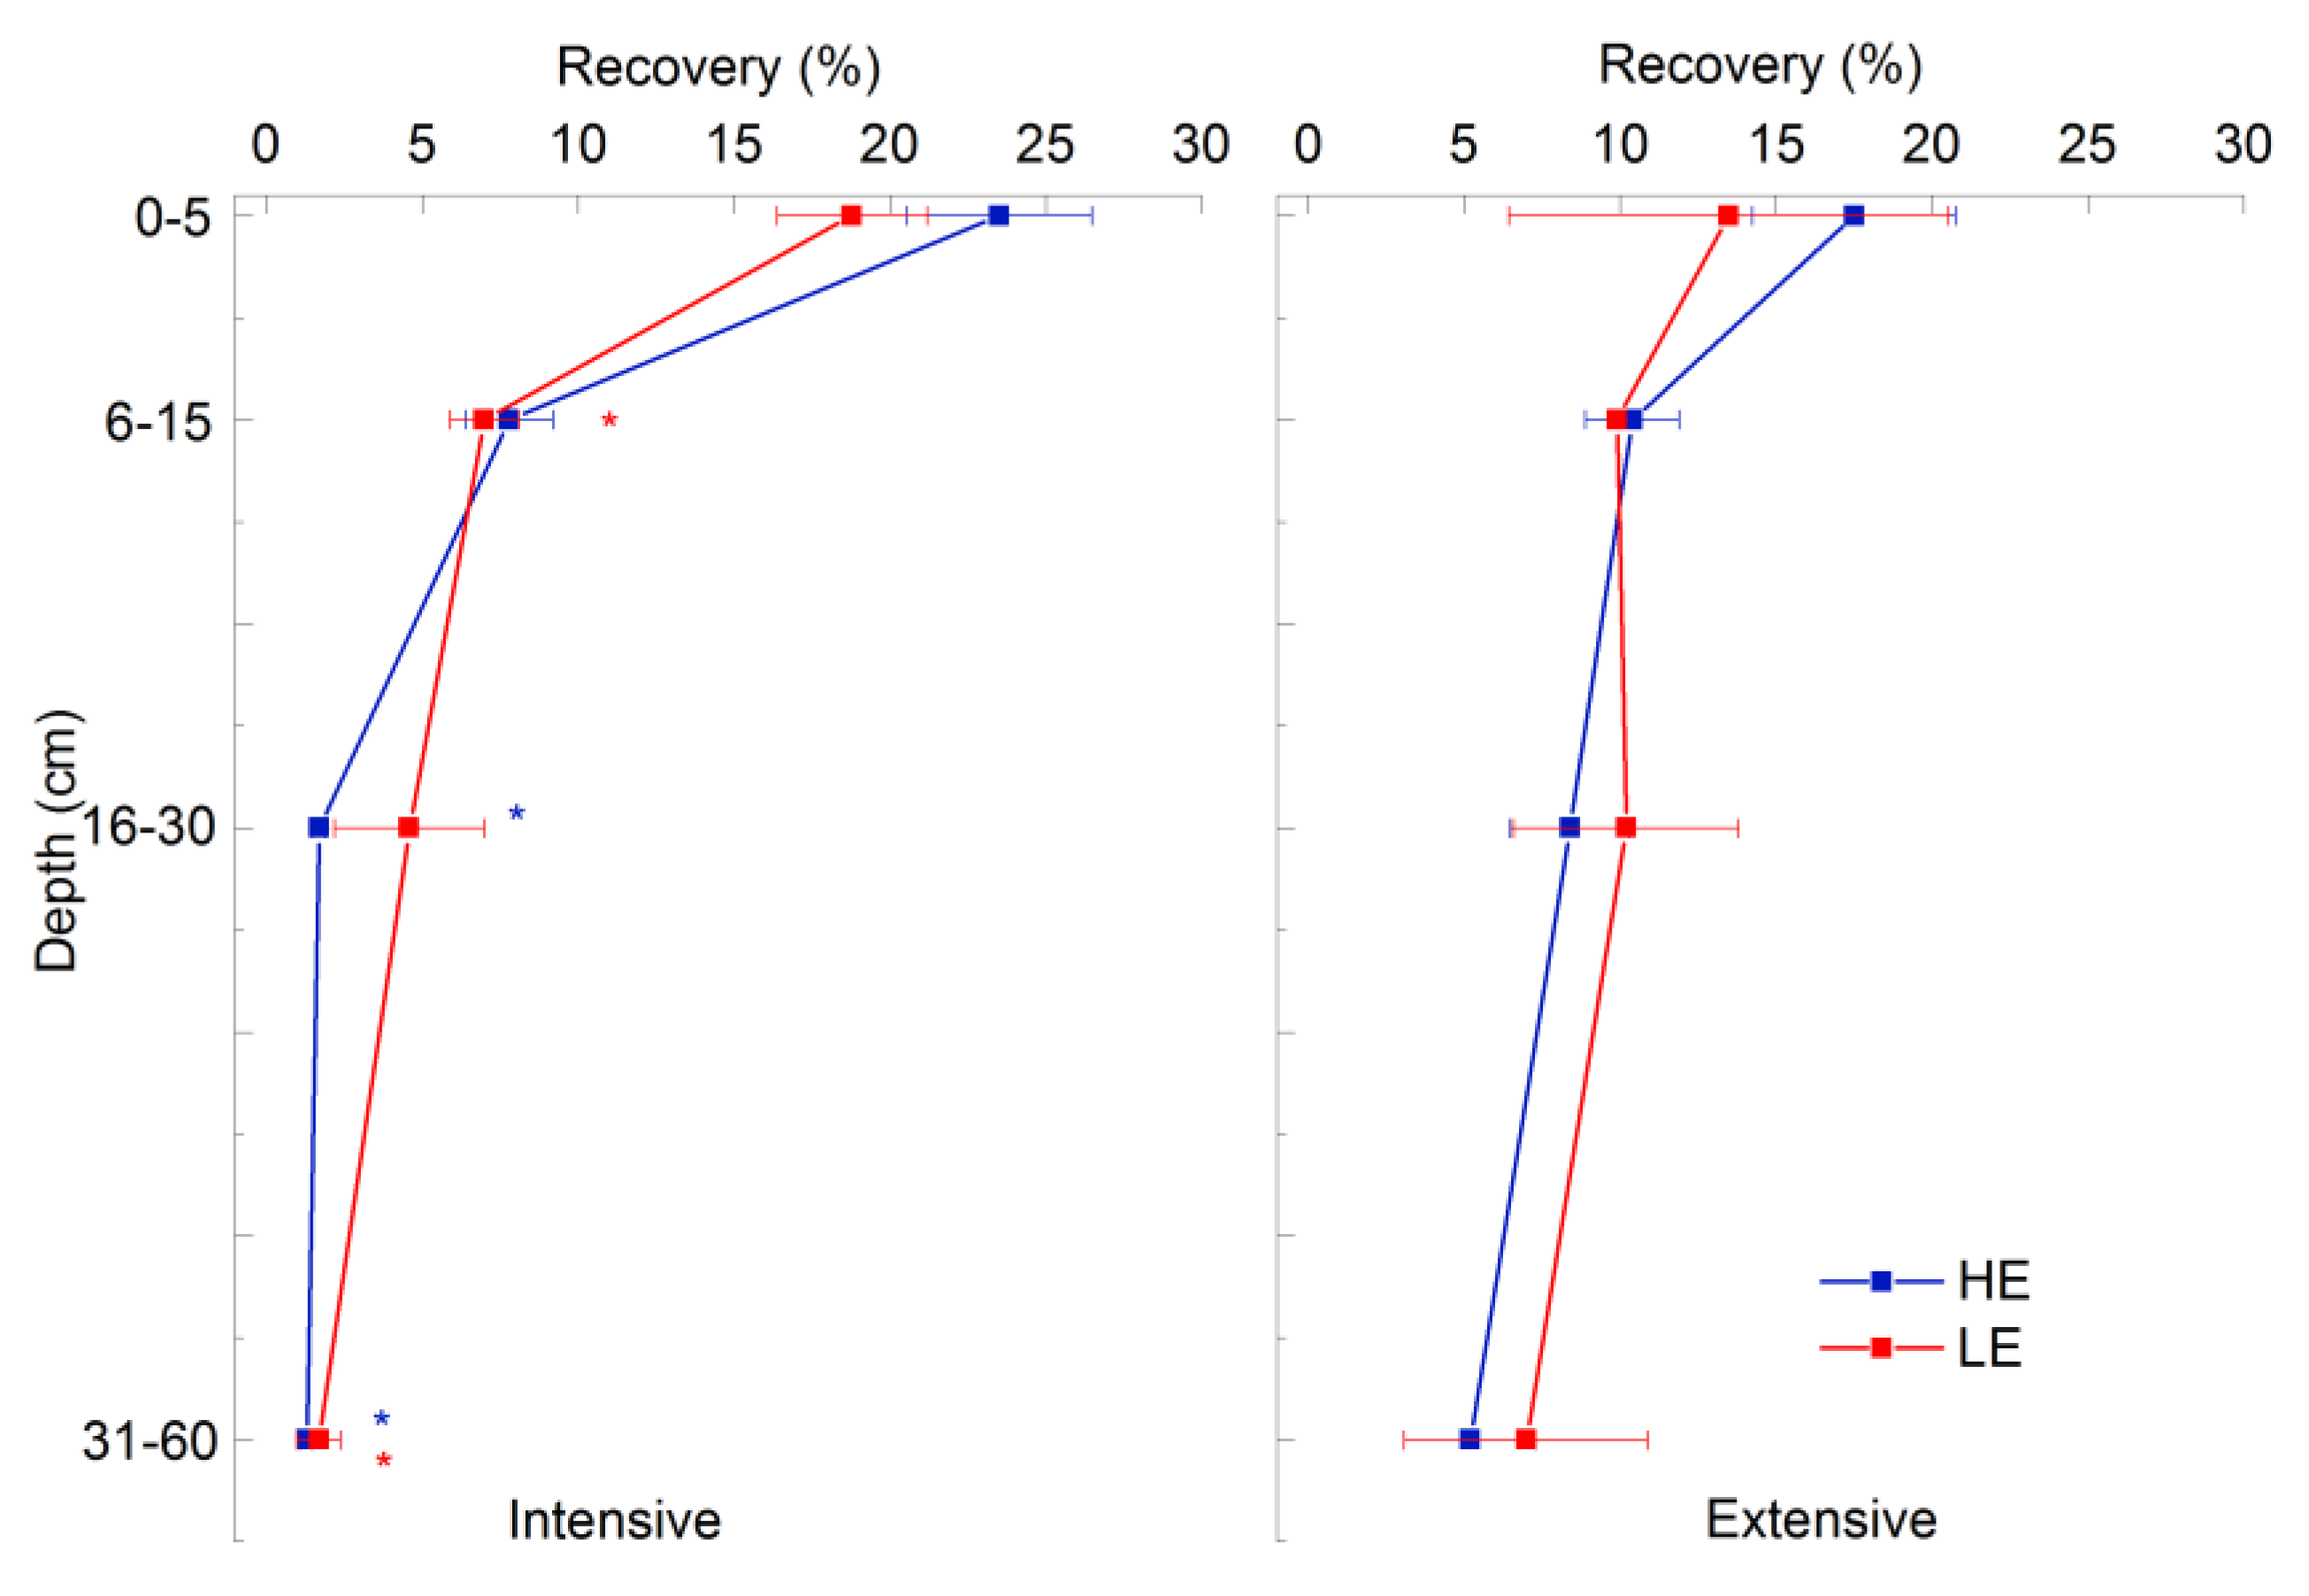
3.4.2. 15N Recovery in Total Soil Nitrogen

Recovery rates of applied 15N fertilizer in the soil were around twice as high as plant recovery under intensive management, but four to five times higher under extensive management. The 15N excess recovery in the soil column down to 60 cm depth was 40–42% in the extensive treatment, with no significant difference to intensive management (32–34%). Soil exposed to intensive management showed larger differences in 15N recovery between topsoil and deeper soil compared to soil from the extensive treatment (Figure 4). Climate change simulation had no effect on slurry 15N recovery in the TN pool.

3.4.3. Total 15N Recovery

Total recovery of applied 15N fertilizer in the soil up to 60 cm depth and plant biomass ranged between 48–50% and was affected by neither management nor climate change treatments. Higher recovery in plant biomass of the intensive treatment was counteracted by lower recovery in the soil and vice versa in the extensive treatment. Consequently, the estimated loss of slurry N based on unrecovered tracer was similar in both management treatments (50–52%), despite different recovery patterns of slurry N in the plant–soil system.

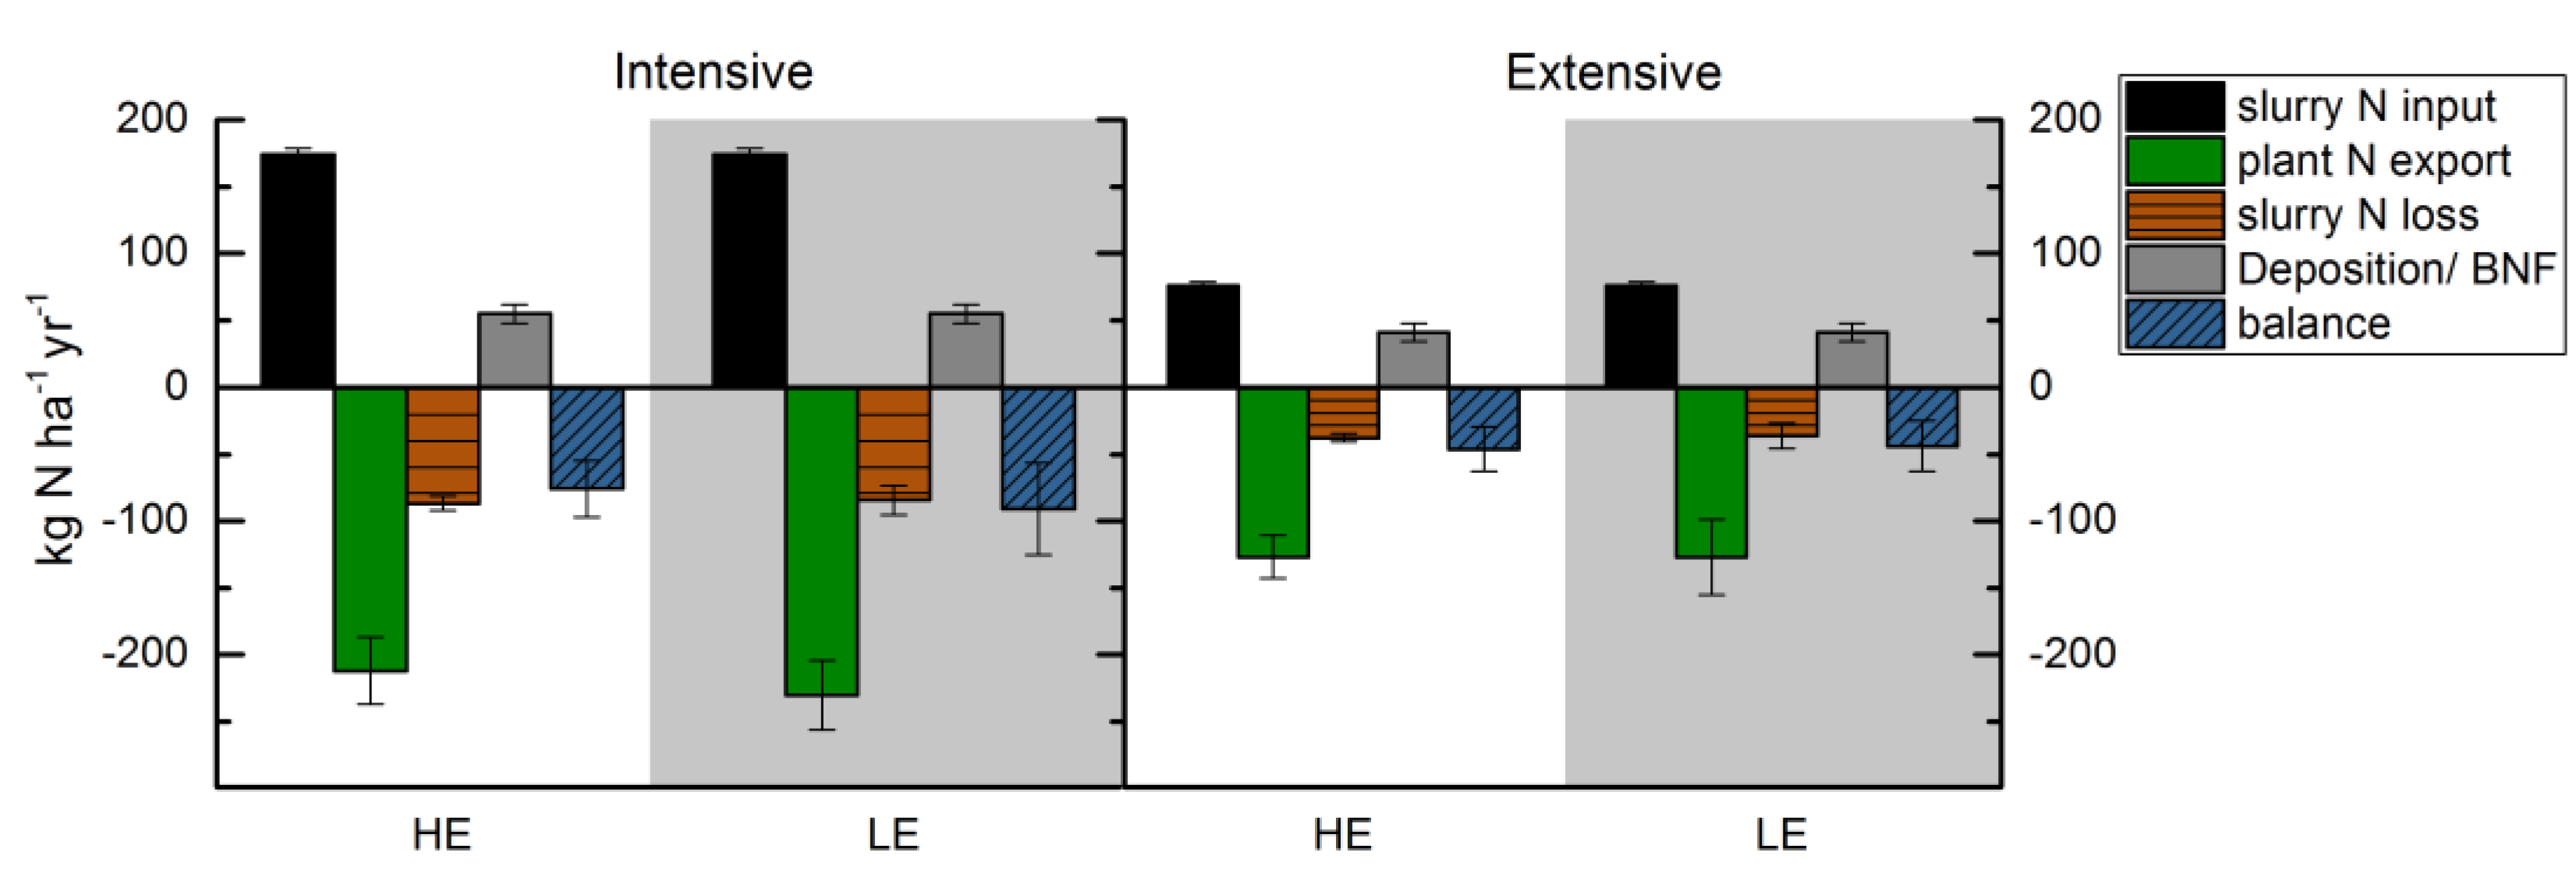
3.5. Nitrogen Balance

The N balance was negative for all treatments (Figure 5). Due to high fertilizer N loss and particularly high N exports through biomass harvest, the N deficit increased over the growing season with every fertilization/cutting cycle. Consequently, the more frequent fertilization and cutting events in the intensive treatment resulted in a larger N deficit compared to the extensive treatment. The deficit in the grassland N balance amounted to an average of 86 ± 29 kg N ha−1 year−1 in the intensive treatment, significantly larger than values (47 ± 18 kg N ha−1 year−1) obtained for the extensive treatment (n = 6, p < 0.05). In contrast to management, the experimentally simulated climate change had no effects on the N balance (Figure 5).

4. Discussion

4.1. N Cycling in Montane Grassland Soil

High plant productivity and associated plant N exports that persistently exceeded total N inputs by fertilization were pervasive across the experiment. Surprisingly, plants used slurry N at very low efficiency, so that the high plant N demand was largely met by mineralization of SON rather than recently applied fertilizer N. Since refueling of SON stocks by fertilizer addition was also inefficient due to high slurry N losses, N balances were negative, thereby indicating soil N mining in all climate and management treatments. The high productivity observed in this study (7.5–11.6 t ha−1 year−1) is in line with studies conducted in other temperate grasslands, which reported yields ranging from 5.5 to 14.5 t ha−1 year−1 [42,43,44].
N balances were calculated from tracing fertilizer N and quantifying plant and soil N pools in a lysimeter study. This approach has inherent methodological limitations. Since organic N in slurry was not labeled, except urea, it remained untraced in this study. However, the organic N components in slurry require depolymerization to become available for plant-microbe competition pathways, thus the partitioning of organic N to plant and microbial uptake or loss may follow comparable patterns as revealed by 15N tracing of ammonium and urea from slurry. Further uncertainty is associated with BNF, which was estimated from literature. However, with an estimate of 10–15 kg N ha−1 year−1 this is likely to be a comparably low contributor in the N balance in any case.
The 15N recovery from slurry (49% ± 7%) is in general agreement with other 15N tracing studies, including a 24–62% loss of 15N labeled slurry in a permanent grass sward in Ireland [43] and a 32% recovery in a 15NH4+ tracing experiment in grassland mesocosms [45]. Overall 15N recovery may be slightly underestimated since recovery in belowground biomass remains unmeasured within this study. In a similar slurry tracing experiment in the study region, 15N excess recovery in roots was only 3.4% [21], therefore of minor importance for the overall recovery.

4.2. Effects of Climate Change Simulation

Diverging effects of warming on grassland productivity were found in earlier studies, ranging from productivity increase [9] in N-rich montane soils, to no warming effect in North American pastures [46] and a Mediterranean grassland in California [47] or to a decrease of biomass production in alpine/subalpine grasslands of Switzerland [48]. Ref [21] reported an increase in productivity and plant N export by translocation of extremely organic matter-rich grassland plant–soil-mesocosms from 1260 m to the HE site of this study, but with no further productivity increase or even a decreasing productivity upon translocation to LE due to soil moisture limitations. Other studies have similarly suggested a high dependency of grassland productivity on soil moisture conditions [23]. In our study, we only found minor effects of simulated climate change on plant biomass production, with a slight increase of dry matter yield under intensive management at LE (Table 1). However, plants were not able to increase N acquisition alongside increased biomass production, resulting in N export rates that were not elevated under experimental climate change. Similarly, recovery of excess 15N from labeled slurry remained unchanged by climate change. It appears that under the climatic gradient used in this study, any potential warming-induced changes are counterbalanced by soil moisture limitations in the summer season (Figure 1c). Hence, in contrast to our hypothesis, our results do not show increased soil N mining under climate change simulation. However, a design that incorporated elevated CO2 mixing ratios could yield the expected changes. It remains to be explored whether higher plant water use efficiency under elevated CO2 can partly relieve water limitations.

4.3. Effects of Intensification

In contrast to largely absent climate change effects, we found a significant effect of management intensity. Yields increased under intensive management by 31–40% compared to extensive management and were accompanied by an increased N content in the plants, as predicted by [49]. Intensification is commonly associated with plant biodiversity decrease due to shifts in competitive hierarchies [50]. While unmeasured in this study, our treatment potentially promoted the abundance of species with higher plant tissue N concentrations [51]. Furthermore, under intensive management, plants showed higher fertilizer N-use-efficiency than under extensive management. We assume that this is closely related to the timing and frequency of fertilization: While the single 15N-labeled fertilization under extensive treatment was conducted in spring (i.e., at lower temperatures and less plant growth), intensively managed plants receive continuous fertilization including during peak growing season, possibly enhancing plant N uptake during periods of high productivity.
Generally, it is assumed that low fertilization rates increase the plant-microbe competition under extensive management, leading to lower direct plant uptake and increased immobilization by microbial biomass [52]. Higher recovery of excess 15N in the TN pool in extensive management, indicates efficient microbial immobilization of N; fixation in SON further supports this theory. However, irrespective of management, higher recovery in total soil N than in plants generally demonstrates that immobilization by free living heterotrophic soil microbes at the expense of plant uptake [52,53] is the dominant fate of fertilizer N. This microbial driven nutrient retention may be enabled by high C availability in the organic matter rich soil [27], leading to bioavailable N being limiting rather than C under both management types. This finding is further strengthened by the low N leaching rates (1–5 kg ha−1 year−1) reported by [20] for the same lysimeters. Instead, the high proportion of unrecovered 15N indicates high direct losses from slurry along gaseous pathways as indicated by the direct measurements of [54].
Low recovery of excess 15N in plants (7.6% ± 1.6% and 16.1% ± 1.7% for extensive and intensive, respectively) was slightly higher, but generally in the same range (5–6%) as found by [55] in a 15NH4 tracing study in an annual grassland in California. In contrast, recovery found in maize crops ranged from 57% to 70% of applied 15N slurry fertilizer [30], a considerably higher range compared to this study. This highlights that research findings from arable systems are inadequate for informing grassland management given the vastly different fates and functions of fertilizer N. Our observation that mineralized SON is the main source of plant N means that the additional fertilization alone does not explain increasing yields and N exports in the intensive treatment. In contrast, increased N exports through mowing in the intensive treatments may be supported by priming effects of slurry-N on SOM mineralization, thus increasing N and possibly P supply for plant nutrition [56,57]. Furthermore, the combination of fertilization, priming and the frequency of mowing may have increased biomass production. However, the effect of mowing frequency is controversial, as biomass production was observed to decrease at higher cutting frequencies [22,58], suggesting threshold dynamics.
These observations challenge the paradigm that slurry N application in grasslands directly fuels plant N demand. Rather, it appears that N supplied by slurry fertilization serves to refuel SON stocks that are mineralized to meet direct plant N demand. Depending on recalcitrance of organic N compounds [59] formed from slurry N (e.g., through stabilization of microbial residues), this slurry N will be mineralized and eventually taken up by plants on the mid to long term. The time span of this flow of slurry-N through SON requires further investigation.
Compared to surface-applied slurry-N, mineralized soil N may be more available for rhizosphere uptake given sufficiently high mineralization rates due to spatial synchrony. In this context, the extremely high plant N uptake from older SON observed in this study (88 to 236 kg N ha−1 season−1) requires sufficient depolymerization and gross N mineralization rates. For the Haplic Cambisol soil of this study, very high ammonification gross rates of 200 (HE) to 500 kg N ha−1 year−1 (LE) under extensive management for only 10 cm depth were reported. In addition, heterotrophic nitrification, i.e., a direct oxidation of organic N to nitrate, strongly contributed to soil mineral N availability on top of mineralization [19]. These findings confirm that there is sufficient N mineralization to meet the high plant N demand. For slurry-N to refuel SON stocks, low N losses are essential and thus unfulfilled by the slurry surface application technique in this study, clearly shown by the high proportion of unrecovered slurry N (35–63%). The combination of high harvest N exports and high loss of slurry N led to a deficit in the N balance at all sites and treatments (Figure 5), indicating insufficient supply of fertilizer N to maintain SON stocks. Nitrogen mining increased from 53 ± 17 (HE) and 52 ± 19 kg N ha−1 year−1 (LE) under extensive management to 88 ± 21 (HE) and 103 ± 34 kg N ha−1 year−1 (LE) in intensive treatments. The high plant N export rates for the years 2012–2017 show that such N mining was likely not unique to 2017 when 15N tracers were used. These results conflict with [60], who reported a net C and N sequestration under intensive management in a temperate grassland, while extensive management led to a net loss of C and N. In contrast, our findings suggests that current management techniques with broadcast liquid slurry application are not suitable to sustain SON and—given the intimately linked N and C cycles—potentially also SOC stocks in our study system. This, however, remains unresolved since C and N cycles may respond differently to changes in climate and management as well with changes in soil C:N ratios. With plant productivity and associated N export representing the key component for the N balance, it is speculative as to whether SOC is affected in a similar magnitude as SON. For example, increased productivity under intensive management could result in increased plant C transfer to soil and further C gain for soil could arise from slurry C.

5. Conclusions

The investigated pre-alpine grassland with C- and N-rich soil was characterized by high plant biomass production in both extensive and intensive treatments. Management was identified as the dominant controlling factor of N fates in this grassland, while combined warming and precipitation reduction had little effect on fates of slurry N in the plant–soil system. Disentangling effects of single versus combined climate change factors in multi-factorial experiments in future studies may help to better predict grassland N cycling in a changing climate.
High plant N demand was largely fed by mineralization of SOM but not by fertilizer-N, resulting in very low N-use-efficiency and high gaseous environmental N losses. In sum, this resulted in soil N mining that increased with management intensity but not with climate change. A potential soil N mining of~50–100 kg N ha−1 year−1 as indicated by our results is able to significantly reduce the SON stocks of ca. 18 t N ha−1 at decadal timescales.
On the long term, associated soil functions such as productivity and eventually SOC stocks may decline if no grassland management with improved N-use-efficiency is implemented. Therefore, we recommend testing of alternative slurry application such as slurry acidification, slurry injection into soil, as well as traditional fertilization with solid manure, in combination with reduced cutting frequency for their potential towards climate-smart sustainable management of grasslands.

Author Contributions

Conceptualization, M.D., R.K. and M.Z.-S.; methodology, M.Z.-S., S.K.K. and M.D.; data curation, S.K.K., M.Z.-S. and M.D.; writing—original draft preparation, S.K.K. and M.Z.-S.; writing—review and editing, M.D. and R.K.; visualization, S.K.K. and M.Z.-S.; supervision, M.D. and R.K.; project administration, R.K., M.D.; funding acquisition, M.D. and R.K., M.Z.-S. and S.K.K. equally contributed to this study. All authors have read and agreed to the published version of the manuscript.

Funding

This research was funded by the German Federal Ministry of Education and Research (BMBF) in in the SUSALPS project (Sustainable use of alpine and pre-alpine grassland soils in a changing climate), embedded within the BonaRes initiative, Grant Number FKZ 031B0516A. Further funding was obtained from the Helmholtz TERENO initiative.

Acknowledgments

We would like to thank Rainer Gasche for technical support during lysimeter sampling; Sascha Klefenz for support during sampling and sample preparation; Katrin Schneider for analysis and quality check of soil moisture data; Paul Töchterle for the analysis of plant and soil samples in the Center for stable Isotopes (CSI) at the KIT/IMK-IFU. We furthermore want to express our gratitude to Peter Wilfahrt for proofreading and language editing.

Conflicts of Interest

The authors declare no conflict of interest.

References

  1. BMELV. Statistisches Jahrbuch über Ernährung, Landwirtschaft und Forsten der Bundesrepublik Deutschland; Landwirtsschaftsverlag GmbH: Münster, Germany, 2012; Available online: https://www.bmel-statistik.de/fileadmin/SITE_MASTER/content/Jahrbuch/Agrarstatistisches-Jahrbuch-2012.pdf (accessed on 14 January 2020).
  2. Wiesmeier, M.; Hübner, R.; Barthold, F.; Spörlein, P.; Geuß, U.; Hangen, E.; Reischl, A.; Schilling, B.; von Lützow, M.; Kögel-Knabner, I. Amount, distribution and driving factors of soil organic carbon and nitrogen in cropland and grassland soils of southeast Germany (Bavaria). Agric. Ecosyst. Environ. 2013, 176, 39–52. [Google Scholar] [CrossRef]
  3. Von Glasenapp, M.; Thornton, T.F. Traditional ecological knowledge of Swiss alpine farmers and their resilience to socioecological change. Hum. Ecol. 2011, 39, 769–781. [Google Scholar] [CrossRef]
  4. Poschlod, P.; Wallis de Vries, M.F. The historical and socioeconomic perspective of calcareous grasslands—Lessons from the distant and recent past. Biol. Conserv. 2002, 104, 361–376. [Google Scholar] [CrossRef]
  5. Wilson, J.B.; Peet, R.K.; Dengler, J.; Pärtel, M. Plant species richness: The world records. J. Veg. Sci. 2012, 23, 796–802. [Google Scholar] [CrossRef]
  6. Rabot, E.; Wiesmeier, M.; Schlüter, S.; Vogel, H.-J. Soil structure as an indicator of soil functions: A review. Geoderma 2018, 314, 122–137. [Google Scholar] [CrossRef]
  7. Blum, W.E.H. Functions of soil for society and the environment. Rev. Environmental Sci. Bio/Technol. 2005, 4, 75–79. [Google Scholar] [CrossRef]
  8. Patterson, M. OECD Agriculture Statistics; OECD Publishing: Paris, France, 2012; Available online: http://www.fao.org/3/i9166e/i9166e_Chapter7_Dairy.pdf (accessed on 14 January 2020).
  9. Sebastià, M.-T.; Kirwan, L.; Connolly, J. Strong shifts in plant diversity and vegetation composition in grassland shortly after climatic change. J. Veg. Sci. 2008, 19, 299–306. [Google Scholar] [CrossRef]
  10. Berauer, B.J.; Wilfahrt, P.A.; Arfin-Khan, M.A.S.; Eibes, P.; von Heßberg, A.; Ingrisch, J.; Schloter, M.; Schuchardt, M.A.; Jentsch, A. Low resistance of montane and alpine grasslands to abrupt changes in temperature and precipitation regimes. Arct. Antarct. Alp. Res. 2019, 51, 215–231. [Google Scholar] [CrossRef]
  11. Wagner, S.; Berg, P.; Schädler, G.; Kunstmann, H. High resolution regional climate model simulations for Germany: Part II—Projected climate changes. Clim. Dyn. 2013, 40, 415–427. [Google Scholar] [CrossRef]
  12. Smiatek, G.; Kunstmann, H.; Knoche, R.; Marx, A. Precipitation and temperature statistics in high-resolution regional climate models: Evaluation for the European Alps. J. Geophys. Res. Atmos. 2009, 114. [Google Scholar] [CrossRef] [Green Version]
  13. Pepin, N.; Bradley, R.S.; Diaz, H.F.; Baraër, M.; Caceres, E.B.; Forsythe, N.; Fowler, H.; Greenwood, G.; Hashmi, M.Z.; Liu, X.D. Elevation-dependent warming in mountain regions of the world. Nat. Clim. Chang. 2015, 5, 424–430. [Google Scholar]
  14. Gobiet, A.; Kotlarski, S.; Beniston, M.; Heinrich, G.; Rajczak, J.; Stoffel, M. 21st century climate change in the European Alps—A review. Sci. Total Environ. 2014, 493, 1138–1151. [Google Scholar] [CrossRef] [PubMed]
  15. Warscher, M.; Wagner, S.; Marke, T.; Laux, P.; Smiatek, G.; Strasser, U.; Kunstmann, H. A 5 km resolution regional climate simulation for central europe: Performance in high mountain areas and seasonal, regional and elevation-dependent variations. Atmosphere 2019, 10, 682. [Google Scholar] [CrossRef] [Green Version]
  16. Rajczak, J.; Pall, P.; Schär, C. Projections of extreme precipitation events in regional climate simulations for Europe and the Alpine Region. J. Geophys. Res. Atmos. 2013, 118, 3610–3626. [Google Scholar] [CrossRef]
  17. Giorgi, F.; Torma, C.; Coppola, E.; Ban, N.; Schär, C.; Somot, S. Enhanced summer convective rainfall at Alpine high elevations in response to climate warming. Nat. Geosci. 2016, 9, 584–589. [Google Scholar] [CrossRef]
  18. Galler, P.V.J. Wirtschaftsdünger: Anfall, Lagerung, Verwertung, Umwelt; Landwirtschaftskammer: Salzburg, Austria, 2009; Available online: https://www.infothek-biomasse.ch/images//205_2009_LK_Hofduenger_naehrstoffe_AUT.pdf (accessed on 14 January 2020).
  19. Wang, C.; Chen, Z.; Unteregelsbacher, S.; Lu, H.; Gschwendtner, S.; Gasche, R.; Kolar, A.; Schloter, M.; Kiese, R.; Butterbach-Bahl, K. Climate change amplifies gross nitrogen turnover in montane grasslands of Central Europe in both summer and winter seasons. Glob. Chang. Biol. 2016, 22, 2963–2978. [Google Scholar] [CrossRef]
  20. Fu, J.; Gasche, R.; Wang, N.; Lu, H.; Butterbach-Bahl, K.; Kiese, R. Impacts of climate and management on water balance and nitrogen leaching from montane grassland soils of S-Germany. Environ. Pollut. 2017, 229, 119–131. [Google Scholar] [CrossRef]
  21. Zistl-Schlingmann, M.; Tobler, U.; Berauer, B.J.; Garcia-Franco, N.; Wilfahrt, P.A.; Wiesmeier, M.; Jentsch, A.; Wolf, B.; Kiese, R.; Dannenmann, M. Intensive slurry management and climate change promote nitrogen mining from organic matter-rich montane grassland soils. submitted.
  22. Walter, J.; Grant, K.; Beierkuhnlein, C.; Kreyling, J.; Weber, M.; Jentsch, A. Increased rainfall variability reduces biomass and forage quality of temperate grassland largely independent of mowing frequency. Agric. Ecosyst. Environ. 2012, 148, 1–10. [Google Scholar] [CrossRef]
  23. Cantarel, A.A.M.; Bloor, J.M.G.; Soussana, J.-F. Four years of simulated climate change reduces above-ground productivity and alters functional diversity in a grassland ecosystem. J. Veg. Sci. 2013, 24, 113–126. [Google Scholar] [CrossRef]
  24. Vries, F.T.; Bloem, J.; Quirk, H.; Stevens, C.J.; Bol, R.; Bardgett, R.D. Extensive management promotes plant and microbial nitrogen retention in temperate grassland. PLoS ONE 2012, 7, e51201. [Google Scholar] [CrossRef] [PubMed] [Green Version]
  25. Cardenas, L.; Bhogal, A.; Chadwick, D.; McGeough, K.; Misselbrook, T.; Rees, R.M.; Thorman, R.; Watson, C.; Williams, J.; Smith, K.; et al. Nitrogen use efficiency and nitrous oxide emissions from five UK fertilised grasslands. Sci. Total Environ. 2019, 661, 696–710. [Google Scholar] [CrossRef]
  26. Cantarel, A.A.M.; Bloor, J.M.G.; Deltroy, N.; Soussana, J.-F. Effects of climate change drivers on nitrous oxide fluxes in an upland temperate grassland. Ecosystems 2011, 14, 223–233. [Google Scholar] [CrossRef]
  27. Butterbach-Bahl, K.; Dannenmann, M. Soil carbon and nitrogen interactions and biosphere-atmosphere exchange of nitrous oxide and methane. In Recarbonization of the Biosphere; Springer: Berlin/Heidelberg, Germany, 2012; pp. 429–443. [Google Scholar]
  28. Wolf, B.; Zheng, X.; Brüggemann, N.; Chen, W.; Dannenmann, M.; Han, X.; Sutton, M.A.; Wu, H.; Yao, Z.; Butterbach-Bahl, K. Grazing-induced reduction of natural nitrous oxide release from continental steppe. Nature 2010, 464, 881–884. [Google Scholar] [CrossRef] [PubMed]
  29. Jensen, L.S.; Pedersen, I.S.; Hansen, T.B.; Nielsen, N.E. Turnover and fate of 15N-labelled cattle slurry ammonium-N applied in the autumn to winter wheat. Eur. J. Agron. 2000, 12, 23–35. [Google Scholar] [CrossRef]
  30. Paul, J.W.; Beauchamp, E.G. Availability of manure slurry ammonium for corn using 15N-labelled (NH4) 2SO4. Can. J. Soil Sci. 1995, 75, 35–42. [Google Scholar] [CrossRef] [Green Version]
  31. Rocha, K.F.; Mariano, E.; Grassmann, C.S.; Trivelin, P.C.O.; Rosolem, C.A. Fate of 15N fertilizer applied to maize in rotation with tropical forage grasses. Field Crop. Res. 2019, 238, 35–44. [Google Scholar] [CrossRef]
  32. Christian, D.G.; Poulton, P.R.; Riche, A.B.; Yates, N.E. The recovery of 15N-labelled fertilizer applied to Miscanthus× giganteus. Biomass Bioenergy 1997, 12, 21–24. [Google Scholar] [CrossRef]
  33. Scheiner, J.D.; Gutiérrez-Boem, F.H.; Lavado, R.S. Sunflower nitrogen requirement and 15N fertilizer recovery in Western Pampas, Argentina. Eur. J. Agron. 2002, 17, 73–79. [Google Scholar] [CrossRef]
  34. Rowlings, D.W.; Scheer, C.; Liu, S.; Grace, P.R. Annual nitrogen dynamics and urea fertilizer recoveries from a dairy pasture using 15N; effect of nitrification inhibitor DMPP and reduced application rates. Agric. Ecosyst. Environ. 2016, 216, 216–225. [Google Scholar] [CrossRef]
  35. Zhou, M.; Zhu, B.; Brüggemann, N.; Dannenmann, M.; Wang, Y.; Butterbach-Bahl, K. Sustaining crop productivity while reducing environmental nitrogen losses in the subtropical wheat-maize cropping systems: A comprehensive case study of nitrogen cycling and balance. Agric. Ecosyst. Environ. 2016, 231, 1–14. [Google Scholar] [CrossRef]
  36. Kiese, R.; Fersch, B.; Baessler, C.; Brosy, C.; Butterbach-Bahl, K.; Chwala, C.; Dannenmann, M.; Fu, J.; Gasche, R.; Grote, R. The TERENO Pre-Alpine Observatory: Integrating meteorological, hydrological, and biogeochemical measurements and modeling. Vadose Zone J. 2018, 17. [Google Scholar] [CrossRef]
  37. IUSS Working Group WRB. World Soil Resources Reports No. 106. In World Reference Base for Soil Resources 2014; update 2015; FAO: Rome, Italy, 2015. [Google Scholar]
  38. Pütz, T.; Kiese, R.; Wollschläger, U.; Groh, J.; Rupp, H.; Zacharias, S.; Priesack, E.; Gerke, H.H.; Gasche, R.; Bens, O. TERENO-SOILCan: A lysimeter-network in Germany observing soil processes and plant diversity influenced by climate change. Environ. Earth Sci. 2016, 75, 1242. [Google Scholar] [CrossRef]
  39. Guo, C.; Simon, J.; Gasche, R.; Naumann, P.S.; Bimüller, C.; Pena, R.; Polle, A.; Kögel-Knabner, I.; Zeller, B.; Rennenberg, H. Minor contribution of leaf litter to N nutrition of beech (Fagus sylvatica) seedlings in a mountainous beech forest of Southern Germany. Plant Soil 2013, 369, 657–668. [Google Scholar] [CrossRef]
  40. LfL. Wirtschaftsdünger und Gewässerschutz Lagerung und Ausbringung von Wirtschaftsdüngern in der Landwirtschaft. Available online: https://www.lfl.bayern.de/mam/cms07/publikationen/daten/informationen/p_34348.pdf (accessed on 14 January 2020).
  41. Jacot, K.A.; Lüscher, A.; Nösberger, J.; Hartwig, U.A. The relative contribution of symbiotic N2 fixation and other nitrogen sources to grassland ecosystems along an altitudinal gradient in the Alps. Plant Soil. 2000, 225, 201–211. [Google Scholar] [CrossRef]
  42. Ammann, C.; Flechard, C.R.; Leifeld, J.; Neftel, A.; Fuhrer, J. The carbon budget of newly established temperate grassland depends on management intensity. Agric. Ecosyst. Environ. 2007, 121, 5–20. [Google Scholar] [CrossRef]
  43. Hoekstra, N.J.; Lalor, S.T.J.; Richards, K.G.; O’Hea, N.; Lanigan, G.J.; Dyckmans, J.; Schulte, R.P.O.; Schmidt, O. Slurry 15 NH 4-N recovery in herbage and soil: Effects of application method and timing. Plant Soil 2010, 330, 357–368. [Google Scholar] [CrossRef] [Green Version]
  44. Nüsse, A.; Linsler, D.; Loges, R.; Reinsch, T.; Taube, F.; Ludwig, B. Effect of grassland harvesting frequency and N-fertilization on stocks and dynamics of soil organic matter in the temperate climate. Arch. Agron. Soil Sci. 2018, 64, 1925–1931. [Google Scholar] [CrossRef]
  45. Barnard, R.; Barthes, L.; Leadley, P.W. Short-term uptake of 15 N by a grass and soil micro-organisms after long-term exposure to elevated CO2. Plant Soil 2006, 280, 91–99. [Google Scholar] [CrossRef]
  46. Izaurralde, R.C.; Thomson, A.M.; Morgan, J.A.; Fay, P.A.; Polley, H.W.; Hatfield, J.L. Climate impacts on agriculture: Implications for forage and rangeland production. Agron. J. 2011, 103, 371–381. [Google Scholar] [CrossRef] [Green Version]
  47. Dukes, J.S.; Chiariello, N.R.; Cleland, E.E.; Moore, L.A.; Shaw, M.R.; Thayer, S.; Tobeck, T.; Mooney, H.A.; Field, C.B. Responses of grassland production to single and multiple global environmental changes. PLoS Biol. 2005, 3, e319. [Google Scholar] [CrossRef] [PubMed] [Green Version]
  48. Egli, M.; Hitz, C.; Fitze, P.; Mirabella, A. Experimental determination of climate-change effects on above-ground and below-ground organic matter in alpine grasslands by translocation of soil cores. J. Plant Nutr. Soil Sci. 2004, 167, 457–470. [Google Scholar] [CrossRef]
  49. Soussana, J.-F.; Lemaire, G. Coupling carbon and nitrogen cycles for environmentally sustainable intensification of grasslands and crop-livestock systems. Agric. Ecosyst. Environ. 2014, 190, 9–17. [Google Scholar] [CrossRef]
  50. Harpole, W.S.; Tilman, D. Grassland species loss resulting from reduced niche dimension. Nature 2007, 446, 791–793. [Google Scholar] [CrossRef]
  51. Reich, P.B. The world-wide ‘fast–slow’plant economics spectrum: A traits manifesto. J. Ecol. 2014, 102, 275–301. [Google Scholar] [CrossRef]
  52. Kuzyakov, Y.; Xu, X. Competition between roots and microorganisms for nitrogen: Mechanisms and ecological relevance. New Phytol. 2013, 198, 656–669. [Google Scholar] [CrossRef]
  53. Inselsbacher, E.; Umana, N.H.-N.; Stange, F.C.; Gorfer, M.; Schüller, E.; Ripka, K.; Zechmeister-Boltenstern, S.; Hood-Novotny, R.; Strauss, J.; Wanek, W. Short-term competition between crop plants and soil microbes for inorganic N fertilizer. Soil Biol. Biochem. 2010, 42, 360–372. [Google Scholar] [CrossRef]
  54. Zistl-Schlingmann, M.; Feng, J.; Kiese, R.; Stephan, R.; Zuazo, P.; Willibald, G.; Wang, C.; Butterbach-Bahl, K.; Dannenmann, M. Dinitrogen emissions: An overlooked key component of the N balance of montane grasslands. Biogeochemistry 2019, 143, 15–30. [Google Scholar] [CrossRef] [Green Version]
  55. Hart, S.C.; Firestone, M.K.; Paul, E.A.; Smith, J.L. Flow and fate of soil nitrogen in an annual grassland and a young mixed-conifer forest. Soil Biol. Biochem. 1993, 25, 431–442. [Google Scholar] [CrossRef]
  56. Cheng, W.; Parton, W.J.; Gonzalez-Meler, M.A.; Phillips, R.; Asao, S.; McNickle, G.G.; Brzostek, E.; Jastrow, J.D. Synthesis and modeling perspectives of rhizosphere priming. New Phytol. 2014, 201, 31–44. [Google Scholar] [CrossRef] [PubMed] [Green Version]
  57. Dijkstra, F.A.; Carrillo, Y.; Pendall, E.; Morgan, J.A. Rhizosphere priming: A nutrient perspective. Front. Microbiol. 2013, 4, 216. [Google Scholar] [CrossRef] [PubMed] [Green Version]
  58. Bernhardt-Römermann, M.; Römermann, C.; Sperlich, S.; Schmidt, W. Explaining grassland biomass—The contribution of climate, species and functional diversity depends on fertilization and mowing frequency. J. Appl. Ecol. 2011, 48, 1088–1097. [Google Scholar] [CrossRef] [Green Version]
  59. Bimüller, C.; Dannenmann, M.; Tejedor, J.; von Lützow, M.; Buegger, F.; Meier, R.; Haug, S.; Schroll, R.; Kögel-Knabner, I. Prolonged summer droughts retard soil N processing and stabilization in organo-mineral fractions. Soil Biol. Biochem. 2014, 68, 241–251. [Google Scholar] [CrossRef]
  60. Ammann, C.; Spirig, C.; Leifeld, J.; Neftel, A. Assessment of the nitrogen and carbon budget of two managed temperate grassland fields. Agric. Ecosyst. Environ. 2009, 133, 150–162. [Google Scholar] [CrossRef]
Figure 1. Meteorological conditions during the experimental period in the year 2017 for both high elevation (HE) (a) and low elevation (LE) (b) with daily precipitation and air temperature values and volumetric water content (VWC) in 10 cm depth at both sites (c).
Agronomy 10 00606 g001
Figure 2. Addition of slurry nitrogen (N) and export of plant N for each fertilization and harvest event under intensive (a) and extensive (b) management. Dates are the respective dates of slurry/label application and plant harvest. Numbers represent the sum of each bar. Error bars represent standard deviation of each single date. HE: high elevation; LE: low elevation.
Agronomy 10 00606 g002
Figure 3. Recovery of excess 15N in plant biomass across one growing season. Error bars represent standard deviation. Asterisks represent significant differences between management treatments (blue for HE site and red for LE site; p < 0.05). No significant effects of the climate change treatments were observed. HE: high elevation; LE: low elevation; INT: intensive management; EXT: extensive management.
Agronomy 10 00606 g003
Figure 4. Recovery of excess 15N in the soil as a function of depth. Asterisks represent significant differences between management treatments (blue for HE; red for LE; p < 0.05).
Agronomy 10 00606 g004
Figure 5. N balance for both climate and management scenarios. Because of the low values, leaching rates were excluded from the graph, but included in the calculation of the balance. Error bars represent standard deviation.
Agronomy 10 00606 g005
Table 1. Yield (t/ha) of the aboveground biomass for each harvest (±SE). Lower case letters depict statistical differences (p < 0.05) between climate treatments within one land use. Capital letters depict differences between management treatments within one sampling date and climate treatment (p < 0.05). HE: high elevation; LE: low elevation.
IntensiveExtensive
DateHELEHELE
23.05./08.06.172.2 ± 0.2 a3.8 ± 0.4 b3.7 ± 0.4 a3.7 ± 0.4 a
05.07.173.1 ± 0.4 a2.4 ± 0.2 b
07.08.171.8 ± 0.1 a1.9 ± 0 a2.8 ± 0.2 a3.0 ± 0.6 a
21.09.172.1 ± 0.1 a1.9 ± 0.3 a
08.11.170.6 ± 0.3 a1.5 ± 0.9 a0.9 ± 0.2 a1.6 ± 0.5 a
Sum9.8 ± 0.6 Aa11.6 ± 0.7 Ab7.5 ± 0.5 Ba8.3 ± 1.2 Ba
Table 2. Mean nitrogen (N) concentration (%) of the aboveground biomass for each harvest (±SE). Lower case letters depict statistical differences (p < 0.05) between climate treatments within one land use. Capital letters depict differences between management treatments within one sampling date and climate treatment (p < 0.05). HE: high elevation; LE: low elevation.
Intensive Extensive
HELEHELE
N concentration2.3 ± 0.3 Aa2.1 ± 0.1 Aa1.7 ± 0.1 Ba1.6 ± 0.1 Ba
Table 3. Plant harvest nitrogen (N) export (kg N ha-1) during the years 2012–2017 on the lysimeters investigated in this study (±SE). Lower case letters depict statistical differences (p < 0.05) between climate treatments within one land use. Capital letters depict differences between management treatments within one sampling date and climate treatment (p < 0.05). HE: high elevation; LE: low elevation.
IntensiveExtensive
YearHELEHELE
2012291 ± 44 Aa316 ± 46 Aa165 ± 31 Ba167 ± 37 Ba
2013365 ± 13 Aa416 ± 26 Aa210 ± 40 Ba244 ± 28 Ba
2014310 ± 10 Aa283 ± 14 Aa157 ± 22 Ba156 ± 16 Ba
2015189 ± 7 Aa219 ± 4 Ab169 ± 7 B130 ± n.a. B
2016n.a.n.a.n.a.n.a
2017213 ± 25 Aa230 ± 26 Aa128 ± 16 Ba127 ± 28 Ba
Table 4. Origin of plant nitrogen (N) from fertilizer and other N sources (mainly soil organic matter (SOM) mineralization). Error depicts standard deviation. Capital letters depict significant (p < 0.05) differences between management treatments and lower-case letters between climate treatments. HE: high elevation; LE: low elevation.
ManagementSiteN from Fertilizer (%)N from Other Sources (%)
IntensiveHE10.9 ± 0.8 Aa89.1
LE10.6 ± 0.6 Aa89.4
ExtensiveHE3.1 ± 0.3 Ba96.9
LE2.8 ± 0.3 Ba97.2

