Kharif Crops Selection for Sustainable Farming Practices in the Rajasthan-India Using Multiple Attribute-Based Decision-Making

 , , ,
, , ,
Abstract
1. Introduction
2. Materials and Methods
2.1. Study Area
2.2. The MADM Methods
2.2.1. Criteria Weighting
2.2.2. AHP Technique
2.2.3. Entropy Technique
2.2.4. Exprom2 Technique
2.2.5. VIKOR Technique
3. Results and Discussion
4. Conclusions
Supplementary Materials
Author Contributions
Funding
Acknowledgments
Conflicts of Interest
Nomenclature
| Abbreviations | |
| MADM | Multiple attribute-based decision-making model |
| GDP | Gross domestic product |
| MSP | Minimum sales price |
| TOPSIS | The Technique for Order of Preference by Similarity to Ideal Solution |
| VIKOR | VlseKriterijumska Optimizacija I Kompromisno Resenje |
| Exprom2 | The Extended PROMETHEE II |
| AHP | Analytic Hierarchy Process |
| CI | Consistency index |
| CR | Consistency ratio |
| RI | Random consistency index |
| Symbols | |
| k | Criteria |
| wk | Synthesis weight |
| k | Weight for kth criteria, computed from AHP method |
| Weight for kth criteria, computed from entropy method | |
| A | Matrix |
| a1, a2, …, an | Criterion |
| w | Eigenvector |
| n | Number of criteria (evaluation indexes) |
| m | Alternatives (evaluation objectives) |
| x11, x1n, xmn | Evaluation indexes |
| Pij | Normalized vector, a proportion of ith index under index j |
| Ej | Entropy of the jth criteria |
| dj | Degree of divergence |
| Weight of entropy of jth criteria | |
| Normalized value of xij | |
| Preference function | |
| Weak preference index | |
| wj | Weight of the jth criterion |
| Strict preference function | |
| dmj | Difference of ideal and anti-ideal value of jth criterion |
| Lj | Limit of the preference |
| Total preference index | |
| Positive flow for the ith alternative | |
| Negative flow for the ith alternative | |
| Total outranking flow | |
| Matrix formed by n criteria and m alternatives with the intersection of each alternative and criteria given by | |
| R | Normalized matrix |
| T | Resultant of matrix operation |
| tij | Matrix element corresponding to ith row and jth column |
| Original weight is given to the indicator | |
| Standard value of indicator | |
| Ab | Best alternative |
| Aw | Worst alternative |
| Positive impact (benefit criteria) | |
| Negative impact (cost criteria) | |
| Distance between target alternative and best condition | |
| Distance between target alternative and worst condition | |
| Similarity to the worst condition | |
| Ei, Fi, and Pi | Standard parameters of the VIKOR method |
| Weight of the strategy of the majority of the criteria (decision mechanism index) ranging between 0 and 1 |
References
- Garg, N.K.; Dadhich, S.M. Integrated non-linear model for optimal cropping pattern and irrigation scheduling under deficit irrigation. Agric. Water Manag. 2014, 140, 1–13. [Google Scholar] [CrossRef]
- Pramanik, M.K. Site suitability analysis for agricultural land use of Darjeeling district using AHP and GIS techniques. Model. Earth Syst. Environ. 2016, 2, 1–22. [Google Scholar] [CrossRef]
- Qureshi, M.R.N.; Singh, R.K.; Hasan, M.A. Decision support model to select crop pattern for sustainable agricultural practices using fuzzy MCDM. Environ. Dev. Sustain. 2017, 20, 641–659. [Google Scholar] [CrossRef]
- Dillon, E.J.; Hennessy, T.; Hynes, S. Towards Measurement of Farm Sustainability—An Irish case study. In Proceedings of the International Association of Agricultural Economists Conference, Beijing, China, 16–22 August 2009; pp. 1–21. [Google Scholar]
- Roy, R.; Chan, N.W. An assessment of agricultural sustainability indicators in Bangladesh: Review and synthesis. Environmentalist 2011, 32, 99–110. [Google Scholar] [CrossRef]
- Sorensen, A.A.; Van Beest, F.M.; Brook, R. Quantifying overlap in crop selection patterns among three sympatric ungulates in an agricultural landscape. Basic Appl. Ecol. 2015, 16, 601–609. [Google Scholar] [CrossRef]
- Chitsaz, N.; Banihabib, M.E. Comparison of Different Multi Criteria Decision-Making Models in Prioritizing Flood Management Alternatives. Water Resour. Manag. 2015, 29, 2503–2525. [Google Scholar] [CrossRef]
- Singh, R.K.; Mallick, J.; Hasan, M.A.; Mohamed, M.H. Simulation based ranking of vegetable cash crops for sustainable greenhouse farming practices. Appl. Ecol. Environ. Res. 2019, 17, 4615–4629. [Google Scholar] [CrossRef]
- Warrag, E.I.; Mallick, J.; Singh, R.K.; Khan, R.A. Status of dieback of Juniperus Procera (African Pencil Cedar) in natural stands and plantation in Alsouda highlands, Saudi Arabia. Appl. Ecol. Environ. Res. 2019, 17, 2325–2338. [Google Scholar] [CrossRef]
- Garg, R.K. Coding, evaluation and selection of thermal power plants—A MADM approach. Int. J. Electr. Power Energy Syst. 2007, 29, 657–668. [Google Scholar] [CrossRef]
- Rao, R.; Patel, B. A subjective and objective integrated multiple attribute decision making method for material selection. Mater. Des. 2010, 31, 4738–4747. [Google Scholar] [CrossRef]
- Bhangale, P.; Agrawal, V.; Saha, S.K. Attribute based specification, comparison and selection of a robot. Mech. Mach. Theory 2004, 39, 1345–1366. [Google Scholar] [CrossRef]
- Srinivas, R.; Singh, A.P. A Scenario Based Impact Assessment of Trace Metals on Ecosystem of River Ganges Using Multivariate Analysis Coupled with Fuzzy Decision-Making Approach. Water Resour. Manag. 2017, 31, 4165–4185. [Google Scholar] [CrossRef]
- Agarwal, R.; Garg, P.K. Remote Sensing and GIS Based Groundwater Potential & Recharge Zones Mapping Using Multi-Criteria Decision Making Technique. Water Resour. Manag. 2016, 30, 243–260. [Google Scholar] [CrossRef]
- Król, A.; Ksiȩzak, J.; Kubińska, E.; Rozakis, S. Evaluation of sustainability of maize cultivation in Poland. A prospect theory-PROMETHEE approach. Sustainability 2018, 10, 4263. [Google Scholar] [CrossRef]
- Mallick, J.; Singh, R.K.; AlAwadh, M.A.; Islam, S.; Khan, R.A.; Qureshi, M.N. GIS-based landslide susceptibility evaluation using fuzzy-AHP multi-criteria decision-making techniques in the Abha Watershed, Saudi Arabia. Environ. Earth Sci. 2018, 77, 276. [Google Scholar] [CrossRef]
- Ahmed, M.; Qureshi, M.N.; Mallick, J.; Hasan, M.; Hussain, M. Decision support model for design of high-performance concrete mixtures using two-phase AHP-TOPSIS approach. Adv. Civ. Eng. 2019. [Google Scholar] [CrossRef]
- Ahmed, M.; Qureshi, M.N.; Mallick, J.; Ben Kahla, N. Selection of sustainable supplementary concrete materials using OSM-AHP-TOPSIS approach. Adv. Mater. Sci. Eng. 2019, 1–12. [Google Scholar] [CrossRef]
- Naveed, Q.N.; Mohamed Qureshi, M.R.N.; Shaikh, A.; Alsayed, A.O.; Sanober, S.; Mohiuddin, K. Evaluating and Ranking Cloud-Based E-Learning Critical Success Factors (CSFs) Using Combinatorial Approach. IEEE Access 2019, 7, 157145–157157. [Google Scholar] [CrossRef]
- Singh, R.K.; Mallick, J. Fuzzy based multi-criteria method for sustainable green chamber farming practices. Indian J. Agric. Sci. 2019, 89, 1732–1736. Available online: https://www.researchgate.net/publication/336871114 (accessed on 10 March 2020).
- Agriculture and Farmer Welfare, Govt. of Rajasthan, India. 2015, pp. 1–8. Available online: http://mospi.nic.in/sites/default/files/cocsso/24cocsso_ag4_Rajasthan.pdf (accessed on 12 March 2020).
- NABARD Consultancy Services (NABCONS) Pvt. Ltd. Final Report-State Agriculture Plan (SAP) and State Agriculture Infrastructure Development Plan (SADIP) under RKVY-RAFTAAR 14th Financial Commission (2017–18 to 2019–20) Rajasthan State. 2019, pp. 1–206. Available online: http://www.rkvy.nic.in/static/SAP/RA/For%20this%20Period(2017-18%20to%202019-20)/Final%20Report-%20SAP%20and%20SADIP%20Rajasthan%20State.pdf (accessed on 22 January 2020).
- Chu, J.; Su, Y. The application of TOPSIS method in selecting fixed seismic shelter for evacuation in cities. Proc. Syst. Eng. 2012, 3, 391–397. [Google Scholar] [CrossRef]
- Saaty, T.L. Decision making with the analytic hierarchy process. Int. J. Serv. Sci. 2008, 1, 83–98. [Google Scholar] [CrossRef]
- Hamidi, N.; Pezeshki, P.M. Weighting the Criteria of Brand Selecting in Beverage Industries in Iran. Asian J. Manag. Res. 2015, 250–267. Available online: https://www.researchgate.net/publication/274701504 (accessed on 24 January 2020).
- Chatterjee, P.; Chakraborty, S. Material selection using preferential ranking methods. Mater. Des. 2012, 35, 384–393. [Google Scholar] [CrossRef]
- Gowda, M.J.C.; Jayaramaiah, K.M. Comparative Evaluation of Rice Production Systems for Their Sustainability. Agric. Ecosyst. Environ. 1998, 69, 1–9. [Google Scholar] [CrossRef]
- Rao, R.V. Decision Making in the Manufacturing Environment: Using Graph Theory and Fuzzy Multiple Attribute Decision Making Methods; Springer: London, UK, 2013; Available online: https://www.springer.com/gp/book/9781447143741 (accessed on 31 January 2020).


| Crop Code | Types of Crops (Popular Local Names) | Area of Crop Field (ACF) [Ha] | Production of Crop Field (PCF) [kg/Ha] | Production Cost (PC) [USD/Ha] | Sale Price (PS) [USD per kg] |
|---|---|---|---|---|---|
| A1 | Sorghum (Joar) | 516,043 | 583 | 130 | 0.5 |
| A2 | Pennisetum glaucum (Bajra) | 4,236,288 | 886 | 123 | 0.4 |
| A3 | Zea mays (Maize) | 855,895 | 2033 | 206 | 0.2 |
| A4 | Vigna mungo (Black Gram/urad) | 839,289 | 624 | 92 | 0.6 |
| A5 | Vigna radiate (Green Gram/moong) | 2,249,619 | 432 | 90 | 0.5 |
| ACF | PCF | PC | SP | |
|---|---|---|---|---|
| ACF | 1 | 2 | 4 | 8 |
| PCF | 0.5 | 1 | 0.5 | 0.25 |
| PC | 0.25 | 2 | 1 | 2 |
| SP | 0.125 | 4 | 0.5 | 1 |
| Criteria Weighing | Parameters | ACF | PCF | PC | SP |
|---|---|---|---|---|---|
| Alpha (AHP) | 0.533333 | 0.120833 | 0.175 | 0.170833 | |
| Beta(entropy) | 0.510491 | 0.305634 | 0.088677 | 0.095198 | |
| wj | Weight age | 0.798482 | 0.10831 | 0.045512 | 0.047696 |
| Kharif Crop Code | ACF [Ha] | PCF [kg/Ha] | PC [USD/Ha] | SP [USD per kg] |
|---|---|---|---|---|
| A1 | 0.000 | 0.094 | 0.655 | 0.75 |
| A2 | 1.000 | 0.284 | 0.716 | 0.5 |
| A3 | 0.091 | 1.000 | 0.000 | 0 |
| A4 | 0.087 | 0.120 | 0.983 | 1 |
| A5 | 0.466 | 0.000 | 1.000 | 0.75 |
| Crop Code | φ+(i) | φ−(i) | Φ(i) | Ranking |
|---|---|---|---|---|
| A1 | 0.021932 | 0.369881 | −0.34794857 | 5 |
| A2 | 0.701906 | 0.037601 | 0.66430513 | 1 |
| A3 | 0.113957 | 0.330097 | −0.21614008 | 3 |
| A4 | 0.063083 | 0.2873 | −0.22421643 | 4 |
| A5 | 0.274138 | 0.150138 | 0.12399995 | 2 |
| Crop Code | ACF | PCF | PC | SP |
|---|---|---|---|---|
| A1 | 0.083 | 0.026 | 0.020 | 0.023 |
| A2 | 0.680 | 0.040 | 0.019 | 0.019 |
| A3 | 0.137 | 0.091 | 0.031 | 0.009 |
| A4 | 0.135 | 0.028 | 0.014 | 0.028 |
| A5 | 0.361 | 0.019 | 0.014 | 0.023 |
| ACF [Ha] | PCF [kg/Ha] | PC [USD/Ha] | SP [USD per kg] | |
|---|---|---|---|---|
| VJ+ | 0.680 | 0.091 | 0.014 | 0.028 |
| VJ− | 0.083 | 0.019 | 0.031 | 0.009 |
| Crop Code | Sum | Ci | Rank | ||
|---|---|---|---|---|---|
| A1 | 0.601158817 | 0.019246655 | 0.620405471 | 0.031022703 | 5 |
| A2 | 0.052498111 | 0.598133271 | 0.650631382 | 0.919312052 | 1 |
| A3 | 0.54359107 | 0.090189834 | 0.633780905 | 0.142304436 | 3 |
| A4 | 0.549306539 | 0.058388685 | 0.607695224 | 0.096082185 | 4 |
| A5 | 0.327127691 | 0.279359852 | 0.606487542 | 0.460619275 | 2 |
| Crop Code | Ei | Fi | Pi | Rank |
|---|---|---|---|---|
| A1 | 0.924194 | 0.798482 | 1 | 5 |
| A2 | 0.114391 | 0.077596 | 0 | 1 |
| A3 | 0.818747 | 0.725539 | 0.884301 | 3 |
| A4 | 0.825209 | 0.729103 | 0.890762 | 4 |
| A5 | 0.546635 | 0.426402 | 0.508811 | 2 |
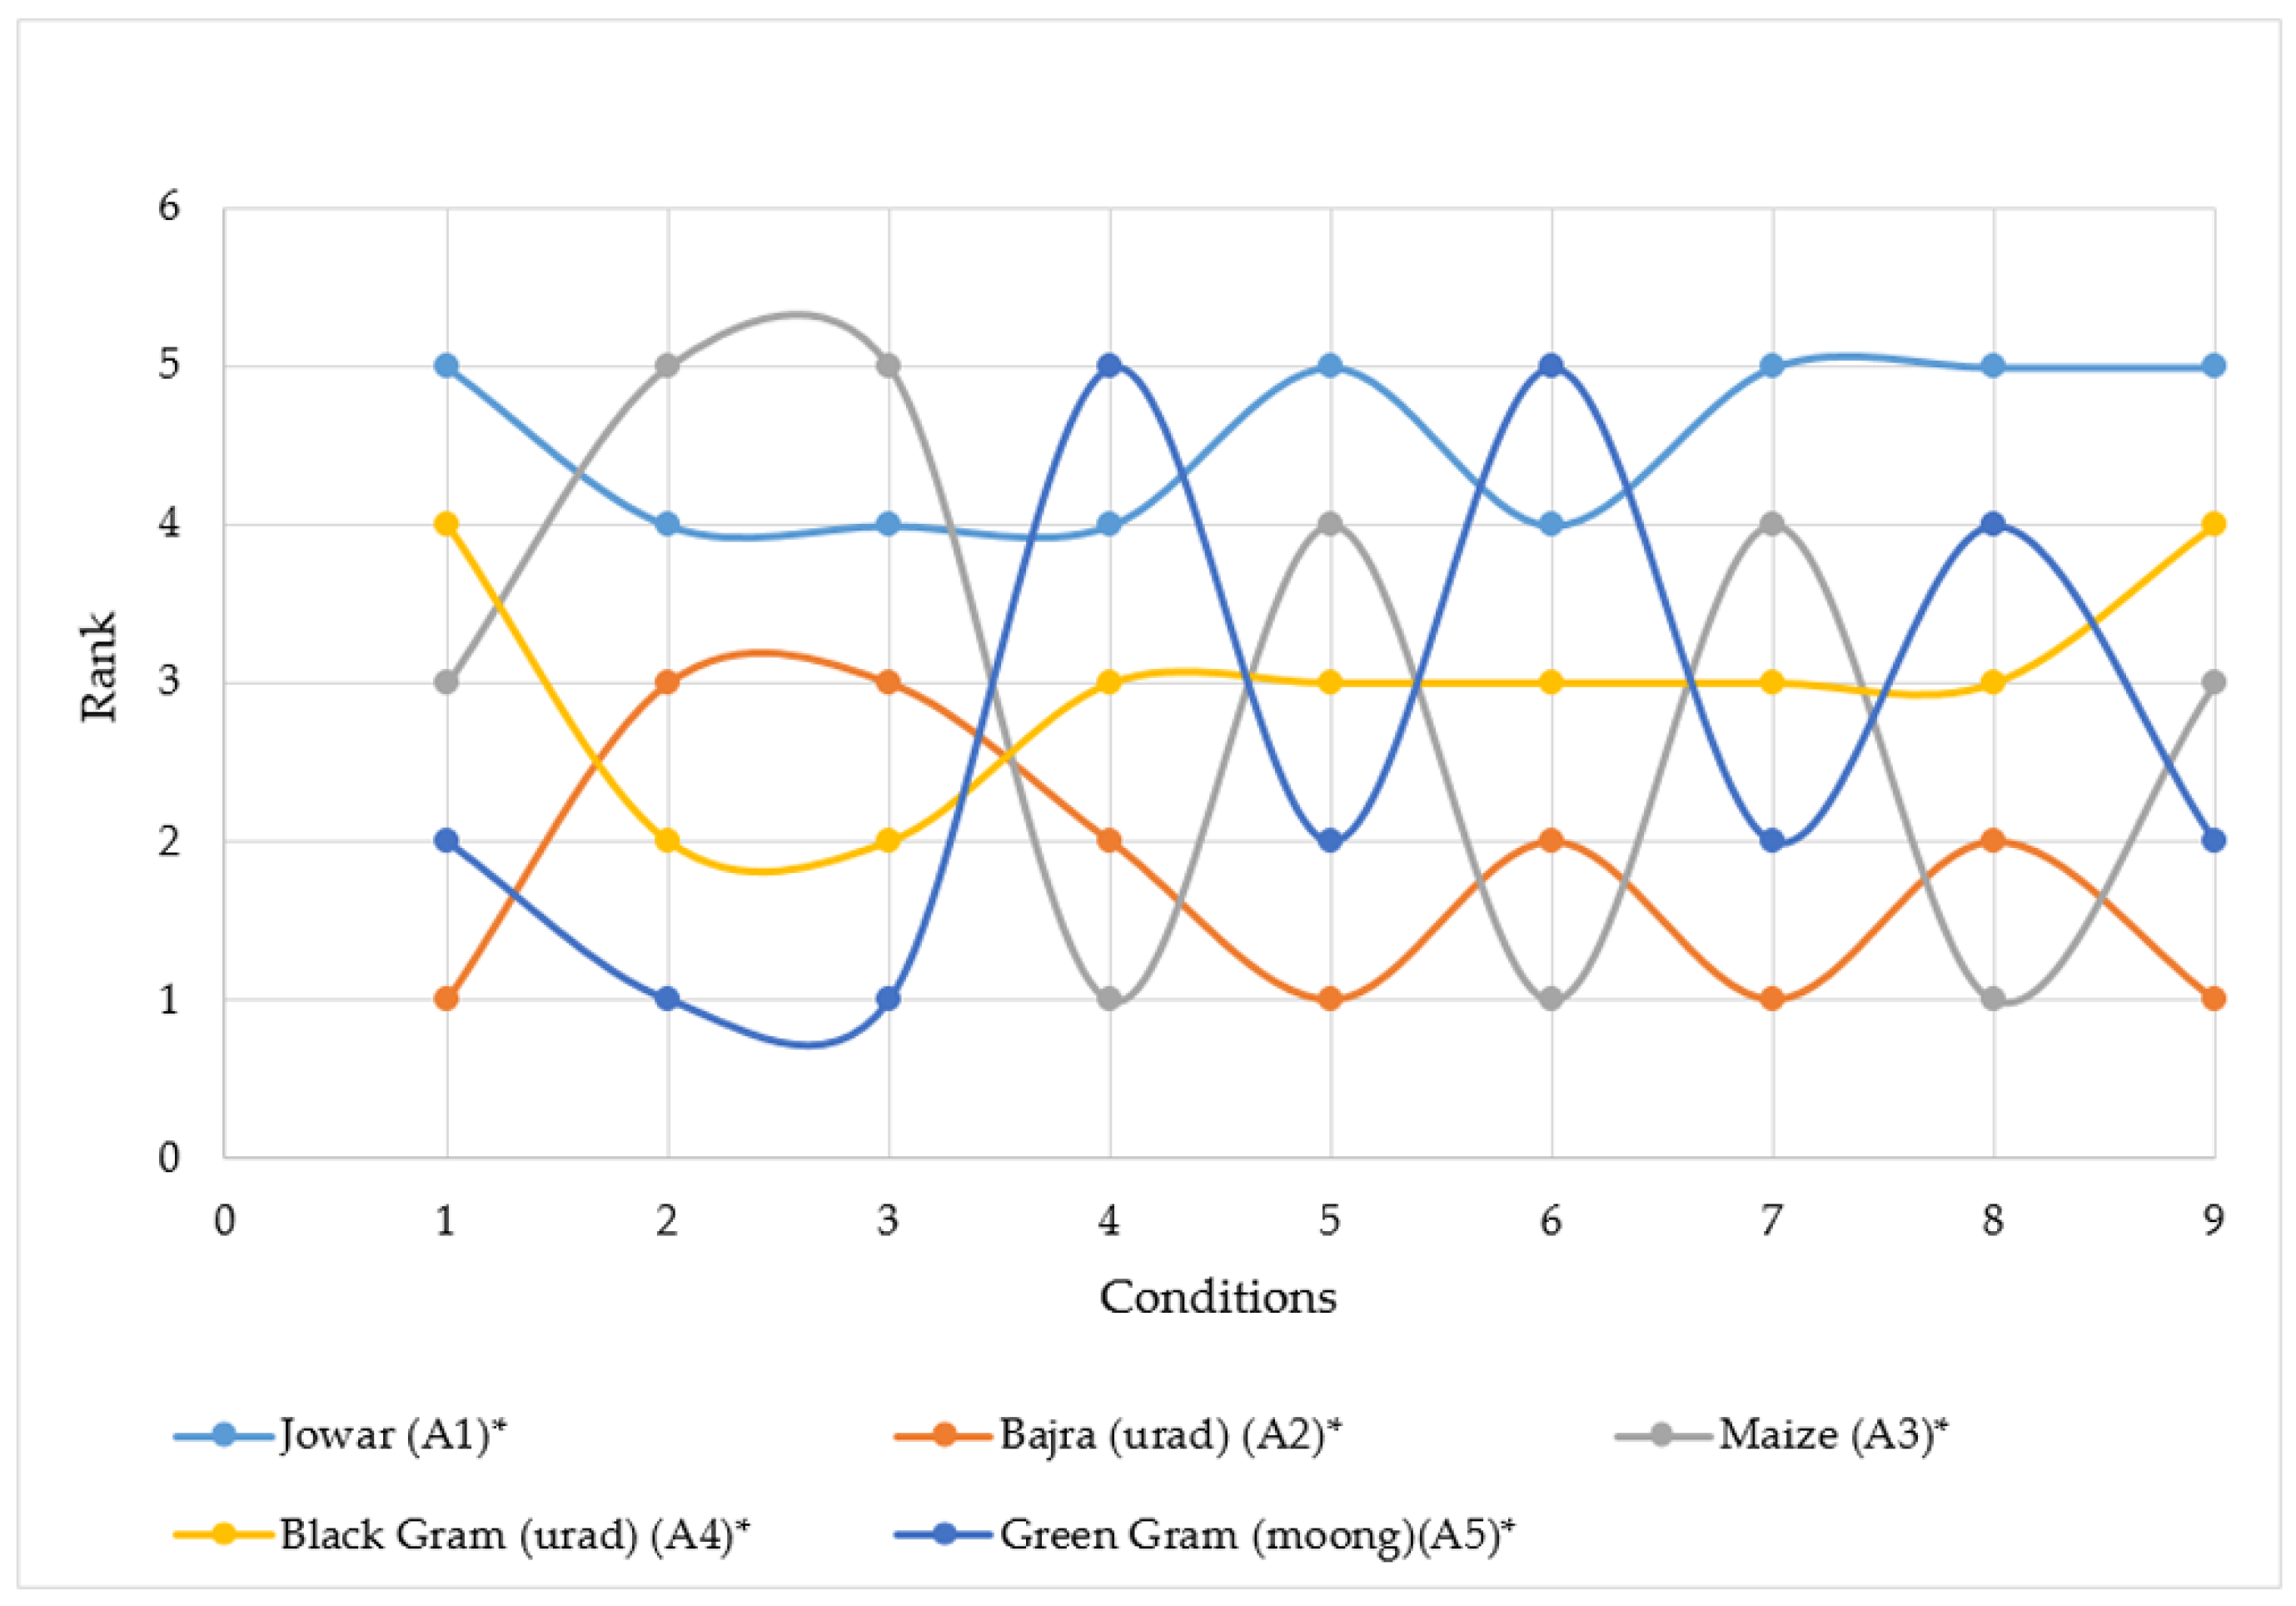
| Condition | Criterion Weight | |||
|---|---|---|---|---|
| 1 | w1 | w2 | w3 | w4 |
| 2 | w2 | w3 | w1 | w4 |
| 3 | w3 | w2 | w1 | w4 |
| 4 | w4 | w1 | w2 | w3 |
| 5 | w1 | w3 | w2 | w4 |
| 6 | w2 | w1 | w3 | w4 |
| 7 | w1 | w4 | w3 | w2 |
| 8 | w4 | w2 | w3 | w1 |
| 9 | w1 | w2 | w4 | w3 |
© 2020 by the authors. Licensee MDPI, Basel, Switzerland. This article is an open access article distributed under the terms and conditions of the Creative Commons Attribution (CC BY) license (http://creativecommons.org/licenses/by/4.0/).
Share and Cite
Tirth, V.; Singh, R.K.; Islam, S.; Badruddin, I.A.; Abdullah, R.A.B.; Algahtani, A.; Mahmoud, E.R.I.; Arabi, A.; Shukla, N.K.; Gupta, P. Kharif Crops Selection for Sustainable Farming Practices in the Rajasthan-India Using Multiple Attribute-Based Decision-Making. Agronomy 2020, 10, 536. https://doi.org/10.3390/agronomy10040536
Tirth V, Singh RK, Islam S, Badruddin IA, Abdullah RAB, Algahtani A, Mahmoud ERI, Arabi A, Shukla NK, Gupta P. Kharif Crops Selection for Sustainable Farming Practices in the Rajasthan-India Using Multiple Attribute-Based Decision-Making. Agronomy. 2020; 10(4):536. https://doi.org/10.3390/agronomy10040536
Chicago/Turabian StyleTirth, Vineet, Ram Karan Singh, Saiful Islam, Irfan Anjum Badruddin, Rini Asnida Binti Abdullah, Ali Algahtani, Essam R.I. Mahmoud, Amir Arabi, Neeraj Kumar Shukla, and Parul Gupta. 2020. "Kharif Crops Selection for Sustainable Farming Practices in the Rajasthan-India Using Multiple Attribute-Based Decision-Making" Agronomy 10, no. 4: 536. https://doi.org/10.3390/agronomy10040536
APA StyleTirth, V., Singh, R. K., Islam, S., Badruddin, I. A., Abdullah, R. A. B., Algahtani, A., Mahmoud, E. R. I., Arabi, A., Shukla, N. K., & Gupta, P. (2020). Kharif Crops Selection for Sustainable Farming Practices in the Rajasthan-India Using Multiple Attribute-Based Decision-Making. Agronomy, 10(4), 536. https://doi.org/10.3390/agronomy10040536