Article

Similar but Not Identical Resuscitation Trajectories of the Soil Microbial Community Based on Either DNA or RNA after Flooding

1
Key Laboratory of Urban Environment and Health, Institute of Urban Environment, Chinese Academy of Sciences, Xiamen 361021, China
2
Zhejiang Key Laboratory of Urban Environmental Processes and Pollution Control, Ningbo Urban Environment Observation and Research Station-NUEORS, Chinese Academy of Sciences, Ningbo 315800, China
3
University of Chinese Academy of Sciences, Beijing 100049, China
4
The James Hutton Research Institute, Craigiebuckler, Aberdeen AB15 8QH, UK
5
Research Center for Environmental Ecology and Engineering, School of Environmental Ecology and Biological Engineering, Wuhan Institute of Technology, Wuhan 430073, China
*
Author to whom correspondence should be addressed.
Agronomy 2020, 10(4), 502; https://doi.org/10.3390/agronomy10040502
Submission received: 2 March 2020 / Revised: 10 March 2020 / Accepted: 25 March 2020 / Published: 2 April 2020
(This article belongs to the Section Water Use and Irrigation)

Abstract

:
Both drought and flooding are unfavorable for soil microorganisms, but nevertheless, are highly relevant to the extreme weather events that have been predicted to increase in the future. The switch of soil water status from drought to flooding can happen rapidly and microbial activity might be either stimulated or further inhibited, but we have insufficient understanding of the underlying microbial processes. Here, we tracked the changes in soil bacterial and fungal abundance and their community structures, assaying the total (DNA-based) and potentially active (RNA-based) communities in response to abrupt flooding of dry soil. Also, rates of soil respiration and enzyme activity were measured after flooding. Results showed that the bacterial community was found to be more responsive than the fungal community to flooding. The bacterial community responses were clearly classified into three distinct patterns in which the intermediate pattern displayed highly phylogenetic clustering. A transient flourish of Bacilli which belongs to Firmicutes was detected at 8–48 h of flooding, suggesting its potential importance in the microbial assemblage and subsequent ecosystem functioning. Finally, the accumulative amount of CO2 released was more closely related than enzyme activity to the change in structure of the bacterial community after flooding. In conclusion, these findings extended our understanding of the underlying soil microbial processes following abrupt water condition changes.

Graphical Abstract

1. Introduction

Soil microorganisms play pivotal roles in regulating critical ecosystem processes. For example, the microbial-mediated processes such as nutrient cycling and the flux of trace gases make a tremendous contribution to terrestrial feedbacks in climate change [1]. Equally, environmental factors such as temperature, moisture and nutrient supply make a great influence on soil microbial activity, abundance and community composition [2], thereby impacting soil ecosystem functions. Next to temperature, moisture content is recognized as the most primary determinant regulating microbial heterotrophic respiration, which drives soil functioning and realizes ecosystem services [3]. As long as 60 years ago, rewetting dry soil was noted to result in a pulse of respiration, the so-called ‘Birch effect’, accompanied by soil carbon loss [4] and faster turnover of other nutrient elements [5]. Behind the phenomenon of the ‘Birch effect’, although CO2 may be released from soil pore space, the rapid reactivation of soil heterotrophs, and further microbial metabolism of soil organic carbon that becomes available, makes a primary contribution to the CO2 pulse after rewetting [6]. Drought can decrease microbial activity owing to a combination of direct desiccation stress on microbes and the reduced diffusion of substrates through soil [1,7], until rewetting removes these limitations and fuels microbial re-metabolism. Conversely, flooding, which can be considered as an extreme of rewetting, can restrain soil microbial process rates via negatively affecting soil physical and chemical characteristics (e.g., porosity, structure, pH and gas transport) and impacting functional microbial communities [8]. Therefore, both drought and flooding can be stressful for soil microorganisms, thereby affecting soil process rates [9].
It is well known that soil microbes have different strategies to survive desiccation and rewetting [10], including the accumulation of osmolyte [7], production of exopolysaccharide [11], and entry into dormant states. Gram-positive bacterial lineages tend to be more drought resistant than Gram-negative lineages, due to their thicker cell walls for resisting water deficit [12], while many microbes such as some Firmicutes and some Actinobacteria produce smaller spores and cyst-like cells that are restructured from vegetative cells when facing such harsh conditions as extreme aridity [6,13]. Dormancy, as a microbial reversible state of reduced metabolic activity, is an important diversity-maintaining mechanism for soil microbial species and functions in dry soils [1] and when soil water conditions become favorable, it can be reversed and then reinvigorate ecosystem processes such as the nitrogen and carbon cycles. For example, nitrifying communities were stimulated to recover transcriptional activity in tandem after wetting of dry soils taken from Californian annual grasslands but with slightly different responses between archaeal and bacterial ammonia oxidizers [14]. Zhu et al. [15] resuscitated dormant anammox bacteria from dry terrestrial ecosystems (after a resting period of >10 ka) by simple addition of water without any other substrates, resulting in enhanced turnover of the anammox process. The microbial community has been reported to display a three-step resuscitation pattern, which well describes the characteristics of the CO2 pulses resulting from wet-up over time [6].
Bacterial response to drought and rewetting can be classified into three discrete ecological strategies: sensitive, tolerant, and opportunistic, due to increased injuries in viable cells, microbial physiological adaptation, and colonization of available niches upon rewetting, correspondingly [16,17]. Fungi are generally more tolerant than bacteria to drought owing to their ability to grow at lower water availabilities, and to having hyphae which may cross air-filled soil pores to access water and nutrients [18], whereas they are less prevalent under flooded conditions, due to their sensitivity to oxygen limitation [19]. As for bacteria, a similar fungal response to changed moisture conditions has been recently reported that they may be not only tolerant to drought but also may respond sensitively or opportunistically [17,20]. Therefore, the fungal community may also display a distinct and regular resuscitation upon water addition to dry soil.
The response of soil microbial communities to the drastic changes in soil water status that results from climate change, as well as its effect on ecosystem processes and functions, has been a topic of intense interest [12,16,18,21], particularly as more erratic alteration of precipitation patterns, including an increase in frequency and intensity of droughts, are predicted in the near decades [22]. Paddy soils may be regarded as a special case as they are subjected to regular drainage and flooding and may have a degree of adaptation to this challenge but are less exposed to severe drought. Little is known about how the paddy soil microbial community, including bacteria and fungi, responds to abrupt increase of water status from drought to flooding stress. It highlights the following questions as to (1) how the soil microbial activity changes and the community responds after a rapid increase of water potential in dry soil; (2) how the community changes following a decline in activity upon flooding and whether particular microorganisms play important roles in response to flooding; (3) whether the patterns of microbial resuscitation can describe the characteristics of microbial activity; and (4) which indicators of microbial activity, soil respiration or enzyme activity, are better able to predict the changes in community structure.
To address these questions, we investigated changes in soil bacterial and fungal activity and their dynamic community responses to flooding of a dry paddy soil. First, the dynamics of soil gas efflux (CO2, N2O and CH4) and enzyme activity (β-glucosidase, N-Acetyl-glucosaminidase, and acid phosphatase) were measured over time, since both soil respiration and enzyme activity are regarded as critical indicators of microbial activity and potential function. Second, at different time points we quantified the relative abundance of taxa and profiled the communities on the basis of both DNA and ribosomal RNA (both assessed using the bacterial 16S rRNA gene and the fungal rRNA ITS region), which serve as the present or total (DNA-based) and potentially active (rRNA-based) soil microbial communities, respectively [10]. Although there are some unavoidable limitations with rRNA-based analysis of microbial community such as high numbers of ribosomes in some dormant cells and rapid degradation during the extraction process [23], previous studies have reported that microbial community analysis based on rRNA extraction is a valid approach to identify the ‘potentially active’ fraction of microbes in environmental samples [18,24] as ribosomes are essential for protein synthesis in actively growing cells [6]. Here, we explore the dynamics of soil bacterial and fungal community assemblages within one week at a high temporal resolution when they emerge from stasis and resume metabolic activity after abrupt flooding of dry soil, using the Illumina high-throughput sequencing of rRNA amplification at both RNA- and DNA-levels. We hypothesized that (i) both soil bacterial and fungal communities could display a step change in relative abundance during the time series after abrupt flooding, and (ii) their response patterns of communities based on DNA and RNA could frame the characteristics of change in microbial activity indicated by soil respiration and enzyme activity resulting from abrupt flooding.

2. Materials and Methods

2.1. Soil Sampling and Experimental Setup

The bulk paddy soil samples were collected at a depth of 0–20 cm from a field near Ningbo city (121°22′3″ E, 29°47′24″ N), Zhejiang province of China, in September 2018, when the rice was at the ripening stage and thus the paddy field had been drained to about 60% moisture content. The site has a typical subtropical monsoon climate with a mean annual temperature of 16.4 °C and an annual precipitation of 1480 mm, which is mainly focused from May to September. The field was in regular production with a rice-wheat rotation system. We randomly selected three 5 × 5 m plots and randomly collected a total of 12 soil cores as sub-samples from each plot. Soil samples at a depth of 0−20 cm were collected using an 8-cm diameter auger. All soil cores from each plot were mixed and transported to the laboratory immediately. After removing plant residues and stones from the soil by hand, the soil samples were air-dried at room temperature to reach approximately 10% moisture content and passed through a 2-mm mesh sieve. The soil was stored at 4 °C until further study. Soil pH was 5.6, determined at a soil and water suspension ratio of 1:5 (w/v). Soil total organic carbon, nitrogen, and phosphorus content were 3.25%, 0.41%, and 0.07%, respectively, giving a carbon/nitrogen ratio of about 8.0.
The flooding experiment was performed in 100-mL jars. After preincubation at 25 °C for 3 days, soil samples (~40 g fresh soil per jar) were amended with 50 mL sterilized Milli-Q water to give a final aqueous layer of about 1.5 cm. These were incubated at 25 °C in the dark for 7 days. In total, 45 jars were allocated for destructive sampling at every time point (0.25, 0.5, 0.75, 1, 2, 4, 8, 12, 24, 48, 72, 96, 120, 144, and 168 h) with three replicates. At the respective time after water addition, each soil sample was divided into three sub-samples: ~5 g of soil was dispersed in sodium acetate buffer solution for immediate enzyme assays, ~5 g of soil was fully immersed in RNA protection solution in a 15-mL centrifuge tube and immediately transferred to a −80 °C refrigerator for RNA extraction, and the remaining soil was placed in a sterile bag, snap frozen in liquid nitrogen and thereafter stored at −80 °C for subsequent DNA extraction.

2.2. Soil Gas Efflux Rates

Rates of soil greenhouse gas production were determined independently on a similarly prepared parallel set of samples, except that we used 20 g fresh weight of soil in 120 mL serum bottles, in quadruplicate at 25 °C, 30 mL sterilized Milli-Q water was added via a syringe through a butyl rubber septum in the sealed lid. The bottles were put into a water bath at 25 °C and greenhouse gases in the headspace were auto-sampled by a robotic sampling system and sequentially analyzed by a modified gas chromatograph (Agilent 7890A, Agilent, Palo Alto, CA, USA) equipped with thermal conductivity detector (TCD), electron capture detector (ECD), and flame ionization detector (FID) for CO2, N2O, and CH4, respectively [25].

2.3. Soil Enzyme Assays

Soil enzyme activity was estimated through microplate-scale fluorometric assays using 4-methylumbelliferone (MUB)-linked model substrates [26,27]. The targeted soil enzymes were β-glucosidase, N-Acetyl-glucosaminidase, and acid phosphatase, which are relevant to the cycling of carbon, nitrogen, and phosphorus, following the methods described previously [26,28]. Briefly, about 1.5 g fresh soil was weighted into a black HDPE bottle and suspended in 125 mL of 50 mM sodium acetate buffer (pH = 5.6) as a soil slurry. Soil assays (100 μL soil slurry + 100 μL substrate solution), substrate controls (100 μL substrate solution + 100 μL buffer), reference standards (50 μL standard solution + 150 μL buffer), quench controls (100 μL soil slurry + 50 μL standard solution + 50 μL buffer) and soil controls (100 μL soil slurry + 100 μL buffer) were set up. Microplates were covered and incubated in the dark at 25 °C: 1h for acid phosphatase, 2h for β-glucosidase and N-Acetyl-glucosaminidase. Fluorescence intensity was measured using a microplate fluorometer (Infinite® 200, TECAN, Männedorf, CH) with 365-nm excitation and 450-nm emission filters [27]. Soil enzyme activity was expressed in units of nmol MUB g−1 dry soil h−1.

2.4. Nucleic Acid Extraction and Purification

Soil microbial DNA was extracted from 0.5 g (freeze-dried soil) using a FastDNATM SPIN kit for soil (MP Biomedicals, Santa Ana, CA, USA) following the manufacturer’s instructions. RNA was extracted from fresh soil that was preserved in RNA protection solution using a protocol adapted from Griffiths et al. [29] and Ding et al. [30]. In brief, 0.5 g fresh soil was transferred to a 2 mL Lysing Matrix E tube containing 1.0 g of glass beads (0.5 g 0.1-mm glass beads and 0.5 g 0.5-mm zirconia/silica beads), then 0.25 mL potassium phosphate buffer (240 mM, pH 8.0), 0.25 mL CTAB buffer (10% CTAB, 0.7 M NaCl) and 0.5 mL 25:24:1 phenol: chloroform: isoamyl alcohol were added in order, followed by shaking at a speed of 5.5 m s−1 for 40 s (FastPrep24, MP Biomedicals). After that, the aqueous phase containing nucleic acids was separated by centrifugation (16,000 g) for 5 min at 4 °C and extracted by mixing with an equal volume of 24:1 chloroform: isoamyl alcohol to remove phenol followed by repeated centrifugation (16,000 g) for 5 min at 4 °C. Total nucleic acids were subsequently precipitated from the extracted aqueous layer with 2 volumes of 30% (wt/vol) polyethelene glycol 6000 (Biofroxx, Germany) 1.6 M NaCl for 2 h at room temperature, followed by centrifugation (18,000 g) for 15 min at 4 °C. The pelleted nucleic acids were washed with ice cold 70% (vol/vol) ethanol and air dried in a sterile environment and then resuspended in 50-μL of RNase free water. Nucleic acids including DNA and RNA were now obtained and co-extracted genomic DNA was removed with RNase-free DNase (Fermentas, USA). The resulting RNA was further purified using a RNeasy® Mini Kit (QIAGEN GmbH, Hilden, Germany) according to the manufacturer’s instructions.
Additionally, prior to RNA extraction, all solutions and glassware were thoroughly treated with 0.1% diethyl pyrocarbonate solution at 37 °C overnight and all plasticware used was certified RNase-free. After measuring integrity by agarose gel electrophoresis, DNA and RNA quality and concentration were further determined using a NanoDrop2000 spectrophotometer (Scientific, NY, USA), then stored at −80 °C for further use.

2.5. Quantification of Bacterial and Fungal Abundance

The extracted and purified RNA was reverse-transcribed to single-stranded cDNA using a PrimeScript™ RT-PCR Kit (Takara, Dalian, China) to get the overall length of the microbial rRNA gene according to the manufacturer’s instructions. 2.5-μL of reverse-transcription mixture containing cDNA was performed by RT-PCR following the manufacturer’s guide to verify the eventual production. Using DNA and synthesized cDNA as templates, the abundance of genes and transcripts that encode bacterial 16S and fungal ITS ribosomal components were assessed by qPCR through a real-time PCR detection system (Light Cycle 480; Roche). The primers used were: 515F and 907R for bacterial 16S V4-V5 [31], ITS1F and ITS2R for fungal ITS [32]. Each sample was prepared with a total volume of 20 μL, containing 10 μL Absolute SYBER Fluorescein Mix (Thermo Scientific, Grand Island, NY, USA), 0.4 μL each of forward and reverse primer, 1 μL of 1:10 diluted DNA or cDNA template, and 8.2 μL double ddH2O with three replicates. The template-free control reactions contained 1 μL of ddH2O instead of DNA or cDNA [33].

2.6. High-Throughput Sequence Analyses

In order to estimate the microbial response to abrupt flooding in the total and potentially active communities, the bacterial 16S rRNA V4-V5 and fungal ITS region amplicons were sent to Majorbio Bio-pharm Technology Co.,Ltd (Shanghai, China) for sequencing on an Illumina MiSeq platform (300 × 2 paired end, Illumina, San Diego, CA, USA) at the levels of DNA and cDNA. For preparation of amplicons, we used unique 6-bp barcode sequences which were linked to each reverse primer to distinguish different samples. The amplification was performed in triplicate in a 50 µL reaction system containing 25 µL of 2 × GoTaq® Green Master Mix (Promega, Fitchburg, RWI, United States), 1 µL of 10 µM for each primer, 1 µL of DNA or cDNA template and 22 µL of sterilized ultraclean water. The PCR conditions for bacterial 16S rRNA V4-V5 were as follows: pre-denaturation for 5 min at the beginning, 30 cycles of denaturation at 95 °C for 30 s, annealing at 55 °C for 30 s, and extension at 72 °C for 45 s, with a final extension at 72 °C for 10 min. The same above thermal cycling conditions were selected for fungal ITS amplification, except for applying 40 cycles. The mixed triplicate amplicons were purified using AxyPrep DNA Gel Extraction Kit (Axygen, Hangzhou, China) and quantified with a NanoDropTM 2000 spectrophotometer (Thermo Scientific, Waltham, MA, USA). Eventually, purified products of three replicates were pooled equimolarly for sequencing. Sequences reads are archived in the NCBI Sequence Read Archive, accession PRJNA589669.
We analyzed the sequence data according to a previously described procedure [34] using the QIIME pipeline v. 1.9.0 [35]. Briefly, after eliminating low quality reads and dereplicating, sequences were denoised and chimeras were removed with the UNOISE3 algorithm using USEARCH to form “zero-radius OTUs” (ZOTUs). Singleton ZOTUs were removed using the default “-minsize” value of 8. Taxonomy was assigned based on representative sequences in databases of Greengenes 13.8 [36] and UNITE 12.11 [37] for bacteria and fungi, respectively, using the blast method. To avoid bias in sampling effort, a subset of sequences (a smaller number of sequences in bacterial or fungal samples) were randomly selected and used to calculate rarefaction curves and alpha diversity indices such as richness, evenness, and the Shannon index.

2.7. Statistical Analyses

Significant differences in soil enzyme activity, log-transformed genes, and their transcript numbers among soil samples from different time points were analyzed using analysis of variance (ANOVA) followed by Tukey’s honestly significant difference (HSD) test at α = 0.05 by IBM SPSS 20.0 (IBM Inc., Chicago, IL, USA). ANOVA by repeated measures was used to analyze significant differences in gas production rates. Pairwise weighted UniFrac distances and Bray-Curtis distances were calculated for the bacterial and fungal communities, respectively, which were used for principal coordinate analysis (PCoA) by the “vegan” package in R platform [38,39]. Analysis of similarity (ANOSIM) and similarity percentage (SIMPER) analysis was used to test the significant differences between community compositions and to elucidate the indicator of bacterial genera based on the overall UniFrac distances among microbial response patterns, respectively, using the “vegan” package [39]. Heatmaps displaying the dynamics of composition of the microbial community were generated using the “pheatmap” package [40], based on the log-normalized relative abundance of OTU from the bacterial and fungal groups. Net relatedness index (NRI) and nearest taxon index (NTI) were evaluated using the “picante” package [41] and phylogenetic trees constructed of all taxa detected in the total and potentially active communities, using a null model of random community phylogenetic relationships with 999 runs. The “ggplot2” package [42] was used for data visualization.
Changes in the structure of bacterial and fungal communities were measured by differences in the phylogenetic distance (Unifrac distance for bacteria and Bray-Curtis distance for fungi) between the initial (15-min) and each time point community. A linear regression model was used to assess the relationship between changes in community structure and both soil respiration and enzyme activity. The Shapiro–Wilk test was used to test the normality and a log(x + 1) transformation was used to improve normality and homoscedasticity.

3. Results

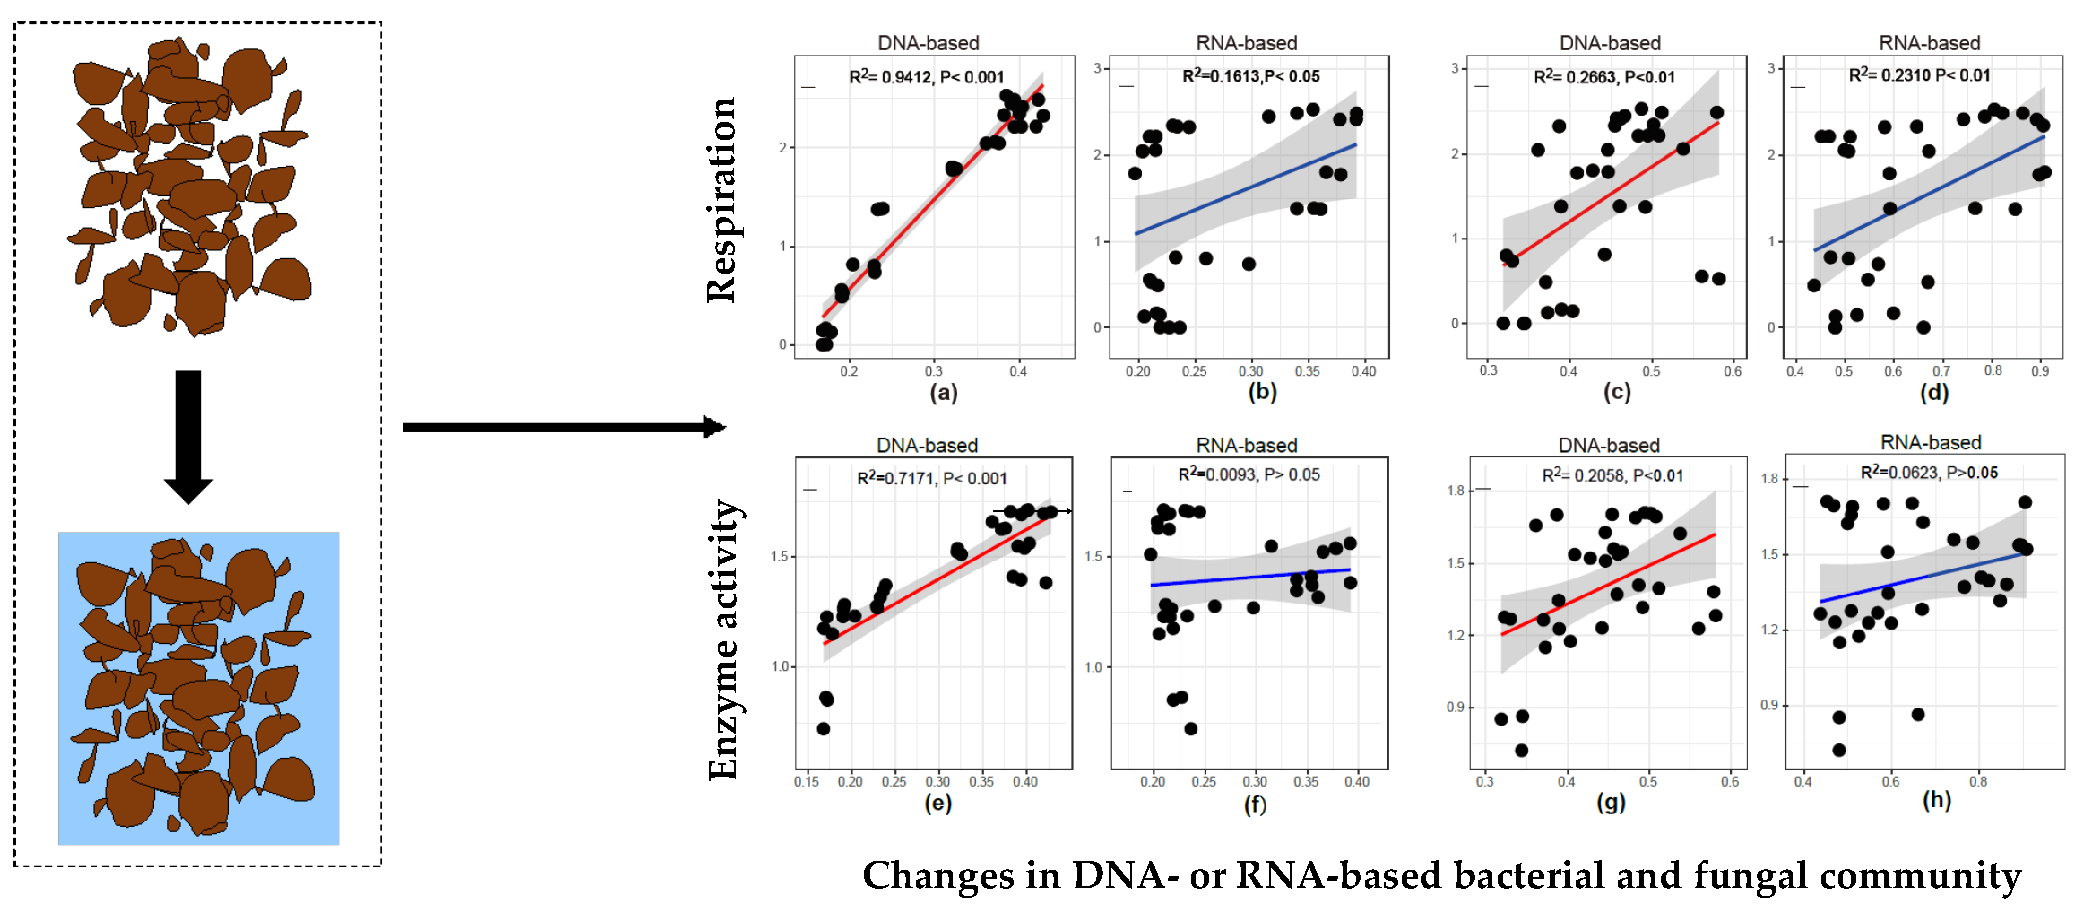
3.1. Variation in Soil Gases Efflux and Enzyme Activity

Rates of gaseous emission, including CO2, N2O and CH4, significantly increased with different patterns after flooding of the dry paddy soil (Figure 1). Initially, the accumulation of CO2 and N2O increased slowly following an approximate 2 h and 5 h lag period, respectively, while CH4 only increased after 12 h. The highest rates of CO2 and N2O production reached 59.8 mg C kg−1 dry soil d−1 around 96 h and 564 μg N kg−1 dry soil d−1 around 12 h, respectively. After the maximum peak, the emission rate of CO2 was found to decrease gradually while rates of N2O emission showed a dramatic decline following a rapid increase to peak production. Unlike CO2 and N2O, the rate of CH4 emission kept increasing during our experiment.
Soil enzyme activities, β-Glucosidase, N-Acetyl-glucosaminidase, and acid phosphatase, increased gradually at an early stage of flooding and reached a peak at 96 to 120 h, followed by a significant decline (p < 0.05) over time (Figure 2). All three enzymes were clearly active (p < 0.05) within 4 h of water addition, particularly for β-Glucosidase in which activity was enhanced immediately from about 0.17 to 4.72 nmol-MUB g−1 dry soil h−1 within 60 min after flooding. The maximum enzyme activities of β-Glucosidase, N-Acetyl-glucosaminidase, and acid phosphatase at the fourth day were between 6 to 142 times higher than that of the initial ones, from 0.17, 0.73, and 46.15 to 23.53, 21.40, and 258.61 nmol-MUB g−1 dry soil h−1, respectively. After that, a significant decline in enzyme activity was found over time (p < 0.05). For example, N-Acetyl-glucosaminidase activity dramatically declined to 14.55 nmol-MUB g−1 dry soil h−1 at day 6, and subsequently further decreased to 7.47 nmol g−1 dry soil h−1 at day 7.

3.2. General Information of Sequencing Data

For the bacterial sequence dataset, a total of 3,805,775 reads were assembled, and quality-checked reads per sample varied from 26,355 to 68,683. To avoid bias in sampling effort, a subset of 26,000 sequences from each sample was randomly selected, representing a total of 8863 clusters (ZOTUs). For the fungal sequence dataset, clean sequences ranging from 17,961 to 66,831 reads per sample remained after filtering the assembled total of 4,024,906 reads, and we further randomly extracted 17,900 sequences from each sample, representing a total of 2351 clusters (ZOTUs). As microbial DNA and RNA reflect different snapshots of the soil microbial community, here we try to contrast and profile the bacterial and fungal communities on the basis of DNA (the total communities) and the communities on the basis of RNA (the potentially active communities) after abrupt flooding over time.

3.3. Abundance and Community Structure of Bacteria and Fungi

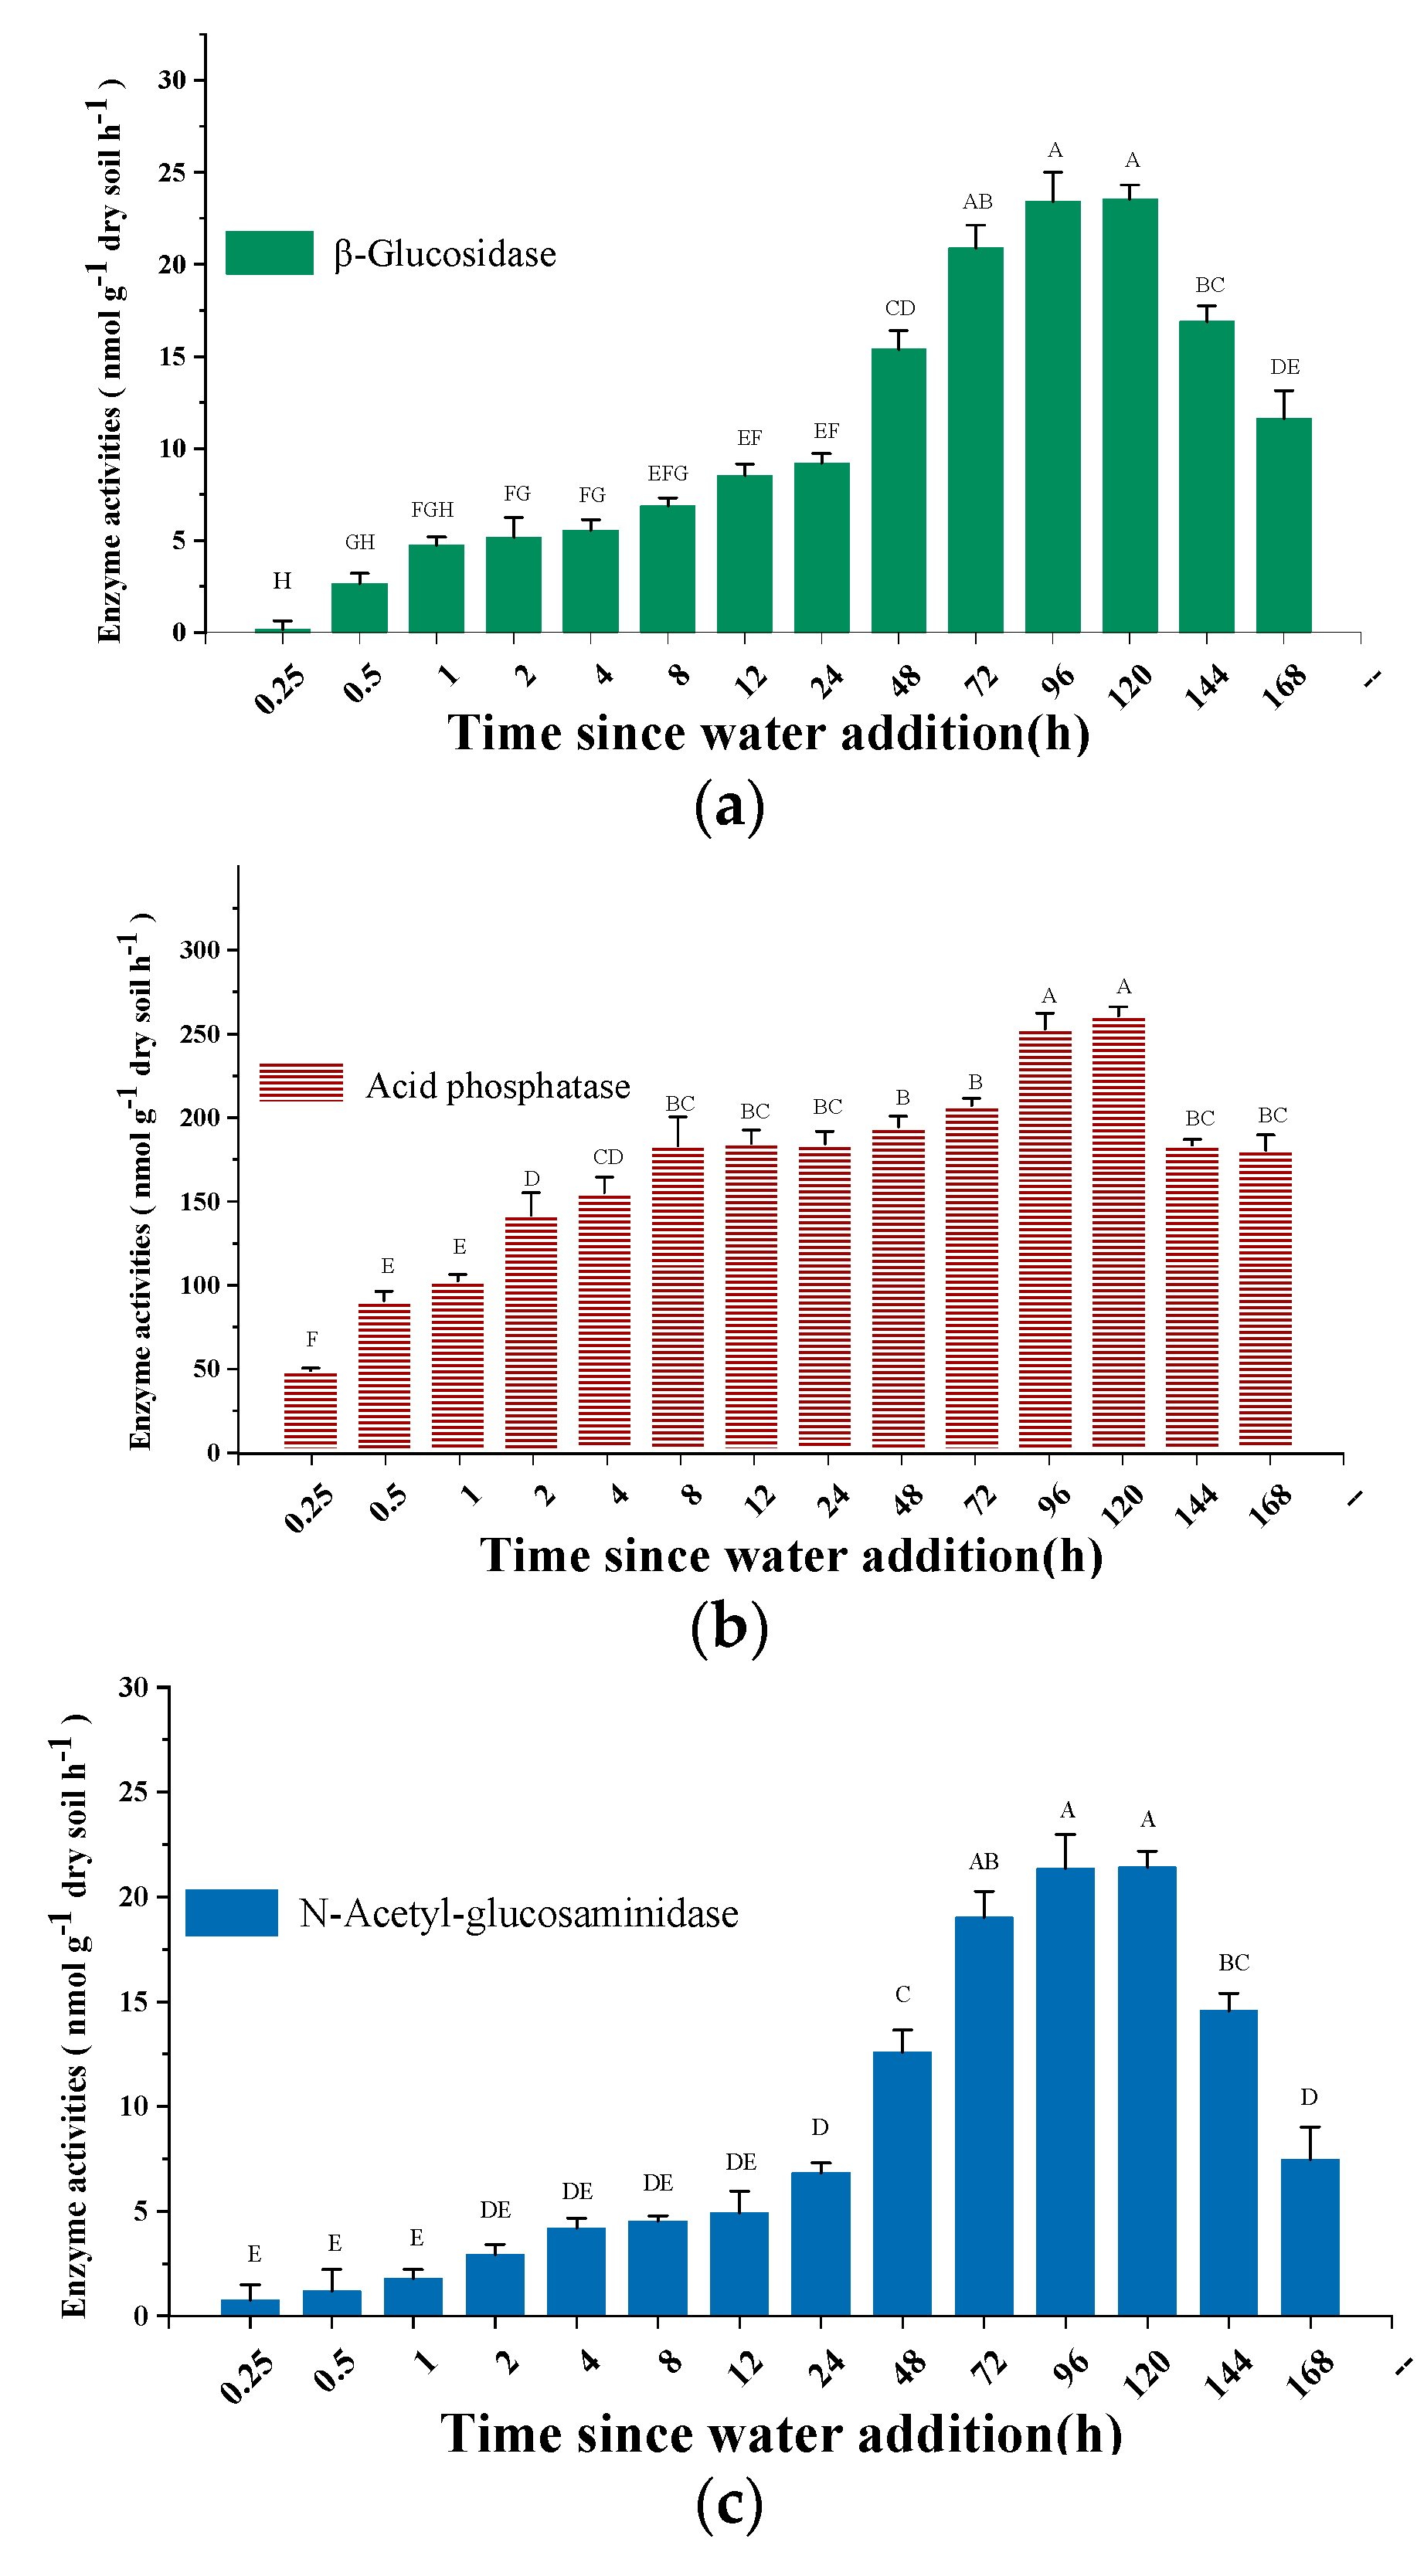
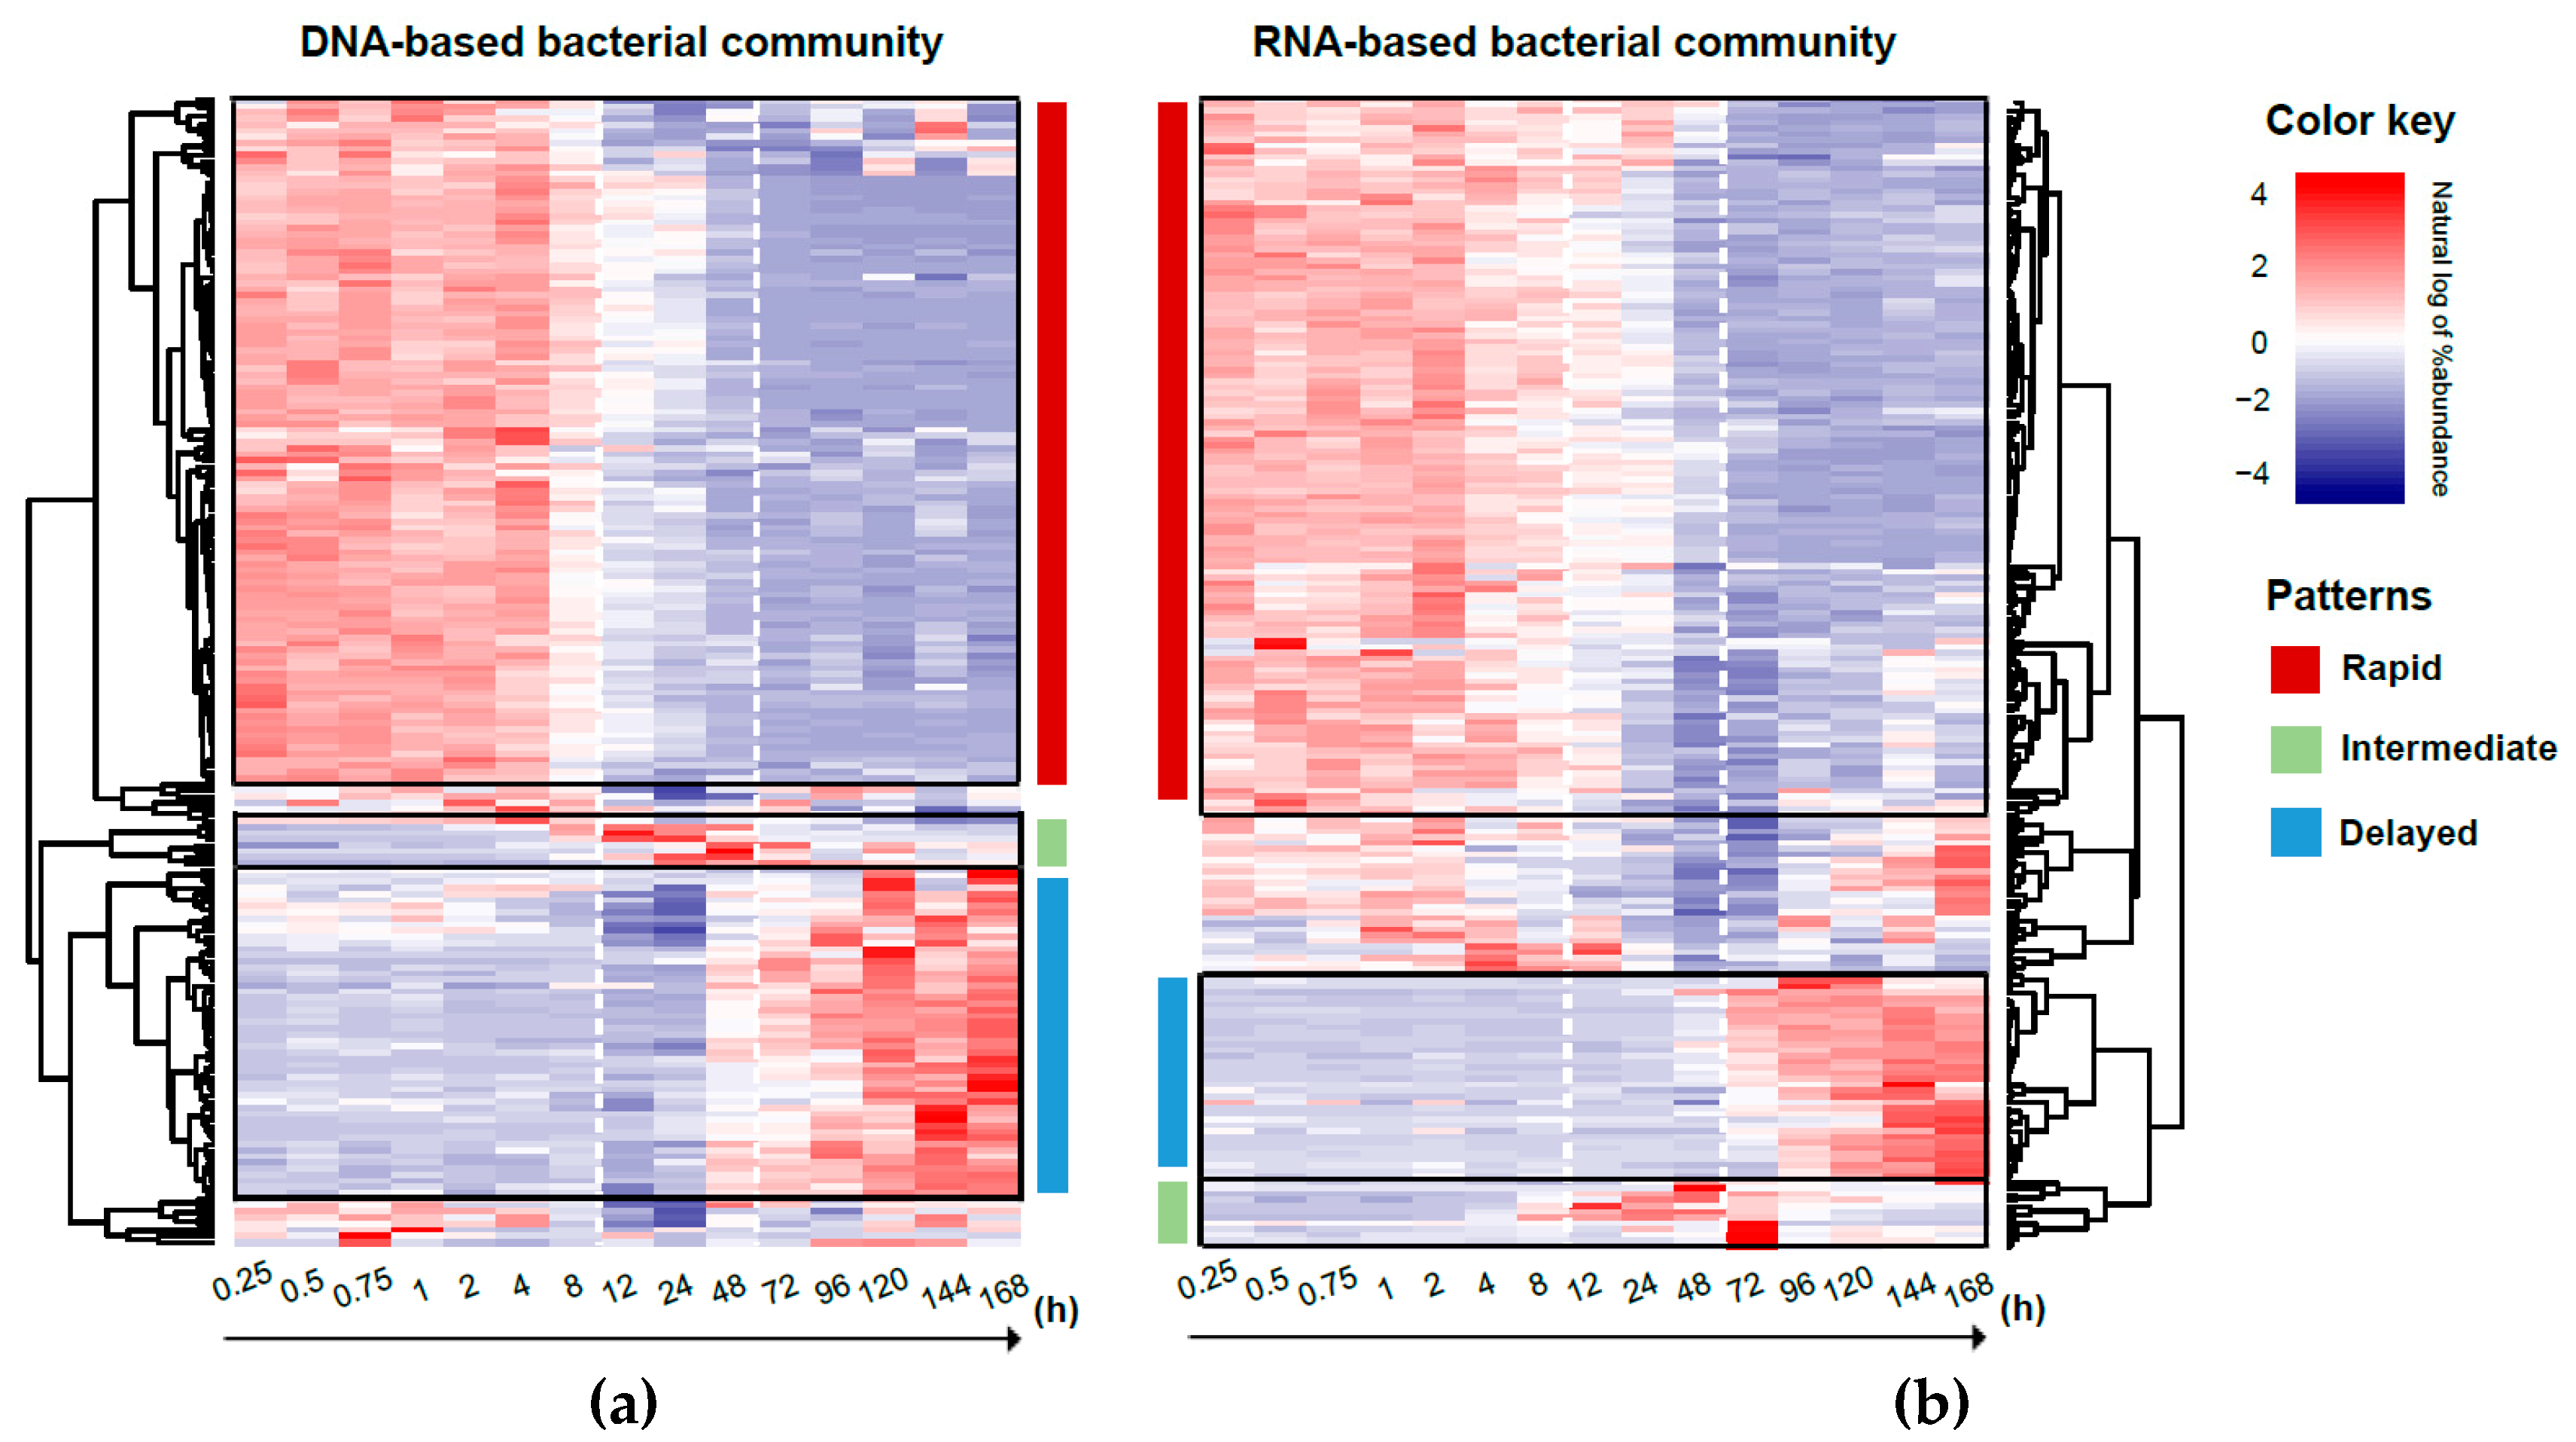
3.3.1. Bacterial Community

After flooding, changes in composition of both DNA- and RNA-based bacterial communities showed a similar trend (Figure 3a,b). The phyla Firmicutes, Proteobacteria, Actinobacteria, and Planctomycetes were dominant overall in relative abundance both in total (DNA-based) and potentially active (RNA-based) bacterial community profiles across all samples from different time points. The relative abundance of Firmicutes increased gradually over time and reached the highest value at 24 h and 72 h in the total and potentially active bacterial communities, respectively. Notably, Bacilli increased in relative abundance at 8h and dramatically declined at 48h, while Clostridia kept increasing until it remained unchanged. Both Planctomycetes and Chloroflexi displayed different responses in relative abundance, namely Planctomycetes increased while Chloroflexi decreased in the total community, while neither of them changed significantly in the potentially active community.
From principal coordinates analysis, we found that both DNA- and RNA-based bacterial community structures were detectably different over the time series on the first axis (PCoA1), which separated significantly into two regions (0–24 h and 48–168 h after flooding) showing a gradual effect of flooding time on the community composition (Figure 4a). The total and potentially active bacterial communities split significantly on PCoA2, indicating that variation in bacterial community structure over time may be more marked than differences caused by either DNA- or RNA-based community analysis. Moreover, we found a generally gradual decline in α-diversity indices such as richness (determined by observed ZOTUs) and Shannon indices (Table 1). In both the total and potentially active bacterial communities, richness and Shannon indices decreased significantly at 8 and 12 h after flooding, respectively, whereas bacterial evenness did not change significantly, except for a very temporary decrease in the RNA-based community.

3.3.2. Fungal Community

Both compositions of the total (DNA-based) and potentially active (RNA-based) fungal communities were dominated in relative abundance by the Ascomycota phylum, which primarily consisted of Dothideomycetes, Sordariomycetes, and Leotiomycetes at the class level (Figure 3c,d). Respectively, Leotiomycetes and Sordariomycetes increased and decreased significantly after flooding, especially in the potentially active community. In the total fungal community, the relative abundances of Mortierellomycota were found to increase and decrease gradually over time, while there were no significant changes in the potentially active community. We found more variation in RNA-based rather than in DNA-based fungal community structure over time and the total and potentially active fungal communities were significantly separated, in spite of some overlap (Figure 4 b). As with the bacterial community, α-diversity indices of the RNA-based fungal community were found to decrease gradually over time, though this was mainly not significant. All remained unchanged in the DNA-based fungal community (Table 1).

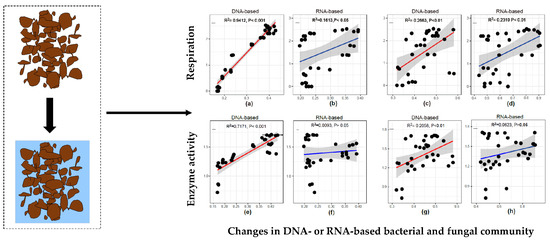
3.4. Relationship Between Microbial Activity and Community Structure

Statistically significant correlations were found between microbial activity, determined by soil microbial respiration or enzyme activity, and changes in community structure after flooding (Figure 5). The cumulative amount of CO2 released after flooding was positively and significantly correlated with the magnitude of flooding-time-related change in structure of not only the DNA-based but also the RNA-based microbial communities. Moreover, the change in structure of the DNA-based bacterial community showed a statistically stronger positive correlation with the cumulative amount of CO2 released than that of fungal community (Figure 5a,c), but the correlation was weaker and less significant with the RNA-based community (Figure 5b,d). Compared with accumulative CO2 emission after flooding, soil enzyme activity displayed a slightly weaker correlation with the flooding-time-related change of structure in the total bacterial and fungal communities (Figure 5e,g). However, there was no significant correlation between soil enzyme activity and changes in both bacterial and fungal RNA-based community structure (Figure 5f,h). These correlation analyses suggest that overall the bacterial community tends to be more responsible than the fungal community for the enhanced microbial activity following flooding.

3.5. Response Trajectory of the Microbial Community to Flooding

To evaluate the microbial response and change in community as a function of time, we filtered taxa to include those whose relative abundance was greater than 0.1% and 0.5% for the bacterial and fungal communities at the genera level, respectively. A heatmap was used to display the change in relative abundance of microbial taxa over time after flooding. This revealed that the bacterial taxa exhibited distinct response trajectories both in the total and potentially active communities (Figure 6), whereas the fungal taxa were divided into two groups in DNA-based fungal community overall (a) but not in RNA-based community (Figure 7). For bacterial community, a similar distribution pattern of the relative abundance of total and potentially active bacterial taxa was observed over the time series, which we classified into three primary response patterns. Some taxa such as Acidobacteria and Chloroflexi displayed their highest relative activity at the outset (between 0.25 h and 8 h after flooding), which we referred to as ‘rapid’ responders; taxa such as the Bacilli and Clostridia classes displayed an intermediately temporal response (between 8 h and 48 h), assigned as ‘intermediate’ responders; other taxa, including some Clostridia, that increased their relative abundance after 48 h after wet-up, were referred to as ‘delayed’ responders; and still others with no significant change in relative abundance over time were not assigned (Table S1). For DNA- and RNA-based fungal community, we found two fungal groups dominated overall at the early and later stages after flooding, respectively, with the same classes such as Leotiomycetes and Sordariomycetes but different genera. The fungal community appeared to shift from the first group into the second one at 24 after flooding.
Net relatedness index (NRI) and nearest taxon index (NTI) were used to evaluate whether the bacterial taxa in a particular response pattern are phylogenetically related to one another. The degree of phylogenetic relatedness in a community can indicate the processes that influence its assembly, like the extent a community is shaped by environmental filtering (life strategy is clustered by phylogeny) or competitive interactions (life strategy is phylogenetically evenly distributed) [43]. The results showed that the patterns of bacterial response to flooding were generally phylogenetically clustered in either the total or potentially active community. Taxa classified as rapid or intermediate in the total community showed high clustering, while those classified as delayed were over-dispersed. In the potentially active community, taxa with intermediate and delayed patterns exhibited clustering, while those from the rapid pattern were over-dispersed (Table S2, clustering when NRI > 0, NTI > 0; overdispersion when NRI < 0, NTI < 0).
The results of similarity percentage (SIMPER) analysis between the adjacent response patterns (Rapid-Intermediate and Intermediate-Delayed) revealed that the order Bacillales made the most contribution to the overall Unifrac dissimilarity among the distinct responses of bacterial community over time, contributing to 18.0% (Rapid-Intermediate) and 21.7% (Intermediate-Delayed), and 34.9% (Rapid-Intermediate) and 17.4% (Intermediate-Delayed) in DNA- and RNA-based communities, respectively (Figure S1). This indicates that Bacillales, which belongs to the Firmicutes phylum, probably played a potentially critical role in assembly of the soil bacterial community upon flooding. Overall, Firmicutes was the phyla that contributed the most to variation in bacterial community whether in the total or the potentially active community and gradually dominated in relative abundance after flooding, even though some taxa such as Bacilli only dominated in the intermediate pattern and faded away later. In contrast, some phyla, such as Proteobacteria, made a small contribution in spite of their high relative abundance in soils.

4. Discussion

4.1. Sources of CO2 and N2O

Our findings that flooding of dry soil resulted in a rapid CO2 and N2O pulse are consistent with results from numerous previous studies [18,44]. The sharp water potential increase that occurs with flooding may induce microbial cell lysis or the active efflux of intracellular solutes accumulated during drought [10]. This flush of microbial biomass carbon has been suggested to be a significant carbon source for microbial respiration, besides the rewetting-caused changes in soil physicochemical characteristics such as organic matter release from aggregate fracturing and the enhanced abilities of substrates to diffuse [45] are favorable for survivors to resume metabolic activity. The rate of CO2 production declined, probably due to the restraining of microbial activity by the suppression of the oxygen (O2) supply, resulting from the long-term flooding [46]. It is possible that non-biological sources of soil CO2 and N2O upon rewetting, such as gases displaced from soil pores and water-mediated chemical reactions, might have contributed to the amounts of CO2 and N2O released soon after flooding. However, non-biological sources of soil CO2 are expected to be marginal, not only due to the low carbonate content (soil pH 5.6) in our soil [47] but also the observed hours of lag without immediate production of CO2 after flooding. Moreover, a significantly strong correlation between changes in structure of the microbial community and the accumulative CO2 emission during flooding further indicates that CO2 comes from microbial metabolism. For N2O efflux, however, both abiotic and biotic processes may be responsible for soil N2O production during flooding [44], since we found an immediate N2O pulse at the early stage of rewetting and a dramatically declined production rate over time. Abiotic reactions together with biotic processes may trigger soil N2O pulses in the wake of rewetting by the reaction between hydroxylamine (NH2OH) with nitrite (NO2) [48]. The decreasing nitrogen-turnover enzyme N-Acetyl-glucosaminidase activity after the peak value further verified the possibility of biotic processes such as exhaustive denitrification in an anaerobic environment [49].

4.2. Differences Between DNA- and RNA-Based Microbial Communities

We observed a significant difference between DNA- and RNA-based community structures and they showed slightly different sensitivity to abrupt soil water recovery over the time series. A previous study suggested that the potentially active (RNA-based) microbial members are more sensitive and responsive than the total (DNA-based) microbial members to soil water recovery [10], as RNA is more responsive to changing environmental conditions [50]. However, our results did not show a more responsive characteristic of RNA such that no significant differences in both DNA- and RNA-based total quantity of bacterial 16s and fungal ITS abundance were found at the first 48 h after flooding. This was supported by the possibility that changes in relative abundance of microbial rRNA were likely caused by increases in the rRNA of some taxa and decreases among other taxa, ultimately reflecting a function of microbial regulation, starvation, death, and growth [6]. Therefore, no detectable change in bacterial total abundance or microbial biomass suggested that although some taxa died, others grew by using available carbon from the dead microbes, resulting in reallocation of resources between microbial response groups.
In addition, changes in structure of the DNA-based community was more responsible than that of the RNA-based community for microbial resuscitation in our flooding experiment, since a closer correlation between DNA-based community and microbial activity (respiration and enzyme activity) was detected. This indicates the limitations of the use of rRNA as an indicator of metabolic state in microbial assemblages and the necessity of prudent selection of evaluation methods for microbial community and activity in different soil ecosystems [23]. RNA, most of which is rRNA (82%–90%), may be produced rapidly in actively growing cells when conditions return to favorable conditions for microbial metabolism but can be quickly degraded as well [6,23]. A sharp increase of water potential caused by flooding of dry soil enhances molecular diffusion such as RNA-degrading enzymes and degradation-promoting factors, which could result in fast decomposition of RNA [23,51]. Therefore, changes in structure of the RNA-based community appeared to be more variable and unpredictable than that of the DNA-based community, which is more reliable and responsive to abrupt flooding events, though the richness and Shannon index of the RNA-based bacterial community respond significantly earlier after flooding. Additionally, the accumulative amount of CO2 released might be a better indicator of soil microbial activity than soil enzyme activity due its closer correlation with change in microbial community structure. Links to enzyme activity were weak but still significant for the DNA-based community.

4.3. Difference Between Bacterial and Fungal Community-level Response

The soil bacterial community was more sensitive than the fungal community to flooding at the early stage as expected, which is consistent with the generally higher resistance to dry periods of fungi compared with bacteria [18,52]. Although we did not detect significant differences in bacterial 16s rRNA and fungal ITS abundance at the first 48 h after flooding, an earlier decline of bacterial 16s rRNA abundance indicated the sequential responses of bacterial community to water change (Figure S2, bacteria at 48 h, fungi at 120 h after flooding in the potentially active community, respectively). After flooding of dry soil, neither the total nor the potentially active fungal communities showed distinct changes over time at the phylum or class level, displaying a marked resistance to abrupt changes in water availability. Therefore, we did not expect most fungi to develop or be resuscitated successively in relative abundance after flooding since it is known that fungi are tolerant to moisture fluctuation resulting from their morphological life form with thick cell walls and well-developed hyphae, making them less dependent than bacteria on water film continuity to access nutrients [52,53]. However, we found a slightly changing trend of fungal community over time in our flooding experiment, given that oxygen concentration was revealed to decrease from 140 µM at the floodwater–soil interface to 0 µM detectably at a depth of approximately 2 mm and below with 7-days incubation [54,55]. Thus, flooding definitely leads to anaerobiosis, which is unfavorable for most fungi in our flooding experiment (with a 15-mm aqueous layer in our study) [19], since most fungi are aerobic and anaerobic bacteria such as Clostridia groups gradually increased in relative abundance in the late period of flooding.
The contrasting responses and community succession of bacteria and fungi to abrupt flooding potentially supports the ecological distinction of fungi and bacteria, which indicates their occupation of different water- or oxygen-related niches [10,36,54,56]. This is consistent with the recent study that fungi and bacteria show global niche differentiation, which is associated with contrasting diversity responses to precipitation and soil pH [57]. Niche partitioning exists not only between bacterial and fungal groups but also among taxa within the bacterial group, which was revealed by the different bacterial sequential resuscitation strategies according to the changes in relative abundance of bacterial genera over time in our flooding experiment.

4.4. Potential Role of Bacilli in the Trajectory of the Bacterial Community

In the present study, we classified bacterial response strategies into three primary patterns: rapid, intermediate, and delayed, according to changes in the relative abundance of genera (>0.1%) over time. Taxa within these patterns may play distinct roles, physiologically, metabolically, and/or ecologically in the soil ecosystem [6], reflecting distinct niches that were related to water- or oxygen-involving promotion of carbon availability over the course of wet-up and accumulation of soil organic matter in the ongoing flooded condition. Firstly, taxa in the rapid pattern, which respond rapidly and survived the shock to flooding, were considered to resist low moisture and may also reflect a strategy of preparedness. They were surmised to have relatively more ribosomes before water addition than either intermediate or delayed responders and maintained their relative ribosomal abundance soon after wet-up [6]. For example, Actinobacteria, which are Gram-positive and have high-G+C content with tolerance to environmental stress, had a high abundance of ribosomes before and soon after wet-up to synthesize protein rapidly and produce extracellular enzymes capable of hydrolyzing complex polymers [6], so that they could survive in challenging drought and access substrate easily after wet-up without producing new ribosomes [6,58]. This is consistent with our results that Actinobacteria dominated in relative abundance at the early stage of flooding and were assigned to the rapid pattern when based on the potentially active (RNA-based) community. However, most Actinobacteria were found belonging to the delayed pattern in the total (DNA-based) community, which was possibly explained by a competitive disadvantage during the early hours of rewetting [10]. Secondly, intermediate responders, both in the total and the potentially active community, were generally Firmicutes, a phylum well known for their ability to produce a highly resistant endospores produced in stressful environment [59]. When transferred to favorable conditions such as rewetting from drought, spores could synthesize RNA quickly to recover and grow, then increase in relative abundance. Our results are consistent with those of Placella et al. [6] who found that the activity of Bacilli (belonging to the Firmicutes phylum) increased from 3 to 24 h, a timeframe that would have been sufficient for spore outgrowth after wet-up. Bacilli are known to produce hydrolytic enzymes that break up intermediate-sized polymers into monomers, which is important for their utilization by other microbes [60]. Therefore, timing of recovery may reflect microbial resource use and the intermediate responders may play crucial roles. Taxa that increased their relative abundance after 48 h flooding experiment were classified into the delayed patterns as delayed responders. They mainly consist of members of the Proteobacteria, Planctomycetes, Actinobacteria, and Firmicutes in the DNA-based community and Firmicutes in the RNA-based community. Although patterns that the identical phyla belong to were somewhat different, it is possible that RNA as a tracer of the potentially active state of microorganisms is more variable, caused by their fast decomposition in soil, while DNA is more stable and universally present in both active and inactive microorganisms [50]. Also, in our flooding experiment, some taxa may have responded earlier to flooding but without reproduction and then been displaced due to competition, revealing that slow growers can be rapid responders whereas fast growers may require more time to recover their metabolic function [6], potentially reflecting a tradeoff between microbial investments of source and energy [7].
The clear microbial responses to flooding over time were classified into three primary patterns based on changes in the relative abundance of taxa at the genera level following flooding. Changes in relative abundance potentially integrates soil microbial population growth, death, survival, and reproduction over a period of time [16]. Our results showed that Bacillales, the order within the class Bacilli, overwhelmingly dominated in relative abundance in the intermediate pattern (8–48 h) and were largely responsible for differences in microbial response to flooding, although the detected richness of the community that responded intermediately was less than that of results from the study of Placella et al. [6]. The lesser community richness in the intermediate pattern may depend on, not only the different soil with distinct properties and indigenous microorganisms, but also on the eventual water conditions, since abrupt flooding of dry soil in our experiment may delay and impede the growth of taxa which should have grown intermediately under favorable moisture conditions, such as some other species of Firmicutes [59]. This indicates the potential effects of Bacilli, the intermediate responder, on ultimate microbial ecology and soil ecosystem functioning due to their particular ecological function such as the production of hydrolytic enzymes breaking intermediate-sized polymers into monomers [6].
Further, we found significant phylogenetic clustering of taxa assigned to the intermediate pattern on basis of the total and potentially active bacterial community, while phylogenetic relatedness of taxa in the rapid and delayed patterns was not significantly different from the null model overall, suggesting the predominance of deterministic and stochastic processes in the intermediate pattern and the other two patterns, respectively [61]. Taxa in the intermediate pattern were primarily Firmicutes and highly conserved in the phylogenetic grouping, which was consistent with previous studies showing phylogenetic coherence of microbial ecological strategy by microorganisms in response to soil wet-up. A range of phylogenetic conservatism exists, not only in the community responding to moisture changes, but also for other particular ecological traits [62,63]. For example, Wang et al. (2017) suggested that the diazotrophic community tended to be phylogenetically clustered across the pH gradient in alpine meadow and that deterministic processes were dominant in diazotrophic community structuring [63]. Thus, microbial strategies for responding to abrupt flooding likely require coordinated functioning of multiple physiological traits and some taxa such as Bacillales may be crucial for microbial assembling processes.

5. Conclusions

Altogether, our results showed that changes in structure of the bacterial community after flooding parallel the changing characteristics of microbial activity that is more significantly indicated by the accumulative amount of CO2 released than by enzyme activity over time. The bacterial community tended to be more responsive than the fungal community to flooding and their responses are classified into three distinct patterns over the time series, in which taxa are generally phylogenetically clustered, particularly during the intermediate pattern dominated by the order Bacilli. A transient flourish of Bacilli in the trajectory of microbial community response to abrupt flooding plays a potentially important role in the microbial assemblage and ecosystem functions. Additionally, our work also suggests that deterministic and stochastic processes may drive water-mediated microbial community assembly and a stronger role of stochastic factors was potentially dominant in events of unpredictably acute perturbation such as abrupt flooding. Thus, our study is thought-provoking about microbial assembly processes facing an abrupt increase in soil water potential. Future work should further explore the responses of soil microbial functioning to abrupt flooding in relation to shifts in microbial composition to provide insights into the prediction of impacts on ecosystem functioning in the face of global change.

Supplementary Materials

The following are available online at https://www.mdpi.com/2073-4395/10/4/502/s1, Figure S1: Similarity Percentages (SIMPER) analysis showing the various bacterial genera that contribute to the significant differences between changes of microbial communities over time, based on DNA and RNA analysis, Figure S2: Variation in abundance of bacterial 16s rRNA genes (a) and fungal ITS region (b) based on DNA and RNA, Table S1: Bacterial taxa in different response patterns based on either DNA or RNA, Table S2: Phylogenetic structure indices of bacterial groups with different response patterns based on either DNA or RNA.

Author Contributions

Conceptualization, Y.Z., Y.L., N.Z., S.J.C., and H.Y.; methodology, Y.Z., Y.L., and H.Y.; formal analysis, Y.Z., N.Z., and H.Y.; data curation, Y.Z., S.J.C., and H.Y.; writing—original draft preparation, Y.Z.; writing—review and editing, Y.Z., Y.L., N.Z., S.J.C., and H.Y.; visualization, Y.Z., Y.L., S.J.C., and N.Z.; supervision, H.Y. All authors have read and agreed to the published version of the manuscript.

Funding

This work was supported by the NATIONAL NATURAL SCIENCE FOUNDATION OF CHINA, grant Number: 41761134085, 41525002, 41877051.

Acknowledgments

We would like to thank for Haoxin Fan, Anhui Ge, Xing Li, Yongxiang Yu, Jiantao Xue, Hongkai Liao, Juan Wang, Yingying Zhang, Xiangtian Meng, Bo Gao and Mao Tang for their suggestions and assistance in bioinformation analysis and lab analyses.

Conflicts of Interest

The authors declare no conflict of interest.

References

  1. Aanderud, Z.T.; Jones, S.E.; Fierer, N.; Lennon, J.T. Resuscitation of the rare boisphere contributes to pulses of ecosystem activity. Front. Microbiol. 2015, 6, 1–11. [Google Scholar] [CrossRef] [Green Version]
  2. Zhang, Y.; Zheng, N.; Wang, J.; Yao, H.; Qiu, Q.; Chapman, S.J. High turnover rate of free phospholipids in soil confirms the classic hypothesis of PLFA methodology. Soil Biol. Biochem. 2019, 135, 323–330. [Google Scholar] [CrossRef]
  3. Yan, Z.; Bond-Lamberty, B.; Todd-Brown, K.E.; Bailey, V.L.; Li, S.; Liu, C.; Liu, C. A moisture function of soil heterotrophic respiration that incorporates microscale processes. Nat. Commun. 2018, 9, 1–10. [Google Scholar] [CrossRef]
  4. Birch, H.F. The effect of soil drying on humus decomposition and nitrogen availability. Plant Soil 1958, 10, 9–31. [Google Scholar] [CrossRef]
  5. Kim, D.G.; Vargas, R.; Bond-Lamberty, B.; Turetsky, M.R. Effects of soil rewetting and thawing on soil gas fluxes: A review of current literature and suggestions for future research. Biogeosciences 2012, 9, 2459–2483. [Google Scholar] [CrossRef] [Green Version]
  6. Placella, S.A.; Brodie, E.L.; Firestone, M.K. Rainfall-induced carbon dioxide pulses result from sequential resuscitation of phylogenetically clustered microbial groups. Proc. Natl. Acad. Sci. USA 2012, 109, 10931–10936. [Google Scholar] [CrossRef] [Green Version]
  7. Schimel, J.; Balser, T.C.; Wallenstein, M. Microbial stress-response physiology and its implications for ecosystem function. Ecology 2007, 88, 1386–1394. [Google Scholar] [CrossRef]
  8. Yang, H.; Sheng, R.; Zhang, Z.; Wang, L.; Wang, Q.; Wei, W. Responses of nitrifying and denitrifying bacteria to flooding-drying cycles in flooded rice soil. Appl. Soil Ecol. 2016, 103, 101–109. [Google Scholar] [CrossRef] [Green Version]
  9. Unger, S.; Máguas, C.; Pereira, J.S.; David, T.S.; Werner, C. The influence of precipitation pulses on soil respiration—Assessing the “Birch effect” by stable carbon isotopes. Soil Biol. Biochem. 2010, 42, 1800–1810. [Google Scholar] [CrossRef]
  10. Barnard, R.L.; Osborne, C.A.; Firestone, M.K. Responses of soil bacterial and fungal communities to extreme desiccation and rewetting. ISME J. 2013, 7, 2229–2241. [Google Scholar] [CrossRef] [PubMed]
  11. More, T.T.; Yadav, J.S.S.; Yan, S.; Tyagi, R.D.; Surampalli, R.Y. Extracellular polymeric substances of bacteria and their potential environmental applications. J. Environ. Manag. 2014, 144, 1–25. [Google Scholar] [CrossRef] [PubMed]
  12. Preece, C.; Verbruggen, E.; Liu, L.; Weedon, J.T.; Peñuelas, J. Effects of past and current drought on the composition and diversity of soil microbial communities. Soil Biol. Biochem. 2019, 131, 28–39. [Google Scholar] [CrossRef]
  13. Kaprelyants, A.S.; Gottschal, J.C.; Kell, D.B. Dormancy in Non-Sporulating Bacteria. FEMS Microbiol. Lett. 1993, 104, 271–286. [Google Scholar] [CrossRef] [PubMed]
  14. Placella, S.A.; Firestone, M.K. Transcriptional Response of Nitrifying Communities to Wetting of Dry Soil. Appl. Environ. Microbiol. 2013, 79, 3294–3302. [Google Scholar] [CrossRef] [PubMed] [Green Version]
  15. Zhu, G.; Wang, S.; Wang, C.; Zhou, L.; Zhao, S.; Li, Y.; Li, F.; Jetten, M.S.M.; Lu, Y.; Schwark, L. Resuscitation of anammox bacteria after >10,000 years of dormancy. ISME J. 2019, 13, 1098–1109. [Google Scholar] [CrossRef]
  16. Evans, S.E.; Wallenstein, M.D. Climate change alters ecological strategies of soil bacteria. Ecol. Lett. 2014, 17, 155–164. [Google Scholar] [CrossRef]
  17. Meisner, A.; Jacquiod, S.; Snoek, B.L.; ten Hooven, F.C.; van der Putten, W.H. Drought Legacy Effects on the Composition of Soil Fungal and Prokaryote Communities. Front. Microbiol. 2018, 9. [Google Scholar] [CrossRef] [Green Version]
  18. Barnard, R.L.; Osborne, C.A.; Firestone, M.K. Changing precipitation pattern alters soil microbial community response to wet-up under a Mediterranean-type climate. ISME J. 2015, 9, 946–957. [Google Scholar] [CrossRef] [Green Version]
  19. Liao, H.; Chapman, S.J.; Li, Y.; Yao, H. Dynamics of microbial biomass and community composition after short-term water status change in Chinese paddy soils. Environ. Sci. Pollut. Res. 2018, 25, 2932–2941. [Google Scholar] [CrossRef]
  20. Kaisermann, A.; Maron, P.A.; Beaumelle, L.; Lata, J.C. Fungal communities are more sensitive indicators to non-extreme soil moisture variations than bacterial communities. Appl. Soil Ecol. 2015, 86, 158–164. [Google Scholar] [CrossRef]
  21. Engelhardt, I.C.; Blazewicz, S.J.; Barnard, R.L. Effects of contrasting precipitation patterns on the trajectory of actively growing and inactive microbial communities after rewetting. Soil Biol. Biochem. 2019. [Google Scholar] [CrossRef]
  22. IPCC. Climate Change 2013: The Physical Science Basis. Contribution of Working Group I to the Fifth Assessment Report of the Intergovernmental Panel on Climate Change; Cambridge University Press: Cambridge, UK, 2013. [Google Scholar]
  23. Blazewicz, S.J.; Barnard, R.L.; Daly, R.A.; Firestone, M.K. Evaluating rRNA as an indicator of microbial activity in environmental communities: Limitations and uses. ISME J. 2013, 7, 2061–2068. [Google Scholar] [CrossRef] [PubMed] [Green Version]
  24. Li, H.; Su, J.; Yang, X.; Zhu, Y. Distinct rhizosphere effect on active and total bacterial communities in paddy soils. Sci. Total Environ. 2019, 649, 422–430. [Google Scholar] [CrossRef] [PubMed]
  25. Yu, Y.; Zhao, C.; Zheng, N.; Jia, H.; Yao, H. Interactive effects of soil texture and salinity on nitrous oxide emissions following crop residue amendment. Geoderma 2019, 337, 1146–1154. [Google Scholar] [CrossRef]
  26. DeForest, J.L. The influence of time, storage temperature, and substrate age on potential soil enzyme activity in acidic forest soils using MUB-linked substrates and L-DOPA. Soil Biol. Biochem. 2009, 41, 1180–1186. [Google Scholar] [CrossRef]
  27. Giacometti, C.; Cavani, L.; Baldoni, G.; Ciavatta, C.; Marzadori, C.; Kandeler, E. Microplate-scale fluorometric soil enzyme assays as tools to assess soil quality in a long-term agricultural field experiment. Appl. Soil Ecol. 2014, 75, 80–85. [Google Scholar] [CrossRef]
  28. Jing, X.; Chen, X.; Xiao, W.; Lin, L.; Wang, C.; He, J.; Zhu, B. Soil enzymatic responses to multiple environmental drivers in the Tibetan grasslands: Insights from two manipulative field experiments and a meta-analysis. Pedobiologia 2018, 71, 50–58. [Google Scholar] [CrossRef]
  29. Griffiths, R.I.; Whiteley, A.S.; O’Donnell, A.G.; Bailey, M.J. Rapid method for coextraction of DNA and RNA from natural environments for analysis of ribosomal DNA- and rRNA-based microbial community composition. Appl. Environ. Microbiol. 2000, 66, 5488–5491. [Google Scholar] [CrossRef] [Green Version]
  30. Ding, L.; Su, J.; Li, H.; Zhu, Y.; Cao, Z. Bacterial succession along a long-term chronosequence of paddy soil in the Yangtze River Delta, China. Soil Biol. Biochem. 2017, 104, 59–67. [Google Scholar] [CrossRef]
  31. Long, X.; Yao, H.; Huang, Y.; Wei, W.; Zhu, Y. Phosphate levels influence the utilisation of rice rhizodeposition carbon and the phosphate-solubilising microbial community in a paddy soil. Soil Biol. Biochem. 2018, 118, 103–114. [Google Scholar] [CrossRef]
  32. Gardes, M.; Bruns, T.D. Its Primers with Enhanced Specificity for Basidiomycetes—Application to the Identification of Mycorrhizae and Rusts. Mol. Ecol. 1993, 2, 113–118. [Google Scholar] [CrossRef] [PubMed]
  33. Liao, H.; Li, Y.; Yao, H. Fertilization with inorganic and organic nutrients changes diazotroph community composition and N-fixation rates. J. Soils Sediments 2018, 18, 1076–1086. [Google Scholar] [CrossRef]
  34. Jia, Y.; Leung, M.H.Y.; Tong, X.; Wilkins, D.; Lee, P.K.H. Rare Taxa Exhibit Disproportionate Cell-Level Metabolic Activity in Enriched Anaerobic Digestion Microbial Communities. Msystems 2019, 4. [Google Scholar] [CrossRef] [PubMed] [Green Version]
  35. Caporaso, J.G.; Kuczynski, J.; Stombaugh, J.; Bittinger, K.; Bushman, F.D.; Costello, E.K.; Fierer, N.; Pena, A.G.; Goodrich, J.K.; Gordon, J.I.; et al. QIIME allows analysis of high-throughput community sequencing data. Nat. Methods 2010, 7, 335–336. [Google Scholar] [CrossRef] [Green Version]
  36. Ochoa-Hueso, R.; Collins, S.L.; Delgado-Baquerizo, M.; Hamonts, K.; Pockman, W.T.; Sinsabaugh, R.L.; Smith, M.D.; Knapp, A.K.; Power, S.A. Drought consistently alters the composition of soil fungal and bacterial communities in grasslands from two continents. Glob. Change Biol. 2018, 24, 2818–2827. [Google Scholar] [CrossRef]
  37. Kõljalg, U.; Nilsson, R.H.; Abarenkov, K.; Tedersoo, L.; Taylor, A.F.S.; Bahram, M.; Bates, S.T.; Bruns, T.D.; Bengtsson-Palme, J.; Callaghan, T.M.; et al. Towards a unified paradigm for sequence-based identification of fungi. Mol. Ecol. 2013, 22, 5271–5277. [Google Scholar] [CrossRef] [Green Version]
  38. R Core Team. R: A language and Environment for Statistical Computing; R Foundation for Statistical Computing: Vienna, Austria, 2019. [Google Scholar]
  39. Oksanen, J.; Blanchet, F.G.; Friendly, M.; Kindt, R.; Legendre, P.; McGlinn, D.; Minchin, P.R.; O’Hara, R.B.; Simpson, G.L.; Solymos, P.; et al. vegan: Community Ecology Package, R Package Version 2.5-6. 2019. Available online: https://CRAN.R-project.org/package=vegan (accessed on 1 September 2019).
  40. Kolde, R. pheatmap: Pretty Heatmaps, R Package Version 1.0.12. 2019. Available online: https://CRAN.R-project.org/package=pheatmap (accessed on 4 April 2019).
  41. Kembel, S.W.; Coman, P.D.; Helmus, M.R.; Cornwell, W.K.; Morlon, H.; Ackerly, D.D.; Blomberg, S.P.; Webb, C.O. Picante: R tools for integrating phylogenies and ecology. Bioinformatics 2010, 26, 1463–1464. [Google Scholar] [CrossRef] [Green Version]
  42. Wickham, H. ggplot2: Elegant Graphics for Data Analysis; Springer: New York, NY, USA, 2016. [Google Scholar]
  43. Webb, C.O.; Ackerly, D.D.; McPeek, M.A.; Donoghue, M.J. Phylogenies and community ecology. Annu. Rev. Ecol. Syst. 2002, 33, 475–505. [Google Scholar] [CrossRef] [Green Version]
  44. Liu, S.; Schloter, M.; Bruggemann, N. Accumulation of NO2- during periods of drying stimulates soil N2O emissions during subsequent rewetting. Eur. J. Soil Sci. 2018, 69, 936–946. [Google Scholar] [CrossRef]
  45. Kaiser, M.; Kleber, M.; Berhe, A.A. How air-drying and rewetting modify soil organic matter characteristics: An assessment to improve data interpretation and inference. Soil Biol. Biochem. 2015, 80, 324–340. [Google Scholar] [CrossRef]
  46. Moyano, F.E.; Manzoni, S.; Chenu, C. Responses of soil heterotrophic respiration to moisture availability: An exploration of processes and models. Soil Biol. Biochem. 2013, 59, 72–85. [Google Scholar] [CrossRef]
  47. Inglima, I.; Alberti, G.; Bertolini, T.; Vaccari, F.P.; Gioli, B.; Miglietta, F.; Cotrufo, M.F.; Peressotti, A. Precipitation pulses enhance respiration of Mediterranean ecosystems: The balance between organic and inorganic components of increased soil CO2 efflux. Glob. Change Biol. 2009, 15, 1289–1301. [Google Scholar] [CrossRef]
  48. Heil, J.; Vereecken, H.; Bruggemann, N. A review of chemical reactions of nitrification intermediates and their role in nitrogen cycling and nitrogen trace gas formation in soil. Eur. J. Soil Sci. 2016, 67, 23–39. [Google Scholar] [CrossRef]
  49. Li, Y.; Chapman, S.J.; Nicol, G.W.; Yao, H. Nitrification and nitrifiers in acidic soils. Soil Biol. Biochem. 2018, 116, 290–301. [Google Scholar] [CrossRef]
  50. Blagodatskaya, E.; Kuzyakov, Y. Active microorganisms in soil: Critical review of estimation criteria and approaches. Soil Biol. Biochem. 2013, 67, 192–211. [Google Scholar] [CrossRef]
  51. Musat, N.; Foster, R.; Vagner, T.; Adam, B.; Kuypers, M.M.M. Detecting metabolic activities in single cells, with emphasis on nanoSIMS. FEMS Microbiol. Rev. 2012, 36, 486–511. [Google Scholar] [CrossRef] [PubMed] [Green Version]
  52. Engelhardt, I.C.; Welty, A.; Blazewicz, S.J.; Bru, D.; Rouard, N.; Breuil, M.C.; Gessler, A.; Galiano, L.; Miranda, J.C.; Spor, A.; et al. Depth matters: Effects of precipitation regime on soil microbial activity upon rewetting of a plant-soil system. ISME J. 2018, 12, 1061–1071. [Google Scholar] [CrossRef]
  53. De Vries, F.T.; Liiri, M.E.; Bjørnlund, L.; Bowker, M.A.; Christensen, S.; Setälä, H.M.; Bardgett, R.D. Land use alters the resistance and resilience of soil food webs to drought. Nat. Clim. Change 2012, 2, 276. [Google Scholar] [CrossRef]
  54. Ludemann, H.; Arth, I.; Liesack, W. Spatial changes in the bacterial community structure along a vertical oxygen gradient in flooded paddy soil cores. Appl. Environ. Microbiol. 2000, 66, 754–762. [Google Scholar] [CrossRef] [Green Version]
  55. Noll, M.; Matthies, D.; Frenzel, P.; Derakshani, M.; Liesack, W. Succession of bacterial community structure and diversity in a paddy soil oxygen gradient. Environ. Microbiol. 2005, 7, 382–395. [Google Scholar] [CrossRef]
  56. Lennon, J.T.; Aanderud, Z.T.; Lehmkuhl, B.K.; Schoolmaster, D.R. Mapping the niche space of soil microorganisms using taxonomy and traits. Ecology 2012, 93, 1867–1879. [Google Scholar] [CrossRef] [Green Version]
  57. Bahram, M.; Hildebrand, F.; Forslund, S.K.; Anderson, J.L.; Soudzilovskaia, N.A.; Bodegom, P.M.; Bengtsson-Palme, J.; Anslan, S.; Coelho, L.P.; Harend, H.; et al. Structure and function of the global topsoil microbiome. Nature 2018, 560, 233–237. [Google Scholar] [CrossRef]
  58. Schimel, J.P. Life in Dry Soils: Effects of Drought on Soil Microbial Communities and Processes. Annu. Rev. Ecol. Evol. Syst. 2018, 49, 409–432. [Google Scholar] [CrossRef]
  59. Filippidou, S.; Wunderlin, T.; Junier, T.; Jeanneret, N.; Dorador, C.; Molina, V.; Johnson, D.R.; Junier, P.A. Combination of Extreme Environmental Conditions Favor the Prevalence of Endospore-Forming Firmicutes. Front. Microbiol. 2016, 7, 11. [Google Scholar] [CrossRef] [PubMed]
  60. Sharipova, M.R.; Balaban, N.P.; Gabdrakhmanova, L.A.; Shilova, M.A.; Kadyrova, Y.M.; Rudenskaya, G.N.; Leshchinskaya, I.B. Hydrolytic enzymes and sporulation in Bacillus intermedius. Microbiology 2002, 71, 420–424. [Google Scholar] [CrossRef]
  61. Feng, M.; Adams, J.M.; Fan, K.; Shi, Y.; Sun, R.; Wang, D.; Guo, X.; Chu, H. Long-term fertilization influences community assembly processes of soil diazotrophs. Soil Biol. Biochem. 2018, 126, 151–158. [Google Scholar] [CrossRef]
  62. Li, Y.; Pan, F.; Yao, H. Response of symbiotic and asymbiotic nitrogen-fixing microorganisms to nitrogen fertilizer application. J. Soil Sediment. 2019, 19, 1948–1958. [Google Scholar] [CrossRef]
  63. Wang, Y.; Li, C.; Kou, Y.; Wang, J.; Tu, B.; Li, H.; Li, X.; Wang, C.; Yao, M. Soil pH is a major driver of soil diazotrophic community assembly in Qinghai-Tibet alpine meadows. Soil Biol. Biochem. 2017, 115, 547–555. [Google Scholar] [CrossRef]
Figure 1. Soil gases (a) CO2, (b) N2O, (c) CH4 efflux rates, and (d) the accumulative amount released within 12 h after flooding. Dashed curves were all fitted by an allometric power equation. Error bars indicate standard errors. x axes are displayed on a logarithmic time scale and the insets in (ac) show the same data from 15 min through 168 h after flooding presented on linear time scales.
Agronomy 10 00502 g001
Figure 2. Variation in soil enzyme activity over time after flooding (a: β-Glucosidase; b: Acid phosphatase; c: N-Acetyl-glucosaminidase). Activity levels presented as nmol MUB g−1 dry soil h−1. Error bars represent standard errors. Different letters indicate significant differences as determined by Tukey’s HSD at p = 0.05 level.
Agronomy 10 00502 g002
Figure 3. Changes in composition of bacterial (a,b) and fungal (c,d) community from rRNA amplicon analysis on the basis of DNA (a,c) and RNA (b,d). Colors in the stacked vertical bars correspond to the phylum level classification of each taxon, with exception of Proteobacteria, Firmicutes, and Ascomycota, which were classified to class level.
Agronomy 10 00502 g003
Figure 4. Principal coordinates analysis (PCoA) of (a) the unweighted UniFrac pairwise dissimilarity of the relative abundance of bacterial sequences and (b) of the Bray-Curtis distance of the relative abundance of fungal sequences. Difference between DNA- and RNA-based community was calculated by analysis of similarity (ANOSIM). Ellipses denote the samples from DNA- or RNA-based community at 95% confidence level.
Agronomy 10 00502 g004
Figure 5. Relationship between changes in DNA- (red fitted line) and RNA-based (blue fitted line) community structure (Unweighted UniFrac and Bray-Curtis phylogenetic distance are used for bacterial and fungal communities, respectively) and the accumulative CO2 emission (ad) and enzyme activity (eh) over time after flooding. The values of accumulative amount of CO2 emitted and enzyme activity were log-transformed. Gray shadow represents 95% confidence interval.
Agronomy 10 00502 g005
Figure 6. Heatmaps displaying the changes in the relative abundance of bacterial genera with abundance > 0.1% based on (a) DNA and (b) RNA community analysis over the time series. A similar trend in changes in the relative abundance and clustering of bacterial taxa were found over time. In both DNA- and RNA-based analysis, bacterial genera are significantly classified into three different responding patterns (dark red: rapid pattern; light green: intermediate pattern; light blue: delayed pattern) according to the changes of relative abundance over the time series.
Agronomy 10 00502 g006
Figure 7. Heatmaps displaying the changes in the relative abundance of fungal genera with abundance > 0.5% based on (a) DNA and (b) RNA community analysis over the time series. Fungal taxa were significantly divided into two groups in the DNA-based fungal community but not in the RNA-based community.
Agronomy 10 00502 g007
Table 1. Variations of soil bacterial and fungal richness, Shannon’s diversity, and evenness after flooding over time based on levels of DNA and RNA community.
DNA-BasedRNA-Based
TimeRichnessShannonEvennessRichnessShannonEvenness
Bacteria0.25 h4927 ± 46 a10.61 ± 0.02 a0.996 ± 0.000 a4357 ± 87 ab9.34 ± 0.14 ab0.977 ± 0.003 a
0.5 h4961 ± 38 a10.61 ± 0.02 a0.996 ± 0.000 a4246 ± 115 ab9.08 ± 0.18 abc0.972 ± 0.004 a
0.75 h4967 ± 18 a10.65 ± 0.01 a0.996 ± 0.000 a4242 ± 70 ab9.17 ± 0.13 abc0.975 ± 0.002 a
1 h4901 ± 11 a10.50 ± 0.04 a0.996 ± 0.000 a4294 ± 33 ab9.22 ± 0.07 abc0.975 ± 0.002 a
2 h4923 ± 20 a10.54 ± 0.01 a0.996 ± 0.000 a4433 ± 36 a9.46 ± 0.05 a0.981 ± 0.001 a
4 h4889 ± 27 a10.5 ± 0.04 b0.995 ± 0.000 a4037 ± 22 abcd8.83 ± 0.07 bcd0.971 ± 0.003 a
8 h4541 ± 19 b9.54 ± 0.02 b0.981 ± 0.000 a4006 ± 24 bcd8.73 ± 0.03 cd0.973 ± 0.001 a
12 h3938 ± 84 c7.97 ± 0.15 d0.929 ± 0.005 a3864 ± 57 bcd8.34 ± 0.11 de0.964 ± 0.002 a
24 h3742 ± 25 cd8.07 ± 0.05 d0.962 ± 0.002 a3743 ± 41 de7.86 ± 0.11 ef0.94 ± 0.009 b
48 h3491 ± 67 de8.94 ± 0.12 c0.988 ± 0.001 a3104 ± 88 fg7.06 ± 0.11 g0.924 ± 0.006 b
72 h3197 ± 75 f8.80 ± 0.09 c0.986 ± 0.000 a2798 ± 169 g7.58 ± 0.19 fg0.966 ± 0.003 a
96 h3178 ± 64 f8.85 ± 0.04 c0.984 ± 0.000 a3108 ± 6f g8.34 ± 0.02 de0.976 ± 0.000 a
120 h3234 ± 62 ef9.31 ± 0.06 b0.992 ± 0.000 a3143 ± 62 fg8.45 ± 0.10 d0.976 ± 0.002 a
144 h3408 ± 22 ef9.29 ± 0.03 b0.986 ± 0.000 a3256 ± 80 f8.71 ± 0.04 cd0.974 ± 0.000 a
168 h3324 ± 74 ef9.41 ± 0.07 b0.992 ± 0.000 a3366 ± 137 ef8.84 ± 0.10 bcd0.977 ± 0.001 a
Fungi0.25 h365 ± 15 a4.02 ± 0.43 a0.784 ± 0.064 a209 ± 11 ab4.94 ± 0.07 a0.925 ± 0.007 a
0.5 h349 ± 14 a3.33 ± 0.12a0.689 ± 0.04 a228 ± 46 ab4.79 ± 0.73 a0.875 ± 0.065 a
0.75 h412 ± 8 a4.68 ± 0.28a0.895 ± 0.031 a202 ± 25 ab4.22 ± 0.93 a0.812 ± 0.122 a
1 h386 ± 6 a3.99 ± 0.48a0.809 ± 0.044 a228 ± 10 ab4.01 ± 0.42 a0.8 ± 0.066 a
2 h400 ± 38a4.58 ± 0.18a0.901 ± 0.004 a233 ± 32 ab4.81 ± 0.35 a0.897 ± 0.027 a
4 h381 ± 28a4.28 ± 0.38a0.867 ± 0.036 a183 ± 9 ab4.05 ± 0.77 a0.787 ± 0.121 a
8 h356 ± 48a3.72 ± 0.41 a0.765 ± 0.056 a214 ± 39 ab3.70 ± 0.77 a0.802 ± 0.083 a
12 h377 ± 23a4.17 ± 0.27 a0.85 ± 0.026 a252 ± 34 a4.42 ± 0.91 a0.791 ± 0.139 a
24 h420 ± 30a4.16 ± 0.45 a0.809 ± 0.07 a204 ± 35 ab5 ± 0.32 a0.909 ± 0.029 a
48 h440 ± 20 a4.19 ± 0.18 a0.806 ± 0.023 a143 ± 13 ab4.3 ± 0.57 a0.811 ± 0.066 a
72 h397 ± 40 a4.17 ± 0.47 a0.814 ± 0.072 a136 ± 6 ab4.35 ± 1.049 a0.812 ± 0.136 a
96 h427 ± 40 a4.59 ± 0.23 a0.887 ± 0.016 a162 ± 50 ab3.21 ± 0.87 a0.636 ± 0.174 a
120 h320 ± 17 a3.81 ± 0.26 a0.795 ± 0.044 a114 ± 28 ab4.45 ± 0.79 a0.824 ± 0.068 a
144 h431 ± 10 a4.47 ± 0.27 a0.874 ± 0.03 a88 ± 26 b3.24 ± 0.47 a0.708 ± 0.089 a
168 h320 ± 16 a3.4 ± 0.29 a0.704 ± 0.06 a116 ± 44 b3.01 ± 0.21 a0.673 ± 0.043 a
Different letters in the same column represent significant difference (p < 0.05) across time.

