Article

Greenhouse Gas Emissions as Affected by Fertilization Type (Pig Slurry vs. Mineral) and Soil Management in Mediterranean Rice Systems

by
Beatriz Moreno-García
*,†,
Mónica Guillén
and
Dolores Quílez
Unidad de Suelos y Riegos (asociada a EEAD-CSIC), Centro de Investigación y Tecnología Agroalimentaria de Aragón, Avda Montañana 930, 50059 Zaragoza, Spain
*
Author to whom correspondence should be addressed.
Present address 220 ENGR Hall, Biological & Agricultural Engineering, University of Arkansas, Fayetteville, AR 72701, USA.
Agronomy 2020, 10(4), 493; https://doi.org/10.3390/agronomy10040493
Submission received: 19 February 2020 / Revised: 16 March 2020 / Accepted: 30 March 2020 / Published: 1 April 2020

Abstract

:
The great increase in livestock production in some European areas makes it necessary to recycle organic slurries and manures and to integrate them in crop production. In Northeast Spain, the application of pig slurry (PS) is being extended to alternative crops such as rice due to the great increase in pig production. However, there is a lack of information of the effect of substitution of synthetic fertilizers with pig slurry on greenhouse gas (GHG) emissions in rice crop, and this information is key for the sustainability of these agricultural systems. The aim of this study was to evaluate the effect of the substitution of mineral fertilizers by PS on GHG emissions in Mediterranean flooded rice cultivation conditions under optimal nitrogen (N) fertilization. Two field experiments were carried out in two different (contrasting) soil types with different land management. Site 1 had been cultivated for rice in the previous three years with no puddling practices. Site 2 had been cultivated for rice for more than 15 years with puddling tillage practices and had higher organic matter content than site 1. The cumulative nitrous oxide emissions during the crop season were negative at both sites, corroborating that under flooded conditions, methane is the main contributor to global warming potential rather than nitrous oxide. The substitution of mineral fertilizer with PS before seeding at the same N rate did not increase emissions in both sites. However, at site 1 (soil with lower organic matter content), the higher PS rate applied before seeding (170 kg N ha−1) increased methane emissions compared to the treatments with lower PS rate and mineral fertilizer before seeding (120 kg N ha−1) and complemented with topdressing mineral N. Thus, a sustainable strategy for inclusion of PS in rice fertilization is the application of moderate PS rates before seeding (≈120 kg N ha−1) complemented with mineral N topdressing.

1. Introduction

Agriculture contributes to approximately 10%–12% of the total anthropogenic greenhouse gas (GHG) emissions [1] and accounts for 60% and 59% of the total anthropogenic emissions of methane (CH4) and nitrous oxide (N2O), respectively [2]. Rice paddies are considered to be responsible for 11% of the methane anthropogenic emissions [2]. Although rice paddies also emit N2O, methane emissions contribute to almost 90% of the global warming potential (GWP) in flooded rice systems [3]. Despite the low contribution of N2O to GWP, both gases have to be considered together when mitigation practices are developed, since the mitigation practices that focus on CH4 emission reduction tend to increase N2O emissions [4,5,6].
The emission of nitrous oxide (N2O) into the atmosphere from agricultural soils is mainly related to two biological processes, nitrification and denitrification [7,8]. Methane emission is a result of two opposite mechanisms, production (methanogenesis) and oxidation (methanotrophy) [9,10].
Agricultural soils are also a source of carbon dioxide (CO2), which is emitted as a result of the decomposition of organic matter [11] and respiration processes. However, only agricultural non-CO2 sources are considered as anthropogenic GHG emissions because the CO2 emitted is considered neutral due to annual cycles of carbon fixation and oxidation [1]. Despite of that, practices to increase the soil organic carbon diminish the atmospheric CO2 concentration and thus, mitigate climate change, as well as increase fertility and health of soils [12].
Rice flooded systems are different from other cropping systems because in flooded conditions soil processes are dominated by the anaerobic conditions created under flooding [13,14] and thus, denitrification and methanogenesis are two of the main processes taking place.
Fertilization is essential to obtain high rice yields, but fertilization may affect GHG emission [15]. In addition, when mineral fertilizers are replaced by organic amendments, the additional carbon (C) source could enhance soil processes such as denitrification and methanogenesis [8,16] and hence, the application of these products could imply higher GHG emissions in comparison with mineral fertilizers.
Farmers in Northeast Spain have traditionally applied mineral fertilizers (urea and ammonium sulfate) to rice crop, but in the last few years, they have started to include pig slurry (PS) in the fertilization plans, initially due to the cost of mineral fertilizers and later because of the pressure to recycle the high amount of PS produced.
Studies focusing on the influence of organic fertilizers on GHG emissions under flooded rice systems have been carried out in different regions for evaluating products such as straw [6,17,18], green manure [19,20], pig manure [21], pig slurry and chicken manure [22], and anaerobically digested pig slurry (ADPS) [23]. The most consistent result found in the literature is that the incorporation of crop residues increases methane emissions due to the additional C input [6,17,24]. However, the effect of incorporation of crop residues on N2O emissions is not clear, although it might be the opposite [18,25]. Nevertheless, pig slurry (PS) composition is very different than straw; the straw C content is about 30% [26], while C content in PS is below 5% [27], thus the effect of PS fertilization on GHG emissions is expected to be different compared to the effect of crop residue incorporation.
There are a few studies that focused on the effect of PS application to rice, as a substitute for mineral fertilizers, on GHG emissions and results are not consistent. In Asia, Sasada et al. [28] found no significant differences in CH4 and N2O emissions between plots fertilized with a chemical fertilizer and plots fertilized with anaerobically digested pig slurry (ADPS). Win et al. [23] reported that cumulative methane emissions for the growing season were 1.6 times higher for ADPS-fertilized plots than for plots with chemical fertilization, but with no significant differences, while no differences in N2O fluxes were found between the two types of fertilizers. Huang et al. [29] found significant increases in CH4 emissions by applying ADPS. Under Mediterranean rice conditions, only Maris et al. [22] studied the application of PS to flooded rice, and their results showed no significant differences in GHG emissions and GWP for PS fertilization compared to ammonium fertilization. Thus, more studies focusing on the substitution of mineral fertilizers with organic fertilizers to evaluate the effect on GHG emissions are needed in the framework of a more sustainable agriculture.
Our objective was to generate information on the modification of GHG emissions due to the substitution of mineral fertilizers with PS in Mediterranean flooded rice cultivation conditions under optimal N fertilization. To achieve this objective, CH4, N2O, and CO2 emissions from the soil were quantified during the whole crop season in two different (contrasting) soil types with different land management in Northeast Spain. We hypothesize that, due to the low organic C content of PS, greenhouse gas cumulative emissions during the crop season under PS fertilization will not be higher than that under mineral fertilization.

2. Materials and Methods

2.1. Sites Description and Experimental Design

The study was carried out in two flooded rice fields in Northeast Spain (Figure 1) with different soil characteristics and crop management practices.
Site 1, located at Villanueva de Sigena, was sampled in 2013 and site 2, located at Grañén (40 km from site 1), was sampled in 2014. The climate of the two experimental fields is semiarid continental Mediterranean, with high temperatures during the summer and low precipitation. The main climatic characteristics for both sites are detailed in Table 1.
Site 1 had been cultivated for rice in the previous three years with no puddling practices. Site 2 had been cultivated for rice for more than 15 years with puddling tillage practices. In puddling, plowing and harrowing are carried out at high soil water content with straw incorporation in order to destroy soil aggregates and create an impermeable layer. There were also differences in soil properties between the two sites; organic matter content, salinity (ECe), and the main nutrients’ content (N, P, and K) were higher in site 2 than in site 1 (Table 1), and soil clay content in site 2 was also higher than in site 1.
The samplings in site 1 were carried out in the experimental field (Figure 1) described in Moreno-García et al. [30]. Four fertilization treatments were selected to evaluate the effect of PS versus mineral fertilization on GHG emissions (Table 2): control (C) with no N fertilization; M120M60 (mineral treatment) with a rate of 120 kg N ha−1 (ammonium sulfate) before seeding complemented with 60 kg N ha−1 (ammonium sulfate) at topdressing; and two PS strategies, PS120M60 with a rate of PS equivalent to 120 kg NH4+-N ha−1 before seeding complemented with 60 kg N ha−1 (ammonium sulfate) at topdressing, and PS170M0 with a rate of PS equivalent to 170 kg NH4+-N ha−1 before seeding and no topdressing N. In PS120M60, mineral N before seeding was replaced by PS, while in PS170M0, the crop N total requirements were covered by PS.
Small plots specific for GHG emission measurements were established out of the main experimental design, in order not to disturb the experimental plots during GHG sampling (Figure 1). The experiment was arranged as a randomized block design with four replications and the plot size was 6 m x 6 m for PS plots and 6 m x 3 m for the control and mineral plots.
In site 2, GHG emissions were evaluated in three different N treatments of an agronomic experiment comparing PS and mineral fertilization. Selected treatments were (Table 2): control (C) with no N fertilization, PS170M0 with a rate of PS equivalent to 170 kg NH4+-N ha−1 before seeding and no topdressing N, and M170M0 (mineral treatment) with a rate of 170 kg N ha−1 (urea) before seeding and no topdressing N. Similar to site 1, small plots specific for GHG emission measurements were established out of the main experimental design in site 2, in order not to disturb the experimental plots during GHG sampling (Figure 1). The experiment was arranged as a randomized block design with three replications and the plot size was 2 m x 1 m.
In both experiments, the selected treatments (except the control) were considered to be optimum N treatments [30] (Table S1). In site 1, significant differences between yield values were only observed between the control treatment and the three fertilization treatments. However, in site 2, the mineral treatment had a lower yield compared with the PS treatment due to a fungal infection during grain filling. This fungal infection decreased grain yield, but rice growth and biomass values were similar between PS and mineral plots.
Pig slurry was collected from the closest fattening farm to each experimental field. PS application rates were established according to PS ammonium N concentration measured in situ by Quantofix® N-volumeter (Terraflor GmbH, Iserlohn, Germany) [31] and conductimetry [32]. Pig slurry was band spread on the soil surface. Although machinery was calibrated before application in order to apply target rates, the slurry tank was weighed before and after application to know the actual PS rates applied (Table 2). Slurry samples were collected at the two sites for laboratory characterization (Table 3).
On the same day of PS application, basal mineral N was applied to the mineral treatments together with P (100 kg P2O5 ha−1) and K (100 kg K2O ha−1) to ensure that these two nutrients were not limiting since in site 1, P and K levels were suboptimal (Table 1). Slurry and mineral fertilizers were incorporated into the soil in the afternoon of the same day.
Table S2 shows the amounts of N, P2O5 (Olsen), and K2O (ammonium acetate) in the first 0–0.3 m of the soil at the beginning of the experiment in each site, together with the amount of the nutrients applied as a fertilizer in each treatment.
For both experimental fields, typical land preparation was carried out by the farmer in April 2013 and 2014 before fertilization, seeding, and flooding. In both sites, rice straw and stubbles from the previous crop were incorporated into the soil during puddling in site 2 and with ploughing on dry soil in site 1. Rice (Oryza sativa L. spp. Japónica cv. Guadiamar) was broadcast seeded in both fields once they were flooded at a rate of 180 kg ha−1. Water was applied at the top of the field and cascaded down the paddies through levee gates. A water layer of 5 cm was maintained during the first few days to improve rice germination; after that, a water layer of 10–15 cm was maintained until approximately one month before harvest, when fields were drained. Moreover, the fields were briefly drained for several days for the application of herbicides, pesticides, and fungicides, according to habitual practices in the area (usually twice during the flooded period). Topdressing N was applied on the water at the end of the tillering stage in site 1.

2.2. Greenhouse Gas Measurements and Analyses

The emissions of N2O, CH4, and CO2 from the soil into the atmosphere were measured using the static non-vented chamber method.
At the beginning of each experiment, one (site 1) or two (site 2) polyvinyl chloride collars (19.5 cm inner diameter) were inserted in each plot into the soil to a depth of 13 cm. Chambers (37 cm height) were fitted into the collars at the time of sampling.
Gas sampling occurred between 09:00 and 12:00. Samples were taken through a three-way valve placed on the top of the chamber and adjusted with a metal fitting. Gas samplings were performed every 7–10 days or more frequently when fields were eventually drained. Air samples were obtained, through a Teflon® (Chemours, Wilmington, Delaware, USA) tube connected to the three-way valve and into a 100 mL propylene syringe adapted with a valve, at 0, 15, 30, and 45 min after closing the chamber. The air inside the chamber was mixed by filling and emptying the syringe three times before withdrawing the sample. Once the sample was taken, the valve connected to the syringe was closed [22].
In site 1, 100 mL of air samples was taken from the individual chamber installed in each plot. In site 2 (two chambers per plot), syringes were filled with 50 mL of air samples from each of the two chambers in each plot (composite sample) [33]; for doing that, the tygon tube connected to the syringe allowed the system to be closed, while moving between chambers. In both sites, 100 mL syringe duplicates were taken in each plot per sampling time. Samples were transported to the laboratory and N2O, CH4, and CO2 concentrations were quantified using the photoacoustic technique (Innova 1412i Photoacoustic Multigas Monitor, LumaSense Technologies, Ballerup, Denmark). Average GHG concentrations in duplicates were used for the mass flux calculations.
Soil temperature in the uppermost 0.05 m and floodwater depth (to quantify chamber headspace volume) were measured at each sampling date.
Emissions fluxes were calculated using the linear increase/decrease in the concentration inside the chamber over time, considering the headspace volume of the chamber. Figure S1 shows an example of the linear regression for N2O and CH4 on 6 August 2014 for a replicate of the PS170M0 treatment in site 2.

2.3. Soil Sampling and Analysis

Soil (0–0.1 m) was sampled in 80% of GHG sampling dates, and moisture content and nitrate and ammonium concentration were determined. Soil extracts were prepared using 10 g of fresh soil and 30 mL of KCl 2N solution. Nitrate [34] and ammonium [35] concentrations were determined by colorimetry with a continuous flow analyzer (AutoAnalyzer 3, Bran+Luebbe, Norderstedt, Germany).

2.4. Calculations and Statistical Analysis

The cumulative emissions of N2O, CH4, and CO2 for the studied period were quantified by integrating the emissions over time. For doing that, the average gas fluxes between dates were multiplied by the time interval between sampling dates.
The effects of treatments and sampling dates on GHG fluxes were evaluated by repeated measures of analysis of variance (ANOVA). The effect of treatments on GHG cumulative emissions was evaluated by analysis of variance. When the analysis was significant, a comparison among the treatment means was performed using Tukey’s multiple range test at p = 0.05 (SAS 9.4 software, SAS Institute Inc., Cary, North Caroline, USA). When necessary, data were log transformed prior to analysis in order to fulfill ANOVA assumptions (homogeneity of variance and normality).

3. Results

3.1. Meteorological Conditions and Drainage of the Plots

Rainfall and air temperature during the sampling period (Figure 2a and Figure 3a) were obtained from the closest meteorological station to the experimental site (Red SIAR (Sistema de Información Agroclimática para el Regadío), site 1 Alcolea de Cinca Station and site 2 Grañén Station). Both sites showed similar meteorological conditions, with low precipitation during the summer and high temperatures. The average air temperature in August was 23.9 °C in site 1 (2013) and 22.9 °C in site 2 (2014). The soil temperatures measured at the sampling dates were similar to the daily average air temperatures. In both sites, high rainfall events during fall were registered.
Puddling was conducted only in site 2, not in site 1. When puddling is conducted, an impermeable layer (plough pan) to stop percolation is created. This plough pan controls vertical water losses toward the subsoil and it has been found to be less permeable for the older and more developed paddy soils compared to young paddy fields [36,37]. This fact combined with the different soil particle size distribution and the higher clay percentage of site 2 compared with site 1 (Table 1) were responsible for the differences in the drainage speed once irrigation stopped (final drainage before harvest). Site 1 (Figure 2a) drained rapidly, while site 2 (Figure 3a) remained flooded much longer after irrigation was stopped. In site 1, water inflow was closed on 14 September 2013, the floodwater disappeared one week later and soil started to dry up. However, in site 2, the water inflow was closed on 1 October 2014 and the field remained flooded for almost one month; when the floodwater disappeared, the soil remained always saturated and a very thin water layer was always present over the soil surface. In addition, a 40 mm rainfall event on 29 November 2014 flooded the field again.

3.2. Nitrous Oxide Fluxes and Cumulative Emissions

At site 1, N2O fluxes ranged from −27.5 to 44.4 g N2O-N ha−1 d−1 and the different N treatments showed similar patterns (Figure 2b). No differences between fertilization treatments were noted in the mean N2O fluxes (Table 4). The fluxes were negative or close to 0 until the final drainage of the plot, when N2O emissions increased and became positive in some cases (Figure 2b).
When integrating all the sampling periods, cumulative emissions were not significantly different between fertilization treatments (Table 4).
At site 2, N2O fluxes ranged between −14.7 and 6.3 g N2O-N ha−1 d−1, the N treatments showed similar patterns (Figure 3b), and average fluxes were not affected by treatments (Table 5). Although an increase in N2O fluxes was observed after the final drainage before harvest (the fluxes were negative, but lower in absolute values, i.e., consumption of N2O was lower than that previously observed), the fluxes remained negative for the whole studied period unlike site 1 (Figure 3b).
At site 2, nitrous oxide cumulative emissions in the study period showed no effect of the treatments in the same manner as at site 1 (Table 5).

3.3. Methane Fluxes and Cumulative Emissions

At site 1, CH4 fluxes varied from −0.1 to 26.6 kg CH4-C ha−1 d−1 (Figure 2c). Nitrogen fertilization affected the average CH4 fluxes for the studied period, with a greater mean CH4 flux for the PS170M0 treatment (Table 4). However, no differences in CH4 fluxes between M120M60 and PS120M60 (treatments with equivalent N rates before seeding) were found.
Overall, the highest emissions were observed at the end of August (at heading stage), but for the PS170M0 treatment, high emissions were also observed at the beginning of the season (with a peak on 19 June 2013). An emission peak also occurred in all treatments during a short drainage of the field for an herbicide treatment (1 July 2013). Once the field was drained, CH4 emissions decreased dramatically, reaching values lower than 100 g CH4-C ha−1 d−1 (Figure 2c).
Methane cumulative emissions in the study period in site 1 did not show significant differences among the fertilization treatments (Table 4), but the PS170M0 treatment showed higher (although not significant) CH4 emission than the other three treatments.
At site 2, CH4 fluxes were higher than those at site 1. The values ranged from 0.01 to 57.8 kg CH4-C ha−1 d−1 (Figure 3c). The CH4 fluxes increased over time during the growing season, except during a brief drainage episode (25 July 2014). Maximum CH4 fluxes were reached in late September 2014, during the rice ripening phase and just before the plot was drained. CH4 emissions decreased after the beginning of final drainage; however, in contrast to site 1, the decrease in CH4 fluxes was slower and did not reach values lower than 1 kg CH4-C ha−1 d−1. In contrast to site 1, treatments had no significant effect on the average CH4 fluxes (Table 5) and cumulative CH4 emission during the sampling period (Table 5).

3.4. Carbon Dioxide Fluxes and Cumulative Emissions

At site 1, CO2 fluxes ranged between −0.10 and 40 kg CO2-C ha−1 d−1 (Figure 2d). The average CO2 fluxes did not show differences among N fertilization treatments; however, a higher (but non-significant) average flux was observed in the PS170M0 treatment (Table 4). The evolution of CO2 over time (Figure 2d) showed CO2 emissions lower than 5 kg CO2-C ha−1 d−1 until the plot was drained to harvest (with the exception of an emission peak on 1 July 2013 during a short drainage). Once the field was drained in mid-September 2013, CO2 emissions increased rapidly.
At site 2, CO2 emissions varied from −0.10 to 16.7 kg CO2-C ha−1 d−1 (Figure 3d) and N fertilization treatments did not affect the average CO2 flux (Table 5). During the flooded period, a small emission peak during a short drainage period was observed. Once the field was drained for harvest, CO2 fluxes decreased slightly in site 2 in contraposition to site 1 where CO2 fluxes increased rapidly after drainage started.
Carbon dioxide cumulative emissions for the studied period did not show significant differences among fertilization treatments either in site 1 (Table 4) or in site 2 (Table 5).

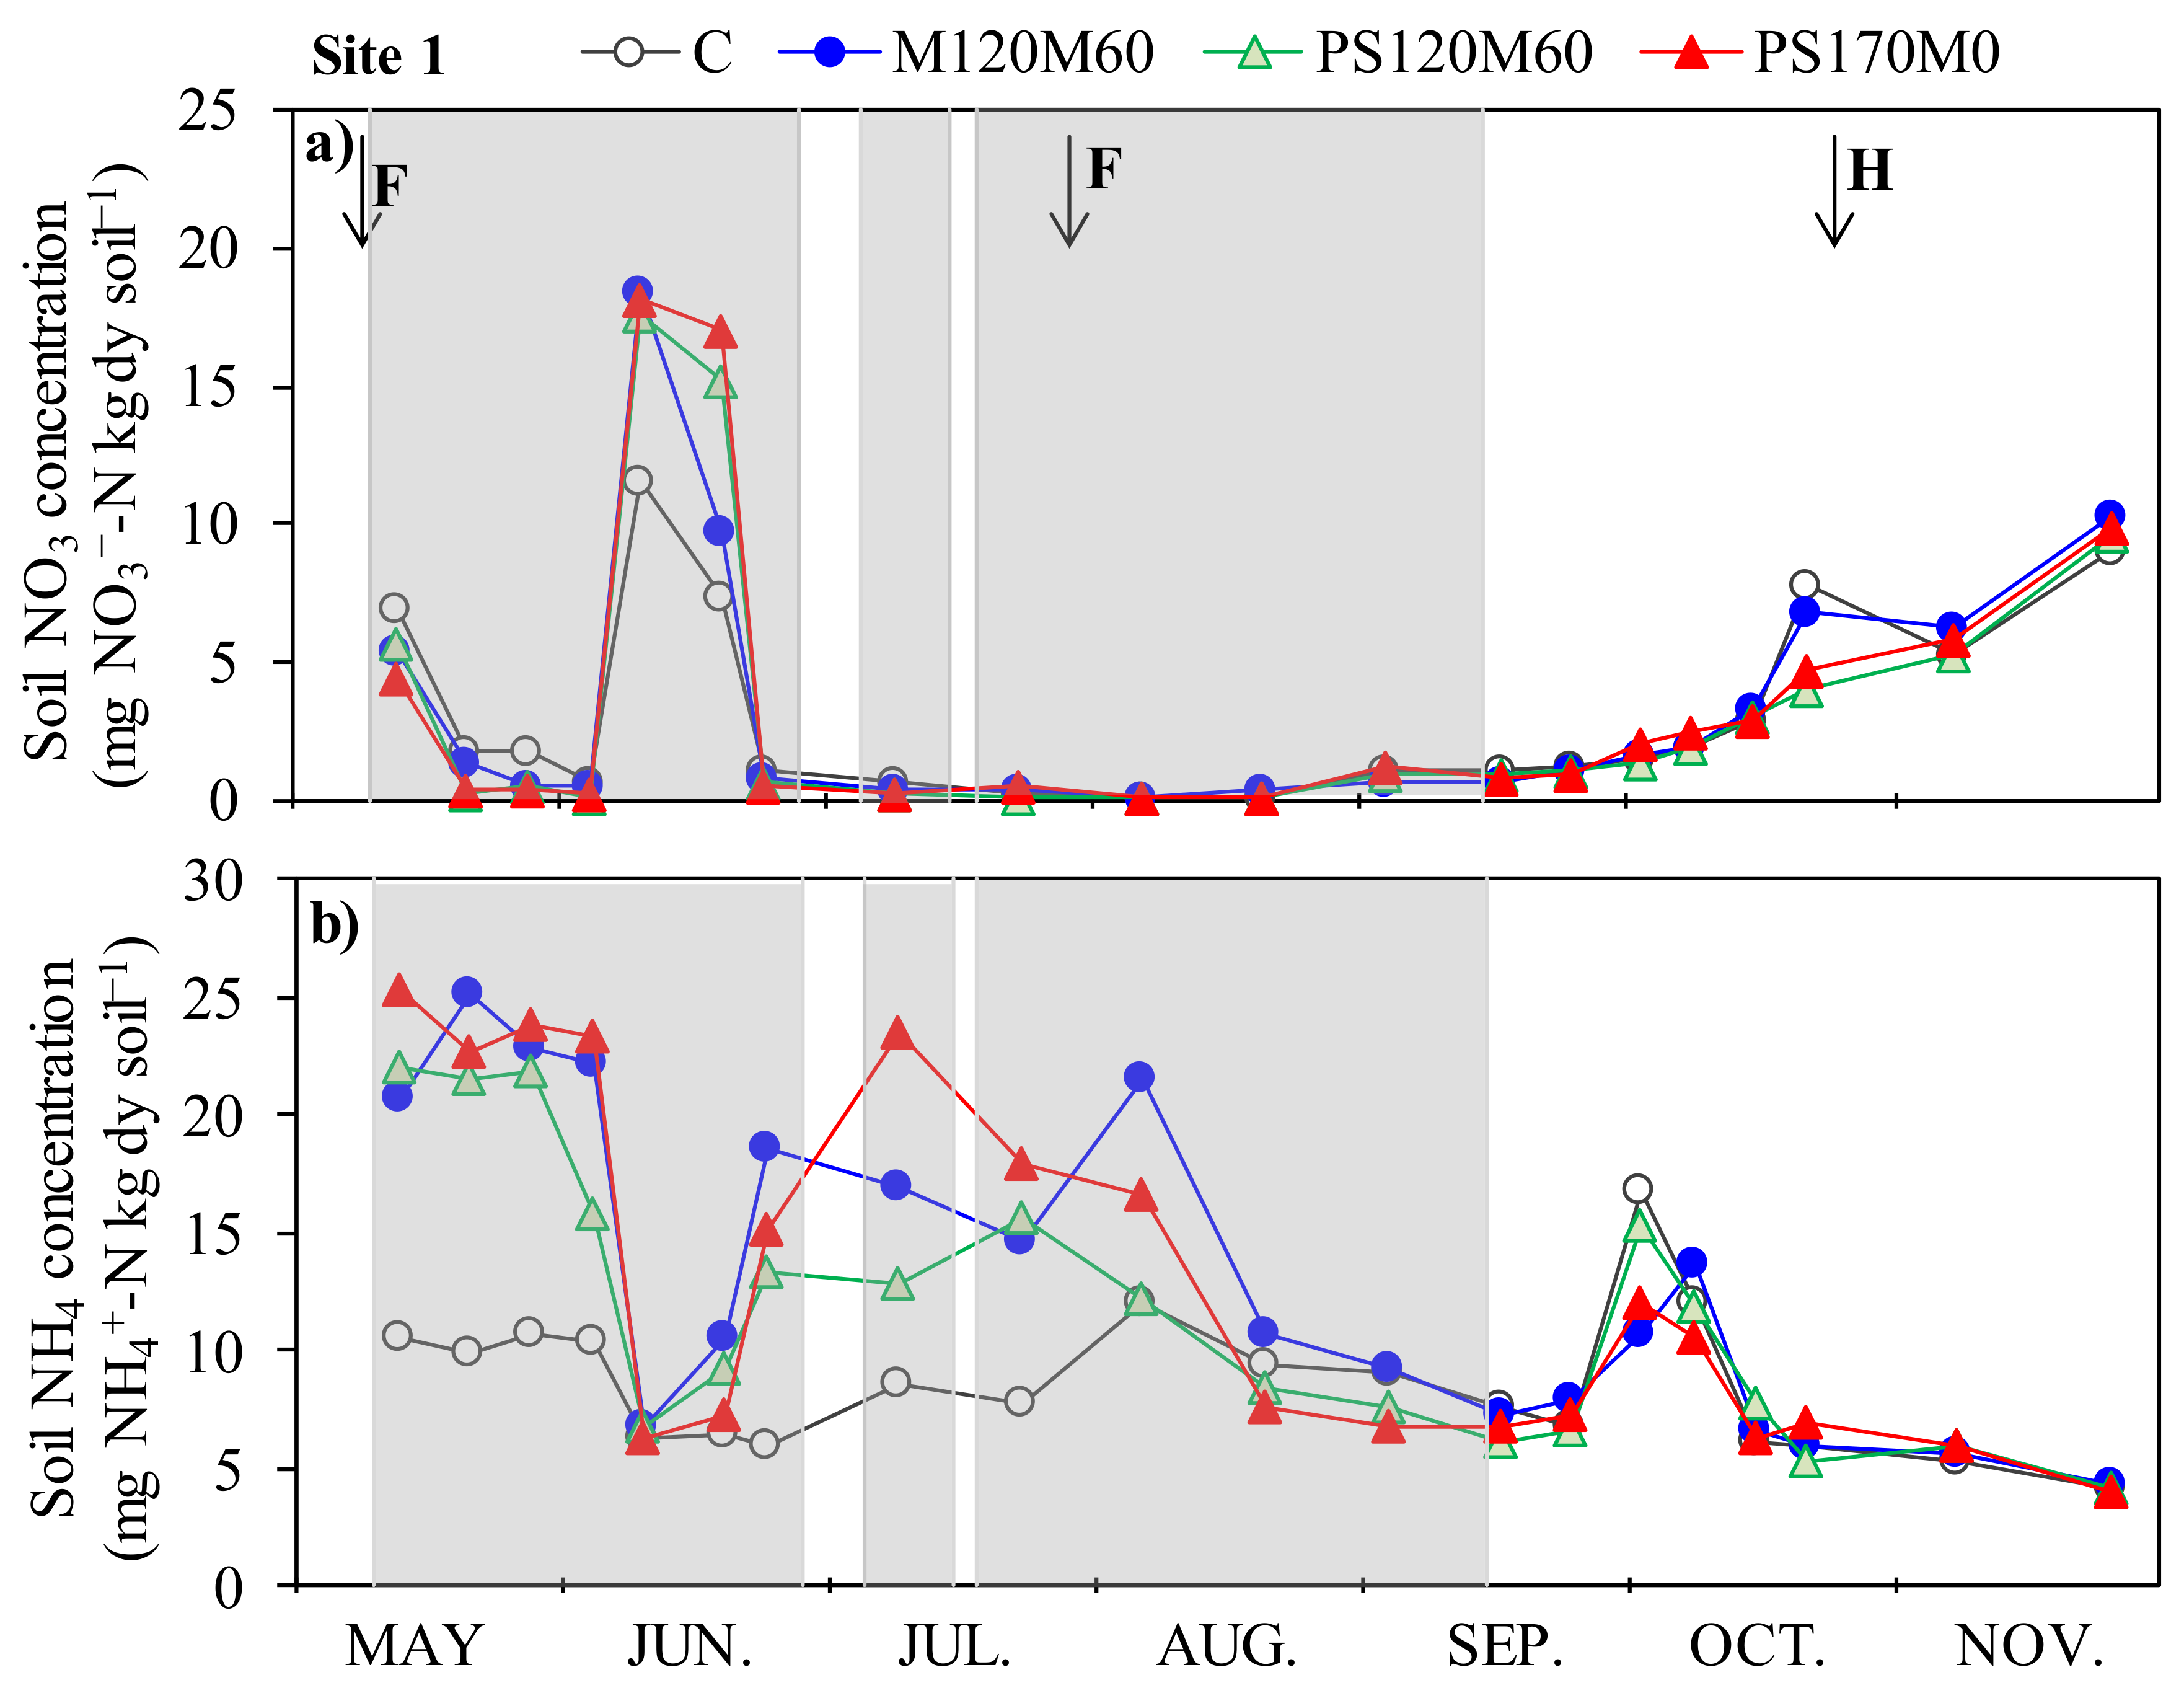
3.5. Soil Ammonium and Nitrate Concentration

At site 1, soil (0–0.1 m) nitrate concentration ranged from 0.1 to 18.4 mg NO3-N kg dry soil−1 (Figure 4a). At the beginning of the experiment, immediately after the field was flooded, the nitrate content decreased, reaching values lower than 1 mg kg−1. In early June 2013, there was an increment in all treatments associated with shallow floodwater depth (Figure 2a), but immediately, the nitrate content lowered again. After that, the values remained below 1 mg NO3-N kg dry soil−1 until the field was drained (14 September 2013), then nitrate content started to increase steadily (Figure 4a).
At site 1, soil ammonium concentration (0–0.1 m) ranged between 4.1 and 25.4 kg NH4+-N kg dry soil−1 (Figure 4b). Soil ammonium concentration was high in the first sampling dates in treatments with N application (M120M60, PS120M60, and PS170M0), then decreased in early June 2013 (Figure 4b) at the same time that nitrate concentration increased (Figure 4a) and after that, increased again at the same time that nitrate decreased. From July 2013 until the plot was drained, ammonium concentration decreased gradually. Once the field was drained, a slight increase was observed, but again NH4 lowered (Figure 4b), matching with an increase in nitrate concentration (Figure 4a).
At site 2, soil nitrate and ammonium concentrations (data not shown) were high at the beginning of the experiment (Table 1) with small oscillations along the crop season and similar for the different treatments, even for the control treatment, and they did not provide useful information to be related to gas emissions.

4. Discussion

4.1. Nitrous Oxide Fluxes and Cumulative Emissions

Nitrous oxide emissions ranged from ‒27.5 to 44.4 g N2O-N ha−1 d−1 in site 1 (Figure 2b) and from ‒14.7 to 6.3 g N2O-N ha−1 d−1 in site 2 (Figure 3b).
In site 1, there was N2O consumption during the crop season until the field was drained (Figure 2b). Many researchers have reported the consumption of N2O in rice under flooded conditions [23,38,39] and the reason is that, although nitrate is usually the starting point of denitrification, other nitrogen oxides (NO2, NO, and N2O) can serve as terminal electron acceptors for denitrifying bacteria due to a lack of nitrate [8,40] (Equation 1).
2 NO3 → 2 NO2 → 2 NO → N2O → N2
Once the field was drained (14 September 2013), N2O emissions increased rapidly and reached positive values (Figure 2b). The formation of N2O in the soil is due to both nitrification [7,41] and denitrification processes. When soil starts to dry and O2 penetrates into the soil, the denitrification process can stop with N2O (third step of reaction in Equation 1), since the enzymes that operate in the early part of the reaction are less sensitive to the availability of O2 than the reductase enzyme that operates in the last step (N2O to N2) [42]. In addition, the N2O emissions following soil drainage could be due to the release of dissolved and entrapped N2O formed before drainage [4,13]. An increase in N2O fluxes after draining plots is well-known and it has been reported by many other authors [4,5,25,43].
The N2O flux pattern in site 1 was related to changes in soil nitrate and ammonium concentrations (Figure 4a,b). During the flooded period, soil nitrate was very low, with the exception of a short period in June 2013. Denitrifying organisms used N2O as an electron acceptor because of the lack of nitrate, resulting in N2O consumption. After the field was drained, the nitrate concentration increased steadily due to nitrification and denitrification processes. The increase in nitrate concentration in June 2013 was associated with a reduction in floodwater depth to improve rice seedling growth (Figure 2a), which promoted O2 diffusion to the soil and hence, nitrification. This matched the decrease in soil ammonium concentration, at the same time that nitrate increased (Figure 4a,b). After that, nitrate concentration dramatically dropped, probably because of denitrifying process, and the ammonium concentration increased. The cause of the increment in soil ammonium concentration might be the release of ammonium previously fixed in the clay minerals. Anaerobic conditions promote the temporary fixation of NH4+ in the interlayers of clay minerals [44,45,46] because of a net increase in the negative surface charge of the clay [47]. Then, that fixed ammonium can be released, influenced by the concentration of ammonium in the soil solution [44,48]. At the end of the crop season, when the plot was drained, an increase in soil ammonium content was observed, probably due to ammonification, but the ammonium content rapidly decreased at the same time that the nitrate increased, verifying that nitrification took place.
In site 2, the N2O fluxes were negative for the whole period, but values were less negative (close to 0) after the plot was drained (Figure 3b). In site 2, the field was kept flooded for more days than in site 1 (Figure 2a and Figure 3a) and the floodwater only disappeared for a few days, but the soil was kept saturated and a very thin water layer (several millimeters) remained over the soil surface. These findings agree with the study reported by Iida et al. [49], who found that N2O emission can be mitigated considerably by even a thin film of floodwater on paddy fields.
In both sites, the cumulative N2O emissions were negative ranging between −0.04 and −1.10 kg N ha−1 season−1 (Table 4 and Table 5). Simmonds et al. [50] also found negative values of cumulative N2O emissions in a field study conducted in California with the lowest value of −0.19 kg N ha−1 season−1.
Cumulative N2O emissions in both sites were not significantly different between the PS and mineral treatments, thus, in this study, PS fertilization did not increase N2O emissions compared to inorganic fertilization. Other researchers have reported lower N2O emissions from plots fertilized with straw or green manure than those observed in plots fertilized with mineral fertilizers due to the addition of C substrates, which may enhance the final reduction of N2O to N2 by the denitrification process [18,19,25,51]. However, PS has a low C content and thus, its application would be not expected to have a strong influence on N2O emissions in comparison to synthetic N. Indeed, in our study, significant differences in the mean values of N2O fluxes or in the cumulative N2O emissions were not found between treatments with the chemical fertilizer and PS (with low C content). Sasada et al. [28] and Win et al. [23] found similar results in rice experiments with anaerobically digested pig slurry (ADPS) in Japan, where no differences in N2O emissions were found between ADPS and chemical fertilizers.

4.2. Methane Fluxes and Cumulative Emissions

Methane emissions ranged between −0.1 and 26.6 kg CH4-C ha−1 d−1 and from 0.01 to 57.8 kg CH4-C ha−1 d−1 in site 1 and site 2, respectively (Figure 2c and Figure 3c).
Organic matter applied to the fields such as rice straw, soil organic matter (SOM), and organic matter from rice plants (exudates and sloughed tissues) are the carbon sources for CH4 emissions [52,53]. Likewise, organic C contained in PS (Table 3) is an additional source of carbon.
In the present study, at site 1, the average CH4 flux was significantly higher for the PS170M0 treatment (Table 4). This treatment showed an emission peak during the first few weeks after flooding; moreover, another peak was observed in all treatments later in the season. The results suggested that the additional C source applied in the PS170M0 plots promoted higher emissions early in the season. Our results agree with those of Wassmann et al. [54] and Neue et al. [16] in rice field experiments. They found that early in the season, organic amendments provide substrates for methanogenesis, while root exudates become more important at the later growth stages. However, in our study, the PS120M60 treatment did not show higher CH4 emissions than M120M60 (Table 4), even though an additional C source was applied to the soil (Table 2); thus, organic C applied at moderate rates of PS did not seem to be enough to increase the CH4 emissions.
After the final drainage of the plot, methane emission decreased rapidly, as soil started to dry up and oxygen promoted aerobic decomposition of organic matter to carbon dioxide and less methane.
Methane emissions were higher in site 2 than in site 1. Puddling was performed in site 2, but not in site 1. Puddling disperses soil colloids and increases the water-to-soil ratio, resulting in very low bulk densities, promoting reduction. In contrast, high soil bulk density from less intense field preparation retards organic matter decomposition and reduces the speed of potential redox changes as well as CH4 formation [55]. Moreover, SOM in site 2 was higher than that in site 1 (Table 1). Puddling and a higher SOM content could explain the higher CH4 emissions in site 2.
At site 2, methane fluxes were not significantly affected by N fertilization (Table 5), despite the additional C source (Table 2) in the PS treatment compared to the mineral treatment. Although organic amendments may increase CH4 production by providing readily mineralizable carbon sources, these changes are more pronounced when organic substrates are added to soils with low organic matter content [23,55]. Soil at site 1 had lower organic matter content than soil at site 2 (Table 1); therefore, organic C contained in the PS had a stronger influence at site 1 because of the lower SOM content compared to site 2. The results suggested that, in site 2, emissions were more influenced by SOM and land management (puddling) than by C content of fertilizers. These results are in agreement with those reported in the studies by Sasada et al. [28] and Win et al. [23], where differences in the effects of anaerobically digested pig slurry (ADPS) on methane emissions were attributed to the differences in soil C content, suggesting that the application of ADPS might have a higher stimulating effect on CH4 emissions when soil C content is lower.
In contrast to site 1, CH4 fluxes did not decrease immediately after the drainage of the plot, but the emissions decreased slowly (Figure 3c) and the reason was the difference in the drying speed. The field at site 2 remained flooded for more days than that at site 1 (Figure 2a and Figure 3a) and hence, favorable conditions for methanogenesis were maintained.
The mean daily CH4 fluxes ranging between 2.5 and 6.3 kg CH4-C ha−1 d−1 and the maximum flux (27 kg CH4-C ha−1 d−1) reported at site 1 were similar to those reported in the literature for paddy rice fields [24,28,56]. The cumulative emissions for the season are also in accordance with the values in the review by Sanchis et al. [57]. However, the mean daily CH4 fluxes at site 2, ranging between 16.4 and 18.9 kg CH4-C ha−1 d−1 were higher than those in site 1 and higher than those reported in the literature, and hence, cumulative CH4 losses were higher than expected. The reason for these high values could be the absence of the methane oxidation process. Methane emission is a result of two opposite mechanisms, production and oxidation [9,10]. Aerobic oxidation of methane takes place in the soil–water interface of the submerged paddy soil and in the rhizosphere where oxygen is available in a shallow layer around the rice roots [9]. Some studies have reported significant methane oxidation rates during the crop maximum development stages [9,58,59]. In our experiments, plants were cut inside the chambers since the purpose was to measure soil emissions. Thus, methane oxidation in the rhizosphere inside the collars was reduced, increasing methane emissions. Another reason could be the technique used for the quantification of fluxes (photoacoustic spectroscopy—PAS). While some authors reported good results when comparing PAS with gas chromatography (GC) [60,61], other authors found a large effect of water vapor on PAS CH4 readings, concluding that manufacturer calibration for moisture was not sufficient [62,63]. Although we are aware that the absolute CH4 values could be overestimated, we consider that the comparative between PS and mineral treatments, which was the main objective of this study, is reliable.
As expected, the comparative analysis showed that PS applied before seeding at the same rates as the mineral fertilizer (PS120M60 vs. M120M60 in site 1, PS170M0 vs. M170M0 in site 2; Table 4 and Table 5) did not increase methane cumulative emissions.
Other studies have also found no differences in methane emissions when mineral fertilizers are replaced by PS [22] or ADPS [28] at the same N rates. However, opposite results were reported by Huang et al. [29] who found significant CH4 increases when mineral fertilizer was replaced by ADPS and the application was fractioned (40% base, 25% tillering, and 35% heading), but no differences were found when ADPS was applied in a unique application (base fertilization).

4.3. Carbon Dioxide Fluxes and Cumulative Emissions

Carbon dioxide emissions varied from 0.10 to 40 kg CO2-C ha−1 d−1 and between −0.10 and 16.7 kg CO2-C ha−1 d –1 (Figure 2d and Figure 3d) in site 1 and site 2, respectively, and followed an opposite pattern compared to methane emissions.
At site 1, low emissions were recorded during the flooded period and higher emissions were recorded immediately after the drainage of the plot (Figure 2d), which were clearly associated with the aerobic mineralization of organic matter. Unlike CH4 emissions, significant differences between treatments in the mean CO2 flux were not observed; nevertheless, the mean CO2 flux for the PS170M0 treatment was higher (not significant) than that observed for the rest of the treatments (Table 4); and similar to CH4 emissions, the reason was the addition of C with PS.
At site 2, similar to CH4 emissions, the pattern of the CO2 fluxes after the drainage for harvest was totally different than that observed in site 1. While CO2 emissions increased at site 1 (Figure 2d), CO2 fluxes decreased slowly at site 2 (Figure 3d). We consider the soil moisture content to be responsible for this fact, as the soil did not dry up after drainage at site 2, O2 diffusion was restricted, and hence, aerobic decomposition.
It is important to mention that in the present study, emissions were measured only during the crop season and one month after harvesting, thus, further studies including measurements during the whole year would be necessary to evaluate whether there are differences between fertilization treatments in the intercrop period.

5. Conclusions

The characteristics of the soil and land management have a strong influence on GHG emissions, as methane fluxes are higher in paddy fields with higher organic matter content or with continuous puddling tillage practices.
The cumulative nitrous oxide emissions during the crop season were negative at both sites, corroborating that under flooded conditions, methane was the main contributor to GWP rather than nitrous oxide. GHG emissions were not affected by the application of pig slurry at the same N rate as the mineral fertilizer. However, application of high PS rates before seeding to a soil with low SOM increased methane emissions in comparison to mineral fertilization. Therefore, application of PS before seeding at rates to cover about 70% of crop N needs and N topdressing to complement crop requirements are recommended in order not to increase methane emissions. Taking into account this consideration, PS might be an excellent fertilizer for replacing synthetic fertilizers without jeopardizing the sustainability of rice systems.

Supplementary Materials

The following are available online at https://www.mdpi.com/2073-4395/10/4/493/s1, Table S1: Grain yield (14% moisture) for the different N fertilization treatments in site 1 (Villanueva de Sigena) and site 2 (Grañén). Table S2: N, P2O5 (Olsen), and K2O (ammonium acetate) amounts in the 0–0.3 m soil depth at the beginning of each experiment and the nutrient amounts applied with the fertilizers (PS or mineral). Figure S1: (a) N2O and (b) CH4 concentrations over time on 6 August 2014 for a replicate of the PS170M0 treatment in site 2 (Grañén).

Author Contributions

B.M.-G. was responsible for field data acquisition, laboratory analysis, data analysis, and wrote the manuscript draft. M.G. was responsible for field data acquisition and laboratory analysis. D.Q. was responsible for funding acquisition and directed the study. All authors have read and agreed to the published version of the manuscript.

Funding

This study was funded by the National Institute for Agricultural and Food Scientific Research and Technology of Spain (INIA), the Government of Aragón, FEDER, and FEADER funds (RTA2010-0126-C02-01, RTA2013-0057-C05-04 and DRU-2014-02-50-541-00-IFO-00740020007). B. Moreno-García was granted with an FPI-INIA fellowship.

Acknowledgments

We thank the field and laboratory personnel of the Soils and Irrigation Department of CITA.

Conflicts of Interest

The authors declare no conflicts of interest.

References

  1. Smith, P.; Bustamante, M.; Ahammad, H.; Clark, H.; Dong, H.; Elsiddig, E.A.; Haberl, H.; Harper, R.; House, J.; Jafari, M.; et al. Agriculture, Forestry and Other Land Use (AFOLU). In Climate Change 2014: Mitigation of Climate Change. Contribution of Working Group III to the Fifth Assessment Report of the Intergovernmental Panel on Climate Change; Edenhofer, O., Pichs-Madruga, R., Sokona, Y., Farahani, E., Kadner, S., Seyboth, K., Adier, A., Baum, I., Brunner, S., Eickemeier, P., Eds.; Cambrige University Press: Cambridge, UK; New York, NY, USA, 2014. [Google Scholar]
  2. Ciais, P.; Sabine, C.; Baia, G.; Boop, L.; Brovkin, V.; Canadell, J.; Chhabra, A.; DeFries, R.; Galloway, J.; Heimann, M.; et al. Carbon and Other Biogeochemical Cycles. In Climate Change 2013: The Physical Science Basis. Contribution of Working Group I to the Fifth Assesment Report of the Intergovernmental Panel on Climate Change; Stocker, T.F., Win, D., Plattner, G.K., Tignor, M., Allen, S.K., Boschung, J., Nauels, A., Xia, Y., Bex, V., Midgley, P.M., Eds.; Chambridge University Press: Cambridge, UK; New York, NY, USA, 2013. [Google Scholar]
  3. Linquist, B.A.; van Groenigen, K.J.; Adviento-Borbe, M.A.; Pittelkow, C.; Kessel, C. An Agronomic Assessment of Greenhouse Gas Emissions from Major Cereal Crops. Glob. Chang. Biol. 2012, 18, 194–209. [Google Scholar] [CrossRef]
  4. Cai, Z.C.; Xing, G.X.; Yan, X.Y.; Xu, H.; Tsuruta, H.; Yagi, K.; Minami, K. Methane and Nitrous Oxide Emissions from Rice Paddy Fields as Affected by Nitrogen Fertilisers and Water Management. Plant Soil 1997, 196, 7–14. [Google Scholar] [CrossRef]
  5. Lagomarsino, A.; Agnelli, A.E.; Linquist, B.; Adviento-Borbe, M.A.; Agnelli, A.; Gavina, G.; Ravaglia, S.; Ferrara, R.M. Alternate Wetting and Drying of Rice Reduced CH4 Emissions but Triggered N2O Peaks in a Clayey Soil of Central Italy. Pedosphere 2016, 26, 533–548. [Google Scholar] [CrossRef]
  6. Zou, J.; Huang, Y.; Jiang, J.; Zheng, X.; Sass, R.L. A 3-Year Field Measurement of Methane and Nitrous Oxide Emissions from Rice Paddies in China: Effects of Water Regime, Crop Residue, and Fertilizer Application. Glob. Biogeochem. Cycles 2005, 19, 1–9. [Google Scholar] [CrossRef]
  7. Wrage, N.; Velthof, G.L.; van Beusichem, M.L.; Oenema, O. Role of Nitrifier Denitrification in the Production of Nitrous Oxide. Soil Biol. Biochem. 2001, 33, 1723–1732. [Google Scholar] [CrossRef]
  8. Coyne, M.S. Biological Denitrification. In Nitrogen in Agricultural Systems; Schepers, J.S., Raun, W.R., Eds.; American Society of Agronomy, Crop Science Society of America, Soil Science Society of America: Madison, WI, USA, 2008; pp. 201–253. [Google Scholar]
  9. Helmut, S.; Seiler, W.; Conrad, R. Processes Involved in Formation and Emission of Methane in Rice Paddies. Biogeochemistry 1989, 7, 33–53. [Google Scholar]
  10. Wassmann, R.; Aulakh, M.S. The Role of Rice Plants in Regulating Mechanisms of Methane Emissions. Biol. Fertil. Soils 2000, 31, 20–29. [Google Scholar] [CrossRef]
  11. Ponnamperuma, F.N. The Chemistry of Submerged Soils. In Advances in Agronomy; Brady, N.C., Ed.; Academic Press: Cambridge, MA, USA, 1972. [Google Scholar]
  12. Goyal, S.; Sakamoto, K.; Inubushi, K.; Kamewada, K. Long-Term Effects of Inorganic Fertilization and Organic Amendments on Soil Organic Matter and Soil Microbial Properties in Andisols. Arch. Agron. Soil Sci. 2006, 52, 617–625. [Google Scholar] [CrossRef]
  13. Buresh, R.J.; Reddy, K.R.; van Kessel, C. Nitrogen Transformations in Submerged Soils. In Nitrogen in Agricultural Systems; Schepers, J.S., Raun, W.R., Eds.; American Society of Agronomy, Crop Science Society of America, Soil Science Society of America: Madison, WI, USA, 2008; pp. 401–436. [Google Scholar]
  14. Conrad, R. Soil Microorganisms as Controllers of Atmospheric Trace Gases (H2, CO, CH4, OCS, N2O, and No). Microbiol. Rev. 1996, 60, 609–640. [Google Scholar] [CrossRef]
  15. Linquist, B.A.; Adviento-Borbe, M.A.; Pittelkow, C.M.; van Kessel, C.; van Groenigen, K.J. Fertilizer Management Practices and Greenhouse Gas Emissions from Rice Systems: A Quantitative Review and Analysis. Field Crops Res. 2012, 135, 10–21. [Google Scholar] [CrossRef]
  16. Neue, H.U.; Wassmann, R.; Lantin, R.S.; Alberto, M.C.R.; Aduna, J.B.; Javellana, A.M. Factors Affecting Methane Emission from Rice Fields. Atmos. Environ. 1996, 30, 1751–1754. [Google Scholar] [CrossRef]
  17. Bossio, D.A.; Horwath, W.R.; Mutters, R.G.; van Kessel, C. Methane Pool and Flux Dynamics in a Rice Field Following Straw Incorporation. Soil Biol. Biochem. 1999, 31, 1313–1322. [Google Scholar] [CrossRef]
  18. Bronson, K.F.; Neue, H.U.; Singh, U.; Abao, E.B. Automated Chamber Measurements of Methane and Nitrous Oxide Flux in a Flooded Rice Soil.1. Residue, Nitrogen, and Water Management. Soil Sci. Soc. Am. J. 1997, 61, 981–987. [Google Scholar] [CrossRef]
  19. Aulakh, M.S.; Khera, T.S.; Doran, J.W.; Bronson, K.F. Denitrification, N2O and CO2 Fluxes in Rice-Wheat Cropping System as Affected by Crop Residues, Fertilizer N and Legume Green Manure. Biol. Fertil. Soils 2001, 34, 375–389. [Google Scholar] [CrossRef]
  20. Denier van der Gon, H.A.C.; Neue, H.U. Influence of Organic Matter Incorporation on the Methane Emission from a Wetland Rice Field. Glob. Biogeochem. Cycles 1995, 9, 11–22. [Google Scholar] [CrossRef] [Green Version]
  21. Liang, X.Q.; Li, H.; Wang, S.X.; Ye, Y.S.; Ji, Y.J.; Tian, G.M.; van Kessel, C.; Linquist, B.A. Nitrogen Management to Reduce Yield-Scaled Global Warming Potential in Rice. Field Crops Res. 2013, 146, 66–74. [Google Scholar] [CrossRef]
  22. Maris, S.C.; Teira-Esmatges, M.R.; Bosch-Serra, A.D.; Moreno-García, B.; Català, M.M. Effect of Fertilising with Pig Slurry and Chicken Manure on GHG Emissions from Mediterranean Paddies. Sci. Total Environ. 2016, 569, 306–320. [Google Scholar] [CrossRef] [Green Version]
  23. Win, A.T.; Toyota, K.; Win, K.T.; Motobayashi, T.; Ookawa, T.; Hirasawa, T.; Chen, D.; Lu, J. Effect of Biogas Slurry Application on CH4 and N2O Emissions, Cu and Zn Uptakes by Whole Crop Rice in a Paddy Field in Japan. Soil Sci. Plant Nutr. 2014, 60, 411–422. [Google Scholar] [CrossRef]
  24. Schütz, H.; Holzapfel-Pschorn, A.; Conrad, R.; Rennenberg, H.; Seiler, W. A 3-Year Continuous Record on the Influence of Daytime, Season, and Fertilizer Treatment on Methane Emission Rates from an Italian Rice Paddy. J. Geophys. Res. Atmos. 1989, 94, 16405–16416. [Google Scholar] [CrossRef]
  25. Wang, J.Y.; Jia, J.X.; Xiong, Z.Q.; Khalil, M.A.K.; Xing, G.X. Water Regime-Nitrogen Fertilizer-Straw Incorporation Interaction: Field Study on Nitrous Oxide Emissions from a Rice Agroecosystem in Nanjing, China. Agric. Ecosyst. Environ. 2011, 141, 437–446. [Google Scholar] [CrossRef]
  26. Tinarelli, A. El Arroz; Mundi-Prensa: Madrid, Spain, 1989. [Google Scholar]
  27. Yagüe, M.R. El Purín Como Fertilizante: Agronomía E Implicaciones Ambientales. Ph.D. Thesis, Universidad de Lleida, Lleida, Spain, 2006. [Google Scholar]
  28. Sasada, Y.; Win, K.T.; Nonaka, R.; Win, A.T.; Toyota, K.; Motobayashi, T.; Hosomi, M.; Dingjiang, C.; Lu, J. Methane and N2O Emissions, Nitrate Concentrations of Drainage Water, and Zinc and Copper Uptake by Rice Fertilized with Anaerobically Digested Cattle or Pig Slurry. Biol. Fertil. Soils 2011, 47, 949–956. [Google Scholar] [CrossRef]
  29. Huang, H.Y.; Cao, J.L.; Wu, H.S.; Ye, X.M.; Ma, Y.; Yu, J.G.; Shen, Q.R.; Chang, Z.Z. Elevated Methane Emissions from a Paddy Field in Southeast China Occur after Applying Anaerobic Digestion Slurry. Glob. Chang. Biol. Bioenergy 2014, 6, 465–472. [Google Scholar] [CrossRef]
  30. Moreno-García, B.; Guillén, M.; Quílez, D. Response of Paddy Rice to Fertilisation with Pig Slurry in Northeast Spain: Strategies to Optimise Nitrogen Use Efficiency. Field Crops Res. 2017, 208, 44–54. [Google Scholar] [CrossRef]
  31. Piccinini, S.; Bortone, G. The Fertilizer Value of Agricultural Manure: Simple Rapid Methods of Assessment. J. Agric. Eng. Res. 1991, 49, 197–208. [Google Scholar] [CrossRef]
  32. Yagüe, M.R.; Quílez, D. On-Farm Measurement of Electrical Conductivity for the Estimation of Ammonium Nitrogen Concentration in Pig Slurry. J. Environ. Qual. 2012, 41, 893–900. [Google Scholar] [CrossRef] [PubMed] [Green Version]
  33. Arias-Navarro, C.; Díaz-Pinés, E.; Kiese, R.; Rosenstock, T.S.; Rufino, M.C.; Stern, D.; Neufeldt, H.; Verchot, L.V.; Butterbach-Bahl, K. Gas Pooling: A Sampling Technique to Overcome Spatial Heterogeneity of Soil Carbon Dioxide and Nitrous Oxide Fluxes. Soil Biol. Biochem. 2013, 67, 20–23. [Google Scholar] [CrossRef]
  34. Spanish Association for Standardization (AENOR). ISO 13395:1997: Water Quality. Determination of Nitrite Nitrogen and Nitrate Nitrogen and the Sum of Both by Flow Analysis (CFA and FIA) and Spectrometric Detection. ISO Standard; Spanish Association for Standardization (AENOR): Madrid, Spain, 1997. [Google Scholar]
  35. Spanish Association for Standardization (AENOR). ISO 11732:2005: Water Quality—Determination of Ammonium Nitrogen—Method by Flow Analysis (CFA and FIA) and Spectrometric Detection. ISO Standard; Spanish Association for Standardization (AENOR): Madrid, Spain, 2005. [Google Scholar]
  36. Janssen, M.; Lennartz, B. Horizontal and Vertical Water and Solute Fluxes in Paddy Rice Fields. Soil Tillage Res. 2007, 94, 133–141. [Google Scholar] [CrossRef]
  37. Lennartz, B.; Horn, R.; Duttmann, R.; Gerke, H.H.; Tippkötter, R.; Eickhorst, T.; Janssen, I.; Janssen, M.; Rüth, B.; Sander, T.; et al. Ecological Safe Management of Terraced Rice Paddy Landscapes. Soil Tillage Res. 2009, 102, 179–192. [Google Scholar] [CrossRef]
  38. Berger, S.; Jang, I.; Seo, J.; Kang, H.; Gebauer, G. A Record of N2O and CH4 Emissions and Underlying Soil Processes of Korean Rice Paddies as Affected by Different Water Management Practices. Biogeochemistry 2013, 115, 317–332. [Google Scholar] [CrossRef]
  39. Ferré, C.; Zechmeister-Boltenstern, S.; Comolli, R.; Andersson, M.; Seufert, G. Soil Microbial Community Structure in a Rice Paddy Field and Its Relationships to CH4 and N2O Fluxes. Nutr. Cycl. Agroecosystems 2012, 93, 35–50. [Google Scholar] [CrossRef]
  40. Kögel-Knabner, I.; Amelung, W.; Cao, Z.; Fiedler, S.; Frenzel, P.; Jahn, R.; Kalbitz, K.; Kölbl, A.; Schloter, M. Biogeochemistry of Paddy Soils. Geoderma 2010, 157, 1–14. [Google Scholar] [CrossRef]
  41. Poth, M.; Focht, D.D. 15N Kinetic Analysis of N2O Production by Nitrosomonas Europaea: An Examination of Nitrifier Denitrification. Appl. Environ. Microbiol. 1985, 49, 1134–1141. [Google Scholar] [CrossRef] [PubMed] [Green Version]
  42. Cameron, K.C.; Di, H.J.; Moir, J.L. Nitrogen Losses from the Soil/Plant System: A Review. Ann. Appl. Biol. 2013, 162, 145–173. [Google Scholar] [CrossRef]
  43. Pittelkow, C.M.; Adviento-Borbe, M.A.; Hill, J.E.; Six, J.; van Kessel, C.; Linquist, B.A. Yield-Scaled Global Warming Potential of Annual Nitrous Oxide and Methane Emissions from Continuously Flooded Rice in Response to Nitrogen Input. Agric. Ecosyst. Environ. 2013, 177, 10–20. [Google Scholar] [CrossRef]
  44. Schneiders, M.; Scherer, H.W. Fixation and Release of Ammonium in Flooded Rice Soils as Affected by Redox Potential. Eur. J. Agron. 1998, 8, 181–189. [Google Scholar] [CrossRef]
  45. Zhang, Y.S.; Scherer, H.W. Ammonium Fixation by Clay Minerals in Different Layers of Two Paddy Soils after Flooding. Biol. Fertil. Soils 1999, 29, 152–156. [Google Scholar] [CrossRef]
  46. Zhang, Y.; Scherer, H.W. Mechanisms of Fixation and Release of Ammonium in Paddy Soils after Flooding II. Effect of Transformation of Nitrogen Forms on Ammonium Fixation. Biol. Fertil. Soils 2000, 31, 517–521. [Google Scholar] [CrossRef]
  47. Stucki, J.W.; Golden, D.C.; Roth, C.B. Effects of Reduction and Reoxidation of Structural Iron on the Surface Charge and Dissolution of Dioctahedral Smectites. Clays Clay Miner. 1984, 32, 350–356. [Google Scholar] [CrossRef]
  48. Mengel, K.; Horn, D.; Tributh, H. Availability of Interlayer Ammonium as Related to Root Vicinity and Mineral Type. Soil Sci. 1990, 149, 131–137. [Google Scholar] [CrossRef]
  49. Iida, T.; Deb, S.K.; Kharbuja, R.G. Nitrous Oxide Emission Measurement with Acetylene Inhibition Method in Paddy Fields under Flood Conditions. Paddy Water Environ. 2007, 5, 83–91. [Google Scholar] [CrossRef]
  50. Simmonds, M.B.; Anders, M.; Adviento-Borbe, M.A.; van Kessel, C.; McClung, A.; Linquist, B.A. Seasonal Methane and Nitrous Oxide Emissions of Several Rice Cultivars in Direct-Seeded Systems. J. Environ. Qual. 2015, 44, 103–114. [Google Scholar] [CrossRef] [PubMed]
  51. Qin, Y.; Liu, S.; Guo, Y.; Liu, Q.; Zou, J. Methane and Nitrous Oxide Emissions from Organic and Conventional Rice Cropping Systems in Southeast China. Biol. Fertil. Soils 2010, 46, 825–834. [Google Scholar] [CrossRef]
  52. Kimura, M.; Murase, J.; Lu, Y. Carbon Cycling in Rice Field Ecosystems in the Context of Input, Decomposition and Translocation of Organic Materials and the Fates of Their End Products (CO2 and CH4). Soil Biol. Biochem. 2004, 36, 1399–1416. [Google Scholar] [CrossRef]
  53. Watanabe, A.; Takeda, T.; Kimura, M. Evaluation of Origins of Ch4 Carbon Emitted from Rice Paddies. J. Geophys. Res. 1999, 104, 23623–23629. [Google Scholar] [CrossRef]
  54. Wassmann, R.; Neue, H.U.; Alberto, M.C.R.; Lantin, R.S.; Bueno, C.; Llenaresas, D.; Arah, J.R.M.; Papen, H.; Seiler, W.; Rennenberg, H. Fluxes and Pools of Methane in Wetland Rice Soils with Varying Organic Inputs. Environ. Monit. Assess. 1996, 42, 163–173. [Google Scholar] [CrossRef] [PubMed]
  55. Neue, H.U. Fluxes of Methane from Rice Fields and Potential for Mitigation. Soil Use Manag. 1997, 13, 258–267. [Google Scholar] [CrossRef]
  56. Cicerone, R.J.; Shetter, J.D.; Delwiche, C.C. Seasonal Variation of Methane Flux from a California Rice Paddy. J. Geophys. Res. Ocean. 1983, 88, 11022–11024. [Google Scholar] [CrossRef] [Green Version]
  57. Sanchis, E.; Ferrer, M.; Torres, A.G.; Cambra-López, M.; Calvet, S. Effect of Water and Straw Management Practices on Methane Emissions from Rice Fields: A Review through a Meta-Analysis. Environ. Eng. Sci. 2012, 29, 1053–1062. [Google Scholar] [CrossRef]
  58. Banker, B.C.; Kludze, H.K.; Alford, D.P.; DeLaune, R.D.; Lindau, C.W. Methane Sources and Sinks in Paddy Rice Soils: Relationship to Emissions. Agric. Ecosyst. Environ. 1995, 53, 243–251. [Google Scholar] [CrossRef]
  59. Tyler, S.C.; Bilek, R.S.; Sass, R.L.; Fisher, F.M. Methane Oxidation and Pathways of Production in a Texas Paddy Field Deduced from Measurements of Flux, Δl3c, and Δd of CH4. Glob. Biogeochem. Cycles 1997, 11, 323–348. [Google Scholar] [CrossRef]
  60. Iqbal, J.; Castellano, M.J.; Parkin, T.B. Evaluation of Photoacoustic Infrared Spectroscopy for Simultaneous Measurement of N2O and CO2 Gas Concentrations and Fluxes at the Soil Surface. Glob. Chang. Biol. 2013, 19, 327–336. [Google Scholar] [CrossRef] [PubMed] [Green Version]
  61. Yamulki, S.; Jarvis, S.C. Automated Chamber Technique for Gaseous Flux Measurements: Evaluation of a Photoacoustic Infrared Spectrometer-Trace Gas Analyzer. J. Geophys. Res. D Atmos. 1999, 104, 5463–5469. [Google Scholar] [CrossRef] [Green Version]
  62. Rosenstock, T.S.; Diaz-Pines, E.; Zuazo, P.; Jordan, G.; Predotova, M.; Mutuo, P.; Abwanda, S.; Thiong’o, M.; Buerkert, A.; Rufino, M.C.; et al. Accuracy and Precision of Photoacoustic Spectroscopy Not Guaranteed. Glob. Chang. Biol. 2013, 19, 3565–3567. [Google Scholar] [CrossRef] [PubMed]
  63. Tirol-Padre, A.; Rai, M.; Gathala, M.; Sharma, S.; Kumar, V.; Sharma, P.C.; Sharma, D.K.; Wassmann, R.; Ladha, J. Assessing the Performance of the Photo-Acoustic Infrared Gas Monitor for Measuring CO2, N2O, and CH4 Fluxes in Two Major Cereal Rotations. Glob. Chang. Biol. 2013. [Google Scholar]
Figure 1. Locations and experimental designs of the two experiments at Villanueva de Sigena and Grañén.
Agronomy 10 00493 g001
Figure 2. Site 1 (Villanueva de Sigena) year 2013. (a) Soil and air temperature, rainfall, and floodwater depth during the studied period; and (b) N2O, (c) CH4, and (d) CO2 emissions as affected by the fertilization treatment. Vertical arrows indicate the dates of fertilization applications (F) and harvest (H). The grey shaded areas represent the periods in which the water inflow to the field was open. Note that once water was stopped, the field remained flooded for several days.
Agronomy 10 00493 g002
Figure 3. Site 2 (Grañén) year 2014. (a) Soil and air temperature, rainfall, and floodwater depth during the studied period; and (b) N2O, (c) CH4, and (d) CO2 emissions as affected by the fertilization treatments. Vertical arrows indicate the dates of fertilization applications (F) and harvest (H). The grey shaded areas represent the periods in which the water inflow to the field was open. Note that once water was stopped, the field remained flooded for several days.
Agronomy 10 00493 g003
Figure 4. Site 1 (Villanueva de Sigena) year 2013. Soil (0–0.1 m) (a) nitrate and (b) ammonium concentration during the studied period as affected by the fertilization treatment. Vertical arrows indicate the dates of fertilization applications (F) and harvest (H). The grey shaded areas represent the periods in which the water inflow to the plot was open.
Agronomy 10 00493 g004
Table 1. Main site and soil characteristics in the 0–0.3 m soil depth at the beginning of the experiments at the two experimental sites. ET0 is the Penman- Monteith reference evapotranspiration.
Site and Soil CharacteristicsSite 1
Villanueva de Sigena
Site 2
Grañén
Previous years growing rice3>15
PuddlingNoYes
Latitude41° 45’ 31.87’’ N41° 57’ 29.97’’ N
Longitude0° 2’ 18.16’’ W0° 22’ 37.56’’ W
Elevation (m)250332
Annual precipitation (mm) †347334
Mean annual air temperature (°C) †14.613.5
Annual ET0 (mm) †12011194
pH (1:2.5, water extract)8.58.3
Electrical conductivity of saturated paste extract
(ECe, dS m−1)
0.84.9
Organic matter (Walkley–Black; % dry matter)1.012.06
Calcium carbonate eq. (% dry matter)2924
NO3 (potassium chloride extract; mg kg−1 dry soil)11.7914.99
NH4+ (potassium chloride extract; mg kg−1 dry soil)6.0710.87
Olsen P (mg kg−1 dry soil)638.2
K (ammonium acetate extract; mg kg−1 dry soil)81224
Particle size distribution (%)
Sand (2000–50 µm) 13.416.4
Silt (50–2 µm)66.254.1
Clay (<2 µm)20.429.5
USDA textural classSilty loamSilty clay loam
† Climatic data are average values over the last ten years
Table 2. N fertilization treatments in the two experimental sites. N rates for pig slurry (PS) treatments are the actual N rates applied in the field.
NH4+-NOrganic N Organic C NH4+-NNH4+-NTotal N
kg ha−1kg ha−1kg ha−1
SiteTreatments Before SeedingTopdressingGrowing Season
1Control (C)---- --------
M120M60120 †----60 †180180
PS120M60109 ‡9266360 †169261
PS170M0165 ‡1401007--165305
2Control (C)---- --------
M170M0170 ¥-- ----170170
PS170M0171 ‡45824--171216
† Ammonium sulfate, ‡ pig slurry, ¥ urea
Table 3. Physicochemical characteristics of the PS applied at each site.
Site 1
Villanueva de Sigena
Site 2
Grañén
Specific weight (g L−1)10451021
Dry matter (kg mg−1)9423
Organic C (kg mg−1)18.58 †9.13
Ammonium N (kg mg−1)3.051.89
Total N (Kjeldahl, kg mg−1)5.632.39
P2O5 (acid extraction, kg mg−1)4.090.3
K2O (acid extraction, kg mg−1)3.571.96
† Organic C in site 1 was not measured and was estimated based on the average C/N ratio, from Yagüe et al. [27] for fattening farms, equal to 3.3.
Table 4. Site 1 (Villanueva de Sigena, 2013). Average fluxes of N2O, CH4, and CO2 and cumulative N2O, CH4, and CO2 emissions during the studied period, for the different N fertilization treatments, indicating the effects of treatment (T), date of sampling (D), and their interaction (T × D).
Gas FluxesCumulative Emissions
N2O-NCH4-CCO2-CN2O-NCH4-CCO2-C
g ha−1 d−1kg ha−1 d−1kg N ha−1 kg C ha−1
Treatments (T)n.s***n.s.n.s.n.s.n.s.
Control (C)−3.922.47 b6.76−0.71549.11571.0
M120M60−2.332.99 b7.87−0.45665.11959.1
PS120M60−0.453.52 b6.52−0.04869.91619.6
PS170M0−3.246.31 a9.15−0.511336.42036.1
Date (D)*********
T * Dn.s.n.s.n.s.
Note: n.s., not significant; *** p < 0.001. Different letters in the same column indicate significant differences between treatments.
Table 5. Site 2 (Grañén, 2014). Average fluxes of N2O, CH4, and CO2 and cumulative N2O, CH4, and CO2 emissions during the studied period, for the different N fertilization treatments, indicating the effects of treatment (T), date of sampling (D), and their interaction (T * D).
Gas FluxesCumulative Emissions
N2O-NCH4-CCO2-CN2O-NCH4-CCO2-C
g ha−1 d−1kg ha−1 d−1kg N ha−1 kg C ha−1
Treatments (T)n.s.n.s.n.s.n.s.n.s.n.s.
Control (C)−5.4518.817.04−1.203986.81329.1
M170M0−5.2016.436.68−1.093701.91330.7
PS170M0−5.0518.926.45−1.104326.31254.1
Date (D)*********
T * Dn.s.n.s.n.s.
Note: n.s., not significant; *** p < 0.001.

