Differences in Biomass Production and Water Use Efficiency among Seven Different Cover Crops in the Wet Winter Seasons of 2016/17 and 2018 in South Carolina
Abstract
1. Introduction
2. Materials and Methods
Statistical Analysis
3. Results
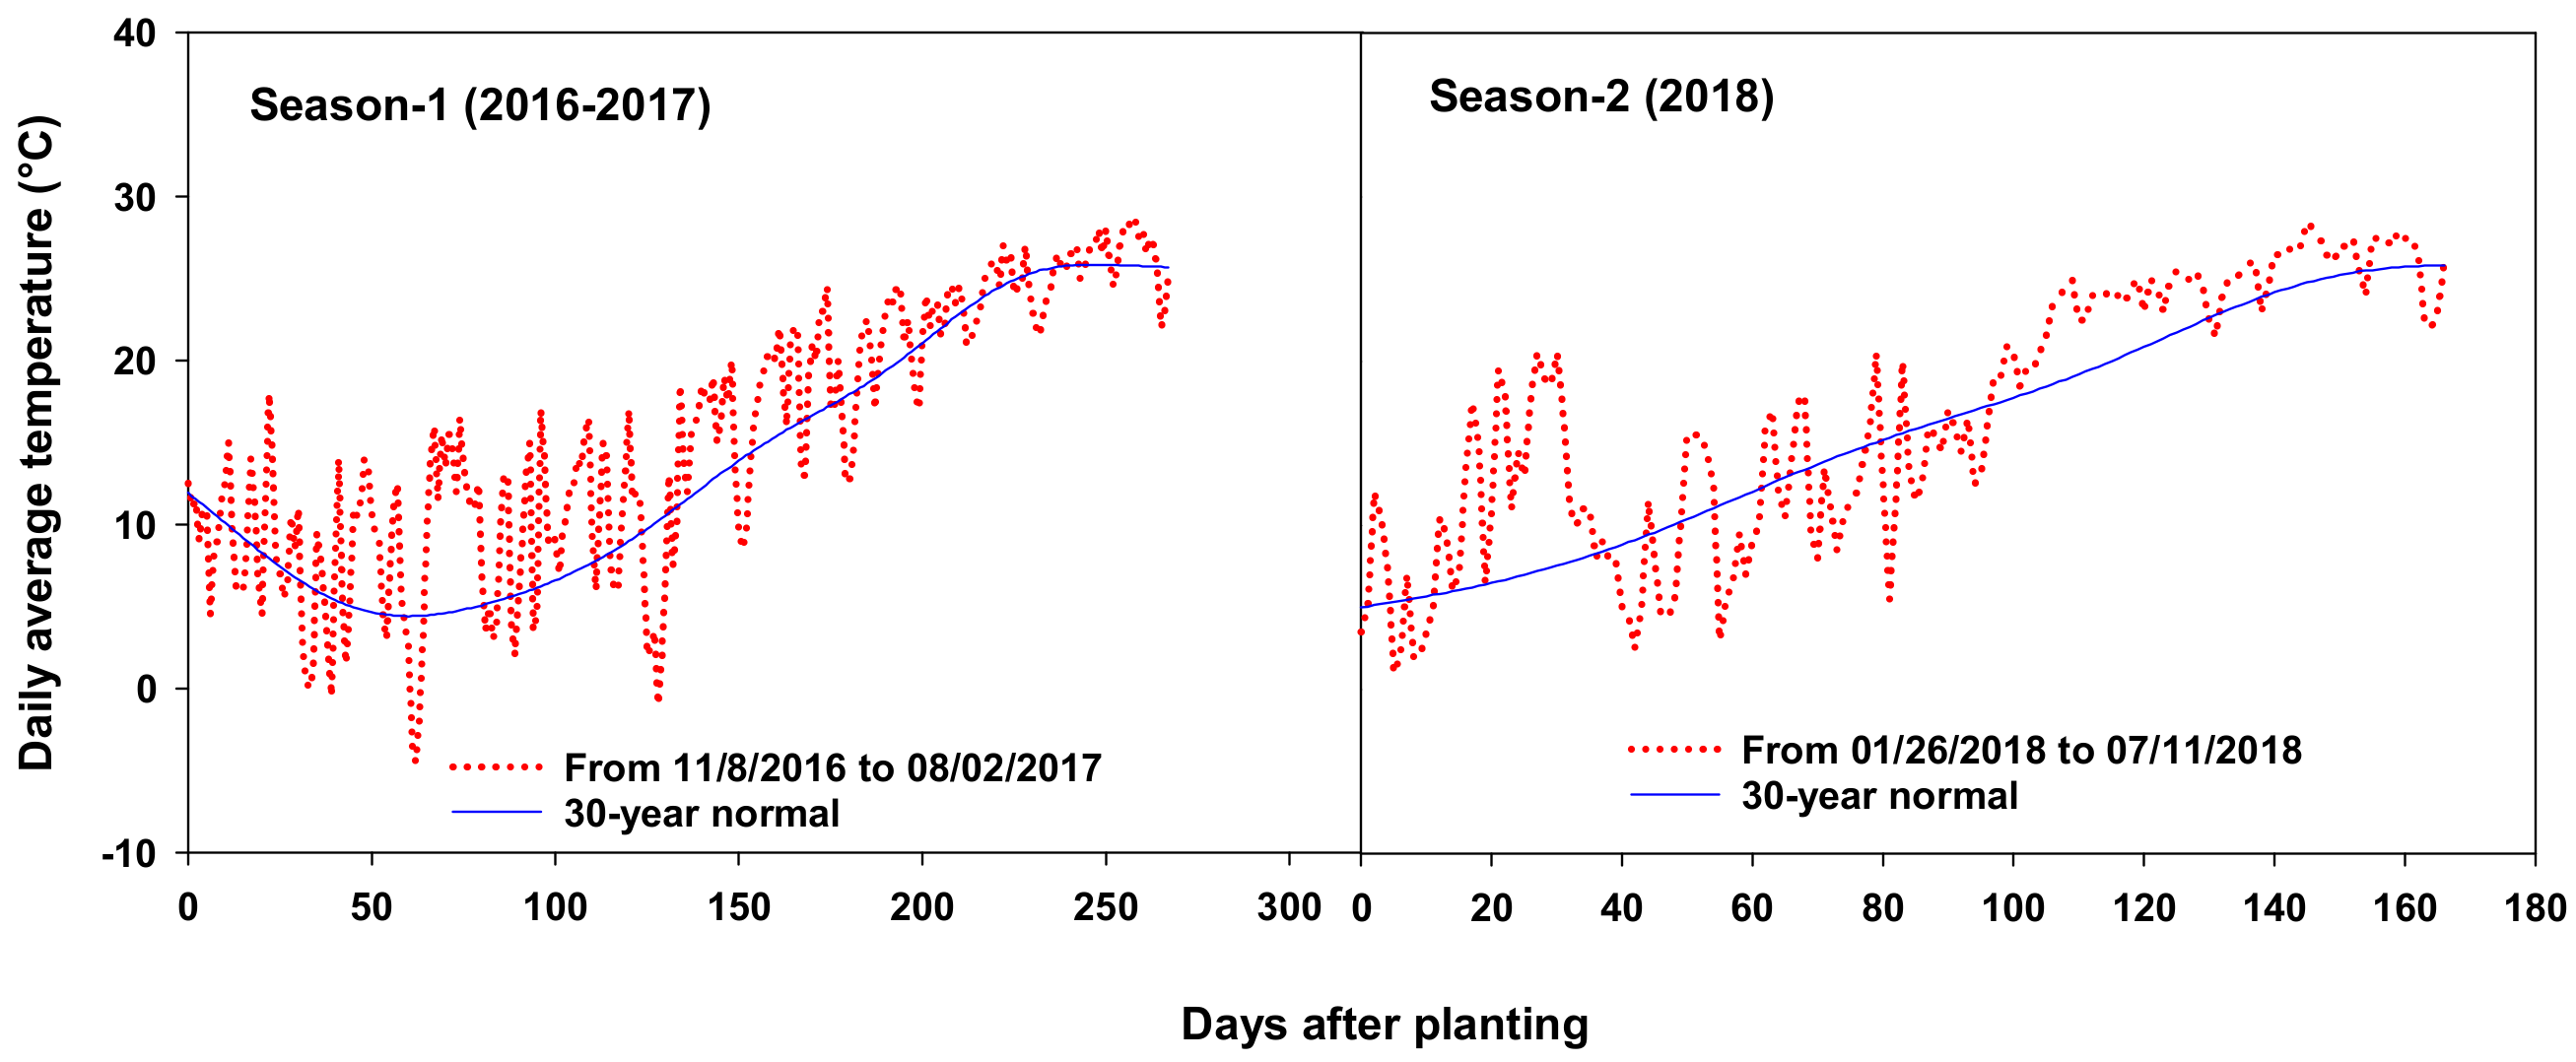
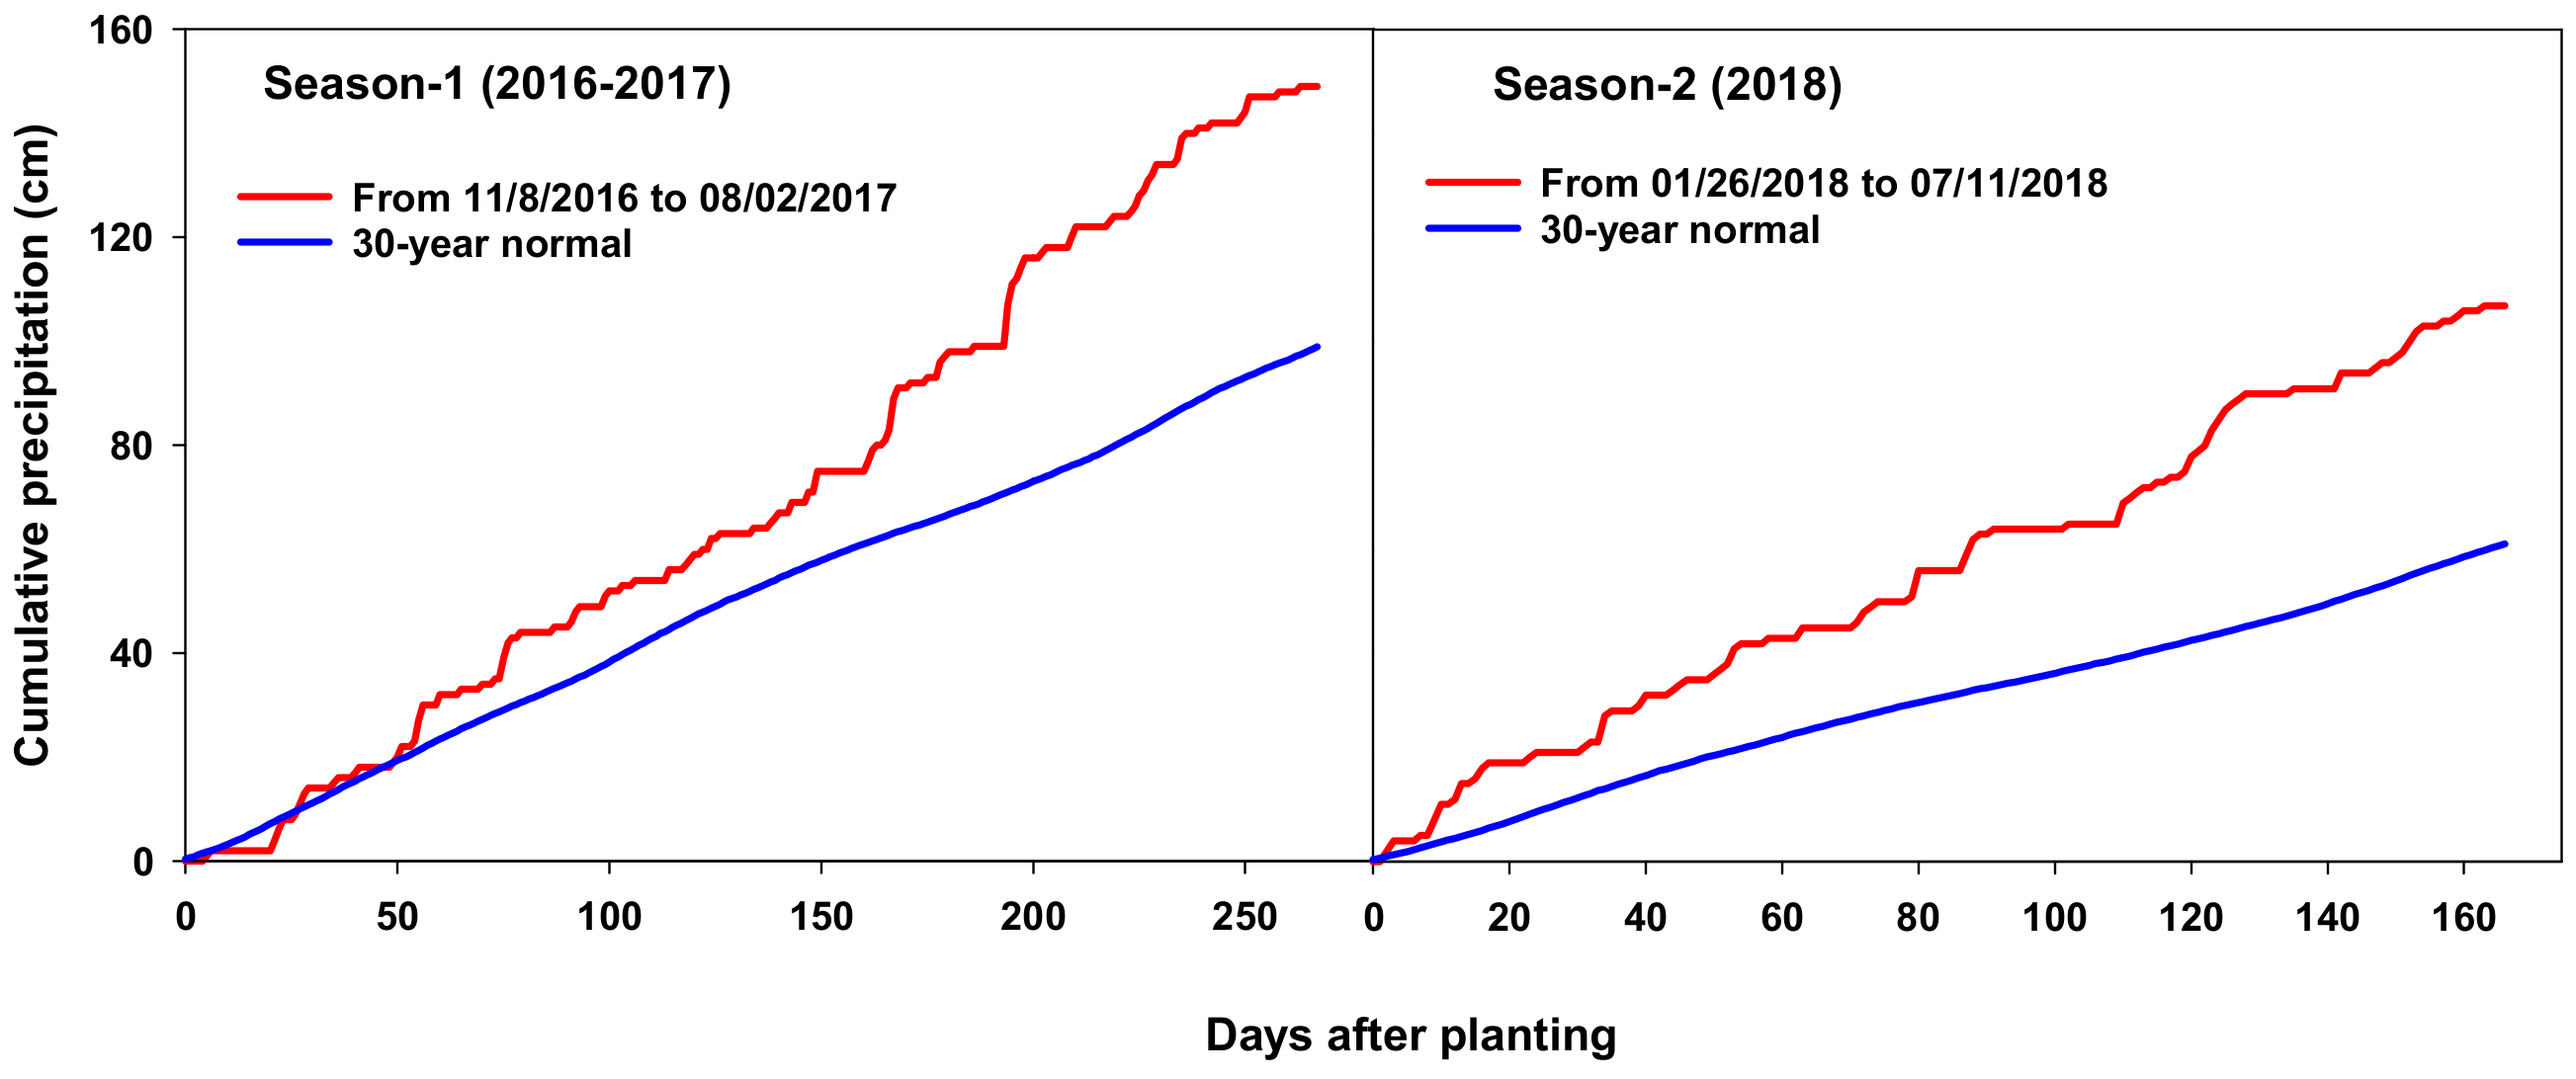
3.1. Environmental Conditions
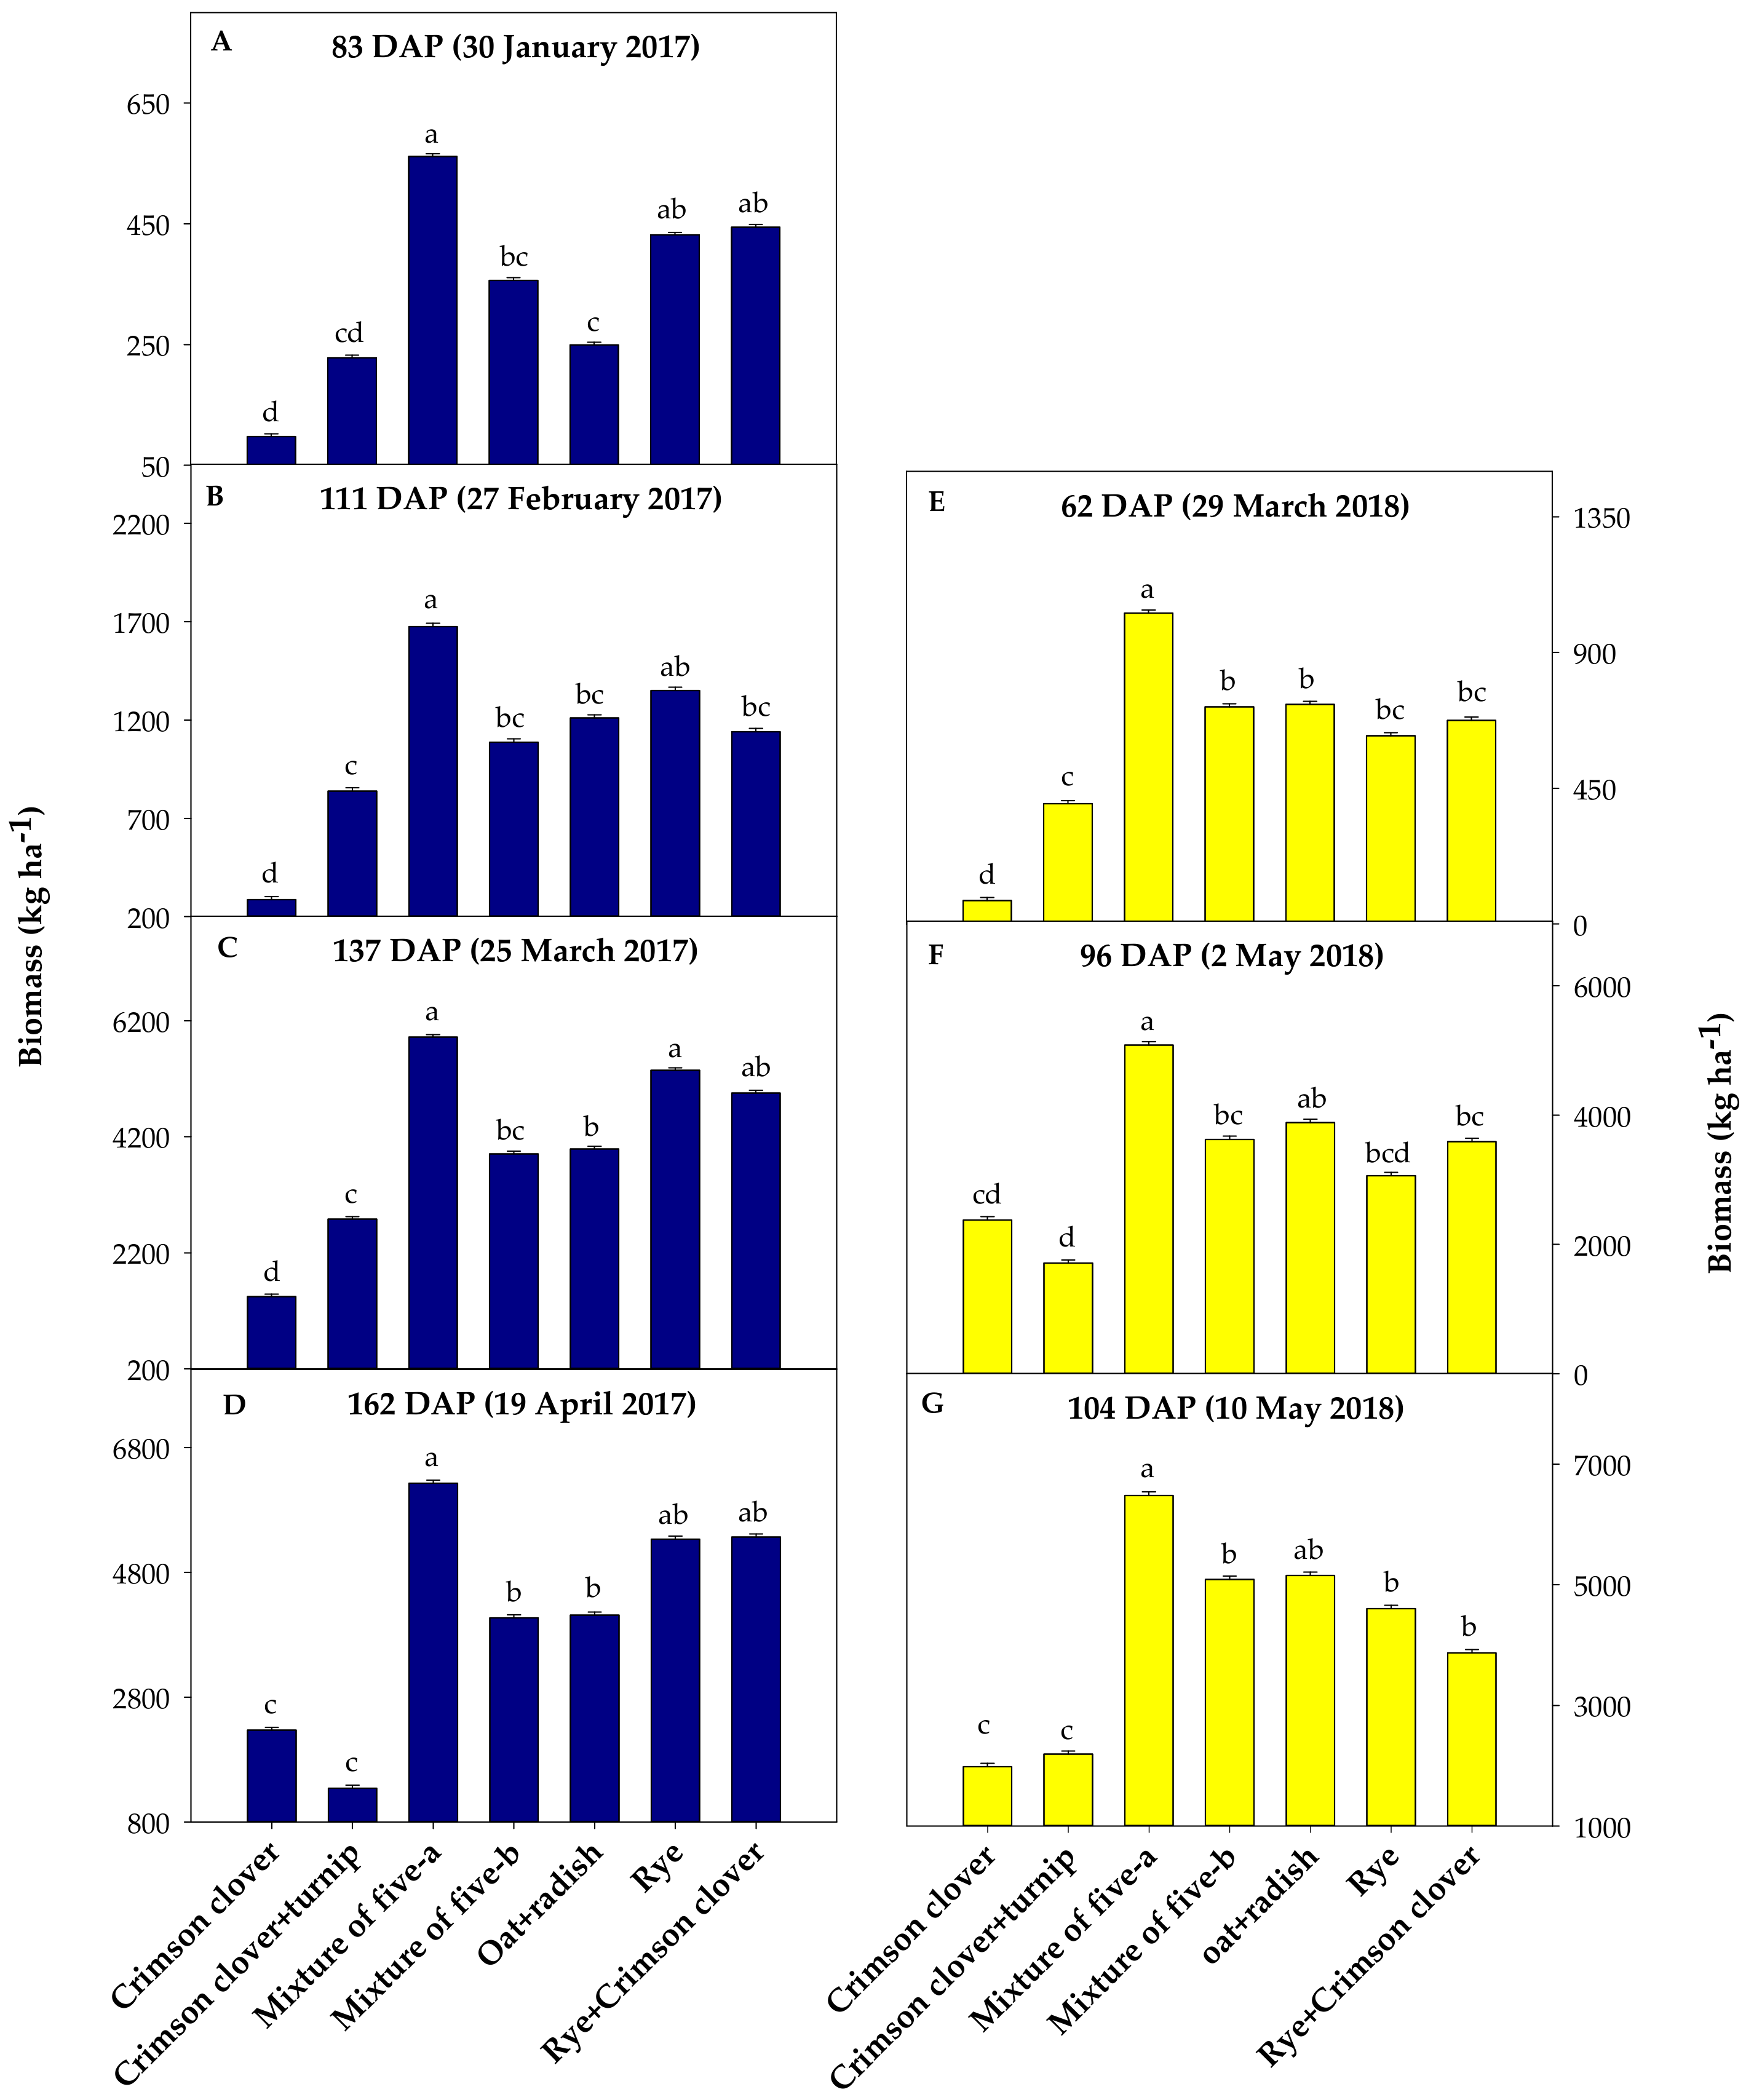
3.2. Cover Crop Growth and Biomass Production
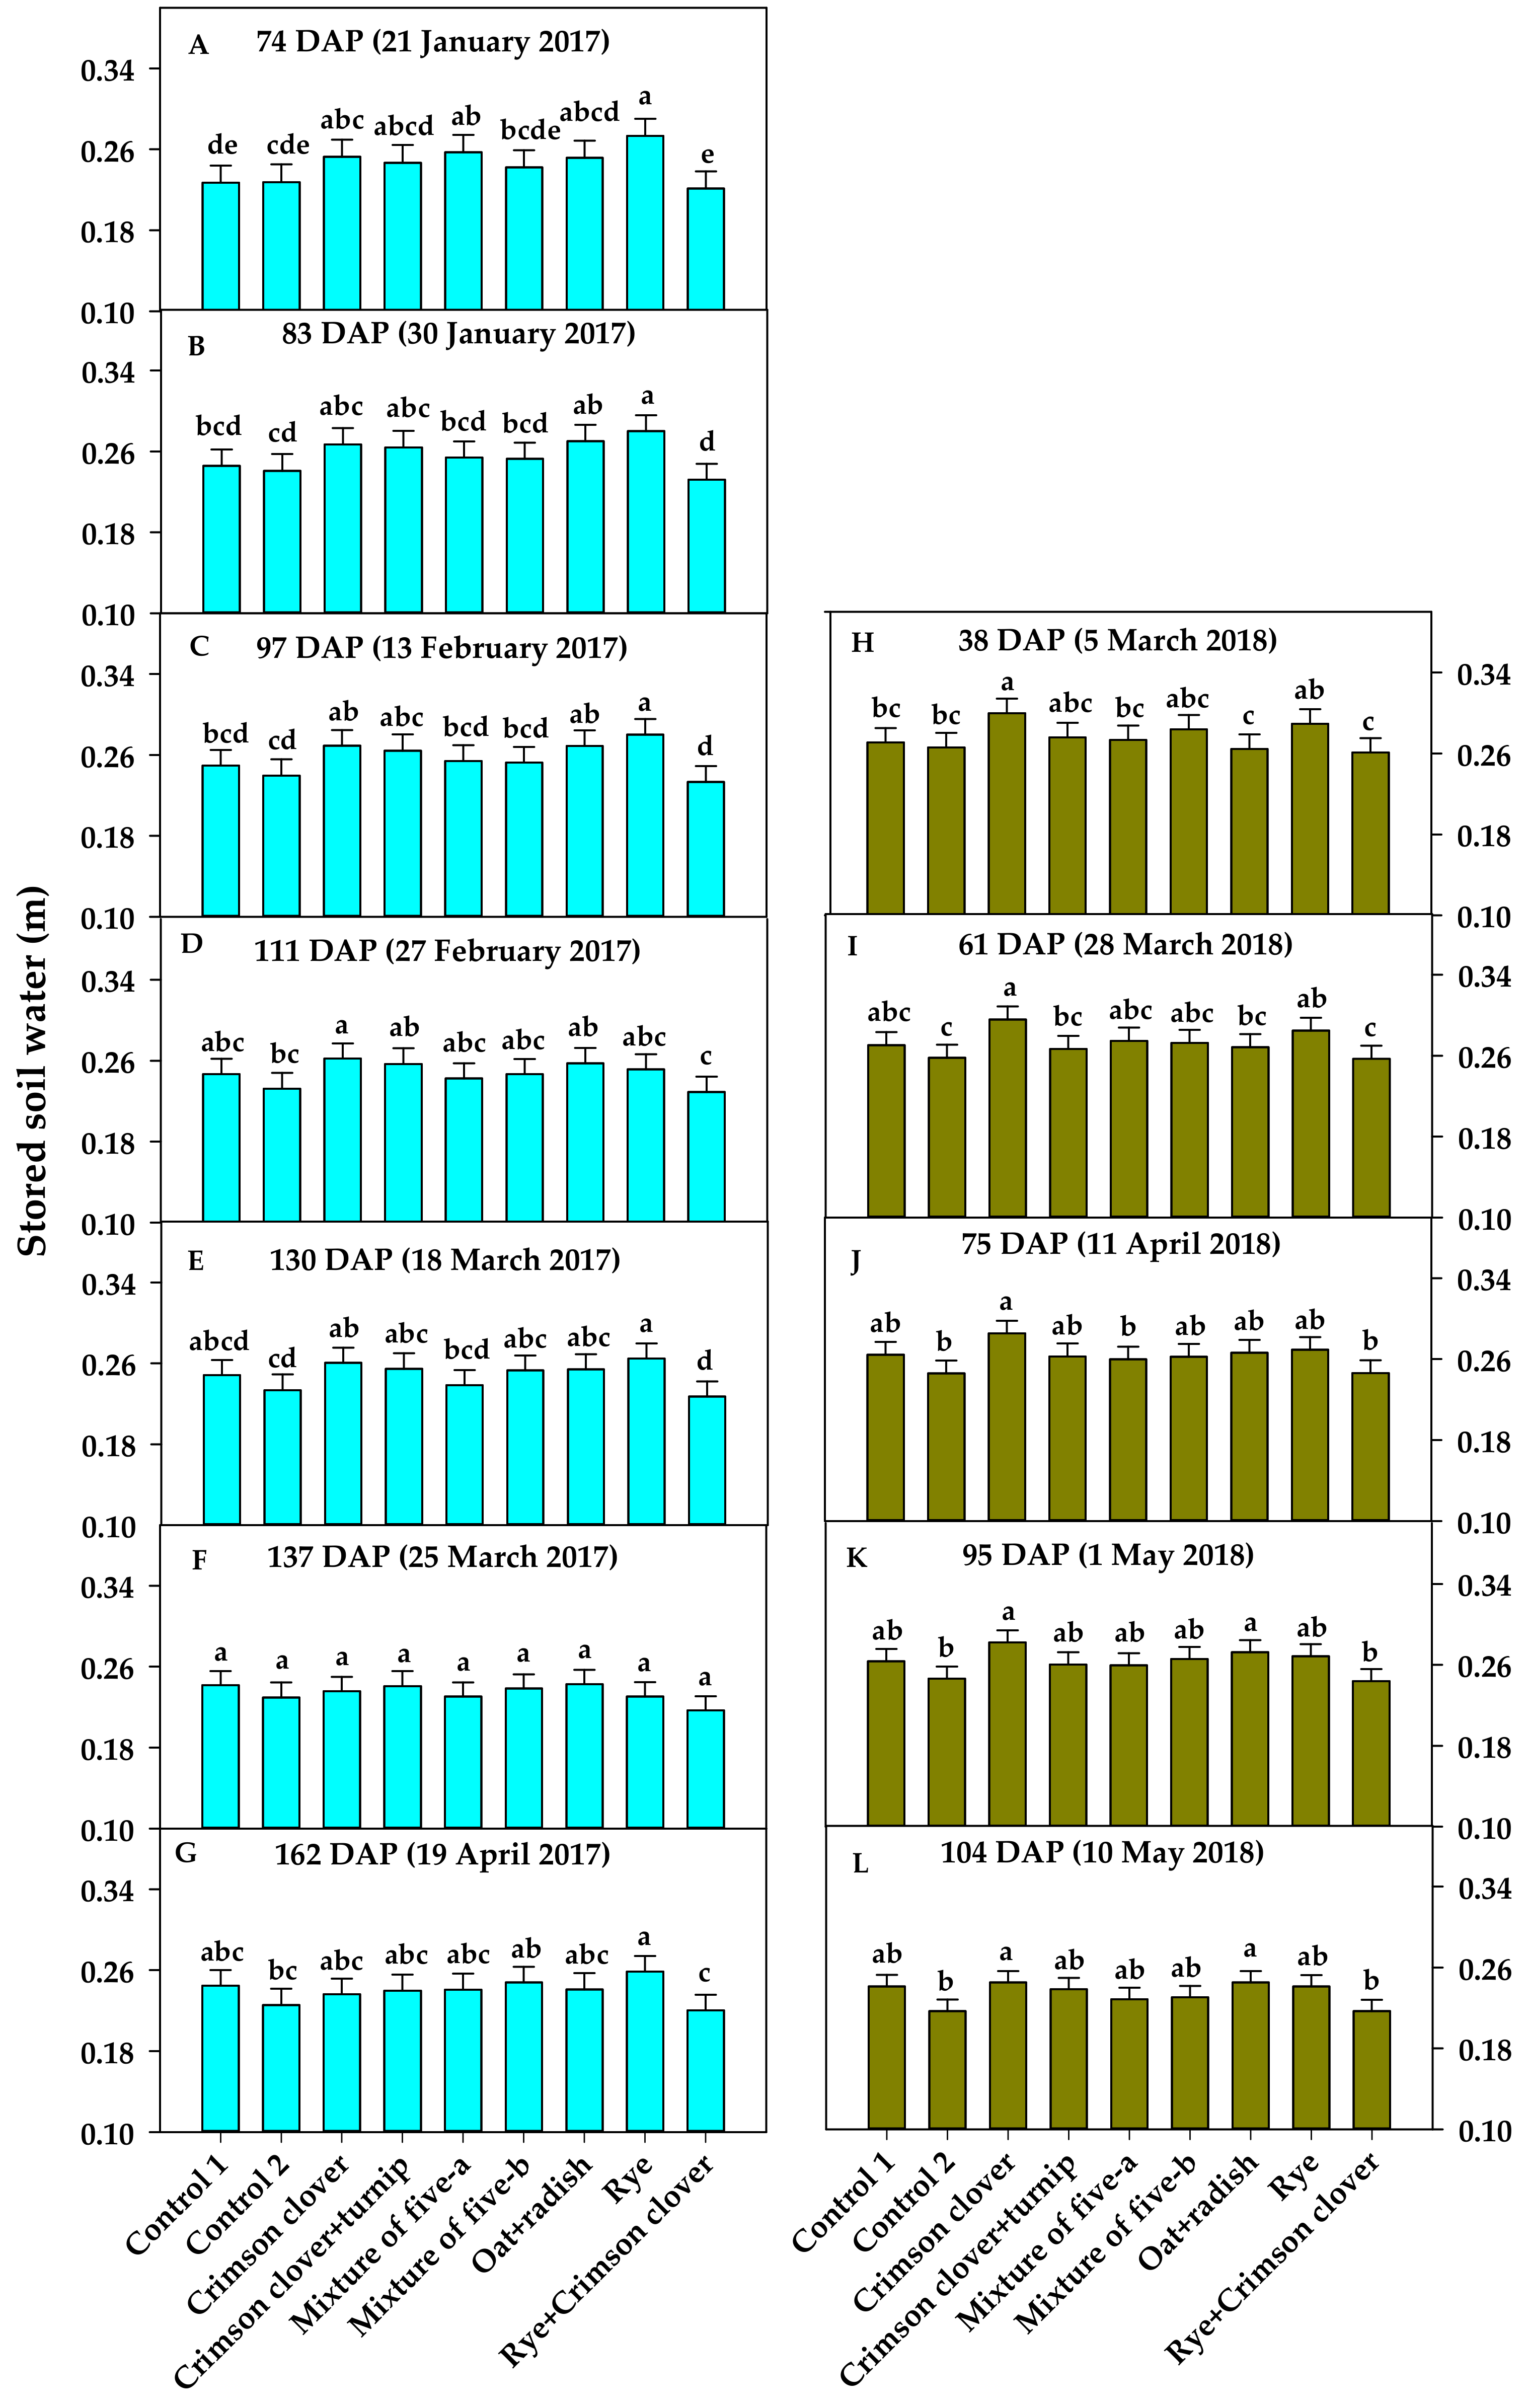
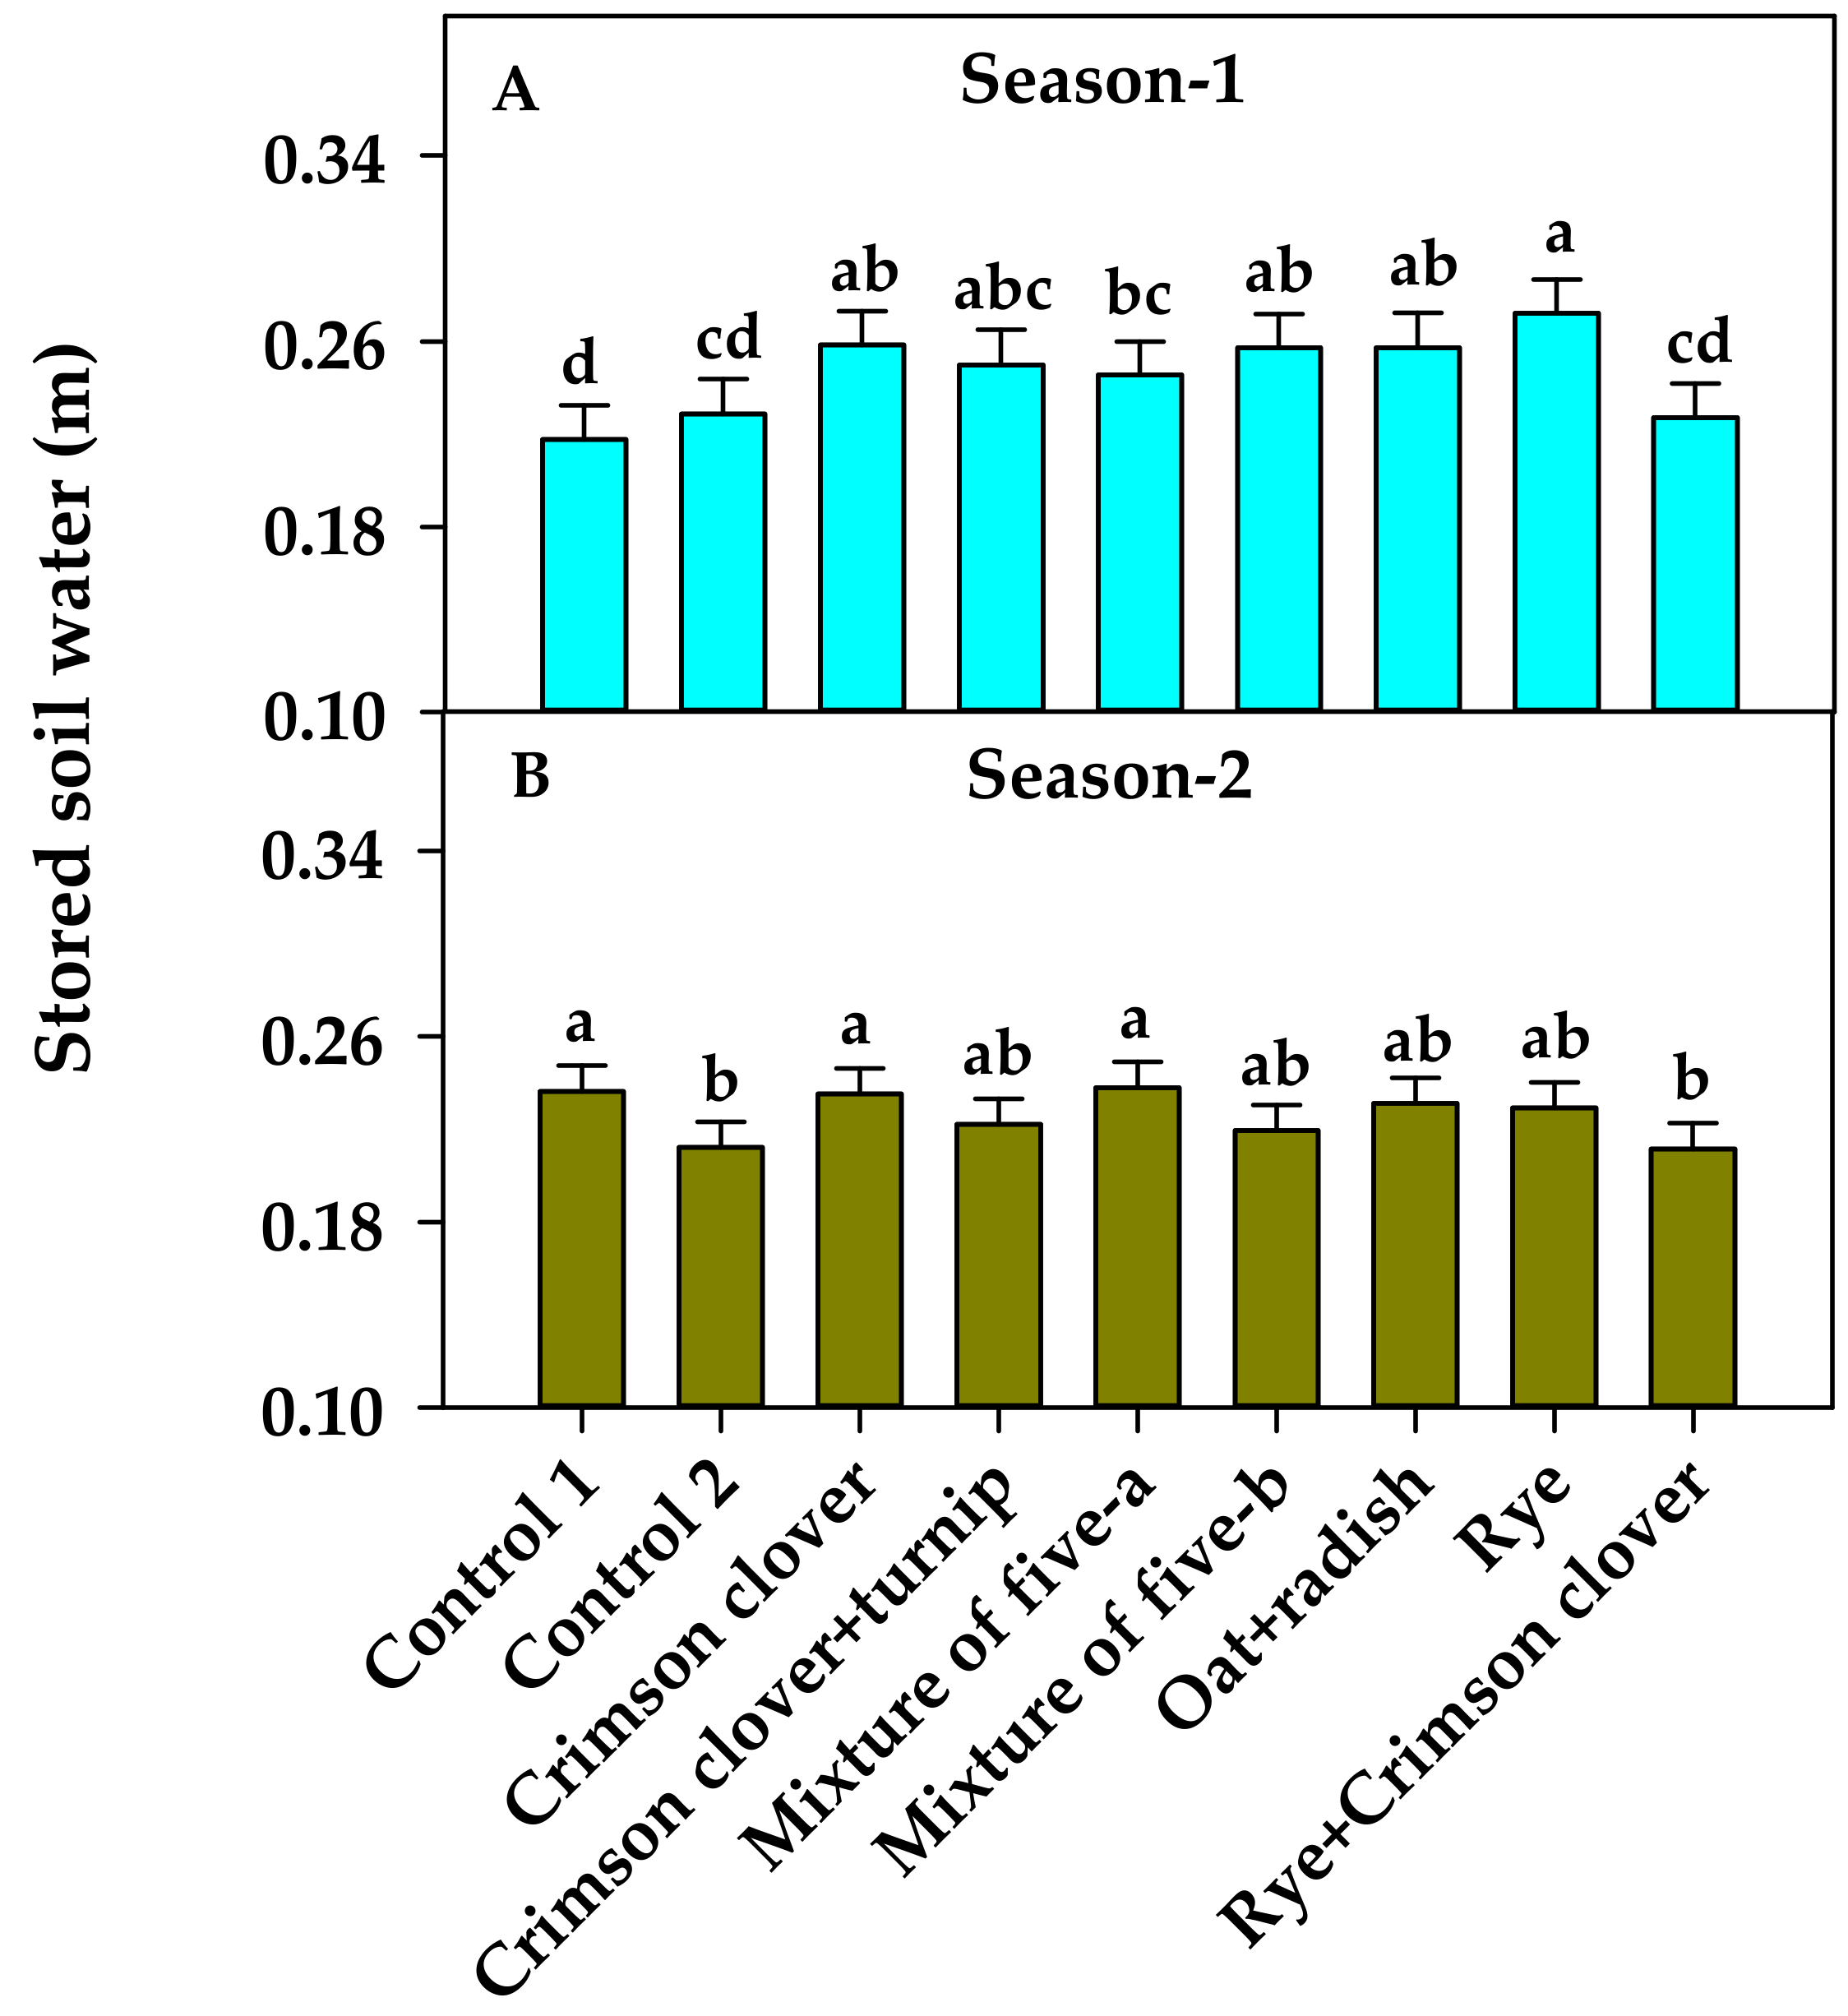
3.3. Volumetric Soil Water Content
3.4. Cover Crop Water Use Efficiency
4. Discussion
5. Conclusions
Supplementary Materials
Author Contributions
Funding
Acknowledgments
Conflicts of Interest
References
- Jenny, H. A study on the influence of climate upon the nitrogen and organic matter content of the soil. Res. Bull. Missouri Agric. Exp. Stn. Columbia 1930, 152, 1–67. [Google Scholar]
- Causarano, H.J.; Franzluebbers, A.J.; Reeves, D.W.; Shaw, J.N. Soil organic carbon sequestration in cotton production systems of the southeastern United States: A review. J. Environ. Qual. 2006, 35, 1374–1383. [Google Scholar] [CrossRef] [PubMed]
- Franzluebbers, A.J. Soil organic carbon sequestration and agricultural GHG emissions in the southeastern USA. Soil Till. Res. 2005, 83, 120–147. [Google Scholar] [CrossRef]
- Reberg-Horton, S.C.; Grossman, J.M.; Kornecki, T.S.; Meijer, A.D.; Price, A.J.; Place, G.T.; Webster, T.M. Utilizing cover crop mulches to reduce tillage in organic systems in the southeastern USA. Renew. Agric. Food Syst. 2012, 27, 41–48. [Google Scholar] [CrossRef]
- Unger, P.W.; Vigil, M.F. Cover crop effects on soil water relationships. J. Soil Water Conserv. 1998, 53, 200–207. [Google Scholar]
- Bergtold, J.S.; Ramsey, S.; Maddy, L.; Williams, J.R. A review of economic considerations for cover crops as a conservation practice. Renew. Agric. Food Syst. 2017, 34, 62–76. [Google Scholar] [CrossRef]
- Chu, M.; Jagadamma, S.; Walker, F.R.; Eash, N.S.; Buschermohle, M.J.; Duncan, L.A. Effect of multispecies cover crop mixture on soil properties and crop yield. Agric. Environ. Lett. 2017, 2, 170030. [Google Scholar] [CrossRef]
- Chalise, K.S.; Singh, S.; Wegner, B.R.; Kumar, S.; Pérez-Gutiérrez, J.D.; Osborne, S.L.; Nleya, T.; Guzman, J.; Rohila, J.S. Cover crops and returning residue impact on soil organic carbon, bulk density, penetration resistance, water retention, infiltration, and soybean yield. Agron. J. 2018, 110, 99–108. [Google Scholar] [CrossRef]
- Snapp, S.S.; Swinton, S.M.; Labarta, R.; Mutch, D.; Black, J.R.; Leep, R.; Nyiraneza, J.; O’Neil, K. Evaluating cover crops for benefits, costs and performance within cropping system niches. Agron. J. 2005, 97, 322–332. [Google Scholar]
- Wells, M.S.; Reberg-Horton, S.C.; Smith, A.N.; Grossman, J.M. The reduction of plant-available nitrogen by cover crop mulches and subsequent effects on soybean performance and weed interference. Agron. J. 2013, 105, 539–545. [Google Scholar] [CrossRef]
- Petrosino, J.S.; Dille, J.A.; Holman, J.D.; Roozeboom, K.L. Kochia suppression with cover crops in southwestern Kansas. Crop. Forage Turfgrass Manag. 2015, 1, 1. [Google Scholar] [CrossRef]
- Wick, A.; Berti, M.; Lawley, Y.; Liebig, M. Integration of annual and perennial cover crops for improving soil health. In Soil Health and Intensification of Agroecosystems; Al-Kaisi, M.M., Lowery, B., Eds.; Academic Press: Cambridge, MA, USA, 2017; pp. 127–150. [Google Scholar]
- Northeast Climate Hub Fact Sheet, Cover Cropping to Improve Climate Resilience. USDA; 2018. Available online: https://www.climatehubs.oce.usda.gov/sites/default/files/covercropsfactsheet_feb2018_web.pdf (accessed on 3 February 2020).
- 2017 Cover Crop Survey Analysis. SARE. Available online: https://www.sare.org/Learning-Center/Topic-Rooms/Cover-Crops/Cover-Crop-Surveys (accessed on 4 February 2020).
- Hamilton, A.V.; Mortensen, D.A.; Allen, M.K. The state of the cover crop nation and how to set realistic future goals for the popular conservation practice. J. Soil Water Conserv. 2017, 72, 111A–115A. [Google Scholar] [CrossRef]
- Economics of Cover Crops I: Profitability of Cover Crops in Row Crop Production and Federal Cost Share for Cover Crops. Available online: https://www.southernsare.org/Regional-News/Bulletins/Cover-Crops-Research-Across-the-Southern-Region/Economics-of-Cover-Crops-I-Profitability-of-Cover-Crops-in-Row-Crop-Production-and-Federal-Cost-Share-for-Cover-Crops (accessed on 7 February 2020).
- Briggs, L.J.; Shantz, H.L. The water requirement of plants as influenced by environment. Proc. 2nd Pan-Am. Sci. Congr. 1917, 3, 95–107. [Google Scholar]
- Robinson, R.G. Oat-pea or oat-vetch mixtures for forage or seed. Agron. J. 1960, 52, 546–549. [Google Scholar] [CrossRef]
- Dunavin, L.S., Jr. Comparison of turnip-Chinese cabbage hybrid, rape, and rye, alone and in combination with annual ryegrass and crimson clover. Agron. J. 1987, 79, 591–594. [Google Scholar] [CrossRef]
- Droushiotis, D.N. Mixtures of annual legumes and small grained cereals for forage production under low rainfall. J. Agric. Sci. Cambridge 1989, 113, 249–253. [Google Scholar] [CrossRef]
- Carr, P.M.; Martin, G.B.; Caton, J.S.; Poland, W.W. Forage and nitrogen yield of barley-pea and oat-pea intercrops. Agron. J. 1998, 90, 79–84. [Google Scholar] [CrossRef]
- Carr, P.M.; Horsley, R.D.; Poland, W.W. Barley, oat, and cereal-pea mixtures as dryland forages in the northern Great Plains. Agron. J. 2004, 96, 677–684. [Google Scholar] [CrossRef]
- Treadwell, D.; Creamer, N.; Baldwin, K. An Introduction to Cover Crop Species for Organic Farming Systems. EOrganic. 2010. Available online: https://eorganic.org/node/1484 (accessed on 8 February 2020).
- Clark, A. Managing Cover Crops Profitably, 3rd ed.; Handbook Series Book 9; Sustainable Agriculture Research and Education (SARE), University of Maryland: College Park, MD, USA, 2012; ISBN 978-1-888626-12-4. [Google Scholar]
- Hubbard, R.K.; Strickland, T.C.; Phatak, S. Effects of cover crop systems on soil physical properties and carbon/nitrogen relationships in the coastal plain of southeastern USA. Soil Till. Res. 2013, 126, 276–283. [Google Scholar] [CrossRef]
- Daigh, A.L.; Helmers, M.J.; Kladivko, E.; Zhou, X.; Goeken, R.; Cavdini, J.; Barker, D.; Sawyer, J. Soil water during the drought of 2012 as affected by rye cover crops in fields in Iowa and Indiana. J. Soil Water Conserv. 2014, 69, 564–573. [Google Scholar] [CrossRef]
- Smith, R.G.; Atwood, L.W.; Warren, N.D. Increased productivity of a cover crop mixture is not associated with enhanced agroecosystem services. PLoS ONE 2014, 9, e97351. [Google Scholar] [CrossRef] [PubMed]
- Nielsen, D.C.; Lyon, D.J.; Hergert, G.W.; Higgins, R.K.; Holman, J.D. Cover crop biomass production and water use in the central Great Plains. Agron. J. 2015, 107, 2047–2058. [Google Scholar] [CrossRef]
- Nielsen, D.C.; Lyon, D.J.; Hergert, G.W.; Higgins, R.K.; Calderón, F.J.; Vigil, M.F. Cover crop mixtures do not use water differently than single-species plantings. Agron. J. 2015b, 107, 1025–1038. [Google Scholar] [CrossRef]
- Wolters, B.R. To Mix or Not to Mix: Performance and Management of Diverse Cover Crop Mixtures. Ph.D. Thesis, Virginia Polytechnic Institute and State University, Blacksburg, Virginia, 20 September 2019. [Google Scholar]
- Biederbeck, V.O.; Campbell, C.A.; Zentner, R.P. Effects of crop rotation and fertilization on some biological properties of a loam in southwestern Saskatchewan. Can. J. Soil Sci. 1984, 64, 355–367. [Google Scholar] [CrossRef]
- Mikha, M.M.; Vigil, F.M.; Liebig, M.A.; Bowman, R.A.; McConkey, B.; Deibert, E.J.; Pikul, J.L., Jr. Cropping system influences on chemical properties and soil quality in the Great plains. Renew. Agric. Food Syst. 2006, 21, 26–35. [Google Scholar] [CrossRef]
- Steenwerth, K.L.; Jackson, L.E.; Calderón, F.J.; Stromberg, M.R.; Scow, K.M. Soil microbial community composition and land use history in cultivated and grassland ecosystems of coastal California. Soil Biol. Biochem. 2002, 34, 1599–1611. [Google Scholar] [CrossRef]
- Biederbeck, V.O.; Zentner, R.P.; Campbell, C.A. Soil microbial populations and activities as influenced by legume green fallow in a semiarid climate. Soil Biol. Biochem. 2005, 37, 1775–1784. [Google Scholar] [CrossRef]
- KSU Agronomy e-Update 387. 1 February 2013. Available online: https://www.agronomy.k-state.edu/documents/eupdates/eupdate020113.pdf (accessed on 3 February 2020).
- Kuykendall, M.B. Biomass Production and Changes in Soil Water with Cover Crop Species and Mixtures Following No-Till Winter Wheat. Master’s Thesis, Kansas State University, Manhattan, KS, USA, 2015. [Google Scholar]
- Wortman, S.E.; Francis, C.A.; Bernards, M.L.; Drijber, R.A.; Lindquist, J.L. Optimizing cover crop benefits with diverse mixtures and an alternative termination method. Agron. J. 2012, 104, 1425–1435. [Google Scholar] [CrossRef]
- Campbell, R.B.; Karlen, D.L.; Sojka, R.E. Conservation tillage for maize production in the U.S. Southeastern Coastal Plain. Soil Tillage Res. 1984, 4, 511–529. [Google Scholar] [CrossRef]
- Campbell, R.B.; Sojka, R.E.; Karlen, D.L. Conservation tillage for soybean in the U.S. Southeastern Coastal Plain. Soil Tillage Res. 1984, 4, 531–541. [Google Scholar] [CrossRef]
- Ewing, R.P.; Wagger, M.G.; Denton, H.P. Tillage and cover crop management effects on soil water and corn yield. Soil Sci. Soc. Am. J. 1991, 55, 1081–1085. [Google Scholar] [CrossRef]
- Marshall, M.W.; Williams, P.; Nafchi, A.M.; Maja, J.M.; Payero, J.; Mueller, J.; Khalilian, A. Influence of tillage and deep rooted cool season cover crops on soil properties, pests, and yield responses in cotton. Open J. Soil Sci. 2016, 6, 149–158. [Google Scholar] [CrossRef][Green Version]
- USDA NRCS. Cover crop (340) requirements in Tennessee. In 2015 Environmental Quality Incentives Program (EQIP); United States Department of Agriculture Natural Resources Conservation Service: Nashville, TN, USA, 2015. [Google Scholar]
- Wortman, S.E.; Francis, C.A.; Lindquist, J.L. Cover crop mixtures for the western Corn Belt: Opportunities for increased productivity and stability. Agron. J. 2012, 104, 699–705. [Google Scholar] [CrossRef]
- Dabney, S.M.; Delgado, J.A.; Reeves, D.W. Using winter cover crops to improve soil and water quality. Commun. Soil Sci Plant. Anal. 2001, 32, 1221–1250. [Google Scholar] [CrossRef]
- Delta, T. User Manual for the Profile Probe Type PR2 5.0; Delta-T Devices Ltd.: Cambridge, UK, 2019. [Google Scholar]
- Narayanan, S.; Aiken, M.R.; Prasad, P.V.V.; Xin, Z.; Yu, J. Water and radiation use efficiencies in sorghum. Agron. J. 2013, 105, 649–656. [Google Scholar] [CrossRef]
- St Aime, R.; Narayanan, S.; Payero, J. (Clemson University, Clemson, SC, USA). Personal Communication. 2018. [Google Scholar]
- Home and Garden Information Center Factsheet 1252. Available online: https://hgic.clemson.edu/factsheet/cover-crops/ (accessed on 31 January 2020).
- Lenssen, A.W.; Cash, S.D.; Hatfield, P.G.; Sainju, U.M.; Grey, W.R.; Blodgett, S.L.; Goosey, H.B.; Griffith, D.A.; Johnson, G.D. Yield, quality, and water and nitrogen use of durum and annual forages in two-year rotations. Agron. J. 2010, 102, 1261–1268. [Google Scholar] [CrossRef]
- Lal, R.; Regnier, E.; Eckert, D.J.; Edwards, W.M.; Hammond, R. Expectations of cover crops for sustainable agriculture. In Cover Crops for Clean Water; Hargrove, W.L., Ed.; Soil and Water Conservation Society: Ankeny, IA, USA, 1991. [Google Scholar]
- Franzluebbers, A.J.; Stuedemann, J.A. Soil physical responses to cattle grazing cover crops under conventional and no tillage in the Southern Piedmont USA. Soil Tillage Res. 2008, 100, 141–153. [Google Scholar] [CrossRef]
- Wilhelm, W.W.; Johnson, J.M.F.; Hatfield, J.L.; Voorhees, W.B.; Linden, D.R. Crop and soil productivity response to corn residue removal: A literature review. Agron. J. 2004, 96, 1–17. [Google Scholar] [CrossRef]
- Andrews, S.S. Crop Residue Removal for Biomass Energy Production: Effects on Soils and Recommendations. NRCS White Paper; NRCS; 2006. Available online: www.nrcs.usda.gov/Internet/FSE_DOCUMENTS/nrcs142p2_053255.pdf (accessed on 31 January 2020).
- Fryrear, D.W. Soil cover and wind erosion. Trans. ASAE 1985, 28, 781–784. [Google Scholar] [CrossRef]
- Williams, J.D.; Wilkins, D.E.; Douglas, C.L.; Rickman, R.W. Winter erosion in four residue management systems: Preliminary report. Columbia Basin Agric. Res. Ann. Rep. Spec. Rep. 1997, 977, 73–76. [Google Scholar]
- Blanco-Canqui, H.; Mikha, M.M.; Presley, D.R.; Claassen, M.M. Addition of cover crops enhances no-till potential for improving soil physical properties. Soil Sci. Soc. Am. J. 2011, 75, 1471–1482. [Google Scholar] [CrossRef]
- Blanco-Canqui, H.; Holman, J.D.; Schlegel, A.J.; Tatarko, J.; Shaver, T.M. Replacing fallow with cover crops in a semiarid soil: Effects on soil properties. Soil Sci. Soc. Am. J. 2013, 77, 1026–1034. [Google Scholar] [CrossRef]
- Russel, J.C. The effect of surface cover on soil moisture losses by evaporation. Soil Sci. Soc. Am. Proc. 1939, 4, 65–70. [Google Scholar] [CrossRef]
- Berns, K.; Berns, B. Cover Crop Water Usage and Affect (Sic) on Yield in No-Till Dryland Cropping Systems, Final Report; Sustainable Agriculture Research and Education: College Park, MD, USA, 2009; Available online: https://projects.sare.org/project-reports/fnc07-653/ (accessed on 11 February 2020).

| Soil Parameter/Nutrients | Season-1 | Season-2 |
|---|---|---|
| Soil pH | 6.4 | 6.6 |
| Phosphorus (kg ha−1) | 36 (Medium) | 16 (Low) |
| Potassium (kg ha−1) | 152 (Sufficient) | 131 (Sufficient) |
| Calcium (kg ha−1) | 1500 (Sufficient) | 1291 (Sufficient) |
| Magnesium (kg ha−1) | 312 (Sufficient) | 294 (Sufficient) |
| Zinc (kg ha−1) | 4.5 (Sufficient) | 3.6 (Sufficient) |
| Manganese (kg ha−1) | 75 (Sufficient) | 70 (Sufficient) |
| Boron (kg ha−1) | 0.5 (Sufficient) | 0.6 (Sufficient) |
| Copper (kg ha−1) | 0.89 | 0.83 |
| Sodium (kg ha−1) | 10 | 12 |
| Nitrate nitrogen (ppm) | 12 | 1 |
| Organic matter (%) | 3.7 | 4.1 |
| Treatment | Crop | Species | Seeding Rate (kg ha−1) | Fractional Composition 1 (%) | Functional Group |
|---|---|---|---|---|---|
| Single species | |||||
| Single species-a2 | Cereal rye | Secale cereale L. cv. Wrens Abruzzi | 112.1 | 100 | Grass |
| Single species-b3 | Crimson clover | Trifolium incarnatum L. cv. Dixie | 33.6 | 100 | Legume |
| Mixture of two species | |||||
| Mixture of two-a | Rye | Secale cereale L. cv. Wrens Abruzzi | 56 | 77 | Grass |
| Crimson clover | Trifolium incarnatum L. cv. Dixie | 16.8 | 23 | Legume | |
| Mixture of two-b | Crimson clover | Trifolium incarnatum L. cv. Dixie | 16.8 | 75 | Legume |
| Turnip | Brassica rapa subsp. rapa. cv. Purple top white globe | 5.6 | 25 | Brassica | |
| Mixture of two-c4 | Oat | Avena sativa L. cv. Coker 227 | 56 | 83 | Grass |
| Radish (Daikon) | Raphanus sativus var. Longipinnatus | 11.2 | 17 | Brassica | |
| Mixture of five species | |||||
| Mixture of five-a | Austrian winter pea | Pisum sativum L. ssp. sativum var. arvense | 26.9 | 31 | Legume |
| Rye | Secale cereale L. cv. Wrens Abruzzi | 22.4 | 25 | Grass | |
| Crimson clover | Trifolium incarnatum L. cv. Dixie | 6.7 | 8 | Legume | |
| Hairy vetch | Vicia villosa Roth cv. Namoi | 8.9 | 10 | Legume | |
| Oat | Avena sativa L. cv. Coker 227 | 22.4 | 26 | Grass | |
| Mixture of five-b | Oat | Avena sativa L. cv. Coker 227 | 22.4 | 38 | Grass |
| Wheat | Triticum aestivum L. cv. Georgia. gore | 22.4 | 38 | Grass | |
| Crimson clover | Trifolium incarnatum L. cv. Dixie | 6.7 | 12 | Legume | |
| Radish (Daikon) | Raphanus sativus var. Longipinnatus | 4.5 | 8 | Brassica | |
| Turnip | Brassica rapa subsp. rapa. cv. Purple top white globe | 2.24 | 4 | Brassica | |
| DAP 1 | p Values | |||
|---|---|---|---|---|
| Treatment 2 | Depth 3 | Treatment x Depth | ||
| Season-1 (2016–2017) | ||||
| Biomass | 83 | <0.0001 | N/A 4 | N/A |
| 111 | <0.0001 | N/A | N/A | |
| 137 | <0.0001 | N/A | N/A | |
| 162 | <0.0001 | N/A | N/A | |
| Volumetric soil water content | 74 | 0.0013 | <0.0001 | 0.6162 |
| 83 | 0.0044 | <0.0001 | 0.6526 | |
| 97 | 0.0051 | <0.0001 | 0.6406 | |
| 111 | 0.1856 | <0.0001 | 0.7253 | |
| 130 | 0.0317 | <0.0001 | 0.6440 | |
| 137 | 0.6676 | <0.0001 | 0.6378 | |
| 162 | 0.1560 | <0.0001 | 0.8909 | |
| 267 | <0.0001 | <0.0001 | 0.8598 | |
| Total stored soil water in 60 cm depth | 74 | 0.1015 | N/A | N/A |
| 83 | 0.1944 | N/A | N/A | |
| 97 | 0.1690 | N/A | N/A | |
| 111 | 0.6628 | N/A | N/A | |
| 130 | 0.3652 | N/A | N/A | |
| 137 | 0.9102 | N/A | N/A | |
| 162 | 0.6095 | N/A | N/A | |
| 267 | 0.0885 | N/A | N/A | |
| Water use efficiency | 111 | 0.0093 | N/A | N/A |
| 137 | <0.0001 | N/A | N/A | |
| 162 | 0.0079 | N/A | N/A | |
| Season-2 (2018) | ||||
| Biomass | 62 | <0.0001 | N/A | N/A |
| 96 | 0.0018 | N/A | N/A | |
| 104 | <0.0001 | N/A | N/A | |
| Volumetric soil water content | 38 | 0.0310 | <0.0001 | 0.9532 |
| 61 | 0.0947 | <0.0001 | 0.9869 | |
| 75 | 0.0935 | <0.0001 | 0.9973 | |
| 95 | 0.0741 | <0.0001 | 0.9904 | |
| 104 | 0.1348 | <0.0001 | 0.9895 | |
| 166 | 0.1452 | <0.0001 | 0.9885 | |
| Total stored soil water in 60 cm depth | 39 | 0.3922 | N/A | N/A |
| 63 | 0.5363 | N/A | N/A | |
| 76 | 0.5260 | N/A | N/A | |
| 96 | 0.4801 | N/A | N/A | |
| 105 | 0.6491 | N/A | N/A | |
| 167 | 0.6122 | N/A | N/A | |
| Water use efficiency | 95 | 0.1197 | N/A | N/A |
| 104 | 0.0004 | N/A | N/A | |
© 2020 by the authors. Licensee MDPI, Basel, Switzerland. This article is an open access article distributed under the terms and conditions of the Creative Commons Attribution (CC BY) license (http://creativecommons.org/licenses/by/4.0/).
Share and Cite
St Aime, R.; Zehnder, G.W.; Talley, C.; Narayanan, S. Differences in Biomass Production and Water Use Efficiency among Seven Different Cover Crops in the Wet Winter Seasons of 2016/17 and 2018 in South Carolina. Agronomy 2020, 10, 463. https://doi.org/10.3390/agronomy10040463
St Aime R, Zehnder GW, Talley C, Narayanan S. Differences in Biomass Production and Water Use Efficiency among Seven Different Cover Crops in the Wet Winter Seasons of 2016/17 and 2018 in South Carolina. Agronomy. 2020; 10(4):463. https://doi.org/10.3390/agronomy10040463
Chicago/Turabian StyleSt Aime, Ricardo, Geoffrey W. Zehnder, Christopher Talley, and Sruthi Narayanan. 2020. "Differences in Biomass Production and Water Use Efficiency among Seven Different Cover Crops in the Wet Winter Seasons of 2016/17 and 2018 in South Carolina" Agronomy 10, no. 4: 463. https://doi.org/10.3390/agronomy10040463
APA StyleSt Aime, R., Zehnder, G. W., Talley, C., & Narayanan, S. (2020). Differences in Biomass Production and Water Use Efficiency among Seven Different Cover Crops in the Wet Winter Seasons of 2016/17 and 2018 in South Carolina. Agronomy, 10(4), 463. https://doi.org/10.3390/agronomy10040463


