Article

New Eco-Friendly Polymeric-Coated Urea Fertilizers Enhanced Crop Yield in Wheat

by
Ricardo Gil-Ortiz
1,*,
Miguel Ángel Naranjo
1,2,
Antonio Ruiz-Navarro
3,
Marcos Caballero-Molada
1,2,
Sergio Atares
2,
Carlos García
3 and
Oscar Vicente
4
1
Institute for Plant Molecular and Cell Biology (UPV-CSIC), Universitat Politècnica de València, 46022 Valencia, Spain
2
Fertinagro Biotech S.L., Polígono de la Paz, C/ Berlín s/n, 44195 Teruel, Spain
3
Centre for Soil and Applied Biology Science of Segura (CEBAS-CSIC), Espinardo University Campus, 30100 Murcia, Spain
4
Institute for the Preservation and Improvement of Valencian Agrodiversity (COMAV), Universitat Politècnica de València, 46022 Valencia, Spain
*
Author to whom correspondence should be addressed.
Agronomy 2020, 10(3), 438; https://doi.org/10.3390/agronomy10030438
Submission received: 5 March 2020 / Revised: 18 March 2020 / Accepted: 19 March 2020 / Published: 23 March 2020

Abstract

:
Presently, there is a growing interest in developing new controlled-release fertilizers based on ecological raw materials. The present study aims to compare the efficacy of two new ureic-based controlled-release fertilizers formulated with water-soluble polymeric coatings enriched with humic acids or seaweed extracts. To this end, an experimental approach was designed under controlled greenhouse conditions by carrying out its subsequent field scaling. Different physiological parameters and crop yield were measured by comparing the new fertilizers with another non polymeric-coated fertilizer, ammonium nitrate, and an untreated ‘Control’. As a result, on the microscale the fertilizer enriched with humic acids favored a better global response in the photosynthetic parameters and nutritional status of wheat plants. A significant 1.2-fold increase in grain weight yield and grain number was obtained with the humic acid polymeric fertilizer versus that enriched with seaweed extracts; and also, in average, higher in respect to the uncoated one. At the field level, similar results were confirmed by lowering N doses by 20% when applying the humic acid polymeric-coated produce compared to ammonium nitrate. Our results showed that the new humic acid polymeric fertilizer facilitated crop management and reduced the environmental impact generated by N losses, which are usually produced by traditional fertilizers.

1. Introduction

According to the Food and Agriculture Organization of the United Nations (FAO), wheat is the world’s largest cultivated crop per hectare and the third largest cereal to be produced [1]. In the European Union, 144.5 million tons were harvested in 2016 and production is estimated to increase by 3.5% each year. In fact, the world’s production in 2017 was expected to come to 744.5 million tons, an increase that comes close to 1000% since 1990/1991. Current cereal production demand and gradual soil impoverishment mean that it is increasingly necessary to apply more fertilizers, mainly nitrogenous ones [2]. High quantities of nitrogen (N) per hectare need to be applied to soil to produce optimum wheat grain yields [3]. N-organic mineralization in soil is a slow process that requires the action of soil microorganisms and must also be given the necessary environmental conditions [4,5]. Plants absorb N in the form of exchangeable ammonium (NH4+) or nitrates (NO3-), which are highly mobile compounds in soil that can be easily lost by volatilization or leaching, which leads to environmental problems and/or toxicity for plants [6,7]. The legal restrictions associated with pollution limitations have been set to preserve the environment [8]. Traditional N fertilizers, such as sulfates, nitrates, or urea, are characterized by high constant N-release kinetics [9,10,11]. Fertilizer granules rapidly decompose and a strong N release occurs when applied to soil. Later emissions slow down and additional covert applications are usually necessary for crops to achieve expected yields [12]. This lack of efficiency implies figures like 90% for N loss of the total N applied [8,13,14]. N fertilization efficiency depends on different variables, such as environmental conditions, coupling soil/plant or management practices [9,15].
Fertilizer manufacturers have concentrated in recent decades to produce slow-release and controlled-release fertilizers (SRFs/CRFs) as enhanced-efficiency nitrogen fertilizers (EENF) [16]. SRFs are long-chain molecules of lower solubility than traditional fertilizers like formaldehyde, isobutylene diurea, or methylene urea, for which the biodegradability is proportional to the microbiological activity of the soil. CRFs action, on the other hand, depends mainly on diffusion through coatings and not directly on biodegradation, thus being more efficient in controlling release of nutrients [17,18]. The main advantages of these slow- or controlled-release fertilizer generations are summarized in numerous reviews [8,9,18]: (1) extending the durability of fertilizers by providing small amounts for a longer time; (2) lowering the number of fertilizer applications, generally to a single background application, by prolonging their time of action; (3) cutting costs by eliminating the typical covert applications of traditional fertilizers; (4) reducing environmental pollution by limiting the amount of fertilizer released being assimilated in soil/the plant system. Urea is the major N source used in plant nutrition [19]. Synthetic SRF urea formulations are, for example, urea formaldehyde, isobutylidene diurea, crotonylidene diurea, or sulfur-coated urea fertilizers [20]. Today, controlled-released coated urea (CRCU) is the most important technology being developed in the fertilizer industry [13,18]. To manufacture CRCU, urea is usually coated with polymers that control N release by diffusion based on the permeability of polymer coatings [13,18,21]. Release of N from polymeric CRCU is not significantly influenced by microorganisms of soils because nutrient release can be better controlled compared to sulfur-based coatings [18]. In fact, emissions are influenced mainly by environmental factors like temperature or humidity [17,22] and also by intrinsic factors of fertilizers, such as nutrient composition, coating thickness, granular shape, and diameter [17,18].
In recent decades, the use of synthetic polymers, like those based on sulfur, resins, or thermoplastic materials, has been hampered by legal restrictions that limit pollution due to these materials’ difficult degradation [13]. Such products are used in many other industries to manufacture pesticides, herbicides, pheromones, fungicides or growth regulators [8,23,24]. Their marketed forms are encapsulations, reservoir laminate structures, or monolithic systems [8]. Carbohydrate and lignin-based polymer-coated urea has been indicated as an alternative to solve problems related to N emissions of traditional fertilizers and to avoid environmental problems concerning synthetic polymers [18,25,26]. In fact, they are ecologically friendly and easily available at cheap prices, which are the main restrictions of using CRFs. For example, coatings based on starch, ethyl cellulose, or lignin have been successfully employed to slow down N release from urea [13,26,27]. Including bio-inhibitors as urease or nitrification inhibitors in fertilizers is a commonplace practice to slow down N releases [2,9,28]. Biostimulants like amino acids, humic/fulvic acids or seaweed extracts offer beneficial properties for crops, such as biofortification and resistance to different abiotic stresses, e.g., drought or salinity [29,30,31,32,33].
At the beginning of their development, SCRFs were limited mainly to horticultural and ornamental crops, and actually are not well established in extensive cropping as more research is necessary to perform cheaper and more ecological fertilizers [34,35,36]. The objective of this research was to compare the efficacy of new ecological CRCU with traditional fertilizers in physiological terms, and also grain yield and quality in wheat. The novelty of this research lies in the combination of eco-friendly polymers as byproducts from the production of wood pulp, urease inhibitors, and natural biostimulants in the same fertilizer.

2. Materials and Methods

2.1. Experimental Design

A comparison of the effectiveness of the different polymeric-coated formulations was made under greenhouse conditions and then scaled to field essays. Experiment 1 (Triticum aestivum). Wheat was grown in a greenhouse at ambient temperature and humidity at the facilities of the Valencian Institute of Agrarian Research (IVIA) (Moncada, Spain) from autumn 2014 to spring 2015. Sowing was carried out in pots (22 cm high × 16 cm Ø) placed in watertight trays, sized 54 × 39 × 9 cm (6 pots/tray) with three repetitions per treatment on 7 November. The pots were filled with a non-fertilized soil from a fallow area close to the greenhouse in IVIA’s grounds. Culture was developed with extra lighting for a 12:12 photoperiod and irrigated with distilled water. High temperatures were reduced and partly controlled by means of automatic systems for shading, ventilation, and water cooling. Temperature and humidity were measured every hour with a digital thermo-hygrometer. The average temperatures during the whole culture cycle, from November to May were 18.8 ± 7.2 °C (39 °C max. and 4.9 °C min.), and average relative humidity 55.3 ± 12.8% (88.0% max. and 20.4% min.). Experiment 2 (Triticum spelta). Three separated grids of 400 m2, divided into 16 individual surfaces of 25 m2 each, were designed at the field level in a plot located in Teruel (Spain) at GPS coordinates 40°22′17.4″ N, 1°05′58.9″ W. Four treatments, including an untreated Control, were placed by quadruplicate. Sowing was carried out mechanically in the winter at a dose of 250,000 seeds/ha. Culture was surface-irrigated on a bi-weekly basis with well water.

2.2. Fertilizer Treatments

Different N fertilizers developed by Fertinagro Biotech S.L. (Teruel, Spain) were tested and their efficacy was compared. As these fertilizers are patented, the exact composition is not herein presented. To study the influence of the different coating compositions and thicknesses, the following fertilizers were tested in Experiment 1: (1) DURAMON® (Fertinagro Biotech S.L., Teruel, Spain), composed of urea, including a urease inhibitor (monocarbamida dihidrogenosulfate—MCDHS) with no coating (ES 2 204 307 patent); (2) a new controlled-released urea fertilizer based on DURAMON® technology, but also 3% lignosulfonate-coated with humic acids (hereafter CRFA); (3) the same as (2), but 5% lignosulfonate-coated with seaweed extracts (CRFB). The three formulates had the same N composition (24–0–0), but a different coverture percentage. Fertilizers were applied in wheat at doses of 150 kg ha−1 (nitrogen fertilizer units—NFU) as a basal dressing for maximum yields based on theoretical extraction by crops. Experiment 2: Based on the physiological responses observed in the greenhouse experiment, the best CRF was selected and applied to the field at 100% doses and with a reduction to 80%. Both doses were compared with ammonium nitrosulfate (NSA, 26–0–0) (Fertinagro Biotech S.L., Teruel, Spain) as the traditional fertilizer. Maximum doses of 80 kg ha−1 were applied in the phenological state of tillering (27 April), based on the historical average yields obtained in the area. In both experiments, the same repetitions with untreated plants were included (CONTROL).

2.3. Soil Fertility Characterization

Several soil properties were measured to characterize soil fertility in both experiments. pH and EC were determined in a 1/5 (w/v) aqueous soil extract by shaking for 2 h, followed by centrifugation at 26916 g for 15 min and filtration. pH was measured by a pH meter (Crison mod.2001, Barcelona, Spain) and EC with a Conductivity meter (Crison micro CM2200, Barcelona, Spain). Total and organic soil C (SOC) and total N (N) were determined by combustion gas chromatography in a Flash EA 1112 Thermo Finnigan (Franklin, MA, USA) elemental analyzer after eliminating carbonate by acid digestion with HCl. The total nutrient contents (P, K, Ca, Mg, Cu, Fe, K, Mg, Mn, and Zn) were extracted by aqua regia digestion (3:1, v/v, HCl/HNO3) and determined by ICP-AES (Thermo Elemental Iris Intrepid II XDL, Franklin, MA, USA). Analysis showed that both cultures grew on N-poor soil (Table 1).

2.4. Plant Growth

Photosynthetically active flag leaves (PAFL) were characterized in the phenological state of panicles swelling (booting stage) by fresh weight (g) and foliar surface (cm2) using a LI-3100C area meter (LI-COR®, Lincoln, Nebraska, USA). Some plant material was weighed before being dried at 65 °C until a constant mass was obtained to determine dry weight (g). Differences in the total dry weight, length (cm), primary stem length (cm), and tillers number were determined at the end of the culture.

2.5. Leaf Greenness and Effective Quantum Yield of Photosystem II

Leaf greenness was measured in the booting stage using an SPAD-502 Chlorophyll meter (Konica-Minolta, Osaka, Japan). The effective quantum yield of photosystem II electron transport (ΦPSII), which represents the electron transport efficiency between photosystems within light-adapted leaves, was checked with a leaf fluorometer (Fluorpen FP100, Photos System Instrument, Drásov, Czech Republic). Both parameters were measured in a minimum of 25 PAFL.

2.6. Gas Exchange Analysis

Gas exchange measurements were taken at noon in five plants per treatment using a portable infrared gas analyzer LCpro-SD, equipped with a PLU5 LED light unit (ADC BioScientific Ltd., Hoddesdon, UK). The selected flag leaves in wheat (booting stage) of Experiment 1 were analyzed in a leaf chamber (6.25 cm2) to determine the following parameters: stomatal conductance (gs) (expressed as mmol m−2 s−1), net photosynthetic rate (A) (µmol m−2 s−1), transpiration (E) (mol m−2 s−1), and intercellular CO2 concentration (Ci) (µmol mol−1) under ambient CO2, temperature, and relative humidity conditions. They were recorded by programming increasing photosynthetically active radiations (PAR) of 348, 522, 696, 870, 1218, and 1566 µmol m−2 s−1. Water-use efficiency (WUE) and intrinsic WUE were calculated as the ratio between A/gs and A/E, expressed as µmol (CO2 assimilated) mol−1 (H2O transpired).

2.7. Foliar Nutrient Analysis

Foliar analyses were performed from the fresh samples collected in the phenological state of panicles swelling (booting stage) 70 days after plants emerged. Samples were composed of a pool with a minimum of four flag leaves taken from different plants in the same treatment. Four replicates per treatment and culture were collected and kept at −80 °C until they were biochemically analyzed. The compositions in macro- (N, P, K, Ca, Mg and S) and micronutrients (Fe, Cu, Mn, Zn, B, and Mo) were determined by Inductively Coupled Plasma Optical Emission Spectrometry (ICP-OES). N content was estimated by an N-Pen N 100 apparatus (Photon System Instruments, Drásov, Czech Republic).

2.8. Growth, Yield, and Cereal Grain Composition

Once grain ripening had been completed at 138 days in greenhouses after emergence, the remaining plants per culture were harvested and characterized in growth and grain yield terms. The growth parameters of the total dry weight of aerial parts, primary stem length, tillers number, ears number, and ear length and weight were measured. Yield was determined by measuring the total dry grain weight, one-hundred grain weight and grain number. Nitrogen Use Efficiency (NUE) for each fertilizer treatment was calculated as agronomic efficiency according to [37]:
NUE   ( kg   kg 1 ) = Grain   yield   of   the   fertilized   area     Grain   yield   of   the   unfertilized   area Quantity   of   N   applied   as   N   fertilizer
At the field level and 90 days after applying fertilizers, the biomass of aerial parts, ears weight, and grain weight was studied. The Harvest Index (HI) was calculated as the grain weight/biomass of aerial parts. Different quality parameters were also measured in the grain. A representative composite sample was prepared separately for each treatment, pooling fractions of plant material for each replication. Subsequently, each composite mixture was ground and analyzed based on food quality analysis methods (Comission Regulation EC Nº 152/2009 of 27 January): humidity (gravimetric by drying in an oven at 130 °C), ashes (gravimetric by incineration at 550 °C), lipids (extraction without hydrolisis in Soxtec Avanti—Foss), protein (Kjeldahl method using Foss automatic distillation equipment, Foss, Hillerød, Denmark), crude fiber (gravimetric), and total carbohydrates (volumetric using Luff Schoorl reagent). Analysis were carried out by the Valencia’s Agrifood Laboratory (Burjassot, Spain).

2.9. Statistics

The differences between fertilizers treatments were tested by analysis of variance (ANOVA) at 95% confidence. Prior to the ANOVA, the data requirements of normality and homogeneity of variances were checked according to Levene’s and Shapiro–Wilk tests. When the null ANOVA hypothesis was rejected, post hoc comparisons were made to establish the possible statistical differences among the different treatments applied using the Fisher’s LSD test. The statistical Statgraphics Centurion XV, version 15.2.05 software program (Statpoint Technologies, Inc., Warrenton, VA, USA) was used to perform the analysis.

3. Results

3.1. Plant Growth, Leaf Greenness and Effective Quantum Yield of Photosystem II

No significant differences were observed for the various treatments performed for chlorophyll content and ΦPSII, measured by nondestructive techniques in the phenological state of panicles swelling (booting stage), although they were significant compared to the CONTROL (Table 2). Similar results were obtained when studying PAFL fresh weight content, dry weight and area. The total fresh weight of aerial parts was 1.4- and 1.7-fold significantly higher for the plants fertilized with DURAMON® compared to CRFA and CRFB, but no differences were observed for dry weight. The responses of fertilizer treatments on plant growth, foliar area, and root development are shown in Figure 1.

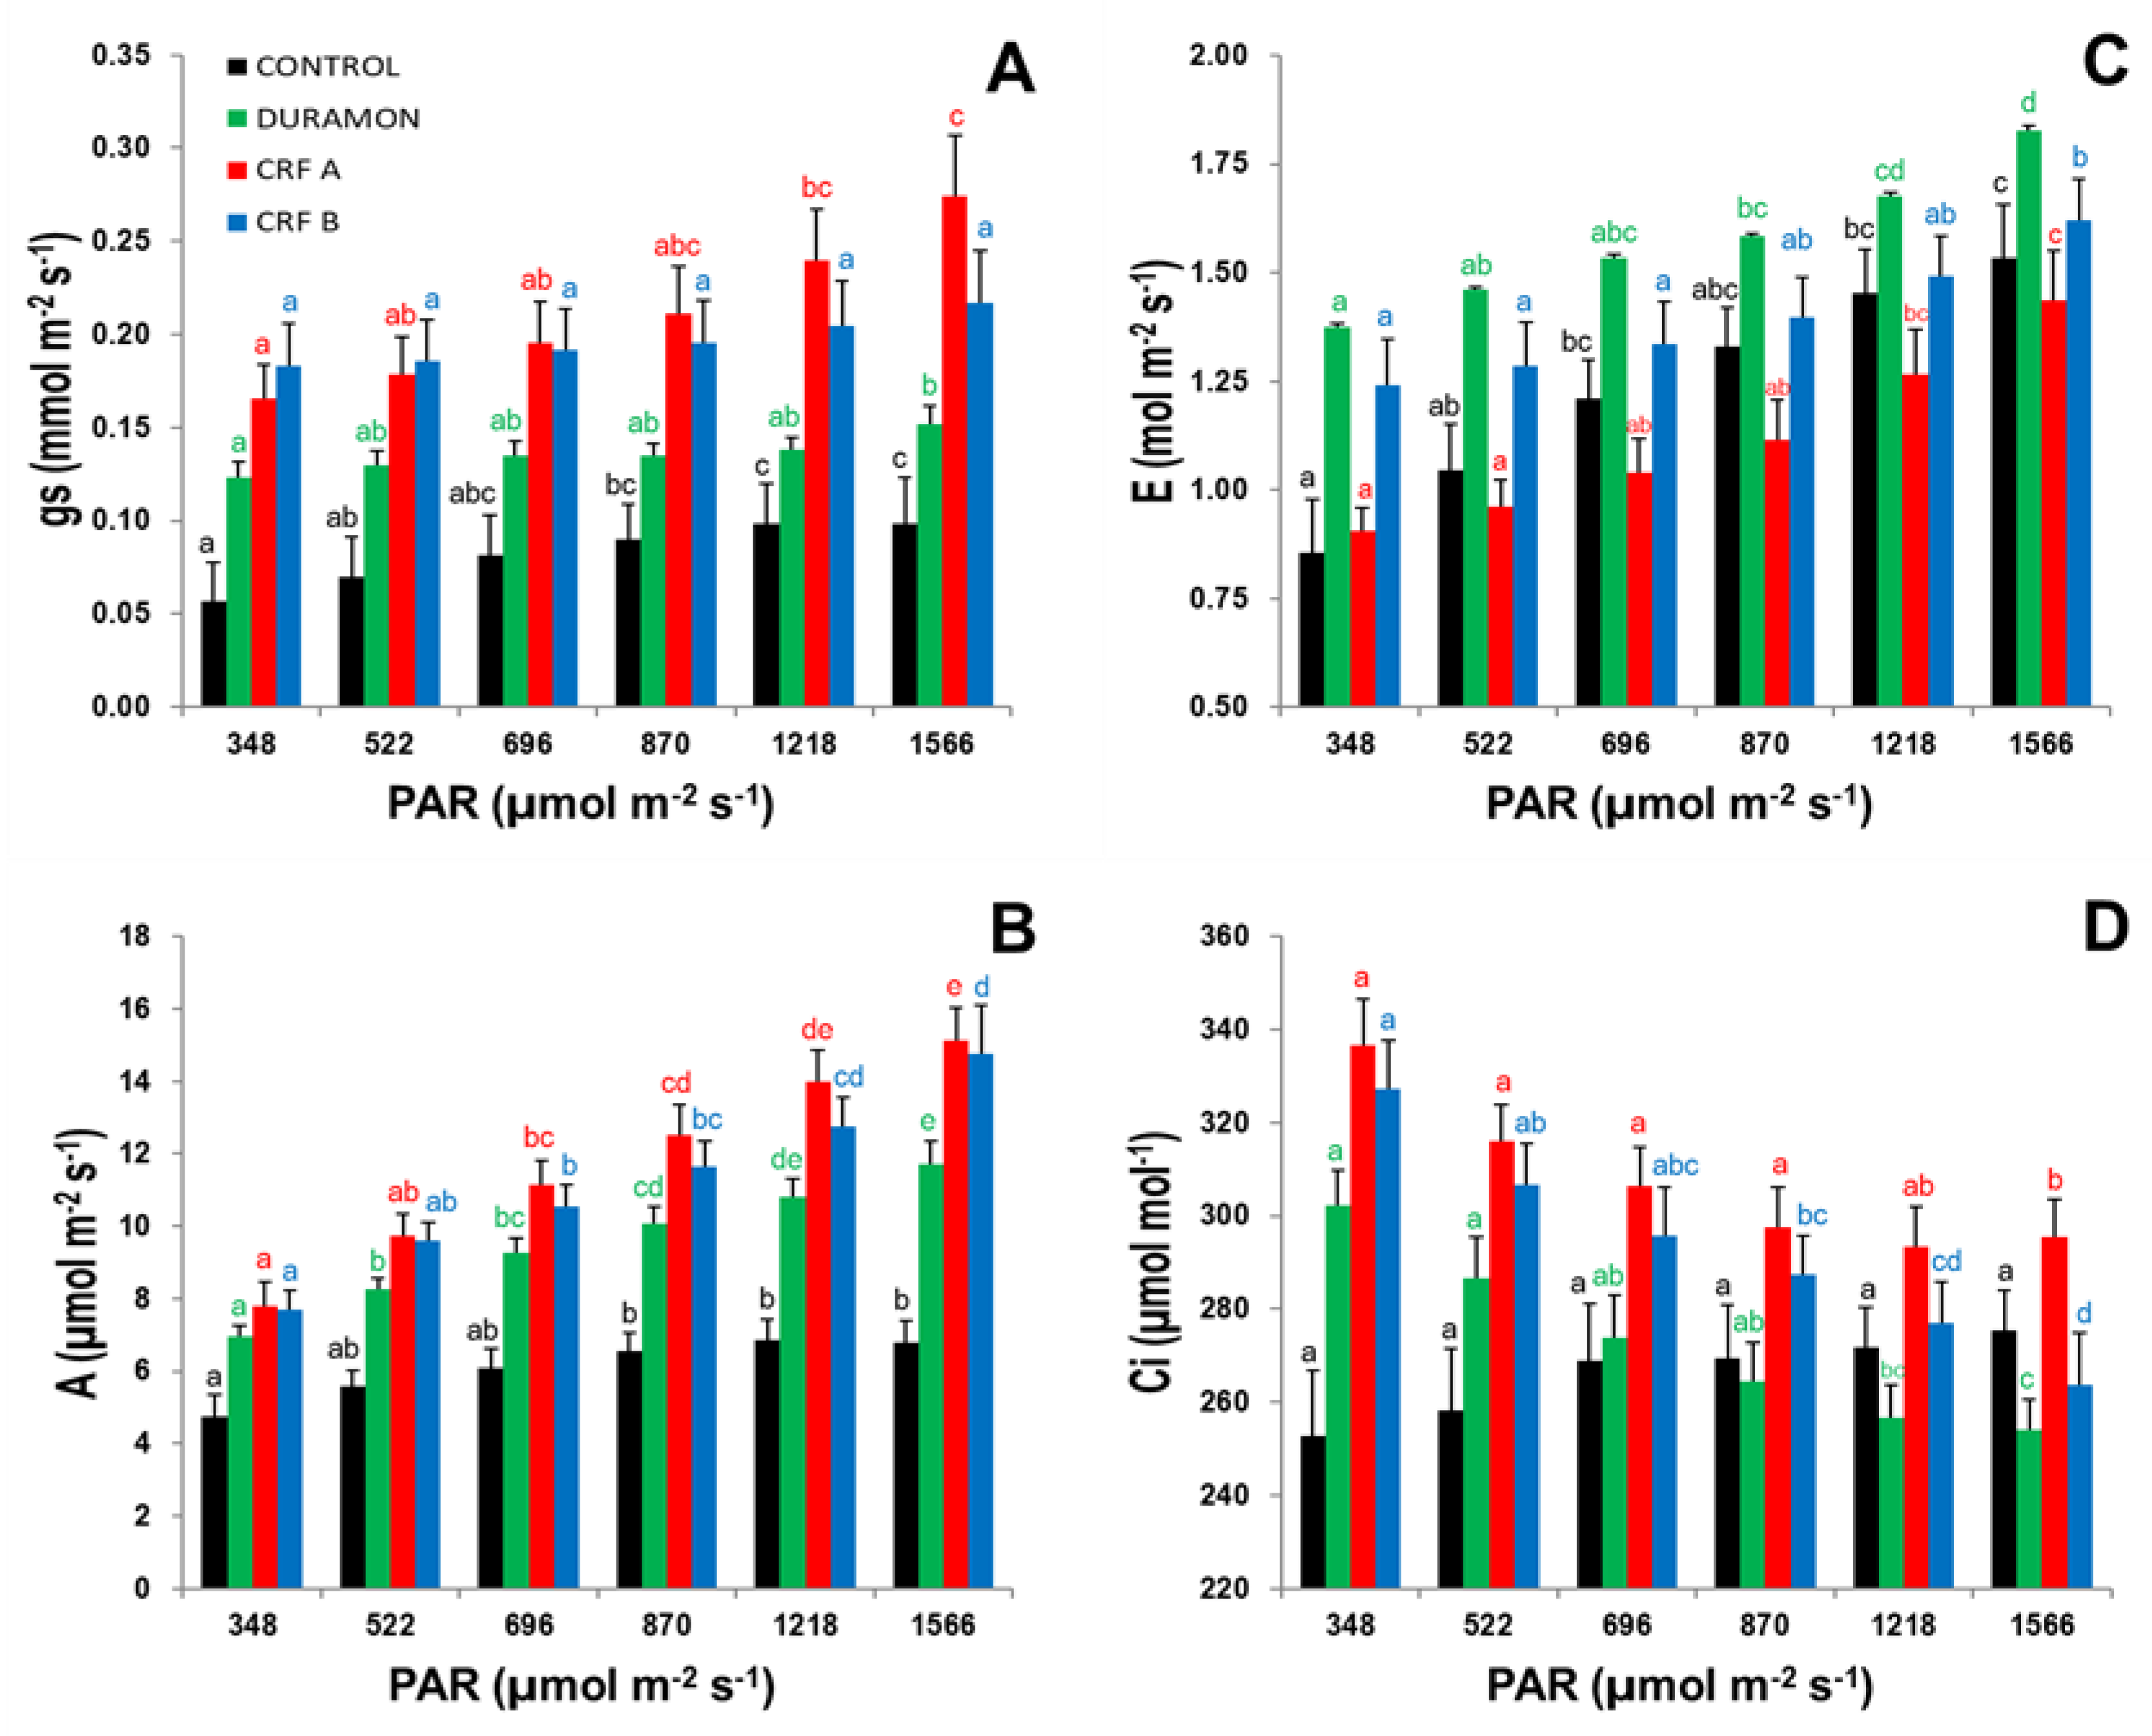
3.2. Gas Exchange Analysis

Significant increases in gs, A, and E were noted in the plants treated with the different fertilizers as increasing PAR levels were applied from 348 to 1566 µmol m−2 s−1 (Figure 2A–C). Conversely, Ci showed a decreasing tendency in all the applied treatments (Figure 2D).
The levels of gs, A and Ci for CRFA were higher than those found for CRFB and DURAMON® but were lower for E. Significant differences were found in all the studied gas exchange parameters between CRFs and DURAMON®. After the maximum PAR application of 1566 µmol m−2 s−1, the levels of A did not significantly differ for both CRFs, but gs and Ci were 1.3- and 1.1-fold significantly higher for CRFA than for CRFB. At the same PAR, the A levels were 1.3-fold significantly higher for CRFs than for DURAMON®. The gs and A levels for the CONTROL plants were significantly lower at all the studied PAR compared to those of the different treatments. However, the E and Ci levels for the CONTROL plants were only significantly different for DURAMON®, as was Ci with CRFA. A/gs significantly differed when globally comparing CRFs with DURAMON® and the CONTROL (Figure 3A), but the A/E levels were significantly higher for CRFA than for CRFB, DURAMON® and the CONTROL, which also significantly differed from one another. The maximum A/E levels were produced within the 870 to 1218 µmol m−2 s−1 range (Figure 3B). The A/E levels in the CRFA leaves were 1.3- and 1.8-fold significantly higher than CRFB and DURAMON® at a PAR of 870 µmol m−2 s−1.

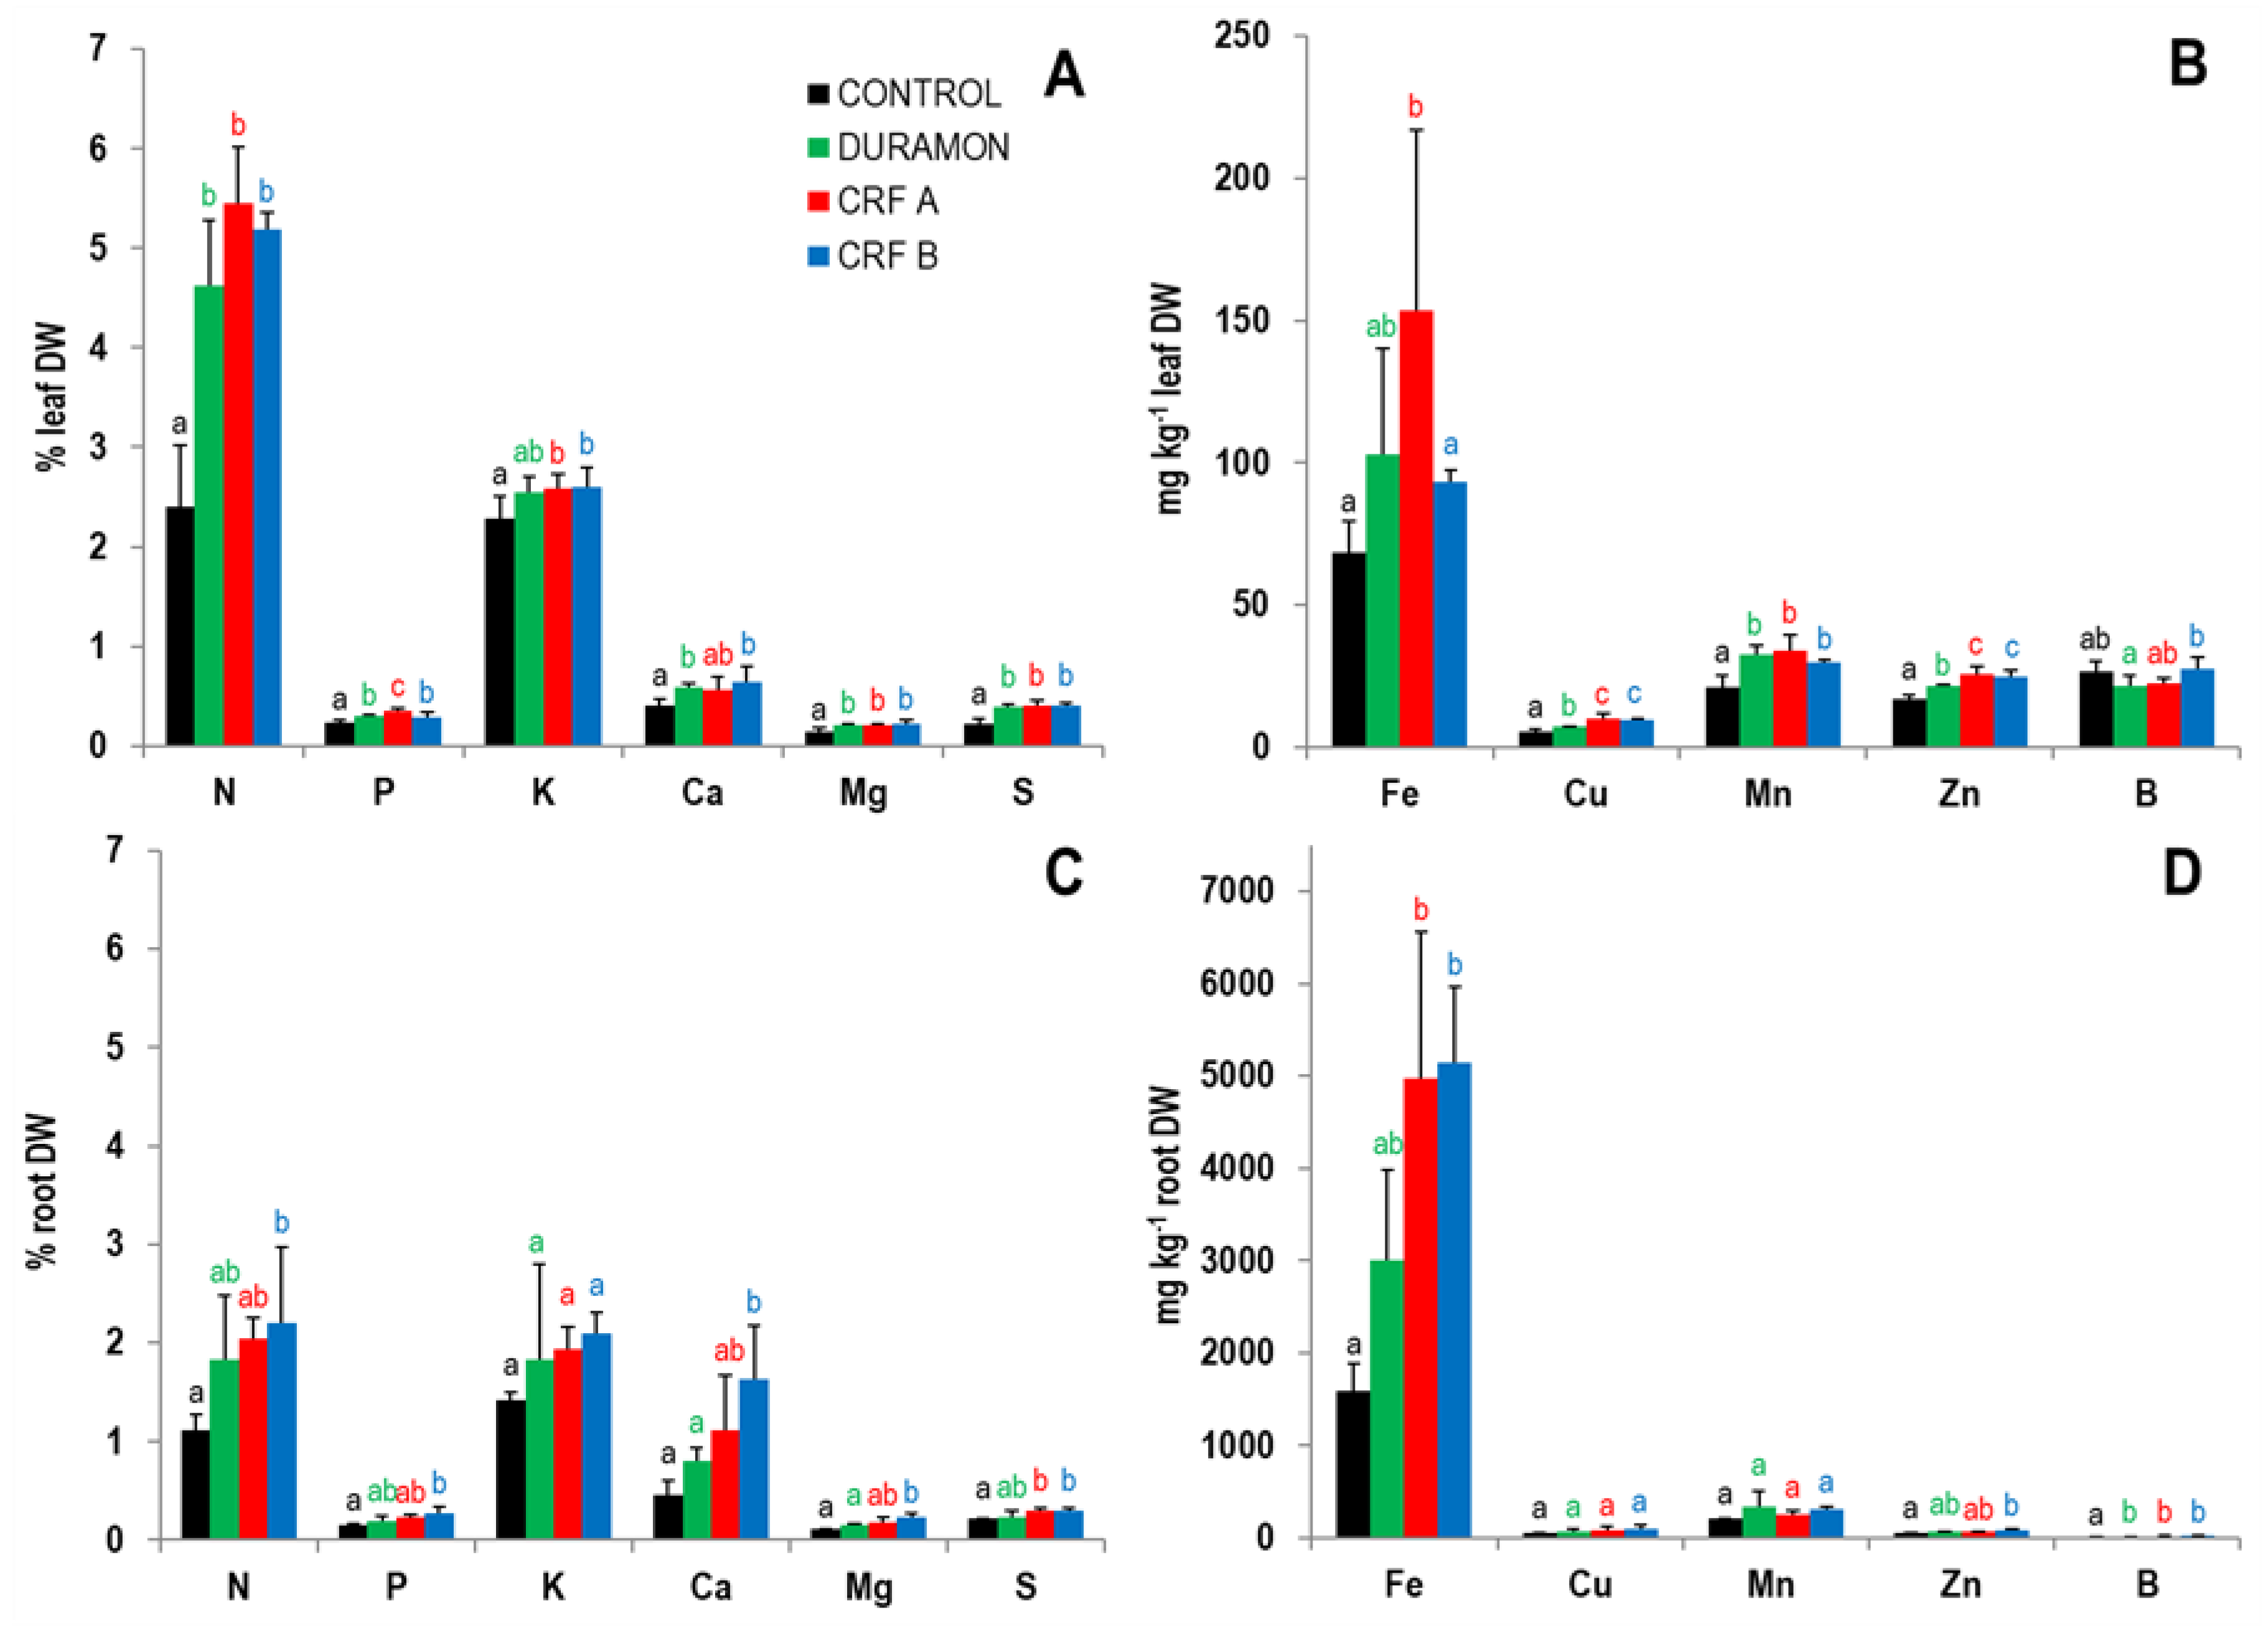
3.3. Foliar Nutrient Content

No significant differences appeared in the PAFL macronutrient concentrations of N, K, Ca, Mg, and S at the beginning of ears formation (Figure 4A). The plants fertilized with CRFA presented 1.1- and 1.2-fold higher foliar N average levels than CRFB and DURAMON®. The foliar P concentrations in the plants fertilized with CRFA were 1.2-fold significantly higher than for CRFB and DURAMON®. On average, the plants fertilized with CRFB presented slightly higher contents of K, Ca, Mg, and S. Regarding micronutrient foliar contents, the plants fertilized with CRFA presented 1.7- and 1.5-fold higher Fe levels than CRFB and DURAMON®, respectively (Figure 4B). Cu and Zn contents were 1.4- and 1.2-fold significantly higher in the plants fertilized with CRFs than in those fertilized with DURAMON®, respectively. Foliar Mn concentrations did not differ significantly among the distinct fertilizer treatments and the CONTROL levels came close to the critical thresholds. The foliar B levels were significantly higher in the plants treated with CRFB compared to those treated with DURAMON®, but the quantitative CONTROL levels came close to CRFB. Mo in PAFL content was < 2 mg kg-1 DW (dry weight) in all the treatments and the CONTROL.
No clear correspondence was obtained for the macro- and micronutrient concentrations quantified at the foliar level compared to those found in roots (Figure 4C, 4D). Quantitatively, the root N concentrations were around half of those obtained at the foliar level. The remaining macronutrient contents were slightly lower in roots, except for Ca. Micronutrients almost doubled in roots compared to foliar content but were 30-fold higher in Fe content. No significant differences were obtained for the three compared treatments in the macro- and micronutrient contents at the root level, except for Ca and Mg, which were higher in the plants treated with CRFs compared to DURAMON®.

3.4. Growth, Yield, and Cereal Grain Composition

The results about the measured growth and yield parameters in greenhouses are shown in Table 3. No significant differences were found in the different treatments for the measured growth parameters. Significant differences were observed in the CONTROL with the CRFA- and DURAMON®-treated plants for the total dry weight of aerial parts, and with DURAMON® for ear weight and number. Regarding the yield parameters, total dry grain weight was significantly higher for CRFA than for CRFB. No significant differences were observed in grain weight among treatments, but differences were significant compared to the CONTROL. Total grain number was 1.2-fold significantly higher for CRFA than for CRFB but was not significant compared to DURAMON®. At the field level, no significant differences were found in the various applied treatments when comparing growth and grain yield parameters (Table 4). However, NUE was 28 and 38% higher for CRFA 80%, compared to CRFA 100% and NSA; these differences were statistically significant. No significant differences were observed among treatments and the CONTROL for the analyzed grain parameters. As a result, on average the values were 1.6% CRFA ash, 12.9% humidity, 1.7% lipids, 11.4% protein, 2.5% crude fiber, and 65.8% total carbohydrates. No significant differences were obtained comparing the studied quality parameters between CRFA and the rest of treatments and CONTROL.

4. Discussion

Nutrient release contained in fertilizers depends on many factors, including environmental conditions, crop management, and the chemical composition of fertilizers [2,38,39]. Nowadays, the slowing down of nutrient emissions in fertilization is a challenge that has already been overcome [11,18,24]. However, high production costs and contamination linked to synthetic fertilizers and waste materials, together with increasingly restrictive environmental policies, have forced new ecological materials to be sought to allow sustainable fertilization [40,41]. The use of water-soluble synthetic products or natural polymers based on lignin has been indicated as an alternative to these problems because they can be obtained in large quantities and at cheap prices from the waste generated in the paper industry, from wood and other sources [42,43].
Research conducted with CRFs has shown that their efficiency is generally higher to that of traditional fertilizers and SRFs [9]. In fact, SRFs are more sensitive to high temperature and sandy soils [44]. Nevertheless, most research works conducted to date with CRFs have focused mainly on crops with a high added value, such as horticultural, ornamental or wood products, and have obtained different results [45,46,47,48,49,50,51,52]. It is important to point out that the main challenge of CRFs application to crops is to successfully provide the amount of nutrients that plants need and in a fractional manner. Moreover, there are also the important advantages that CRFs offer ‘per se’ in both crop management and the environment. In fact, CRF applications are usually unique, which means savings in crop handling from avoiding successive top-dressing fertilizer applications. Finally, nutrient doses are usually lower in CRFs than those applied with traditional fertilizers, and N losses by evaporation or leaching consistently lower.
In two experiments, this research compares the effectiveness of two lignosulfonate-based polymer-coated urea fertilizers: an analogous non-coated urea, and ammonium nitrosulfate as a traditional fertilizer. Based on the experimental design, the CRF with the best behavior was selected based on the responses of wheat to different physiological and yield parameters on the microscale. In a second stage, the selected CRF was compared with ammonium nitrosulfate in the field. In physiological terms, significant differences were found in growth, chlorophyll content and ΦPSII among CRFA, CRFB and DURAMON® compared with the untreated plants in early crop development stages. Lower values of E and higher of Ci were detected in plants treated with DURAMON®, as compared to the CRFs treatments. Intrinsic efficiency in the water use of CRFA was significantly higher compared to CRFB and DURAMON®. To explain these results, the enhanced effects of CRFs were produced by a combination of the individual effects of lignosulfonates and biostimulants on nutrient supply. In fact, lignosulfonates or sulfonated lignin have a variety of functional groups that provide unique colloidal properties and act as chelating agents [53]. The humic substances contained in CRFA may promote plant development by stimulating root and shoot growth as they can enhance nutrient use efficiency by facilitating the assimilation of macro- and microelements [54,55]. Seaweed extracts can enhance chlorophyll and carotenoid contents in plant shoots, root thickness, and biomass [56]. However, the effectiveness of marketed biostimulants depends very much on their origin because their composition and proportions usually change [57].
Better physiological responses in the state of panicles formation suggest that plants would increase yield and biomass parameters at the end of the crop. A significant correlation was also found between higher levels of photosynthesis during grain formation and increased crop yields obtained in wheat [58,59]. In fact, on a microscale, the total yield expressed in dry grain weight was significantly higher in CRFA than in CRFB; and was, on average, also higher than DURAMON®. The observed differences were due to a large number of grains harvested by the production of 1.1-fold more spikes in the plants fertilized with CRFA compared to CRFB and DURAMON®. On average the plants fertilized with DURAMON® produced larger sized and heavier spikes with more grains. This could be explained by the faster N-release kinetics of DURAMON® compared to CRFs, as lacking lignosulfonate-polymeric coverage. A bigger N supply in the first crop stages could explain why the plants fertilized with DURAMON® seemed to be slightly more advanced in their phenological status compared to CRFs. Physiological requirements of wheat are established as 3 kg N Qm−1 grain; therefore, the theoretical yield that should have been obtained at a dose of 150 kg N ha−1 was 5 t ha−1. Our results showed exceeded yields of 6.4 grain t ha−1 with CRFA, 5.3 grain t ha−1 with CRFB and 5.8 grain t ha−1 with DURAMON®. Despite DURAMON® not being a CRF because it lacks polymer-coating, it could be considered an SRF for being formulated with urease inhibitor MCDHS, which is also contained in CRFs. This would explain why the DURAMON®-treated plants gave yields close to CRFs. In fact, the minor differences between DURAMON® and CRFs might indicate that DURAMON® could be also used successfully to maintain N availability for plants over time in wheat. As examples, when using nitrification and urease inhibitors in wheat, maize and barley, it was obtained better crop yields and N2O mitigation than SRCFs [2]. Further, better performance for CRFs and those formulated with nitrification inhibitors compared to traditional ones in maize with a reduction in N2O emissions up to 21% that did not affect yields [39]. The lower yields obtained with CRFB could be explained by excessive N emission slowdown by having formulated with a 2% thicker polymeric coverage. The best results obtained with CRFA were confirmed at field level when comparing the NUE between the applied fertilizer treatments. It was possible to obtain yields close to those observed with CRFA 100% and NSA, by applying CRFA with a 20% less N content, but significantly increasing the NUE by more than four times. Even though it has been reported that NUE can vary depending on factors like the doses applied or climatic conditions [2], no reductions in grain yield were observed when applying different CRF formulations by reducing N content in a similar proportion [60,61].
The macronutrients analysis showed that wheat plants had a good NPK nutritional status in phenological state at the beginning of ear formation. The N concentrations in the treated plants fell within the N leaf DW 4–6% range, which is considered suitable for obtaining high yields [62], but no statistically significant differences appeared in the applied treatments. On the contrary, P concentrations were 1.2-fold significantly higher in CRFA than in CRFB and DURAMON®. In all cases, P levels fell within the range considered optimal for good plant development (0.2–0.5% leaf DW). Although the applied N fertilizer was not mixed with P, it is known that soil N applications can stimulate root growth and increase cation exchange capacity to favor Ca uptake, and P uptake indirectly [63]. In cereals, increased yields and improvements in the content of macro- and micronutrients of crops have been achieved in barley, maize, rice, or wheat using SCRFs [15,64,65,66,67,68,69]. No significant differences were found in the K, Ca, Mg, and S contents in leaves among treatments, and their levels were medium to high. Regarding micronutrients, the plants fertilized with CRFA presented 1.7- and 1.5-fold higher Fe levels than CRFB and DURAMON®, respectively. However, the Fe levels were optimum for maximum yields (21–200 mg kg−1 leaf DW). Cu and Zn contents were 1.4- and 1.2-fold significantly higher in the plants fertilized with CRFs compared to those fertilized with DURAMON®, but concentrations were at the lowest levels within the range considered normal for Cu and Zn (5–50 and 20–70 mg kg−1 foliar DW, respectively). The Mn content did not differ significantly for the different fertilizer treatments and presented lower levels (16–200 mg kg−1 leaf DW). Fertilizer treatments did not significantly affect B content as the CONTROL plants had similar levels. The Mo levels were very low and were lower than 2 mg kg−1 leaf DW in all the treatments.

5. Conclusions

In the present study, we have carried out a comparison of two lignin-coated controlled release fertilizers enriched with humic substances (CRFA) or seaweed extracts (CRFB) with a similar non polymeric-coated fertilizer (DURAMON®) and with an ammonium nitrosulfate one (NSA). Our results showed that plants performed better when they were fertilized with CRFs coated with humic substances, although the improvement in crop yield was not excessive compared to the seaweed-coated one and that the uncoated one. However, a significant improvement in crop yield and the measured physiological parameters of wheat plants was achieved with Fertinagro’s controlled release fertilizers compared to the traditional NSA. Fertilization with these new technified CRFs greatly favored the wheat crop management by making it possible to carry out one single application as a basal dressing, which simplified crop handling. Smaller amounts of N in formulations gave important advantages, such as reduced costs and minimized N losses, which thus avoids the common contamination problems that usually occur when applying traditional fertilizers. We conclude that it is possible to use this technology in extensive cropping, as lignin-based polymers are economically feasible and environmentally friendly.

Author Contributions

Conceptualization, R.G.-O.; data curation, R.G.-O., and A.R.-N.; formal analysis, R.G.-O. and A.R.-N.; funding acquisition, M.Á.N., O.V. and S.A.; investigation, R.G.-O., A.R.-N., and M.C.-M.; methodology, R.G.-O., M.Á.N., A.R.-N., C.G., and O.V.; project administration, M.Á.N.; supervision, C.G. and O.V.; validation, O.V., A.R.-N.; visualization, M.Á.N., M.C.-M., and S.A.; writing–original draft, R.G.-O.; writing–review and editing, R.G.-O., O.V., and A.R.-N. All authors have read and agreed to the published version of the manuscript.

Funding

This research was funded by the Spanish Ministry of Economy and Competitiveness, grant number RTC-2014-1457-5, with the project entitled “Los CRFs como alternativa a los fertilizantes tradicionales: buscando una mayor protección del medio ambiente”.

Acknowledgments

The authors are grateful to Manuel Talón (Centre of Genomics–IVIA) to provide the facilities to develop the greenhouse experiments and Ángel Boix for his support in the plants maintenance.

Conflicts of Interest

The authors declare no conflict of interest.

References

  1. FAOSTAT. Available online: http://www.fao.org/faostat/en/#data/QC (accessed on 23 February 2020).
  2. Feng, J.F.; Li, F.B.; Deng, A.X.; Feng, X.M.; Fang, F.P.; Zhang, W.J. Integrated assessment of the impact of enhanced-efficiency nitrogen fertilizer on N2O emission and crop yield. Agric. Ecosyst. Environ. 2016, 231, 218–228. [Google Scholar] [CrossRef]
  3. Zuk-Golaszewska, K.; Zeranskal, A.; Krukowska, A.; Bojarczuk, J. Biofortification of the nutritional value of foods from the grain of Triticum durum desf. by an agrotechnical method: A scientific review. J. Elem. 2016, 21, 963–975. [Google Scholar]
  4. Barakat, M.; Cheviron, B.; Angulo-Jaramillo, R. Influence of the irrigation technique and strategies on the nitrogen cycle and budget: A review. Agric. Water Manage. 2016, 178, 225–238. [Google Scholar] [CrossRef]
  5. Zak, D.R.; Holmes, W.E.; MacDonald, N.W.; Pregitzer, K.S. Soil temperature, matric potential, and the kinetics of microbial respiration and nitrogen mineralization. Soil Sci. Soc. Am. J. 1999, 63, 575–584. [Google Scholar] [CrossRef] [Green Version]
  6. Achat, D.L.; Augusto, L.; Gallet-Budynek, A.; Loustau, D. Future challenges in coupled C–N–P cycle models for terrestrial ecosystems under global change: A review. Biogeochemistry 2016, 131, 173–202. [Google Scholar] [CrossRef]
  7. Di, H.J.; Cameron, K.C. Inhibition of nitrification to mitigate nitrate leaching and nitrous oxide emissions in grazed grassland: A review. J. Soils Sediments 2016, 16, 1401–1420. [Google Scholar] [CrossRef]
  8. Akelah, A. Novel utilizations of conventional agrochemicals by controlled release formulations. Mater. Sci. Eng. C-Biomimetic Mater. Sens. Syst. 1996, 4, 83–98. [Google Scholar] [CrossRef]
  9. Shaviv, A.; Mikkelsen, R.L. Controlled-release fertilizers to increase efficiency of nutrient use and minimize environmental degradation - A review. Fertil. Res. 1993, 35, 1–12. [Google Scholar] [CrossRef]
  10. Ni, X.Y.; Wu, Y.J.; Wu, Z.Y.; Wu, L.; Qiu, G.N.; Yu, L.X. A novel slow-release urea fertiliser: Physical and chemical analysis of its structure and study of its release mechanism. Biosyst. Eng. 2013, 115, 274–282. [Google Scholar]
  11. Prasad R, R.G.B.; Lakhdive, B.A. Nitrification retarders and slow-release nitrogen fertilizers. Adv. Agron. 1971, 23, 337–383. [Google Scholar]
  12. Wang, Z.H.; Miao, Y.F.; Li, S.X. Wheat responses to ammonium and nitrate N applied at different sown and input times. Field Crops Res. 2016, 199, 10–20. [Google Scholar] [CrossRef]
  13. Naz, M.Y.; Sulaiman, S.A. Slow release coating remedy for nitrogen loss from conventional urea: A review. J. Control. Release 2016, 225, 109–120. [Google Scholar] [CrossRef] [PubMed]
  14. Chien, S.H.; Prochnow, L.I.; Cantarella, H. Recent developments of fertilizer production and use to improve nutrient efficiency and minimize environmental impacts. In Advances in Agronomy; Sparks, D.L., Ed.; Elsevier Academic Press Inc: San Diego, CA, USA, 2009; Volume 102, pp. 267–322. [Google Scholar]
  15. Diez, J.A.; Caballero, R.; Bustos, A.; Roman, R.; Cartagena, M.C.; Vallejo, A. Control of nitrate pollution by application of controlled release fertilizer (CRF), compost and an optimized irrigation system. Fertil. Res. 1996, 43, 191–195. [Google Scholar] [CrossRef]
  16. Halvorson, A.D.; Snyder, C.S.; Blaylock, A.D.; Del Grosso, S.J. Enhanced-Efficiency Nitrogen Fertilizers: Potential role in nitrous oxide emission mitigation. Agron. J. 2014, 106, 715–722. [Google Scholar] [CrossRef]
  17. Carson, L.C.; Ozores-Hampton, M. Factors affecting nutrient availability, placement, rate, and application timing of controlled-release fertilizers for Florida vegetable production using seepage irrigation. Horttechnology 2013, 23, 553–562. [Google Scholar] [CrossRef] [Green Version]
  18. Azeem, B.; KuShaari, K.; Man, Z.B.; Basit, A.; Thanh, T.H. Review on materials & methods to produce controlled release coated urea fertilizer. J. Control. Release 2014, 181, 11–21. [Google Scholar] [PubMed]
  19. Herrera, J.M.; Rubio, G.; Haner, L.L.; Delgado, J.A.; Lucho-Constantino, C.A.; Islas-Valdez, S.; Pellet, D. Emerging and Established Technologies to Increase Nitrogen Use Efficiency of Cereals. Agronomy-Basel 2016, 6, 25. [Google Scholar] [CrossRef] [Green Version]
  20. Dou, H.; Alva, A.K. Nitrogen uptake and growth of two citrus rootstock seedlings in a sandy soil receiving different controlled-release fertilizer sources. Biol. Fert. Soils 1998, 26, 169–172. [Google Scholar] [CrossRef]
  21. Razali, R.; Daud, H.; Nor, S.M. Modelling and Simulation of Nutrient Dispersion from Coated Fertilizer Granules. In Proceedings of the 3rd International Conference on Fundamental and Applied Sciences, Kuala Lumpur, Malaysia, 3–5 June 2014; pp. 442–448. [Google Scholar]
  22. Feng, C.; Lu, S.Y.; Gao, C.M.; Wang, X.G.; Xu, X.B.; Bai, X.; Gao, N.N.; Liu, M.Z.; Wu, L. "Smart" fertilizer with temperature- and pH-responsive behavior via surface-initiated polymerization for controlled release of nutrients. ACS Sustain. Chem. Eng. 2015, 3, 3157–3166. [Google Scholar] [CrossRef]
  23. Kenawy, E.R. Recent advances in controlled release of argochemicals. J. Macromol. Sci.-Rev. Macromol. Chem. Phys. 1998, C38, 365–390. [Google Scholar] [CrossRef]
  24. Dubey, S.; Jhelum, V.; Patanjali, P.K. Controlled release agrochemicals formulations: A review. J. Sci. Ind. Res. India 2011, 70, 105–112. [Google Scholar]
  25. Majeed, Z.; Ramli, N.K.; Mansor, N.; Man, Z. A comprehensive review on biodegradable polymers and their blends used in controlled-release fertilizer processes. Rev. Chem. Eng. 2015, 31, 69–96. [Google Scholar] [CrossRef]
  26. Chowdhury, M.A. The controlled release of bioactive compounds from lignin and lignin-based biopolymer matrices. Int. J. Biol. Macromol. 2014, 65, 136–147. [Google Scholar] [CrossRef] [PubMed]
  27. Fernandez-Perez, M.; Garrido-Herrera, F.J.; Gonzalez-Pradas, E.; Villafranca-Sanchez, M.; Flores-Cespedes, F. Lignin and ethylcellulose as polymers in controlled release formulations of urea. J. Appl. Polym. Sci. 2008, 108, 3796–3803. [Google Scholar] [CrossRef]
  28. Abalos, D.; Jeffery, S.; Sanz-Cobena, A.; Guardia, G.; Vallejo, A. Meta-analysis of the effect of urease and nitrification inhibitors on crop productivity and nitrogen use efficiency. Agric. Ecosyst. Environ. 2014, 189, 136–144. [Google Scholar] [CrossRef]
  29. Battacharyya, D.; Babgohari, M.Z.; Rathor, P.; Prithiviraj, B. Seaweed extracts as biostimulants in horticulture. Sci. Hortic. 2015, 196, 39–48. [Google Scholar] [CrossRef]
  30. Calvo, P.; Nelson, L.; Kloepper, J.W. Agricultural uses of plant biostimulants. Plant Soil 2014, 383, 3–41. [Google Scholar] [CrossRef] [Green Version]
  31. Canellas, L.P.; Olivares, F.L.; Aguiar, N.O.; Jones, D.L.; Nebbioso, A.; Mazzei, P.; Piccolo, A. Humic and fulvic acids as biostimulants in horticulture. Sci. Hortic. 2015, 196, 15–27. [Google Scholar] [CrossRef]
  32. Colla, G.; Nardi, S.; Cardarelli, M.; Ertani, A.; Lucini, L.; Canaguier, R.; Rouphael, Y. Protein hydrolysates as biostimulants in horticulture. Sci. Hortic. 2015, 196, 28–38. [Google Scholar] [CrossRef]
  33. du Jardin, P. Plant biostimulants: Definition, concept, main categories and regulation. Sci. Hortic. 2015, 196, 3–14. [Google Scholar] [CrossRef] [Green Version]
  34. Birrenkott, B.A.; Craig, J.L.; McVey, G.R. A leach collection system to track the release of nitrogen from controlled-release fertilizers in container ornamentals. Hortscience 2005, 40, 1887–1891. [Google Scholar] [CrossRef] [Green Version]
  35. Clark, M.J.; Zheng, Y.B. Species-specific fertilization can benefit container nursery crop production. Can. J. Plant Sci. 2015, 95, 251–262. [Google Scholar] [CrossRef]
  36. Cox, D.A. Reducing nitrogen leaching-losses from containerized plants - the effectiveness of controlled-release fertilizers. J. Plant Nutr. 1993, 16, 533–545. [Google Scholar] [CrossRef]
  37. Agegnehu, G.; Nelson, P.N.; Bird, M.I. The effects of biochar, compost and their mixture and nitrogen fertilizer on yield and nitrogen use efficiency of barley grown on a Nitisol in the highlands of Ethiopia. Sci. Total Environ. 2016, 569–570, 869–879. [Google Scholar] [CrossRef] [PubMed]
  38. Huett, D.O.; Gogel, B.J. Longevities and nitrogen, phosphorus, and potassium release patterns of polymer-coated controlled-release fertilizers at 30 degrees C and 40 degrees C. Commun. Soil Sci. Plan. 2000, 31, 959–973. [Google Scholar] [CrossRef]
  39. Yang, L.; Wang, L.G.; Li, H.; Qiu, J.J.; Liu, H.Y. Impacts of fertilization alternatives and crop straw incorporation on N2O emissions from a spring maize field in Northeastern China. J. Integr. Agric. 2014, 13, 881–892. [Google Scholar] [CrossRef]
  40. Harrison, R.; Webb, J. A review of the effect of N fertilizer type on gaseous emissions. In Advances in Agronomy; Sparks, D.L., Ed.; Elsevier Academic Press Inc: San Diego, CA, USA, 2001; Volume 73, pp. 65–108. [Google Scholar]
  41. Obreza, T.A.; Rouse, R.E.; Sherrod, J.B. Economics of controlled-release fertilizer use on young citrus trees. J. Prod. Agric. 1999, 12, 69–73. [Google Scholar] [CrossRef]
  42. Garcia, C.; Vallejo, A.; Diez, J.A.; Garcia, L.; Cartagena, M.C. Nitrogen use efficiency with the application of controlled release fertilizers coated with kraft pine lignin. Soil Sci. Plant Nutr. 1997, 43, 443–449. [Google Scholar] [CrossRef]
  43. Treinyte, J.; Grazuleviciene, V.; Ostrauskaite, J. Biodegradable polymer composites with nitrogen- and phosphorus-containing waste materials as the fillers. Ecol. Chem. Eng. S. 2014, 21, 515–528. [Google Scholar]
  44. Medina, L.C.; Sartain, J.B.; Obreza, T.A.; Hall, W.L.; Thiex, N.J. Evaluation of a soil incubation method to characterize nitrogen release patterns of slow- and controlled-release fertilizers. J. AOAC Int. 2014, 97, 643–660. [Google Scholar] [CrossRef]
  45. Gasparin, E.; Araujo, M.M.; Saldanha, C.W.; Tolfo, C.V. Controlled release fertilizer and container volumes in the production of Parapiptadenia rigida (Benth.) Brenan seedlings. Acta Sci.-Agron. 2015, 37, 473–481. [Google Scholar] [CrossRef] [Green Version]
  46. Haver, D.L.; Schuch, U.K. Production and postproduction performance of two New Guinea Impatiens cultivars grown with controlled-release fertilizer and no leaching. J. Am. Soc. Hortic. Sci. 1996, 121, 820–825. [Google Scholar] [CrossRef] [Green Version]
  47. Jacobs, D.F.; Salifu, K.F.; Seifert, J.R. Growth and nutritional response of hardwood seedlings to controlled-release fertilization at outplanting. For. Ecol. Manage. 2005, 214, 28–39. [Google Scholar] [CrossRef]
  48. Kaplan, L.; Tlustos, P.; Szakova, J.; Najmanova, J. The influence of slow-release fertilizers on potted chrysanthemum growth and nutrient consumption. Plant Soil Environ. 2013, 59, 385–391. [Google Scholar] [CrossRef] [Green Version]
  49. Kinoshita, T.; Yano, T.; Sugiura, M.; Nagasaki, Y. Effects of controlled-release fertilizer on leaf area index and fruit yield in high-density soilless tomato culture using low node-order pinching. PLoS ONE 2014, 9, 10. [Google Scholar] [CrossRef]
  50. Kinoshita, T.; Yamazaki, H.; Inamoto, K.; Yamazaki, H. Analysis of yield components and dry matter production in a simplified soilless tomato culture system by using controlled-release fertilizers during summer-winter greenhouse production. Sci. Hortic. 2016, 202, 17–24. [Google Scholar] [CrossRef]
  51. Oliet, J.; Planelles, R.; Segura, M.L.; Artero, F.; Jacobs, D.F. Mineral nutrition and growth of containerized Pinus halepensis seedlings under controlled-release fertilizer. Sci. Hortic. 2004, 103, 113–129. [Google Scholar] [CrossRef]
  52. Pack, J.E.; Hutchinson, C.M.; Simonne, E.H. Evaluation of controlled-release fertilizers for northeast Florida chip potato production. J. Plant Nutr. 2006, 29, 1301–1313. [Google Scholar] [CrossRef]
  53. Vishtal, A.; Kraslawski, A. Challenges in industrial applications of technical lignins. BioResources 2011, 6, 3547–3568. [Google Scholar]
  54. Cacco, G.; Attina, E.; Gelsomino, A.; Sidari, M. Effect of nitrate and humic substances of different molecular size on kinetic parameters of nitrate uptake in wheat seedlings. J. Plant Nutr. Soil Sci. 2000, 163, 313–320. [Google Scholar] [CrossRef]
  55. Nardi, S.; Ertani, A.; Francioso, O. Soil-root cross-talking: The role of humic substances. J. Plant Nutr. Soil Sci. 2017, 180, 5–13. [Google Scholar] [CrossRef]
  56. Michalak, I.; Gorka, B.; Wieczorek, P.P.; Roj, E.; Lipok, J.; Leska, B.; Messyasz, B.; Wilk, R.; Schroeder, G.; Dobrzynska-Inger, A.; et al. Supercritical fluid extraction of algae enhances levels of biologically active compounds promoting plant growth. Eur. J. Phycol. 2016, 51, 243–252. [Google Scholar] [CrossRef]
  57. Lotze, E.; Hoffman, E.W. Nutrient composition and content of various biological active compounds of three South African-based commercial seaweed biostimulants. J. Appl. Phycol. 2016, 28, 1379–1386. [Google Scholar] [CrossRef]
  58. Gaju, O.; DeSilva, J.; Carvalho, P.; Hawkesford, M.J.; Griffiths, S.; Greenland, A.; Foulkes, M.J. Leaf photosynthesis and associations with grain yield, biomass and nitrogen-use efficiency in landraces, synthetic-derived lines and cultivars in wheat. Field Crops Res. 2016, 193, 1–15. [Google Scholar] [CrossRef]
  59. Richards, R.A. Selectable traits to increase crop photosynthesis and yield of grain crops. J. Exp. Bot. 2000, 51, 447–458. [Google Scholar] [CrossRef] [PubMed]
  60. Ji, Y.; Liu, G.; Ma, J.; Xu, H.; Yagi, K. Effect of controlled-release fertilizer on nitrous oxide emission from a winter wheat field. Nutr. Cycl. Agroecosyst. 2012, 94, 111–122. [Google Scholar] [CrossRef]
  61. Zhang, J.S.; Wang, C.Q.; Li, B.; Liang, J.Y.; He, J.; Xiang, H.; Yin, B.; Luo, J. Effects of controlled release blend bulk urea on soil nitrogen and soil enzyme activity in wheat and rice fields. Chin. J. Appl. Ecol. 2017, 28, 1899–1908. [Google Scholar]
  62. Jones, J.B. Plant tissue analysis in micronutrients. In Micronutrients in Agriculture, 2nd ed.; Mortvedt, J.J., Ed.; Soil Science Society of America, Inc.: Madison, WI, USA, 1991; pp. 477–521. [Google Scholar]
  63. Grunes, D.L. Effect of nitrogen on the availability of soil and fertilizer phosphorus to plants. Adv. Agron. 1959, 11, 369–396. [Google Scholar]
  64. Zhao, B.; Dong, S.T.; Zhang, J.W.; Liu, P. Effects of controlled-release fertiliser on nitrogen use efficiency in summer maize. PLoS ONE 2013, 8, 8. [Google Scholar] [CrossRef] [Green Version]
  65. Dong, Y.J.; He, M.R.; Wang, Z.L.; Chen, W.F.; Hou, J.; Qiu, X.K.; Zhang, J.W. Effects of new coated release fertilizer on the growth of maize. J. Soil Sci. Plant Nutr. 2016, 16, 637–649. [Google Scholar] [CrossRef] [Green Version]
  66. Mi, W.H.; Yang, X.; Wu, L.H.; Ma, Q.X.; Liu, Y.L.; Zhang, X. Evaluation of nitrogen fertilizer and cultivation methods for agronomic performance of rice. Agron. J. 2016, 108, 1907–1916. [Google Scholar] [CrossRef]
  67. Roshanravan, B.; Soltani, S.M.; Mahdavi, F.; Rashid, S.A.; Yusop, M.K. Preparation of encapsulated urea-kaolinite controlled release fertiliser and their effect on rice productivity. Chem. Speciation Bioavailab. 2014, 26, 249–256. [Google Scholar] [CrossRef] [Green Version]
  68. Morikawa, C.K.; Saigusa, M.; Nakanishi, H.; Nishizawa, N.K.; Hasegawa, K.; Mori, S. Co-situs application of controlled-release fertilizers to alleviate iron chlorosis of Paddy rice grown in calcareous soil. Soil Sci. Plant Nutr. 2004, 50, 1013–1021. [Google Scholar] [CrossRef] [Green Version]
  69. Morikawa, C.K.; Saigusa, M.; Nishizawa, N.K.; Mori, S. Importance of contact between rice roots and co-situs applied fertilizer granules on iron absorption by paddy rice in a calcareous paddy soil. Soil Sci. Plant Nutr. 2008, 54, 467–472. [Google Scholar] [CrossRef]
Figure 1. Responses of fertilizer treatments on plant growth (A,B), foliar area (C,D) and root development (E) of Triticum aestivum in the phenological state of panicles swelling (A,C,D,E) and at the end of the experiment (B). Treatments from left to right: CRFA, CRFB, DURAMON®, and CONTROL. Bars correspond to 10 cm.
Agronomy 10 00438 g001
Figure 2. Gas exchange responses to different photosynthetically active radiation rates of Triticum aestivum treated with fertilizers CRFA, CRFB, DURAMON®, and CONTROL in the phenological state of panicles swelling (booting stage). (A) Stomatal conductance, (B) net photosynthetic rate, (C) transpiration rate, and (D) substomatal CO2 concentration. Values represent means ± SE (n = 6). Different letters for each treatment (same color) indicate statistically significant differences (ANOVA, P < 0.05).
Agronomy 10 00438 g002
Figure 3. Water-use efficiency responses to different photosynthetically active radiation rates of Triticum aestivum treated with fertilizers CRFA, CRFB, DURAMON®, and the CONTROL in the phenological state of panicles swelling (booting stage). (A) Water-use efficiency and (B) intrinsic water-use efficiency. Values represent means ± SE (n = 6). Different letters for each treatment (same color) indicate statistically significant differences (ANOVA, P < 0.05).
Agronomy 10 00438 g003
Figure 4. Macro- (A,C) and micronutrient (B,D) contents in leaves (A,B) and roots (C,D), for the different treatments with the polymeric-coated fertilizers (CRFA, CRFB), DURAMON®, and the CONTROL in the phenological state (booting stage). Results of macronutrients (N, P, K, Ca, Mg, and S) are expressed in percentage of DW, and micronutrients (Fe, Cu, Mn, Zn, B) in mg kg−1 DW. Values are means ± SD (n = 4). Different letters for a specific macro- or micronutrient in each panel indicate statistically significant differences between treatments (ANOVA, P < 0.05).
Agronomy 10 00438 g004
Table 1. Fertility of the soil used in the experimental analysis from the first 15 cm of soil surface. Data on total nitrogen (N), total carbon (C) and organic carbon (CO) and other macro- and micronutrients are shown. Values are means ± SD (n = 5) at the beginning of the experiment.
ParametersMean ± SD (%)
MicroscaleField
Total nitrogen (g 100 g−1)0.09 ± 0.020.19 ± 0.03
Total carbon (g 100 g−1)2.06 ± 0.286.76 ± 0.34
Organic carbon (g 100 g−1)0.66 ± 0.071.84 ± 0.28
pH8.75 ± 0.0958.26 ± 0.11
EC (µS cm−1)120.7± 27.99109.12 ± 47.40
P (g 100 g−1)0.064 ± 0.0010.03 ± 0.01
K (g 100 g−1)0.339 ± 0.140.74 ± 0.08
Mg (g 100 g−1)0.285 ± 0.040.26 ± 0.04
Ca (g 100 g−1)3.561 ± 0.421.35 ± 0.61
Fe (g 100 g−1)11.113 ± 1.7715.94 ± 6.27
Cu (mg kg−1)15.929 ± 1.457.46 ± 1.81
Mn (mg kg−1)191.99 ± 11.68216.75 ± 73.57
Zn (mg kg−1)26.951 ± 2.5024.66 ± 4.61
Table 2. Effects of fertilizer treatments CRFA, CRFB, and DURAMON® on photosynthetic parameters (effective quantum yield of photosystem II—ΦPSII, leaf greenness, nitrogen content, total fresh weight of aerial parts (g), dry weight of aerial parts (%), photosynthetically active flag leaves—PAFL fresh weight, PAFL area, and leaf area index—LAI) in Triticum aestivum leaves compared to the Control in the phenological state of panicles swelling (booting state). Values are means ± SD (n = 18 for ΦPSII, leaf greenness, and N content; n = 8 for the other growth parameters).
ParametersCRFACRFBDURAMON®CONTROL
ΦPSII0.69 ± 0.03 b0.69 ± 0.03 b0.68 ± 0.03 b0.58 ± 0.07 a
Leaf greenness content (SPAD units)54.5 ± 2.3 b52.5 ± 2.3 b54 ± 1.5 b40.2 ± 6.8 a
N content (%)5.5 ± 0.4 b5 ± 0.3 ab5.3 ± 0.4 ab3.5 ± 0.9 a
Total fresh weight (aerial part) (g)58.9 ± 9.3 b46.9 ± 20.9 ab79.6 ± 15.9 c38.5 ± 10.5 a
Dry weight (aerial part) (%)29 ± 8 a33.3 ± 7.6 ab35.4 ± 3.2 ab32.9 ± 3.5 b
PAFL fresh weight (g)24.5 ± 12.7 b26.6 ± 25.5 b27.2 ± 9.2 b2.8 ± 3.8 a
PAFL dry weight (%)6.13 ± 3.02 b6.67 ± 5.81 b7.23 ± 2.09 b0.89 ± 1.13 a
PALF area (cm2)200.2 ± 69.8 b156.9 ± 96.7 b229.5 ± 72.7 b67.6 ± 43.1 a
LAI1 ± 0.3 b0.8 ± 0.5 b1.1 ± 0.4 b0.3 ± 0.2 a
1 Different letters in the same row indicate significant statistical differences (Fisher’s LSD test, P < 0.05).
Table 3. Comparison of growth and grain yield parameters among the applied fertilizer treatments CRFA, CRFB, and DURAMON® compared to the Control in Triticum aestivum. Values are means ± SD (n = 10) at the end of the culture—138 days after plant emergence.
ParametersCRFACRFBDURAMON®CONTROL
Total dry weight (aerial part) (g)40.2 ± 3.4 b36.7 ± 6.0 ab41.4 ± 7.7 b31.7 ± 3.9 a
Primary stem length (cm)60.8 ± 2.1 a61.1 ± 3.0 a53.3 ± 7.9 a53.6 ± 10.0 a
Tillers number10.0 ± 0.9 a10.2 ± 1.6 a9.8 ± 2.8 a11.5 ± 2.4 a
Ears number10.7 ± 1.3 a9.8 ± 1.1 a9.7 ± 2.3 a9.2 ± 2.1 a
Ear weight (g)2.7 ± 0.2 ab2.4 ± 0.2 ab3.0 ± 0.3 b2.0 ± 0.2 a
Ear length (cm)13.4 ± 0.4 ab13.2 ± 0.9 ab13.9 ± 0.3 b12.9 ± 0.9 a
Total dry grain weight (g)22.6 ± 2.0 c18.6 ± 2.7 b20.4 ± 3.2 bc15.9 ± 3.0 a
Grain weight (n = 100)4.8 ± 0.2 b4.8 ± 0.4 b4.8 ± 0.3 b4.4 ± 0.3 a
Total grain number473.7 ± 46.3 c392.7 ± 67.4 ab428.4 ± 79.8 bc364.7 ± 52.8 a
1 Different letters in the same row indicate statistically significant differences (Fisher’s LSD test, P < 0.05).
Table 4. Field harvest comparison of the growth parameters and grain yield of Triticum spelta among the different applied fertilizer treatments CRFA 100%, CRFA 80%, and NSA compared to the Control. Values are means ± SD (n = 10) at the end of the culture—90 days after applying fertilizers.
ParametersCRFA 100%CRFA 80%NSACONTROL
Biomass of the aerial part (t ha−1)9.32 ± 1.34 b9.61 ± 1.86 b8.78 ± 1.41 b4.91 ± 1.82 a
Ear weight (t ha−1)3.58 ± 0.54 b3.67 ± 0.54 b3.76 ± 0.67 b1.91 ± 0.46 a
Grain weight (t ha−1)2.35 ± 0.45 b2.49 ± 0.12 b2.19 ± 0.37 b1.16 ± 0.43 a
Nitrogen Use Efficiency (kg kg−1 N)14.93 ± 5.58 a20.76 ± 1.88 b12.89 ± 4.66 a-
Harvest Index0.31 ± 0.05 a0.33 ± 0.08 a0.3 ± 0.01 a0.29 ± 0.02 a
1 Different letters in the same row indicate statistically significant differences (Fisher’s LSD test, P < 0.05).

