Article

Effect of Rice Residue Retention and Foliar Application of K on Water Productivity and Profitability of Wheat in North West India

1
ICAR- Indian Institute of Wheat and Barley Research, Karnal-132 001, Haryana, India
2
ICAR- Central Soil Salinity Research Institute, Karnal-132 001, Haryana, India
*
Author to whom correspondence should be addressed.
Agronomy 2020, 10(3), 434; https://doi.org/10.3390/agronomy10030434
Submission received: 5 February 2020 / Revised: 11 March 2020 / Accepted: 19 March 2020 / Published: 21 March 2020

Abstract

:
The rice–wheat cropping system being the backbone of food security in South-Asia has resulted in soil health deterioration, declining water table, and air pollution affecting livability index of the region. The effect of rice residue retention (RRR), irrigation levels and foliar application of K on wheat grain yield (GY), water use efficiency (WUE) and profitability was tested over three years. RRR increased wheat GY (5224 kg ha−1), above-ground biomass (AGBM = 11.9 t ha−1), tillers per square meter (TPM = 469) and grains per meter square (GrPMS = 13,917) significantly. Relative water content (RWC = 93.8) and WUE (2.45 k gm−3) were also increased significantly by RRR. Consequently, profitability (Net return = 624.4 $ and Benefit to cost (B:C) ratio) was enhanced. Foliar application of K enhanced GY (5151 kg ha−1), AGBM (12 t ha−1), RWC (94.1), SPAD (52.2), WUE (2.40 kg m−3), net returns (625.2 $) and BC ratio (1.62) significantly. RRR increased GY (15.66%) and WUE (17.39%) with additional revenue of 151 $ with only one irrigation at the CRI stage (ICS). RRR adopted over 10% of the area can earn 187 million-US$ annually. RRR if adopted over existing practice on a large area would reduce environmental degradation with an enhanced income to small and marginal farmers.

1. Introduction

The rice–wheat system is one of the important food production systems in South Asia contributing to food security of the region [1]. This system is prevalent in the fertile, alluvial Indo-Gangetic Plains of India [2,3,4]. In addition to feeding the region with plenty of rice and wheat (~100 million tons each annually) [5] the rice–wheat system generates an estimated 23 million tons of rice residue which is being burnt in about 2.5 million farms annually [6]. Rice residue burning is mainly due to the compelling situation faced by farmers in the region where they have to prepare the field for subsequent wheat crop in just 20–25 days or its removal from fields alternatively adds burden of an additional operation and extra labor which will increase the total cost of cultivation.
Burning of rice residue emits an enormous amount of poisonous gases and particulate matter [7] which hastens the already existing environmental pollution and especially the deterioration of air quality [8,9]. The involvement of rice residue burning in enhancing the air pollution in Northern India has been reported by several researchers [7,9,10,11,12]. Along with contributing to air pollution, residue burning also leads to loss of approximately 80%–90% N, 25% of P, 20% of K and 50% of S present in crop residues in the form of various gaseous and particulate matter [7]. Further, burning also leads to loss of billions of agriculturally important microbial species present in soil which in turn affects the soil health severely [13].
In addition to challenges posed by residue burning the continuous practice of rice–wheat cropping system has also caused to declining soil fertility and water table, therefore becoming a threat to sustainability [14,15,16,17]. The declining ground water resources on which 98% of wheat in India is dependent for irrigation is also a major cause of concern as moisture stress conditions affects crop growth and productivity [18].
Potassium is a key element involved in plant water balance mechanisms and therefore plays an important role in moisture stress tolerance of plants [19,20]. In spite of having substantial potassium reserves [21], a large quantity of K is removed by intensive cropping system. Therefore, supplementing this K through soil or foliar application becomes essential.
Urgent action is necessary for making agriculture profitable and sustainable to attain the sustainable development goal (SDG) of zero hunger [22]. The residue burning is indirectly affecting as many as seven SGD’s of United Nations viz., no poverty, zero hunger, good health and well-being, clean water and sanitation, climate action, life on land, and life below water [23]. The challenges posed by rice–wheat cropping system can be addressed by adopting numerous approaches such as crop diversification, intensification, precision nutrient management such as foliar application of nutrients, residue incorporation, incorporation of farmyard manure, and conservation agriculture [9,24,25,26,27,28].
Continuous practice of rice–wheat cropping system has posed many challenges such as soil health deterioration, declining water table and air pollution resulting from rice residue burning. The hypothesis that whether RRR combined with foliar application of K can enhance wheat GY, profitability and WUE under different irrigation regimes was tested in this study. The study was planned with the objective to find out the effect of RRR, irrigation levels and foliar application of K on wheat GY parameters, WUE and profitability.

2. Materials and Methods

2.1. Experimental Site

The present study was conducted consecutively for three years (2015–16 to 2017–18) at research farm of ICAR-Indian Institute of Wheat and Barley Research, Karnal (29°43′ N, 76°58′ E, 245 m above mean sea level) Haryana, India. The experimental site represents the semi-arid and sub-tropical climate and characterized by three distinguished seasons, i.e., monsoon season (July–October), winter (November–March) and summer (April–June) with hot, dry to wet summers (May–October), and cool, dry winters (November–April). The soil (0–15 cm layer) of the study site was sandy loam in texture (sand 63.1%, silt 26.7%, clay 10.2%) typical of the Indo–Gangetic plains of India having a soil pH and EC of 7.3 and 0.23 dS m−1, respectively (1:2 soil:water). The soil had 0.42% organic carbon [29], 198 kg ha−1 available N [30], 18.2 kg ha−1 available P [31], and 232 kg ha−1 available K [32] at the beginning of the experiment when soil was analyzed before application of nutrient fertilizers. The soil had a bulk density of 1.47 kg m−3 in the crop root zone up to 1 m depth, field capacity (FC) of 21.87% and permanent wilting point (PWP) of 10.94% [33]. The stored soil moisture content measured before sowing every year at the start of experiment using gravimetric method [34] and were 17.02%, 18.20%, and 17.30% respectively.

2.2. Experiment and Field Management

The experiment included treatments on RRR, irrigation levels and K as foliar application to study their effect on wheat GY, WUE and profitability. The experiment was conducted in split-split plot design and replicated three times using 8 × 2 m2 plots with rows at 20 cm apart. The crop sequence followed in the region is sowing of rice in monsoon season (Jul–Oct) followed by winter crop of wheat (Nov–Apr). The experiment was planted in the month of November (20th November 2015, 22nd November 2016 and 29th November 2017) after harvest of previous rice crop. Spring wheat variety HD 2967 was sown with a seeding density of approximately 250 plants m−2 using a calibrated precision seed drill popularly known as “Bhopal Drill” designed and developed by ICAR-Central Institute for Agricultural Engineering, Bhopal, India. All recommended agronomic practices for the region were carried out at the proper time [35] except for treatment imposed. A uniform fertilizer rate of 150 kg N ha−1, 60 kg P2O5 ha−1 and 30 kg K2O ha−1 was applied to avoid any nutrient stress as per the local recommended package of practices [35]. The whole quantity of phosphorus and potassium was applied before sowing as broadcast followed by incorporation with the last ploughing of field preparation through 12:32:16 NPK complex fertilizer. The remaining N was applied as top dressing. Weeds, disease and insect control were uniformly managed according to the local recommended practices so these were not confounding factors in the experiment.

2.3. Climate at the Experimental Site

The average annual maximum and minimum air temperatures are 29.9 °C and 17.1 °C, respectively. Out of the total annual rainfall of 744 mm, 75%–80% is received during the southwest monsoon (July–September) period. The diurnal variation in weather parameters were recorded during the experimental years (Figure 1). The long term average minimum and maximum data of weather parameters for the period between 1972 and 2017 were obtained from the data repository maintained by ICAR—Central Soil Salinity Research Institute, Karnal. The long term diurnal temperature and precipitation data were used to calculate the long term average values.

2.4. Treatment Imposition

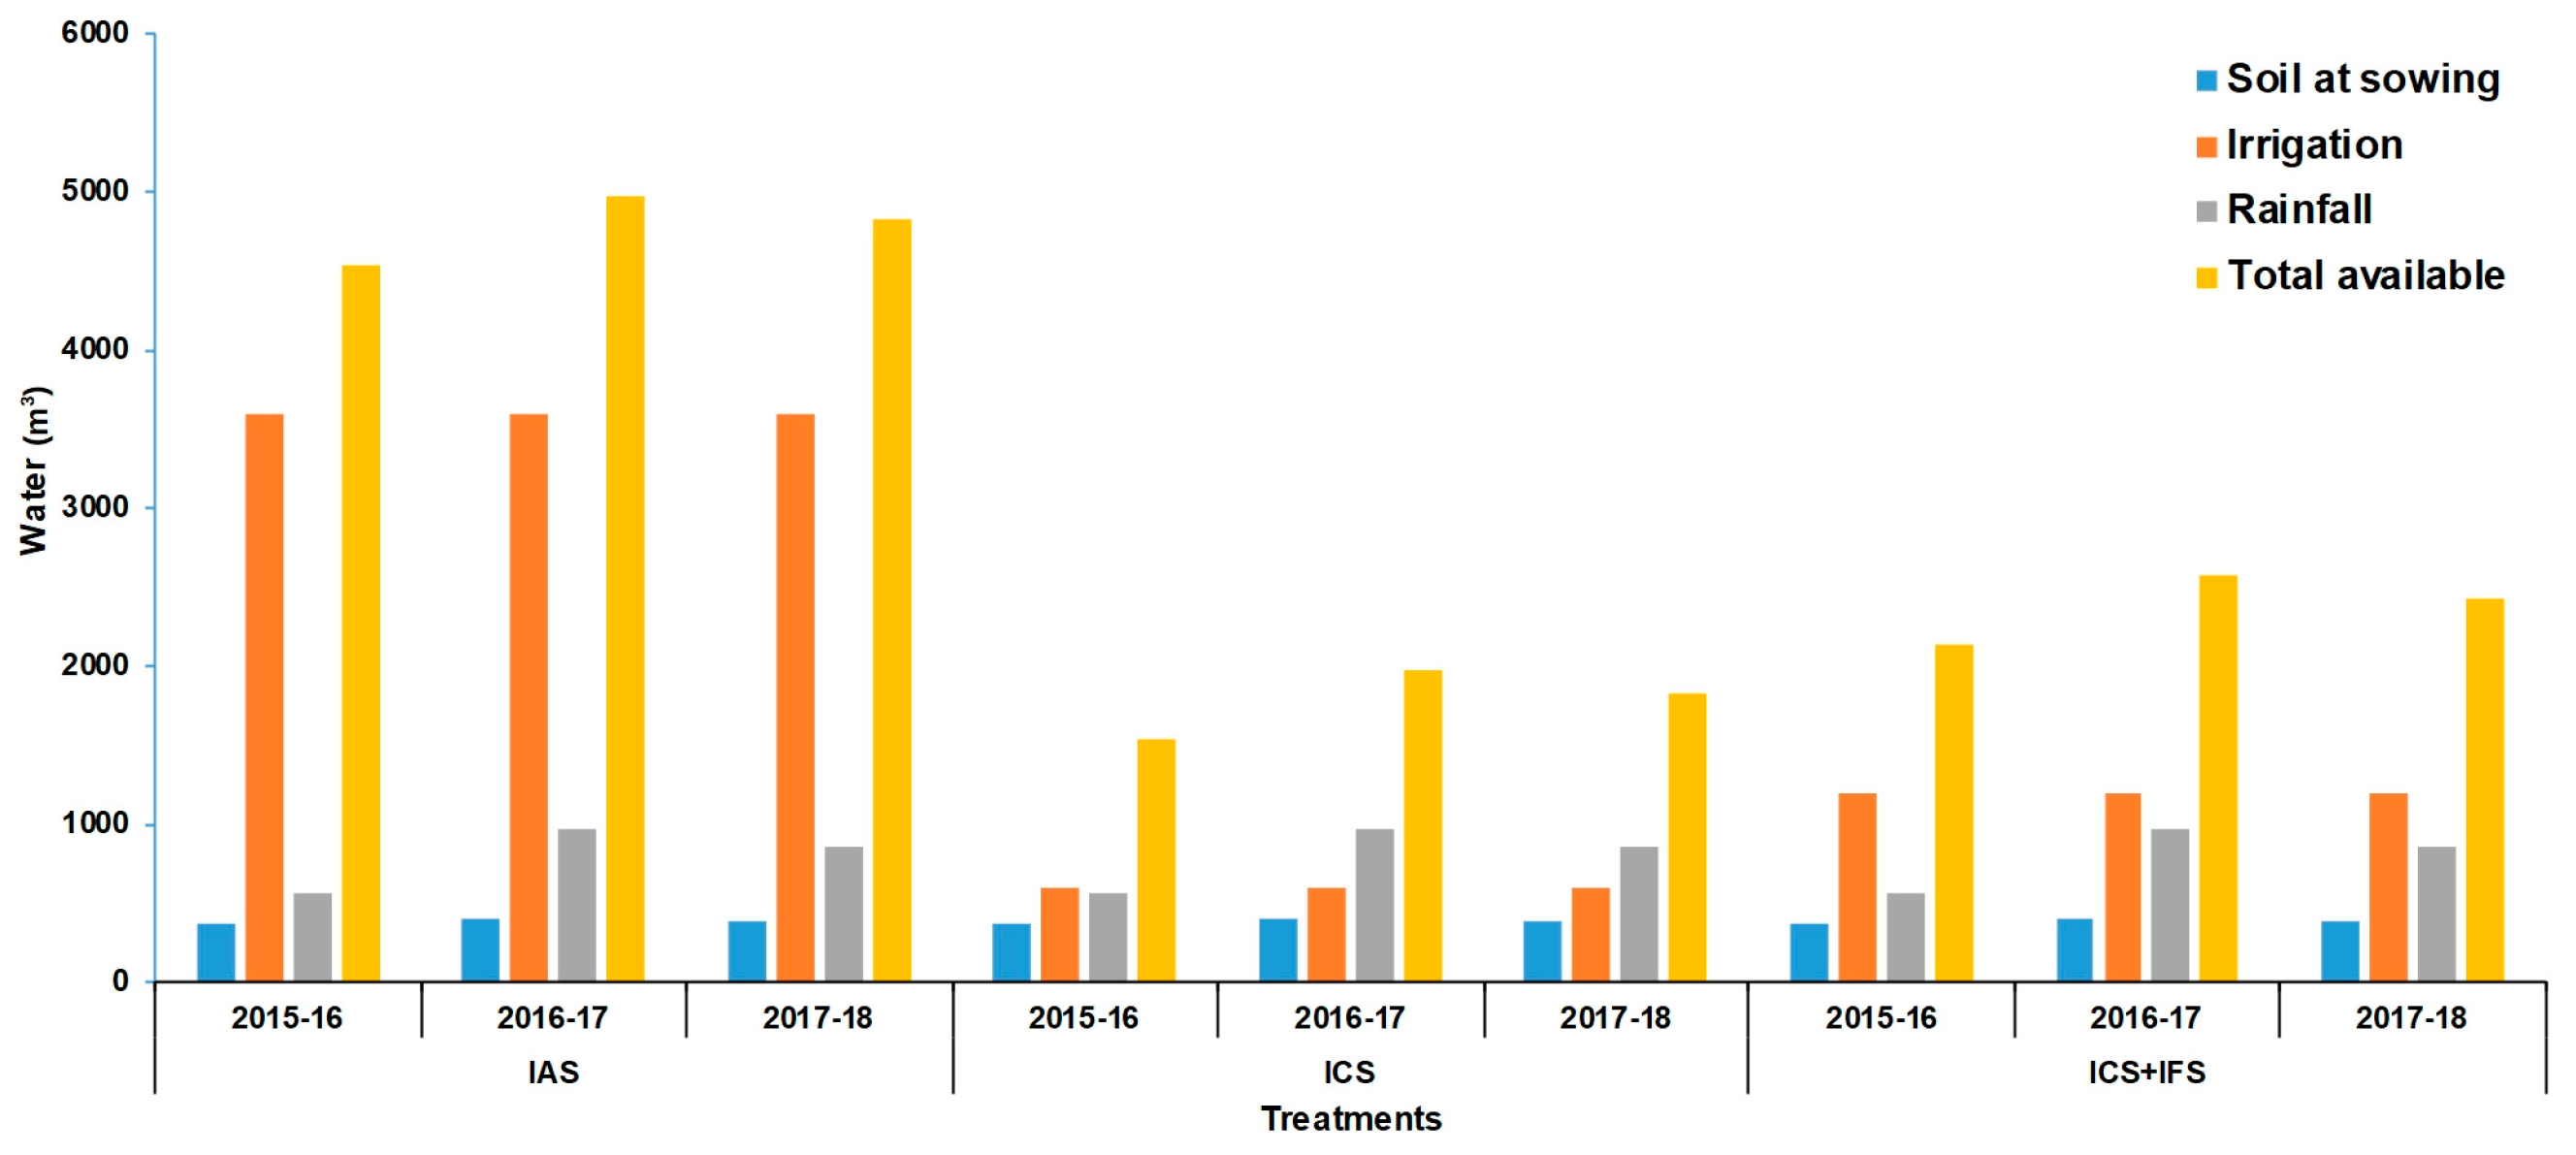
The experiment involved a split split-plot design where in the main plots had RRR at 4 ton ha−1 equivalent to anchored residue left behind by the combine harvester [36] and control where no residue was retained. In the sub plots three irrigation levels were allocated viz., 1. Irrigation at Crown root initiation Stage (ICS): One irrigation at CRI stage (Zadoks = 21), 2. two irrigations one each at CRI (Zadoks = 21) and Flowering Stage (Zadoks = 60) (ICS+ Irrigation at Flowering Stage (IFS)) and 3. six Irrigations at All critical growth Stages (IAS) viz., CRI, late tillering, late jointing, flowering, milking and dough [37]. The quantity of water (m3) available to the crop under different treatments is presented in Figure 2. The sub-sub plots included foliar application of K at 2% through potassium sulphate fertilizer (K2SO4) at two crop growth stages (Zadoks 40 and 60) and its control treatments. The foliar application of K was carried out with a carrier volume of 400 L water ha−1 using a knapsack sprayer (Aspee Napsak Sprayer (SRP/50)) fitted with two flat fan nozzles. The method of irrigation at each growth stage involved pumping of water from a tubewell and carried to the experimental field via gravity flow in irrigation channels running adjacent to the experimental plots. The existing practice of irrigation in Indo-Gangetic plains of India, in which at least 60 mm of water is being applied by surface flooding method [38]. Irrigation treatments were precisely imposed on each plot by measuring the amount of irrigation water applied using a Cutthroat Parshall flume (discharge measurement flume) supplied by Hydro Flow-Tech, India.

2.5. Measurements on Yield and Yield Attributes.

Grain yield and biomass (AGBM) were measured on a net plot area of 11.2 m2 (1.6 m × 7 m) at harvest after removing border rows and 0.5 m from each end of the plot. The crop was hand harvested by cutting at ground level at Zadoks 92 stage. Data on AGBM was recorded after sun drying of the harvested crop. The sun-dried bundles were threshed and winnowed, and the grains so obtained were weighed and GY for different treatments was adjusted at 14% moisture for appropriate comparison. Harvest Index (HI) was calculated as the ratio of the GY to the AGBM. Grain samples were randomly collected for thousand grains weight (TGW) and counted by using seed counter (Contador, Pfeuffer GmbH, Kitzingen, Germany) and weighed to record TGW. TPM were counted at physiological maturity from each plot. The number of grains per spike (GPS) and number of grains m−2 (GrPMS) was calculated by the method described by [39].

2.6. Measurement of Water Productivity and Physiological Traits.

Water use efficiency of treatments were measured using following equation
WUE = GY/Q
where WUE is the productivity of water in kg m−3; GY is the wheat yield in kg ha−1; Q is the amount of water available to the crop which included irrigation applied, rainfall, and available water at sowing in m3 ha−1.
Chlorophyll meter reading using SPAD-502 (Konica Minolta Corp., Solna, Sweden) and RWC were measured at flowering stage. SPAD was measured between 09:00–11:00 h of the day from fully-expanded intact flag leaf. SPAD values were recorded from five randomly selected plants from each plot following procedure described by [40] and the data were averaged as a single value for each plot. RWC was measured from the flag leaf sampled between 10:00 h to 12:00 h. After recording the fresh weight, turgid leaf weight was measured by placing the leaf in water for 8 h, blotting dry and weighing. Leaf dry weight was measured after oven-drying at 80 °C for 48 h. RWC was computed by the following formula developed by [41]:
RWC = (FW − DW)/(FW − TW) × 100
where; RWC is the relative water content; FW is the leaf fresh weight; DW is the leaf dry weight; and TW is the turgid leaf weight.

2.7. Economics

Returns earned in each treatment were calculated by totaling the product of GY and straw yield with their latest market price (US$267.4 t−1 and US$36.3 t−1 respectively). An exchange rate of 68.8 Indian rupees per US$ was taken as reference by taking the average exchange rate during the study period of three years (www.rbi.org.in/scripts/ReferenceRateArchive.aspx). Cost of cultivation was calculated by taking into account the prevailing price of inputs viz., fertilizer, seed, irrigation, tillage operation, transportation charges, management charges, rental value of land, interest on fixed capital, depreciation cost of implements and farm buildings. Net returns were calculated by subtracting cost of cultivation from gross returns. B:C ratio was calculated as gross monetary returns divided by cost of cultivation. The revenue generated under each treatment was estimated against the control treatment.

2.8. Statistical Analysis

A 3-way analysis of variance and ranking of treatments was carried out using Tukey’s Studentized range test at 0.05 (5%) level of significance. The General Linear Model (GLM) Procedure in SAS® 9.3 version 6.1.7061 for Windows (Cary, NC, SAS Institute Inc., 2012) was used for statistical analysis. Residue retention, irrigation levels, foliar application of K and block were included in the model as fixed factors and year and replications were treated as random effects. The design used was split-split plot design where irrigation factor was included as sub-plot within the main-plot factor residue retention, while the foliar application of K factor was included as sub-sub plot within the irrigation levels factor. Pearson’s correlation coefficient (r) was used to indicate the relationship between traits measured. To know the true effect of water levels on GY, we performed a regression analysis between continuous variable water on the residuals of the GY Vs water available and a ANOVA was performed using residuals as dependent variable.

3. Results

3.1. Analysis of Variance of Treatments

The main effects of treatments viz., residue retention, irrigation levels, and foliar application of K were found to be significant (P ≤ 0.01) when analyzed individually for few traits and their interaction effects were non-significant on all the studied traits except RWC which was significant in case of R × I and I × K (Table 1). Grain yield was significantly (P ≤ 0.01) influenced by all three treatments individually and in case of R × I interaction. Biomass (AGBM) was significantly differentiated only by irrigation levels and foliar application of K separately. Tillers (TPM) and TGW were significantly affected only by irrigation levels. Chlorophyll content (SPAD) varied between treatments only at individual levels but there was no interaction effect. Grains per square meter and WUE values were impacted only residue retention and irrigation levels treatment.

3.2. Effect of Residue Retention on Wheat Yield, Yield Parameters, WUE, and Economic Returns

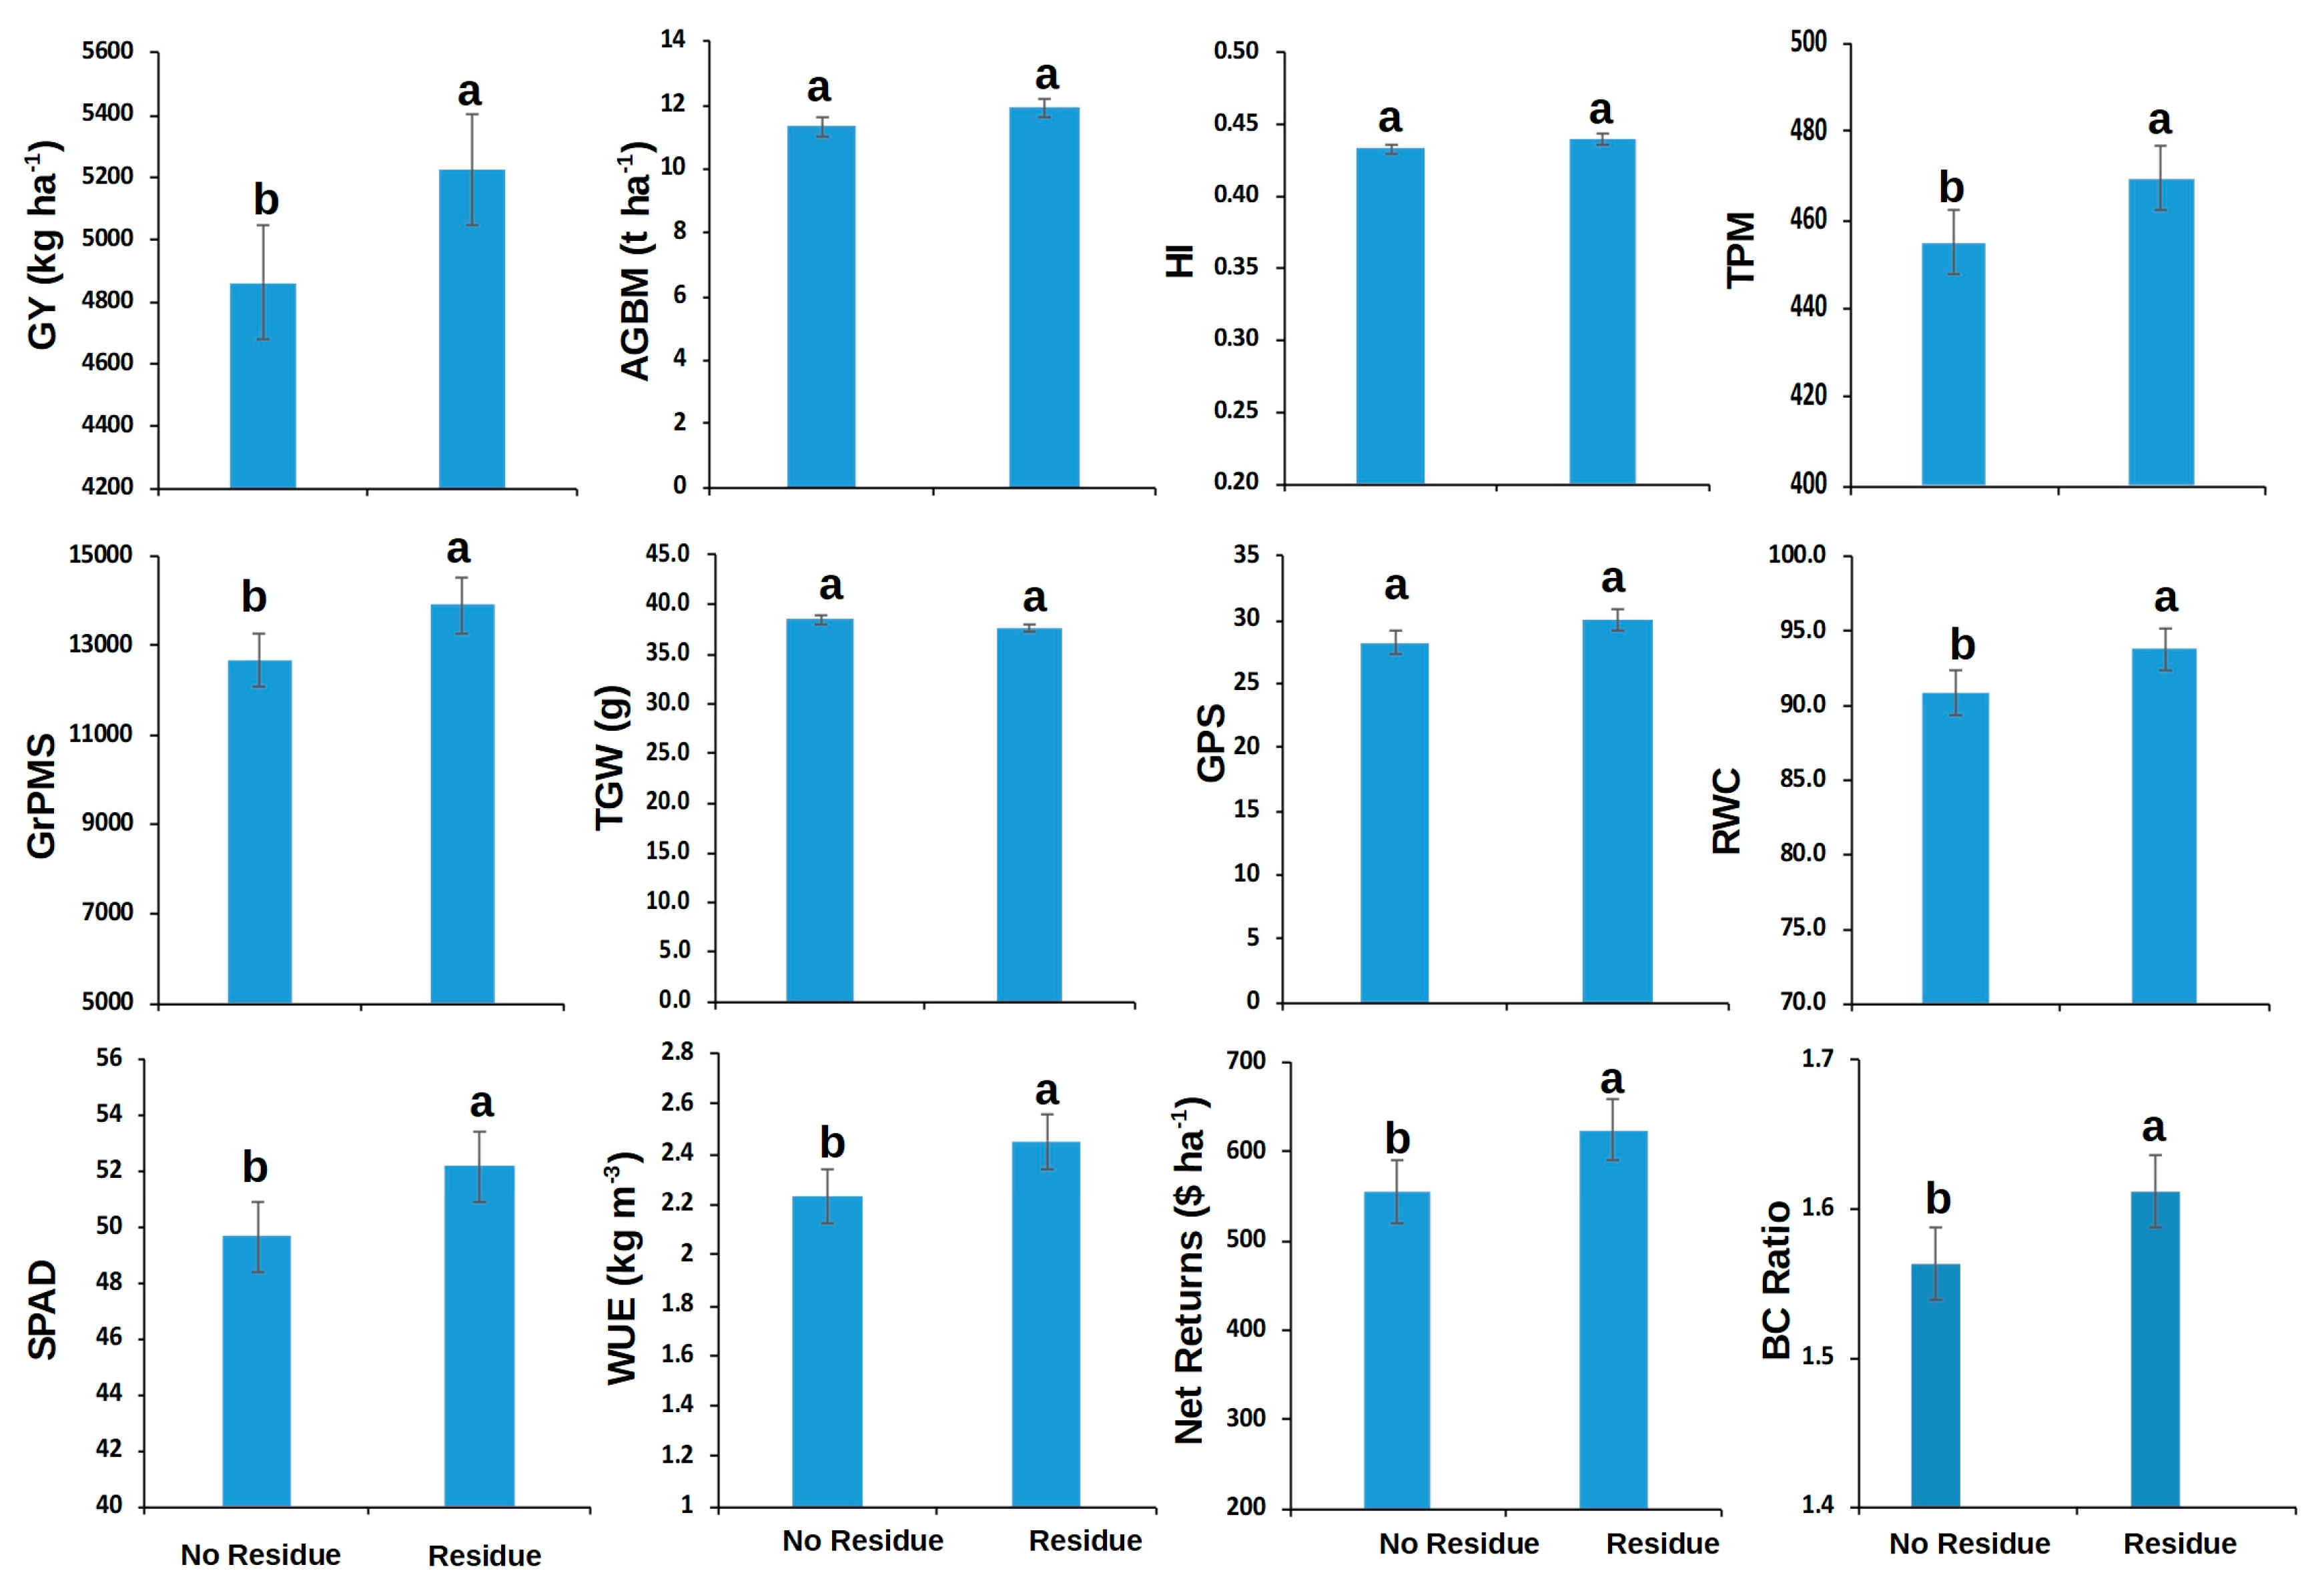
As per Table 1 there was significant interaction between RRR and Irrigation in case of GY, RWC, WUE, net returns, and BC ratio. Residue retention alone did not have statistically significant difference in case of AGBM (residue retention = 11.9 t ha−1) compared to control (residue removal = 11.3 t ha−1) and HI (Figure 3). Residue retention treatment did not affect TGW and GPS statistically compared to residue removal.

3.3. Effect of Foliar Application of K on Wheat Yield, Yield Parameters and WUE

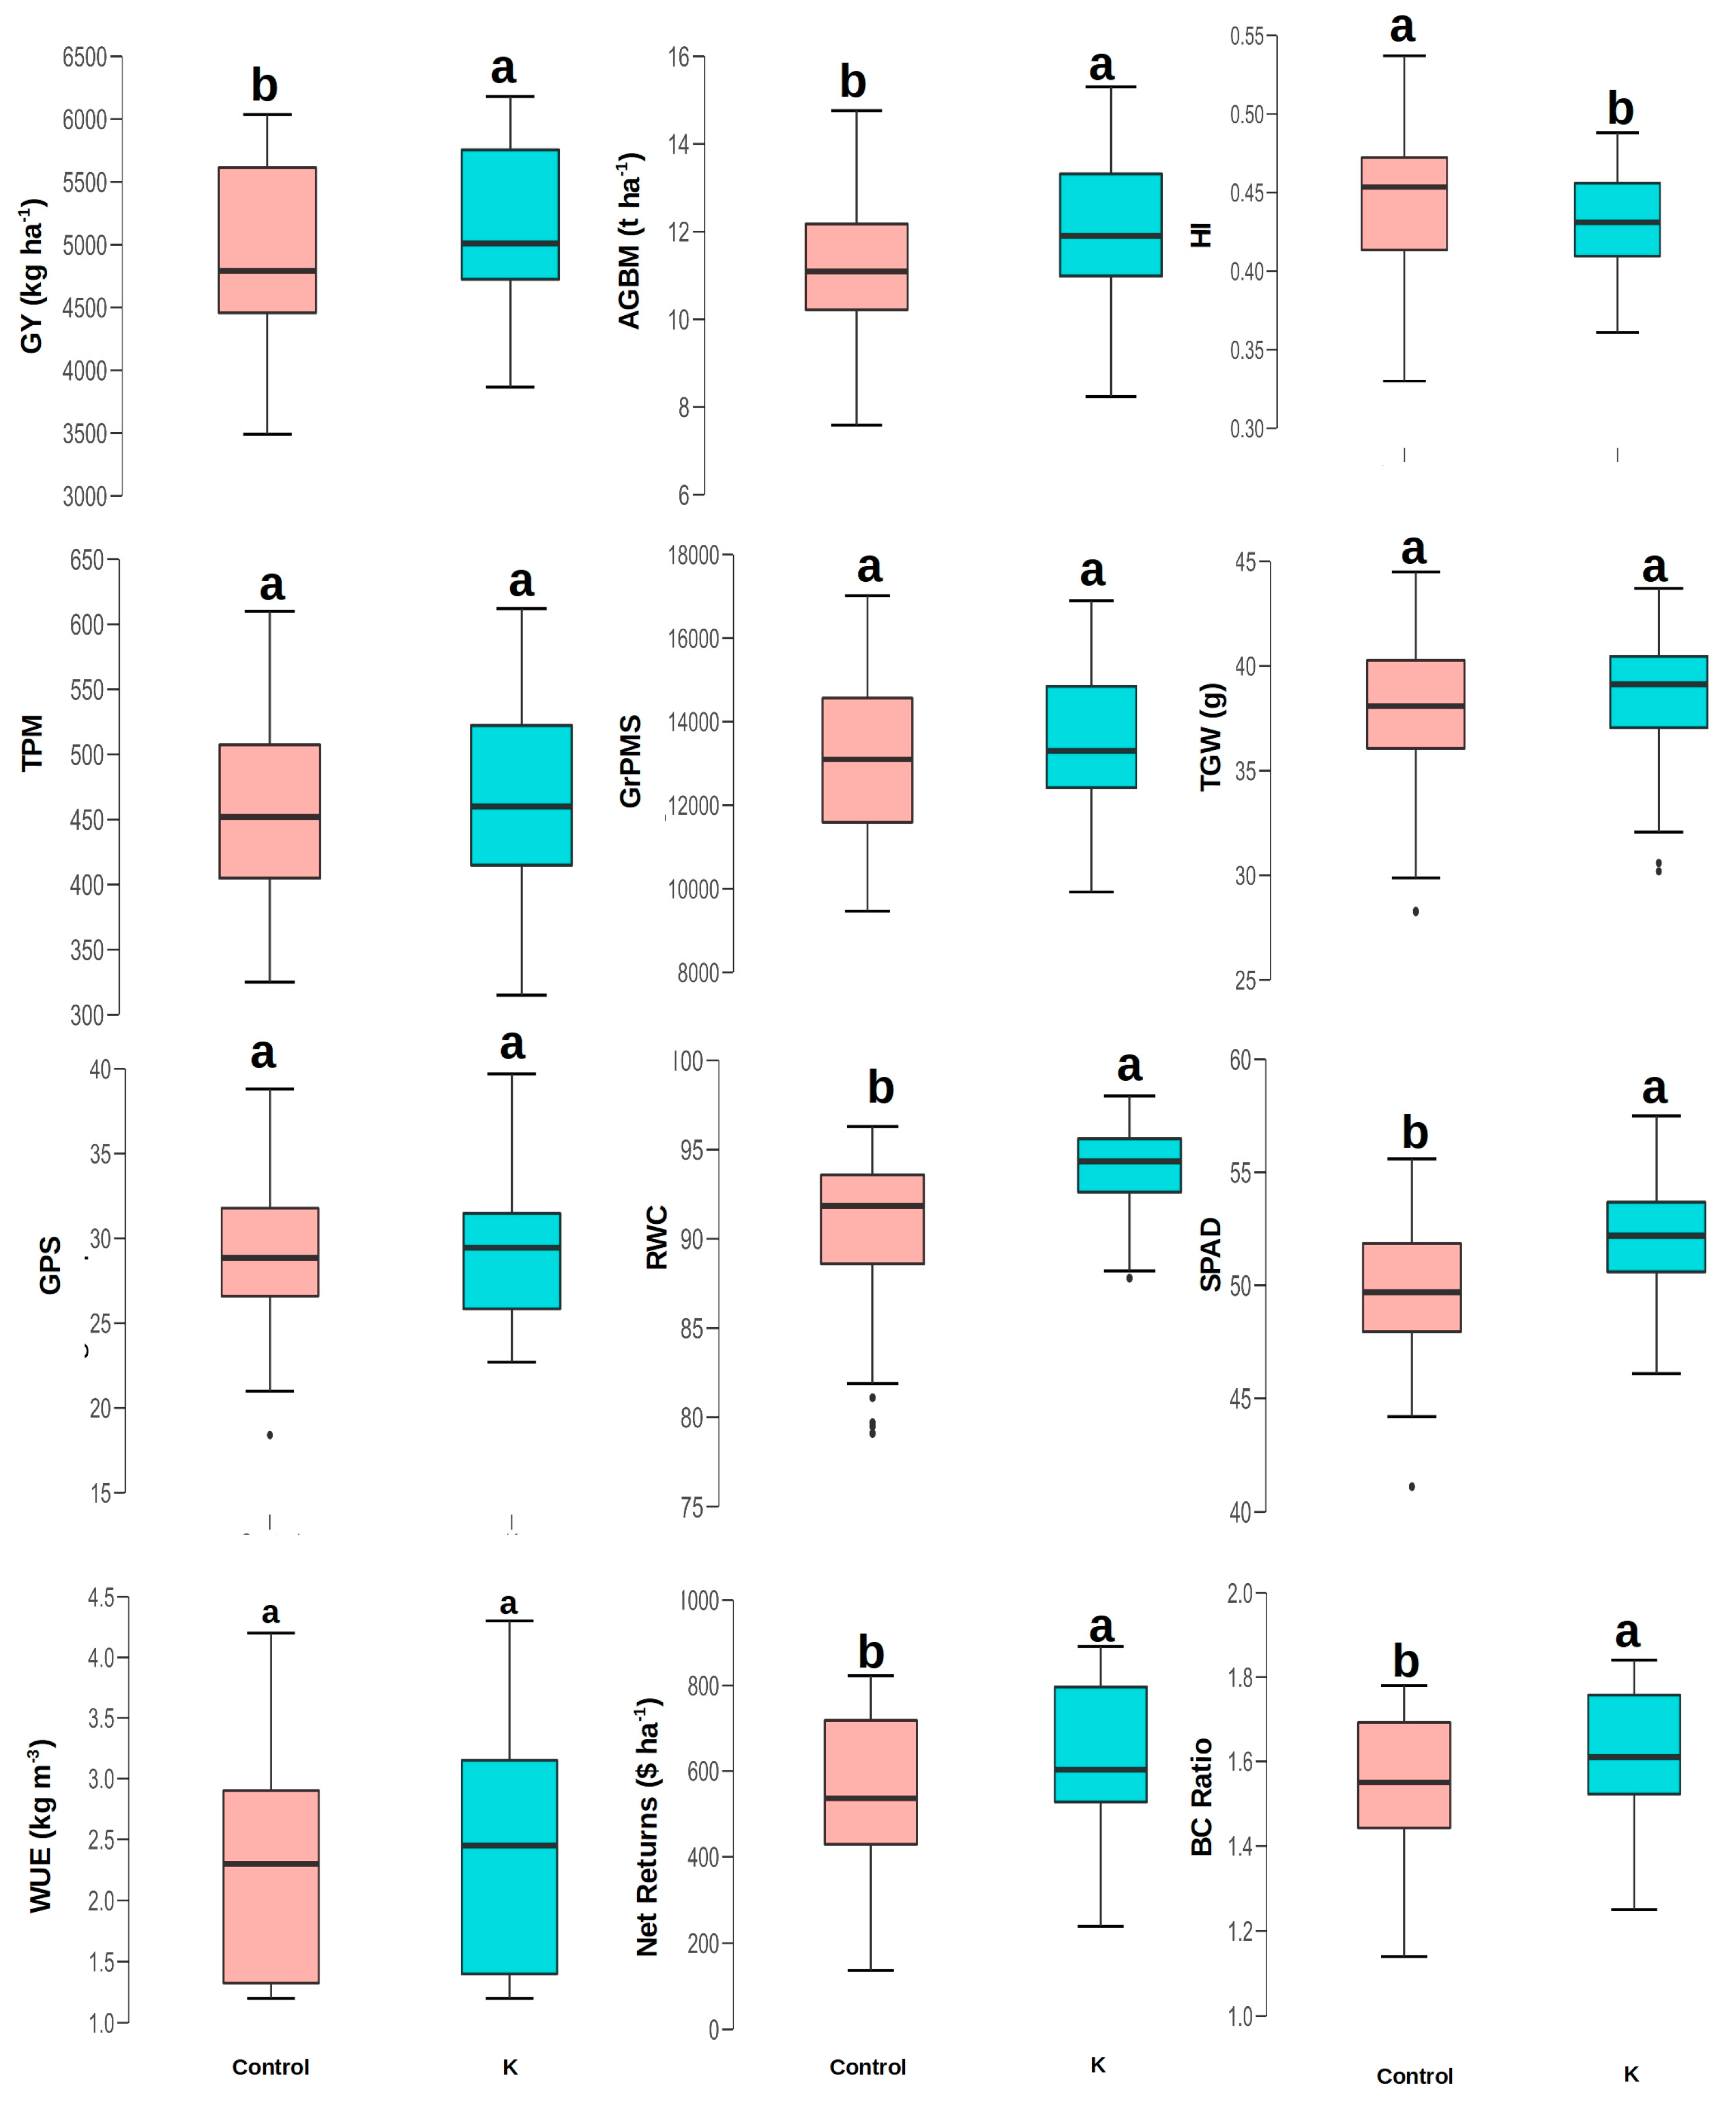
Foliar application of K increased GY significantly (5151 kg ha−1) compared to control (4932 kg ha−1) (Figure 4). AGBM was also enhanced when K was sprayed on the canopy (12 t ha−1) which was significantly higher than control (11.2 t ha−1). Foliar application of K did not statistically influence the HI, TPM, GrPMS, TGW, and GPS values (Figure 4). Foliar application of K positively impacted physiological parameters such as RWC, SPAD, and WUE significantly. WUE values were significantly higher under K foliar application (2.40 kg m−3) compared to when K was not applied (2.28 kg m−3).

3.4. Effect of Foliar Application of K on Revenue

K application increased net returns earned significantly (625.2 $) compared to control (554 $) (Figure 4). The BC ratio was also found to be significantly higher (1.62) in case of residue retention compared to its removal (1.55).

3.5. Interaction Effect of Treatments on Yield and Profitability of Wheat

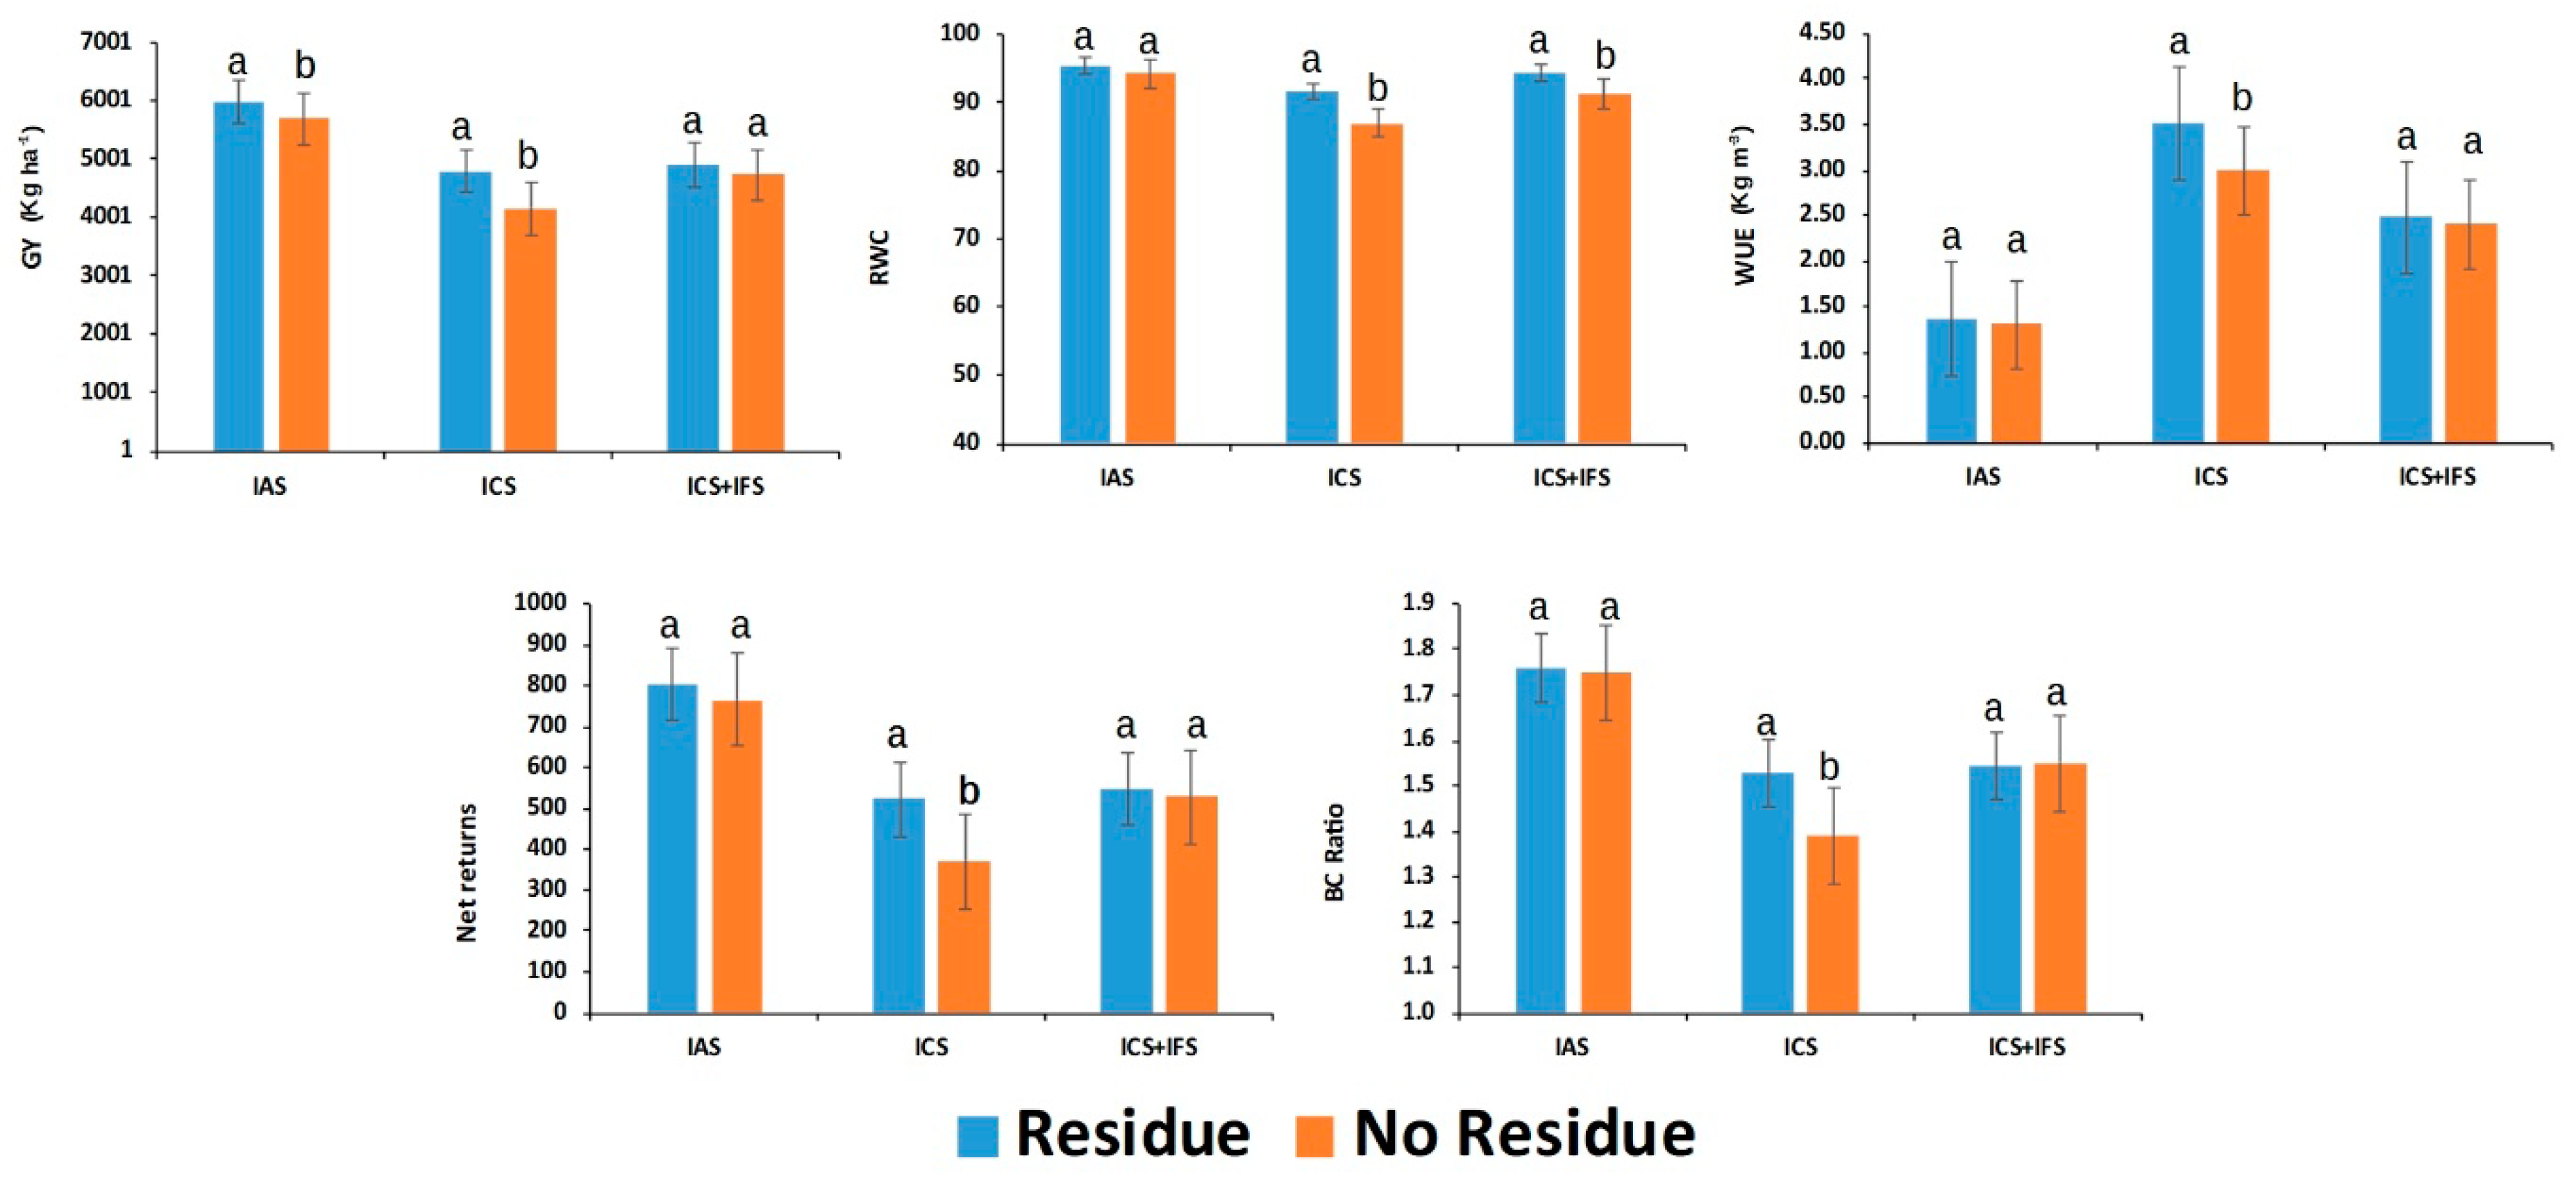
The interaction effect of residue retention and irrigation levels was significant on GY, RWC, WUE, NR and BC ratio whereas it was insignificant in case of AGBM, HI, TPM, TGW, SPAD, GPS, and GrPMS. Six irrigations at all stages (5972 Kg ha−1) and ICS (4807 Kg ha−1) under residue retention conditions produced significantly higher yield than residue removal conditions (IAS = 5690, ICS = 4156 Kg ha−1) whereas it was unaffected in case of ICS + IFS (Figure 5). RWC recorded was statistically unaffected by residue retention or removal under IAS whereas in case of ICS, ICS + IFS treatments there was significant difference between residue retention and removal. Residue retention significantly enhanced WUE values (3.51 Kg m−3) under ICS treatment compared to residue removal (2.99 Kg m−3). Net returns (522 $) earned and BC ratio (1.53) were significantly enhanced by residue retention under ICS while they were statistically similar under IAS and ICS + IFS treatments.
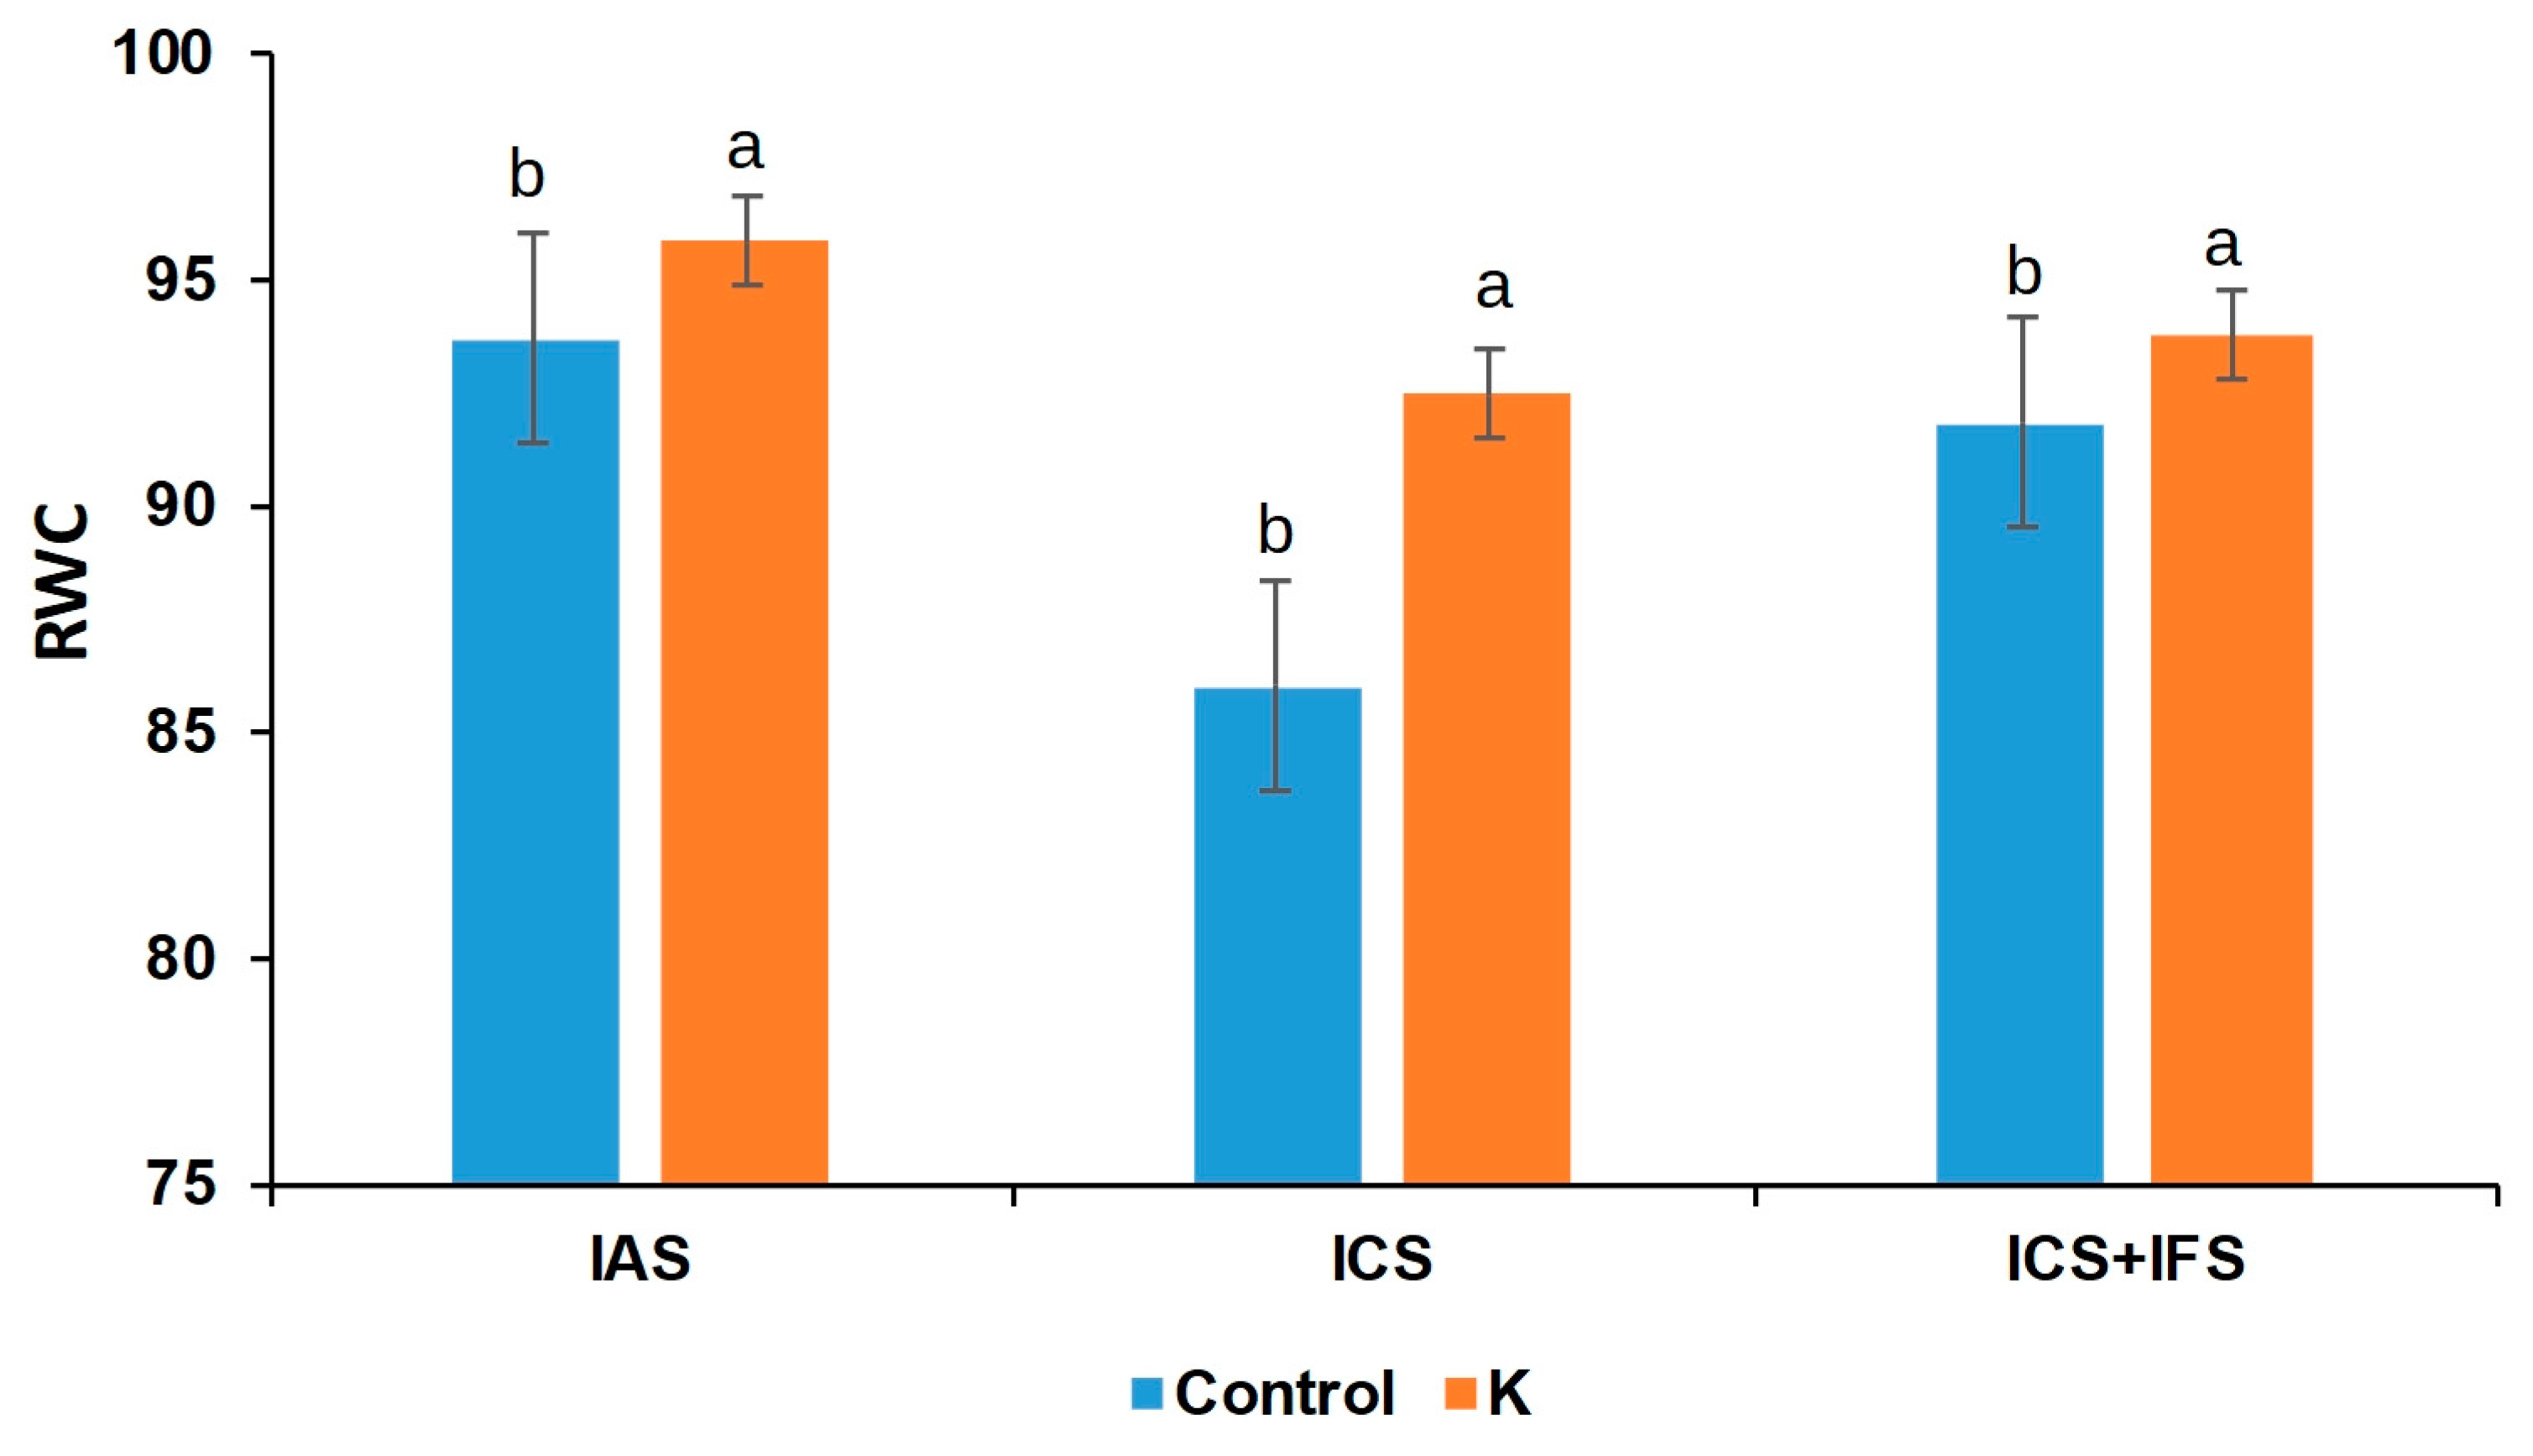
Interaction effect of residue retention and foliar application of K was statistically insignificant across all traits studied. When interaction of irrigation levels and foliar application of K was studied separately, only RWC was found to be varying significantly (Figure 6). When K was sprayed on the canopy the RWC under ICS (92.5) was not statistically different to ICS + IFS treatment (93.8).

3.6. Correlation and Regression Analysis

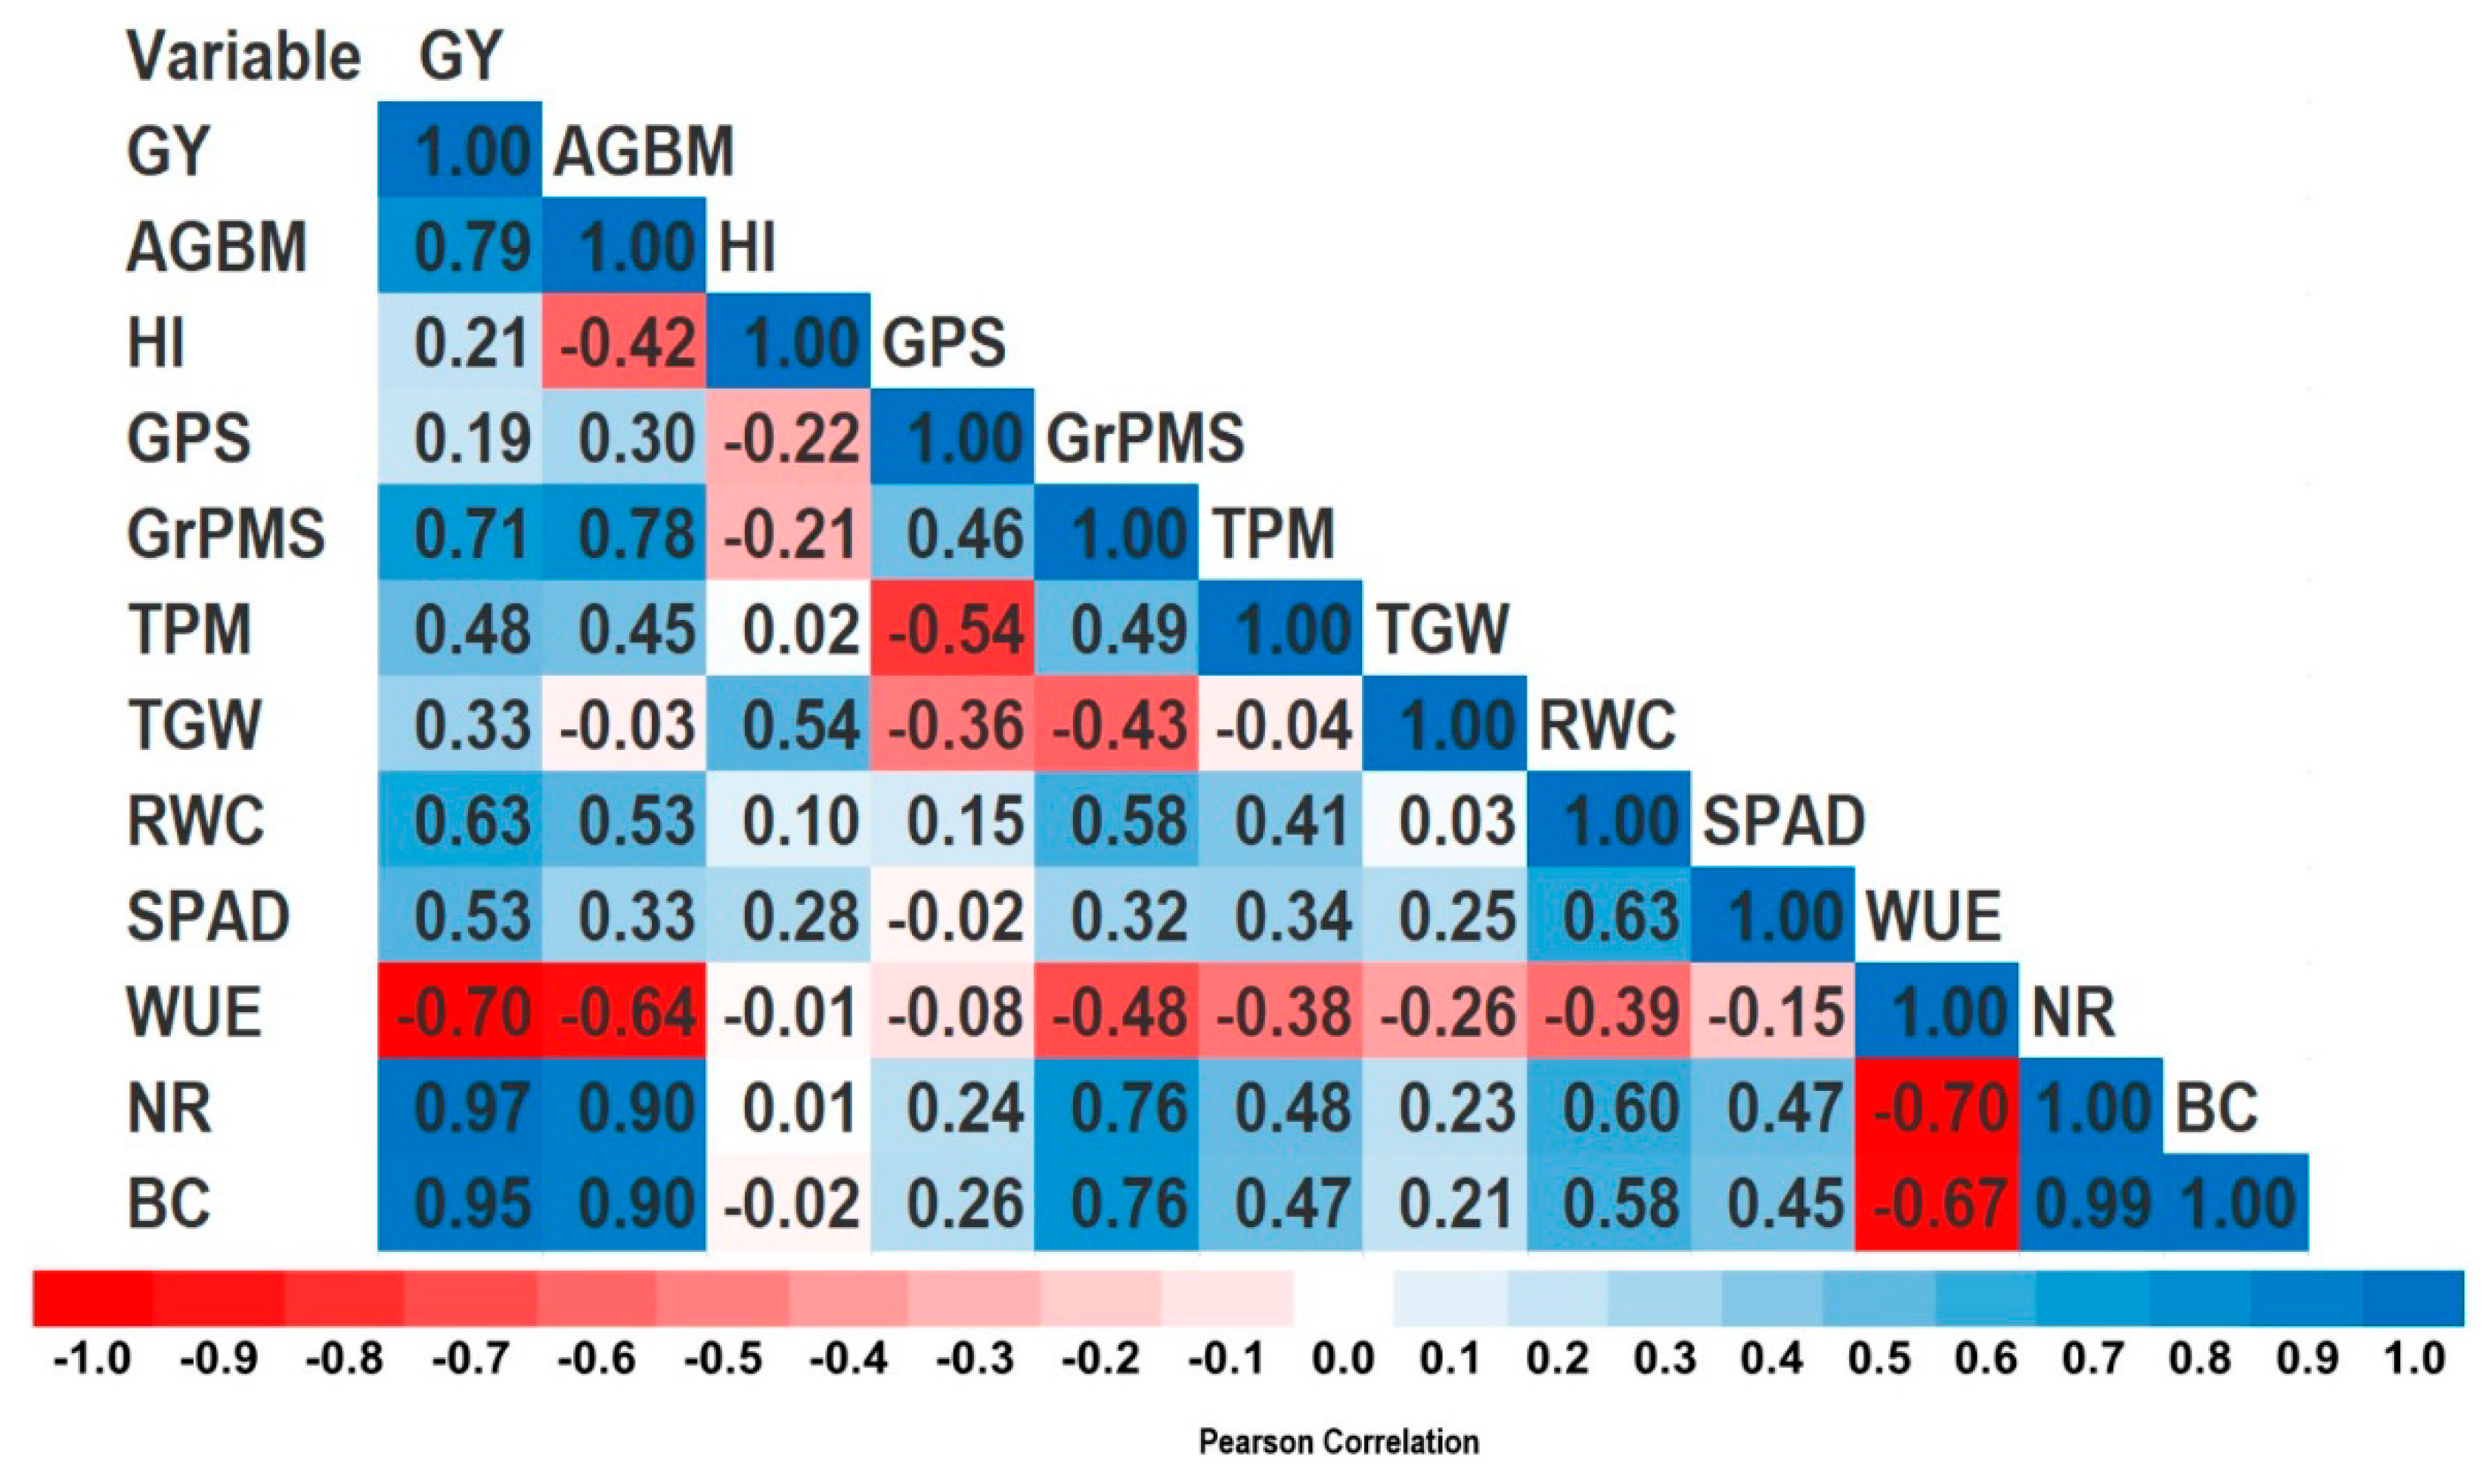
There was strong positive correlation between GY and AGBM (r = 0.79), GrPMS (r = 0.71), RWC (r = 0.63), SPAD (r = 0.53), net returns (r = 0.97), and BC ratio (r = 0.95). HI, GPS, TPM, and TGW were weakly correlated with GY. WUE showed a strong negative correlation with GY (r = −0.70) (Figure 7), however there was positive relationship between WUE and GY when the amount of water was the same (data not shown).
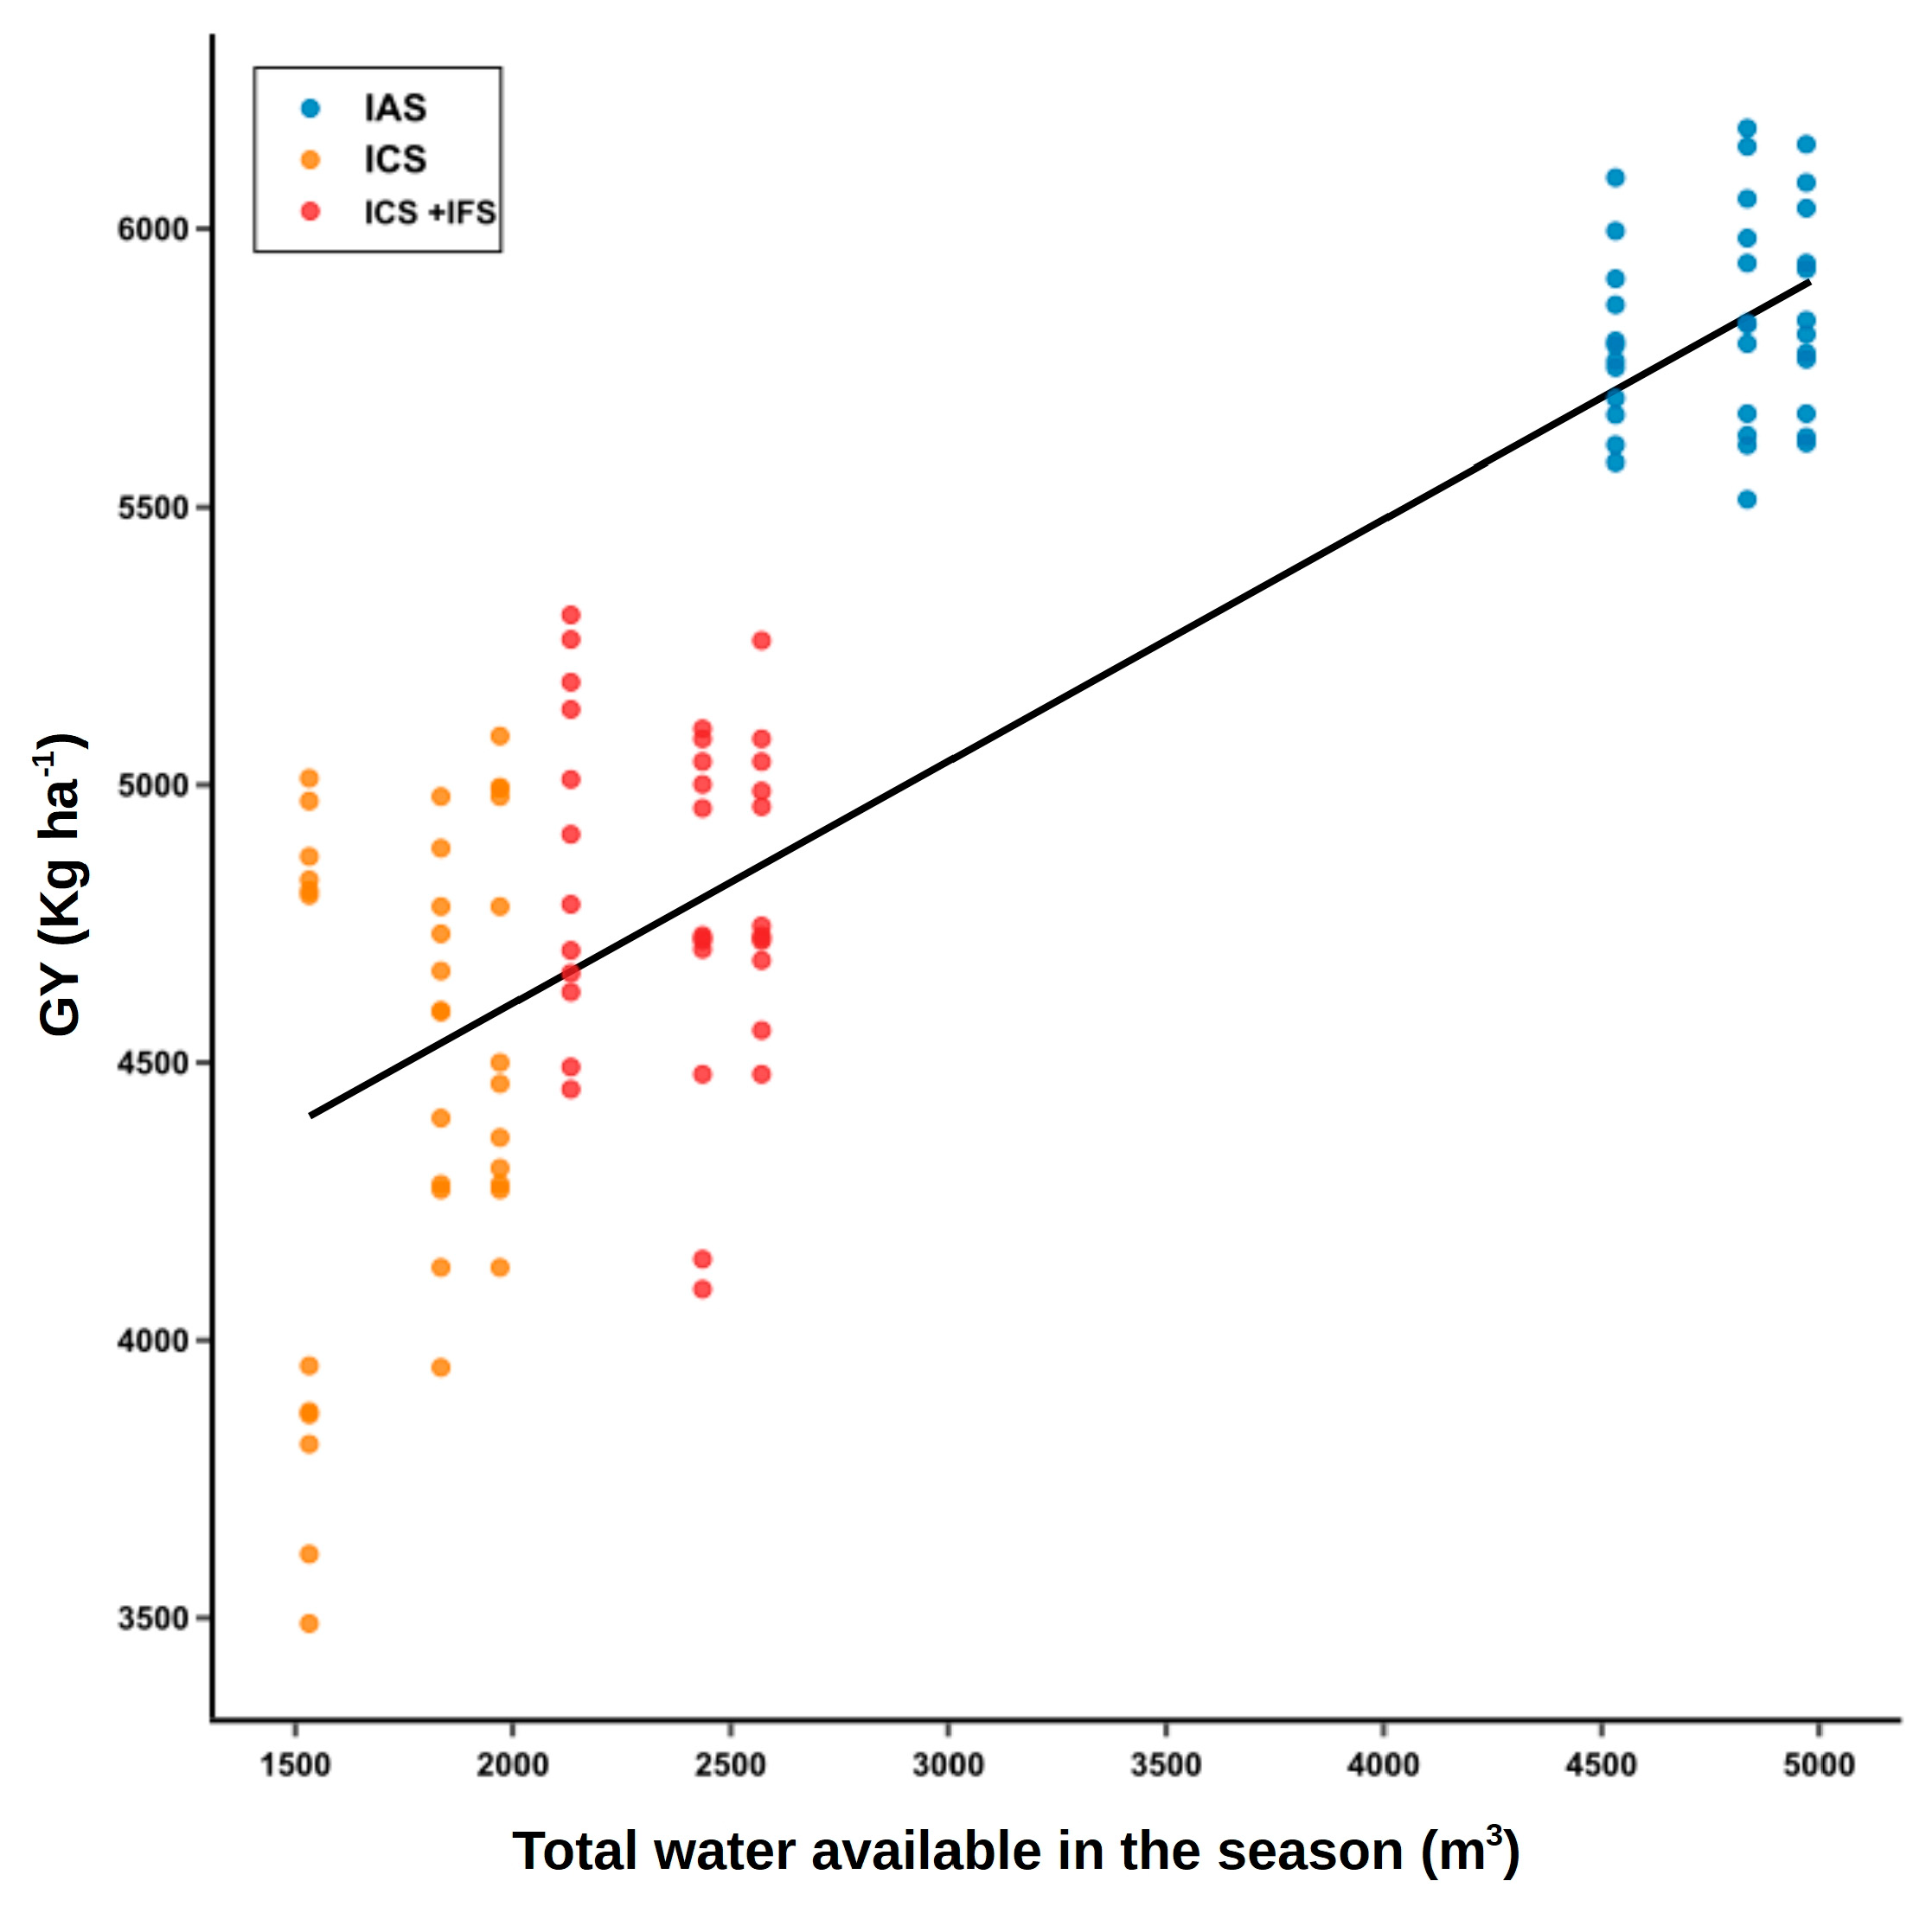
The regression analysis performed between water available to the crop and GY indicated a positive linear relationship (R2 = 0.761) (Figure 8). ANOVA of residuals indicated that the effect of RRR, irrigation levels and foliar application of K and interaction between RRR and irrigation levels were significant (Table 2).

3.7. Impact of Residue Retention on Economy and Environment

RRR in wheat crop is enhancing WUE and producing significantly higher yield and economic returns when there is only one irrigation is available. An additional revenue of 151 US$ ha−1 can be obtained by RRR on the soil surface under moisture stress treatments. The wheat area under Indo Gangetic plains comprising 12.4 million ha is witnessing a steady increase in the depth of the groundwater table in wheat growing regions [42,43] and therefore, the water available for irrigation is expected to reduce further in near future. Assuming that 10% of wheat area under Indo-Gangetic plains will have only one irrigation for wheat cultivation in future, adoption of residue retention would enhance the farmer’s revenue by 187 million $ compared to residue removal conditions.

4. Discussion

Rice residue burning creates various problems including loss of nutrients, reduction in soil carbon and destroying the beneficial soil microbial biota which results in yield penalty. Farmers supply additional nutrients to sustain the yield levels by external application of costly fertilizer inputs [35]. The problem posed by residue burning can be minimized by RRR on the soil surface in the subsequent wheat crop. Our results proved that, when only the effect of residue retention was analyzed wheat GY and AGBM increased significantly compared to residue removal treatments. Similar results of favorable effect of residue retention on GY and AGBM was reported by [44,45,46,47]. Increased yield of wheat might be due to addition of nutrients to the soil after decomposition of rice residue by microbes leading to enhancement in soil organic carbon [48]. Additionally, residue retention imparts many beneficial effects like erosion control, decreased evaporative water losses and improved weed control. Similar results where no-tillage practices consistent of residue retention improved wheat yield were reported in other dryland wheat-growing regions [49]. RRR led to significant increase in crop physiological parameters such as RWC, SPAD, and WUE in our experiments. Beneficial effects of residue retention in subsequent crop leading to improved physiological efficiency in terms of higher RWC and SPAD was reported in maize and sorghum by retention of barley residue [50]. Earlier researchers also reported that RRR enhanced water productivity by conserving soil moisture from evaporation losses [51,52].
In this study the RRR also enhanced the economic returns earned along with enhanced GY and AGBM. RRR significantly enhanced net returns and B:C ratio compared to control. RRR on soil surface as biological mulch enhancing system profitability has been reported in wheat [9,45,52] and other crops [51,52].
Effect of foliar application of K when analyzed independently, wheat GY and AGBM was significantly enhanced compared to control. Spraying of K2SO4 on crop canopy increasing GY and biomass was reported in wheat and cotton [53,54,55]. Enhanced GY under foliar application of K might be due to improved plant physiological processes involved in growth and development as K is found to be playing essential role in improving enzyme activity, photosynthetic rate, osmotic regulation, stomata movement, and water balance, cation–anion balance, and stress tolerance [56,57]. Foliar application of K positively increased RWC, SPAD and WUE significantly in this study. The results are in consistency with earlier reports by [56,58], but differ from those when an otherwise well-fertilized wheat crop received additional K regardless of residue retention [59]. Nonetheless, [60] suggested that wheat response to K fertilization in semi-arid regions was more consistent in high-yielding environments, similar to those included in our study. The profitability of K application treatment was significantly higher in terms of net returns earned and BC ratio. Foliar spray of K increasing net returns and BC ratio was in agreement with earlier reports in wheat [61], cotton [62], toria [63], and ground nut [64].
Wheat GY, RWC, WUE, NR, and BC ratio were significantly affected by interaction of residue retention treatment and irrigation levels. GY was significantly increased under IAS and ICS treatments when residue was retained. The increased GY under IAS is similar to individual effect of residue retention while in case of ICS, significantly higher GY might be due to decreased soil water evaporation due to residue retention [44,45,46,47]. In this study residue retention under IAS treatment did not have any significant effect on RWC, this might be because under IAS there was no dearth of soil moisture. In case of ICS and ICS + IFS, as there was moisture stress, the RRR enhanced RWC significantly compared to residue removal due to residue acting as soil mulch in protecting moisture loss. Increase in WUE values was highest under ICS treatment with residue retained, again might be due to the obvious fact that residue conserved soil moisture, suppressed weed growth, and created a favorable microenvironment in the root zone. Residue retention under ICS condition led to enhanced net returns and B:C ratio compared to residue removal because of the higher GY and WUE under this interaction.
There was no interaction found between residue retention and K application in this study. This might be because rice residue is known to release K along with many other nutrients upon its decomposition [48].
Foliar application of K and RRR were together analyzed to study their interaction effect indicated that, except RWC under ICS all other parameters were statistically similar. This might be due to involvement of K in stress mitigation mechanisms of plants subjected to water stress. In case of all other parameters and treatments being non-significant the crop was not subjected to water stress under IAS and ICS + IFS treatments. Upon this if there is some partial stress is there under ICS + IFS treatment, the effect might have been nullified by residue retention treatments being included in the analysis.
Relationship of traits studied with GY was assessed through Pearson correlation analysis, which showed that except WUE (r = −0.70), all other traits were positively correlated to GY. The correlation observations in this study are in close conformity with earlier reports in wheat and barley [65,66,67], except that for WUE and GY, which is usually reported as positive [68,69]. The discrepancy between our findings and those by other authors relating GY and WUE positively are likely because when water resources were the same, increases in grain yield increased WUE; but when the total amount of water available increased, WUE decreased vastly and thus they negative correlation across the whole dataset. Simple regression of GY with water available clearly showed a strong positive trend where GY increased with additional irrigation water provided to the crop. While the scatter plot of residuals of regression between GY Vs water and water available showed absence of any clear trend. This might be due to influence of combined effect of rice residue, irrigation levels and K application.

Economic and Environmental Impact

RRR treatment generated an additional income of 151 $ ha−1 in this study. Earlier researchers [9] in 2019 reported that rice residue burning makes a substantial contribution to air pollution in Indo–Gangetic plains of India. Air pollution is the second highest health risk factor in northern India is a cause of concern. Further the atmospheric smog resulting from a mix of factors including residue burning is costing heavily in terms of closure of thousands of schools in New Delhi alone. Disruptions in road transportation due to low visibility caused by smog many a times lead to road accidents [7,9,10,11,12]. An estimated 23 million ton of rice residue is being burnt in about 2.5 million farms annually [6]. Burning of rice residue emit an estimated 8.57 Mt of CO, 141.15 Mt of CO2, 0.037 Mt of SOx, 0.23 Mt of NOx, 0.12 Mt of NH3 and 1.46 Mt NMVOC, 0.65 Mt of NMHC, 1.21 Mt of particulate matter [7] which could be effectively avoided and managed by residue incorporation into wheat.

5. Conclusions

In this paper we investigated the effect of rice residue retention, irrigation levels and foliar application of K on wheat GY, AGBM, HI, TPM, GrPMS, TGW, GPS, RWC, SPAD, WUE, Net returns, and BC ratio. There was a clear advantage of residue retention, which was reflected by significant higher GY, AGBM, TPM, and GrPMS compared to residue removal. Residue retention also enhanced physiological performance of crop by favorable effects on RWC, SPAD, and WUE. RRR enhanced net returns by 624.4 $ ha−1 with BC ratio of 1.62. Residue retention increased WUE especially under limited water available conditions and led to higher returns of US$151 which would be of great help to the farmers who face shortage of water under changing climatic scenario. Adoption of RRR over rice–wheat area might lead to substantial reduction in environmental degradation resulting from its burning.

Author Contributions

Conceptualization, methodology, investigation, writing—original draft preparation R.P.M., K.V.; data curation, formal analysis, R.P.M, K.V. resources, supervision, R.P.M., R.K.S.; writing—original draft preparation, S.C.T., K.P., R.K.; funding acquisition, G.P.S. All authors have read and agreed to the published version of the manuscript.

Funding

The study was financially supported by the Indian Council of Agriculture Research, MoA&FW, Government of India.

Acknowledgments

The technical support of Rahul Kumar, Senior Research Fellow under the project is also gratefully acknowledged.

Conflicts of Interest

The authors declare that they have no conflict of interest.

References

  1. Sharma, I.; Tyagi, B.; Singh, G.; Venkatesh, K.; Gupta, O. Enhancing wheat production—A global perspective. Indian J. Agric. Sci. 2015, 85, 3–13. [Google Scholar]
  2. Gupta, R.K.; Naresh, R.K.; Hobbs, P.R.; Jiaguo, Z.; Ladha, J.K. Sustainability of post-green revolution agriculture: The rice-wheat cropping systems of the Indo-Gangetic Plains and China. Improv. Product. Sustain. Rice-Wheat Syst. Issues Impacts 2003, 65, 1–25. [Google Scholar]
  3. Ladha, J.K.; Fischer, K.; Hossain, M.; Hobbs, P.; Hardy, B. Improving the Productivity and Sustainability of Rice-Wheat Systems of the lndo-Gangetic Plains: A Synthesis of NARS-IRRI Partnership Research. IRRI Discussion Paper; 40; IRRI: Los Banos, PL, USA, 2000; p. 31. [Google Scholar]
  4. Timsina, J.; Connor, D.J. Productivity and management of rice–wheat cropping systems: Issues and challenges. Field Crop. Res. 2001, 69, 93–132. [Google Scholar] [CrossRef]
  5. Goi, M. 3rd Advance Estimates of Production of Major Crops for 2018-19. Available online: https://pib.gov.in/Pressreleaseshare.aspx?PRID=1573283 (accessed on 4 March 2020).
  6. National Academy of Agricultural Sciences. Innovative Viable Solution to Rice Residue Burning in Rice-Wheat Cropping System Through Concurrent Use of Super Straw Management System-Fitted Combines and Turbo Happy Seeder; Policy Brief No. 2; National Academy of Agricultural Sciences: New Delhi, India, 2017; pp. 1–16. [Google Scholar]
  7. Jain, N.; Bhatia, A.; Pathak, H. Emission of air pollutants from crop residue burning in India. Aerosol Air Qual. Res. 2014, 14, 422–430. [Google Scholar] [CrossRef] [Green Version]
  8. Moefc, G. India: Second Biennial Update Report to the United Nations Framework Convention on Climate Change. Available online: https://pib.gov.in/Pressreleaseshare.aspx?PRID=1557609 (accessed on 16 March 2019).
  9. Shyamsundar, P.; Springer, N.P.; Tallis, H.; Polasky, S.; Jat, M.L.; Sidhu, H.S.; Krishnapriya, P.P.; Skiba, N.; Ginn, W.; Ahuja, V.; et al. Fields on fire: Alternatives to crop residue burning in India. Science 2019, 365, 536–538. [Google Scholar] [CrossRef]
  10. Chakrabarti, S.; Khan, M.T.; Kishore, A.; Roy, D.; Scott, S.P. Risk of acute respiratory infection from crop burning in India: Estimating disease burden and economic welfare from satellite and national health survey data for 250,000 persons. Int. J. Epidemiol. 2019, 48, 1113–1124. [Google Scholar] [CrossRef] [PubMed] [Green Version]
  11. Cusworth, D.H.; Mickley, L.J.; Sulprizio, M.P.; Liu, T.; Marlier, M.E.; DeFries, R.S.; Guttikunda, S.K.; Gupta, P. Quantifying the influence of agricultural fires in northwest India on urban air pollution in Delhi, India. Environ. Res. Lett. 2018, 13, 044018. [Google Scholar] [CrossRef] [Green Version]
  12. Sharma, M.; Dikshit, O. Comprehensive study on air pollution and green house gases (GHGs) in Delhi; IIT: Kanpur, India, 2016; p. 334. [Google Scholar]
  13. Bhuvaneshwari, S.; Hettiarachchi, H.; Meegoda, J. Crop Residue Burning in India: Policy Challenges and Potential Solutions. Int. J. Environ. Res. Public Health 2019, 16, 832. [Google Scholar] [CrossRef] [PubMed] [Green Version]
  14. Duxbury, J.; Abrol, I.; Gupta, R.; Bronson, K. Analysis of Long-Term Soil Fertility Experiments with Rice-Wheat Rotations in South Asia; Rice–Wheat Consortium Pap. Ser. no. 6; Rice-Wheat Consortium for the Indo-Gangetic Plains: New Delhi, India, 2000; Volume 6, pp. 7–22. [Google Scholar]
  15. Ladha, J.; Dawe, D.; Pathak, H.; Padre, A.; Yadav, R.; Singh, B.; Singh, Y.; Singh, Y.; Singh, P.; Kundu, A.; et al. How extensive are yield declines in long-term rice-wheat experiments in Asia? Field Crop. Res. 2003, 81, 159–180. [Google Scholar] [CrossRef]
  16. Rodell, M.; Velicogna, I.; Famiglietti, J.S. Satellite-based estimates of groundwater depletion in India. Nature 2009, 460, 999–1002. [Google Scholar] [CrossRef] [PubMed] [Green Version]
  17. Sekhri, S. Sustaining groundwater: Role of policy reforms in promoting conservation in India. Shekhar Shah Barry Bosworth Arvind Panagariya 2013, 149, 149–187. [Google Scholar]
  18. Wei, J.; Li, C.; Li, Y.; Jiang, G.; Cheng, G.; Zheng, Y. Effects of External Potassium (K) Supply on Drought Tolerances of Two Contrasting Winter Wheat Cultivars. PLoS ONE 2013, 8, e69737. [Google Scholar] [CrossRef] [PubMed]
  19. Hermans, C.; Hammond, J.P.; White, P.J.; Verbruggen, N. How do plants respond to nutrient shortage by biomass allocation? Trends Plant Sci. 2006, 11, 610–617. [Google Scholar] [CrossRef] [PubMed]
  20. Römheld, V.; Kirkby, E.A. Research on potassium in agriculture: Needs and prospects. Plant Soil 2010, 335, 155–180. [Google Scholar] [CrossRef]
  21. Singh, B.; Singh, Y.; Imas, P.; Jian-chang, X. Potassium Nutrition of the Rice-Wheat Cropping System. In Advances in Agronomy; Elsevier: New York, NY, USA, 2003; Volume 81, pp. 203–259. ISBN 978-0-12-000799-8. [Google Scholar]
  22. Padhee, A. Actionable Policies to Make Indian Agriculture Climate-Resilient. Available online: https://poshan.outlookindia.com/story/poshan-news-actionable-policies-to-make-indian-agriculture-climate-resilient/344974 (accessed on 6 January 2020).
  23. Martin, D.A. Linking fire and the United Nations Sustainable Development Goals. Sci. Total Environ. 2019, 662, 547–558. [Google Scholar] [CrossRef] [PubMed]
  24. Aown, M.; Raza, S.; Saleem, M.; Anjum, S.; Khaliq, T.; Wahid, M. Foliar application of potassium under water deficit conditions improved the growth and yield of wheat (Triticum aestivum L.). J. Anim. Plant Sci. 2012, 22, 431–437. [Google Scholar]
  25. Kumar, A.; Singh, R.; Singh, S.; Sendhil, R.; Chand, R.; Pandey, J. Adoption of Resource Conservation Technologies for Sustainable Production: Evidence of Potential Impact from Haryana. Indian J. Econ. Dev. 2018, 14, 77–82. [Google Scholar] [CrossRef]
  26. Mengel, K. Alternative or complementary role of foliar supply in mineral nutrition. In Proceedings of the International Symposium on Foliar Nutrition of Perennial Fruit Plants, Meran, Italy, 11–15 September 2001; pp. 33–47. [Google Scholar]
  27. Singh, B.; Kumar, D. Crop Residue Management through Options. Int. J. Agric. Environ. Biotechnol. 2018, 11. [Google Scholar] [CrossRef]
  28. Tripathi, S.; Chander, S.; Meena, R.P. Effect of residue retention, tillage options and timing of N application in rice-wheat cropping system. SAARC J. Agric. 2015, 13, 37–49. [Google Scholar] [CrossRef] [Green Version]
  29. Walkley, A.; Black, I.A. An examination of the Degtjareff method for determining soil organic matter, and a proposed modification of the chromic acid titration method. Soil Sci. 1934, 37, 29–38. [Google Scholar] [CrossRef]
  30. Jackson, M.L. Soil Chemical Analysis; Prentice-Hall, Inc.: Englewood Cliffs, NJ, USA, 1958. [Google Scholar]
  31. Olsen, S.R. Estimation of Available Phosphorus in Soils by Extraction with Sodium Bicarbonate; United States Department of Agriculture: Washington, DC, USA, 1954. [Google Scholar]
  32. Merwin, H.D.; Peech, M. Exchangeability of Soil Potassium in the Sand, Silt, and Clay Fractions as Influenced by the Nature of the Complementary Exchangeable Cation 1. Soil Sci. Soc. Am. J. 1951, 15, 125–128. [Google Scholar] [CrossRef] [Green Version]
  33. Richards, L.; Fireman, M. Pressure-plate apparatus for measuring moisture sorption and transmission by soils. Soil Sci. 1943, 56, 395–404. [Google Scholar] [CrossRef]
  34. Black, C.A. Methods of soil analysis: Physical and mineralogical properties, including statistics of measurement and sampling. Part 2. Chemical and microbiological properties. Agronomy 1965, 9, 1387–1388. [Google Scholar]
  35. Punjab Agricultural University. Package of Practices for Crops of Punjab: Rabi; Punjab Agricultural University: Ludhiana, India, 2014. [Google Scholar]
  36. Roth, C.H.; Humphreys, E.; Research, A.C.; For, I.A. Permanent beds and rice-residue management for rice-wheat systems in the Indo-Gangetic Plain. In Proceedings of the International Workshop on Permanent Beds and Rice-Residue Management for Rice-Wheat Systems in Indo-Gangetic Plains, Ludhiana, India, 7–9 September 2006. [Google Scholar]
  37. Pal, M.; Deka, J.; Rai, R. Fundamentals of cereal crop production; Tata McGraw-Hill Pub. Ltd.: New Delhi, India, 1996. [Google Scholar]
  38. Meena, R.P.; Karnam, V.; Tripathi, S.C.; Jha, A.; Sharma, R.K.; Singh, G.P. Irrigation management strategies in wheat for efficient water use in the regions of depleting water resources. Agric. Water Manag. 2019, 214, 38–46. [Google Scholar] [CrossRef]
  39. Bell, M.; Fischer, R. Guide to Plant and Crop Sampling: Measurements and Observations for Agronomic and Physiological Research in Small Grain Cereals; CIMMYT: El Batan, Mexico, 1994. [Google Scholar]
  40. Mamrutha, H.M.; Sharma, D.; Kumar, K.S.; Venkatesh, K.; Tiwari, V.; Sharma, I. Influence of Diurnal Irradiance Variation on Chlorophyll Values in Wheat: A Comparative Study Using Different Chlorophyll Meters. Natl. Acad. Sci. Lett. 2017, 40, 221–224. [Google Scholar] [CrossRef]
  41. Barrs, H.; Weatherley, P. A re-examination of the relative turgidity technique for estimating water deficits in leaves. Aust. J. Biol. Sci. 1962, 15, 413–428. [Google Scholar] [CrossRef] [Green Version]
  42. Humphreys, E.; Kukal, S.S.; Christen, E.W.; Hira, G.S.; Sharma, R.K. Chapter five—Halting the Groundwater Decline in North-West India—Which Crop Technologies will be Winners? In Advances in Agronomy; Sparks, D.L., Ed.; Elsevier: New York, NY, USA, 2010; Volume 109, pp. 155–217. [Google Scholar]
  43. Kukal, S.S.; Jat, M.L.; Sidhu, H.S. Improving Water Productivity of Wheat-Based Cropping Systems in South Asia for Sustained Productivity. In Advances in Agronomy; Elsevier: New York, NY, USA, 2014; Volume 127, pp. 157–258. ISBN 978-0-12-800131-8. [Google Scholar]
  44. El-Samnoudi, I.M.; Ibrahim, A.E.-A.M.; Abd El Tawwab, A.R.; Abd El-Mageed, T.A. Combined Effect of Poultry Manure and Soil Mulching on Soil Properties, Physiological Responses, Yields and Water-use Efficiencies of Sorghum Plants under Water Stress. Commun. Soil Sci. Plant Anal. 2019, 50, 2626–2639. [Google Scholar] [CrossRef]
  45. Jat, M.; Gathala, M.; Saharawat, Y.; Ladha, J.; Singh, Y. Conservation Agriculture in Intensive Rice-Wheat Rotation of Western Indo-Gangetic Plains: Effect on Crop Physiology, Yield, Water Productivity and Economic Profitability. Int. J. Environ. Sci. Nat. Res. 2019, 18, 1–15. [Google Scholar]
  46. Li, S.X.; Wang, Z.H.; Li, S.Q.; Gao, Y.J.; Tian, X.H. Effect of plastic sheet mulch, wheat straw mulch, and maize growth on water loss by evaporation in dryland areas of China. Agric. Water Manag. 2013, 116, 39–49. [Google Scholar] [CrossRef]
  47. Sharma, S.; Thind, H.S.; Sidhu, H.S.; Jat, M.L.; Parihar, C.M. Effects of crop residue retention on soil carbon pools after 6 years of rice–wheat cropping system. Environ. Earth Sci. 2019, 78, 296. [Google Scholar] [CrossRef]
  48. Kar, G.; Kumar, A. Effects of irrigation and straw mulch on water use and tuber yield of potato in eastern India. Agric. Water Manag. 2007, 94, 109–116. [Google Scholar] [CrossRef]
  49. Lollato, R.P.; Ruiz Diaz, D.A.; DeWolf, E.; Knapp, M.; Peterson, D.E.; Fritz, A.K. Agronomic Practices for Reducing Wheat Yield Gaps: A Quantitative Appraisal of Progressive Producers. Crop Sci. 2019, 59, 333–350. [Google Scholar] [CrossRef] [Green Version]
  50. Najafinezhad, H.; Tahmasebi Sarvestani, Z.; Modarres Sanavy, S.A.M.; Naghavi, H. Evaluation of yield and some physiological changes in corn and sorghum under irrigation regimes and application of barley residue, zeolite and superabsorbent polymer. Arch. Agron. Soil Sci. 2015, 61, 891–906. [Google Scholar] [CrossRef]
  51. Jat, H.S.; Singh, G.; Singh, R.; Choudhary, M.; Jat, M.L.; Gathala, M.K.; Sharma, D.K. Management influence on maize-wheat system performance, water productivity and soil biology. Soil Use Manag. 2015, 31, 534–543. [Google Scholar] [CrossRef]
  52. Sharma, A.R.; Singh, R.; Dhyani, S.K.; Dube, R.K. Agronomic and Economic Evaluation of Mulching in Rainfed Maize—Wheat Cropping System in the Western Himalayan Region of India. J. Crop Improv. 2011, 25, 392–408. [Google Scholar] [CrossRef]
  53. Abdallah, M.M.S.; El-Bassiouny, H.M.S.; AbouSeeda, M.A. Potential role of kaolin or potassium sulfate as anti-transpirant on improving physiological, biochemical aspects and yield of wheat plants under different watering regimes. Bull. Natl. Res. Cent. 2019, 43, 134. [Google Scholar] [CrossRef]
  54. Ashraf, M.; Afzal, M.; Ahmad, R.; Ali, S.; Shahzad, S.M.; Aziz, A.; Ali, L. Growth and yield components of wheat genotypes as influenced by potassium and farm yard manure on a saline sodic soil. Soil Environ. 2011, 30, 115–121. [Google Scholar]
  55. Sohair, E.E.; Abdallah, A.M.; Makram, E.; Darwish, A.; Abd El-Hady, A.S. Effect of potassium foliar fertilization, level and time of nitrogen application on growth and yield of Egyptian cotton. Biosci. Res. 2018, 15, 1103–1112. [Google Scholar]
  56. Hasanuzzaman, M.; Bhuyan, M.; Nahar, K.; Hossain, M.; Mahmud, J.A.; Hossen, M.; Masud, A.A.C.; Fujita, M.; Moumita. Potassium: A vital regulator of plant responses and tolerance to abiotic stresses. Agronomy 2018, 8, 31. [Google Scholar] [CrossRef] [Green Version]
  57. Saifullah, A.; Ranjha, M.; Yaseen, M.; Akhtar, M. Response of wheat to potassium fertilization under field conditions. Pak. J. Agric. Sci 2002, 39, 269–272. [Google Scholar]
  58. Tavakol, E.; Jákli, B.; Cakmak, I.; Dittert, K.; Karlovsky, P.; Pfohl, K.; Senbayram, M. Optimized potassium nutrition improves plant-water-relations of barley under PEG-induced osmotic stress. Plant Soil 2018, 430, 23–35. [Google Scholar] [CrossRef]
  59. Jaenisch, B.R.; de Oliveira Silva, A.; DeWolf, E.; Ruiz-Diaz, D.A.; Lollato, R.P. Plant Population and Fungicide Economically Reduced Winter Wheat Yield Gap in Kansas. Agron. J. 2019, 111, 650–665. [Google Scholar] [CrossRef] [Green Version]
  60. Lollato, R.P.; Figueiredo, B.M.; Dhillon, J.S.; Arnall, D.B.; Raun, W.R. Wheat grain yield and grain-nitrogen relationships as affected by N, P, and K fertilization: A synthesis of long-term experiments. Field Crop. Res. 2019, 236, 42–57. [Google Scholar] [CrossRef]
  61. Vijayakumar, S.; Kumar, D.; Shivay, Y.; Anand, A.; Saravanane, P.; Singh, N. Potassium fertilization for enhancing yield attributes, yield and economics of wheat (Triticum aestivum). Indian J. Agron. 2019, 64, 226–231. [Google Scholar]
  62. Aladakatti, Y.; Hallikeri, S.; Nandagavi, R.; Naveen, N.; Hugar, A.; Biaise, D. Yield and fiber qualities of hybrid cotton (Gossypium hirsutum) as influenced by soil and foliar application of potassium. Karnataka J. Agric. Sci. 2011, 24, 133–136. [Google Scholar]
  63. Sarma, P.K.; Hazarika, M.; Sarma, D.; Saikia, P.; Neog, P.; Rajbongshi, R.; Kakati, N.; Bhattacharjee, M.; Rao, C.S. Effect of Foliar Application of Potassium on Yield, Drought Tolerance and Rain Water Use Efficiency of Toria under Rainfed Upland Situation of Assam. Indian J. Dryland Agric. Res. Dev. 2015, 30, 55–59. [Google Scholar] [CrossRef] [Green Version]
  64. Rajitha, B.; Latha, P.; Sudhakar, P.; Umamahesh, V. A Comparative Study on the Effect of Foliar Application of Nitrogen, Phosphorus, Potassium, Iron and Zinc on Proline Content, Yield and Cost-Benefit ratio of groundnut Plants Grown under Water Stress Conditions. Int. J. Pure. App. Biosci. 2018, 6, 784–789. [Google Scholar] [CrossRef]
  65. Meena, R.P.; Karnam, V.; Rinki, R.S.; Sharma, R.K.; Tripathi, S.C.; Singh, G.P. Identification of water use efficient wheat genotypes with high yield for regions of depleting water resources in India. Agric. Water Manag. 2019, 223, 105709. [Google Scholar] [CrossRef]
  66. Muñoz, P.; Voltas, J.; Araus, J.L.; Igartua, E.; Romagosa, I. Changes over time in the adaptation of barley releases in north-eastern Spain. Plant Breed. 1998, 117, 531–535. [Google Scholar] [CrossRef]
  67. Sayre, K.D.; Rajaram, S.; Fischer, R. Yield potential progress in short bread wheats in northwest Mexico. Crop Sci. 1997, 37, 36–42. [Google Scholar] [CrossRef]
  68. Musick, J.T.; Jones, O.R.; Stewart, B.A.; Dusek, D.A. Water-Yield Relationships for Irrigated and Dryland Wheat in the U.S. Southern Plains. Agron. J. 1994, 86, 980–986. [Google Scholar] [CrossRef]
  69. Lollato, R.P.; Edwards, J.T. Maximum attainable wheat yield and resource-use efficiency in the southern Great Plains. Crop Sci. 2015, 55, 2863–2876. [Google Scholar] [CrossRef] [Green Version]
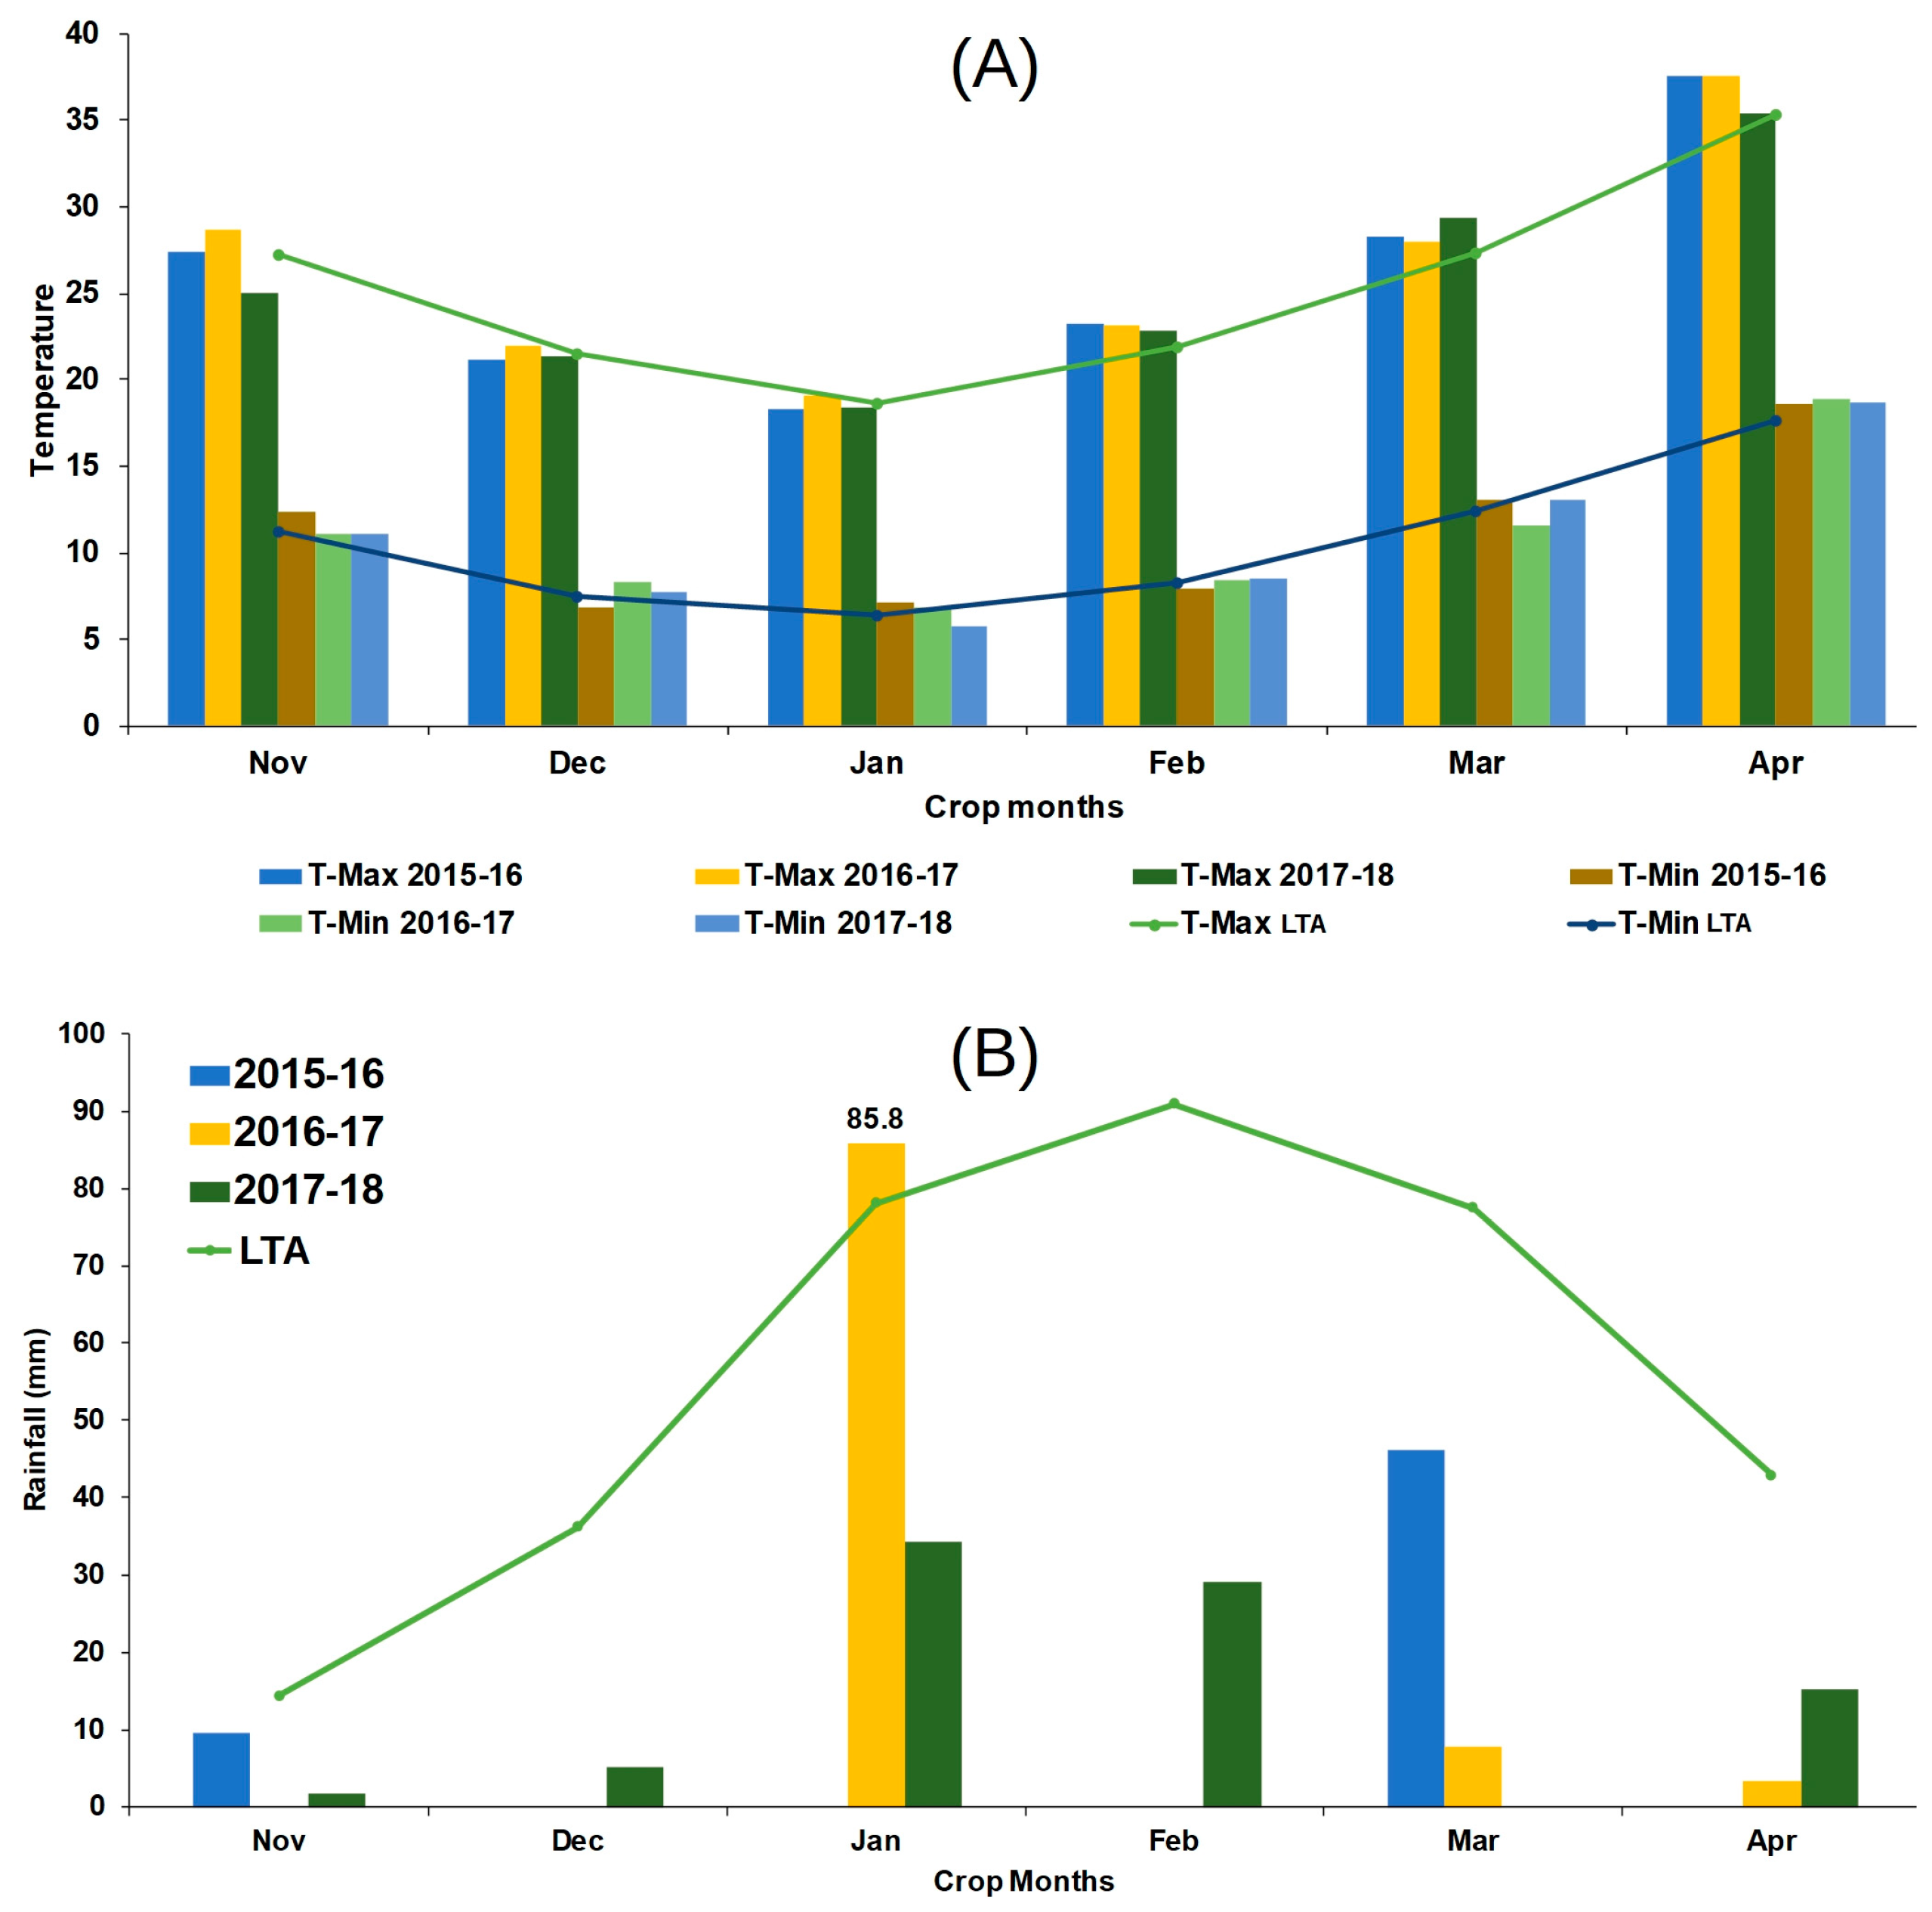
Figure 1. Monthly mean maximum and minimum temperature (A) and monthly total rainfall (B) at IIWBR, Karnal during experimental years compared with long-term averages (1972–2017).
Agronomy 10 00434 g001
Figure 2. Amount of water (m3) available to the crop during the experimental years.
Agronomy 10 00434 g002
Figure 3. Effect of Rice Residue Retention on GY, AGBM, HI, TPM, GrPMS, TGW, GPS, RWC, SPAD, WUE, Net returns, and BC ratio of wheat. Means having different letter are significantly different from each other at 5% significance level. Note: GY: Grain Yield (Kg ha−1); AGBM: Above ground biomass (t ha−1); HI: Harvest Index; TPM: Tillers Per meter square; TGW: Thousand Grains Weight (g); RWC: Relative Water Content; SPAD: Soil Plant Analysis Development (Chlorophyll content); GPS: Grains Per Spike; GrPMS: Grains Per Meter Square; WUE: Water Use Efficiency (Kg m−3)
Agronomy 10 00434 g003
Figure 4. Effect of foliar application of K on GY and profitability parameters of wheat. Thick dark horizontal lines show the averages, the box provides the total variation for the 2nd and 3rd quartile, whiskers have the length of one standard deviation, and dots above or below standard deviation lines indicate the outlier values. Boxplots having different letter are significantly different from each other at 5% significance level. Note: GY: Grain Yield (Kg ha−1); AGBM: Above ground biomass (t ha−1); HI: Harvest Index; TPM: Tillers Per Meter square; TGW: Thousand Grains Weight (g); RWC: Relative Water Content; SPAD: Soil Plant Analysis Development (Chlorophyll content); GPS: Grains Per Spike; GrPMS: Grains Per Meter Square; WUE: Water Use Efficiency (Kg m−3)
Agronomy 10 00434 g004
Figure 5. Interaction effect of rice residue retention and irrigation levels on GY and profitability parameters of wheat. Means having different letter are significantly different from each other at 5% significance level. Note: GY: Grain Yield (Kg ha−1); RWC: Relative Water Content; WUE: Water Use Efficiency (Kg m−3); IAS: Irrigation at all six critical growth stages of wheat; ICS: Irrigation at Crown Root Irrigation stage; ICS + IFS: irrigation one each at ICS and flowering stage
Agronomy 10 00434 g005
Figure 6. Interaction effect of foliar application of K and irrigation levels on GY and profitability parameters of wheat. Means having different letter are significantly different from each other at 5% significance level. Note: RWC: Relative Water Content; IAS: Irrigation at all six critical growth stages of wheat; ICS: Irrigation at Crown Root Irrigation stage; ICS + IFS: irrigation one each at ICS and flowering stage; K: Foliar application of potassium (2% K2SO4)
Agronomy 10 00434 g006
Figure 7. Correlations between GY, Yield attributing traits and physiological parameters.
Agronomy 10 00434 g007
Figure 8. Regression of GY vs Water available to the crop.
Agronomy 10 00434 g008
Table 1. Analysis of variance of wheat yield components and physiological traits as affected by treatments. The experiment had a split plot design with residue retention (R) as main plot, Irrigation (I) as sub plot and foliar application of K as sub subplot.
EffectdfGYAGBMHITPMTGWRWCSPADGPSGrPMSWUENet ReturnsBC Ratio
Residue (R)1<0.0010.0040.350.2020.241<0.001<0.0010.031<0.001<0.001<0.001<0.001
Irrigation levels (I)2<0.001<0.0010.135<0.001<0.001<0.001<0.0010.554<0.001<0.001<0.001<0.001
Foliar spray of K (K)1<0.001<0.0010.1210.1660.304<0.001<0.0010.7910.1940.033<0.001<0.001
R × I2<0.0010.3080.2770.7130.386<0.0010.4380.6830.0970.002<0.001<0.001
R × K10.7570.8710.6890.6690.7180.0750.7690.9630.5100.7720.8990.788
I × K20.4510.3340.0920.4180.726<0.0010.2870.5530.4300.4950.9420.916
R × I × K20.7490.5550.2800.3040.8360.0390.5920.6270.9560.9720.9810.978
Note: GY: Grain Yield (Kg ha−1); AGBM: Above ground biomass (t ha−1); HI: Harvest Index; TPM: Tillers Per Meter square; TGW: Thousand Grains Weight (g); RWC: Relative Water Content; SPAD: Soil Plant Analysis Development (Chlorophyll content); GPS: Grains Per Spike; GrPMS: Grains Per Meter Square; WUE: Water Use Efficiency (Kg m−3)
Table 2. Analysis of variance of residuals of regression between GY vs Water available to the crop as affected by treatments.
EffectSum of SquaresdfMean SquareFp
Residue retention (R)1,557,00011,557,00030.882<0.001
Irrigation levels (I)825,488.0992412,744.0498.188<0.001
Foliar spray of K (K)1,298,00011,298,00025.749<0.001
R × I2,469,00021,234,00024.487<0.001
R × K8533.33318533.3330.1690.682
I × K35,144.019217,572.0090.3490.707
R × I × K70,535.389235,267.6940.70.499