Article

Optimizing Nitrogen Fertigation Rates for Young Southern Highbush Blueberry

1
Horticultural Sciences Department, University of Florida/IFAS, Gainesville, FL 32611, USA
2
Department of Soil and Water Sciences, Tropical Research and Education Center, University of Florida/IFAS, Homestead, FL 33031, USA
*
Author to whom correspondence should be addressed.
Agronomy 2020, 10(3), 389; https://doi.org/10.3390/agronomy10030389
Submission received: 12 February 2020 / Revised: 8 March 2020 / Accepted: 9 March 2020 / Published: 12 March 2020
(This article belongs to the Section Horticultural and Floricultural Crops)

Abstract

:
The commercial blueberry industry in Florida has expanded significantly in both acreage and value in the past several years. The southern highbush blueberry (SHB, Vaccinium corymbosum L. interspecific hybrid) is the major blueberry type grown in Florida. The nitrogen (N) demand of young SHB differs from the northern highbush blueberry (NHB, V. corymbosum L.) and from mature blueberry plants. The objective of this study was to optimize fertigated N rates for the growth and yield of young SHB plants. One-year-old ‘Emerald’ and ‘Farthing’ plants were fertilized with 32N-0P-0K through drip irrigation at annual rates of 0, 42, 84, 168, and 336 kg N ha−1. Soil nitrate levels at multiple depths were measured along with leaf nutrient concentration, percent canopy ground cover, fruit yield and fruit quality. The results indicated that N rates had no significant effect on leaf nutrient concentrations. Greater N rates advanced bloom and harvest, increased percentage of ground cover (an indicator of canopy size), fruit yield and berry numbers per plant, but decreased mean berry diameter and weight. The soil nitrate results from both ‘Emerald’ and ‘Farthing’ revealed that the 336 kg N ha−1 treatment had a significantly greater risk for nitrate leaching than the lower N treatments in spring. The effect of N rates on fruit quality varied with cultivar and harvest season. The linear plateau regression of fruit yield and N rates indicated that the maximum yield reached at the annual N fertigation rate of 222 kg ha−1 for ‘Emerald’ and 206 kg ha−1 for ‘Farthing’.

1. Introduction

The commercial blueberry (Vaccinium spp.) industry in Florida is based on the southern highbush blueberry (SHB, Vaccinium corymbosum L. interspecific hybrid) and has significantly expanded in acreage from 1415 hectares in 2010 to 2104 hectares in 2018 [1]. Its fresh market value has increased from approximately $47 million in 2010 to more than $60.4 million in 2018. Many SHB production areas in Florida are characterized by well-drained sandy soils, which may result in a high risk for nitrogen (N) leaching when combined with high N application rates and high irrigation/rainfall. Nitrogen leaching leads to lower profitability through fertilizer loss and to potential high environmental risks.
In a three-year study, Williamson and Miller found that the optimum N rate for mature SHB plants in pine bark beds ranged from 360 to 580 kg ha−1 [2]. They explained that the high fertilizer usage was attributed to the heavy N leaching resulted from low water and nutrient holding capacity of pine bark and frequent irrigation. In a two-year study of the mature northern highbush blueberry (NHB, V. corymbosum L.) grown in Oregon, Banados reported that the application of 100 or 200 kg ha−1 N increased shoot biomass compared with no N application in the second year of the study [3]. However, N rates did not affect yield, possibly because stored N reserves in mature plants compensated for low N fertilizer rates during the two-year study [3]. Our previous work has shown that reserve N contributes to fruit development in blueberries [4].
In contrast to the results from mature NHB blueberries, the growth and yield of young NHB, ‘Bluecrop’, were greatest at an N rate of 50 kg ha−1, while N rates of 100 and 150 kg ha−1 reduced plant dry weight and resulted in some plant mortality due to salt accumulation [5]. Conversely, White found that young NHB, ‘Elliott’, fertilized with 114 kg ha−1 N had similar dry weight as those fertilized with 22 or 68 kg ha−1 N [6]. The fertilizer in both studies was manually broadcasted under plant canopies and evenly split into thirds. The inconsistency between the two studies may be due to cultivar differences in susceptibility to salt stress and/or the absence of overhead irrigation after fertilizer application in the former study.
Blueberry plants’ response to N rate is also influenced by the N application method [7,8]. These studies reported that fertigation reduced salt accumulation and changed N use efficiency compared with dry granular fertilization [7,8]. Hanson [9] reported that soil conditions, such as soil texture and nitrifier populations, affected N dynamics and uptake by blueberry plants, resulting in additional variability in blueberry response to N rate. Therefore, the optimum N rate may be affected by location and environmental conditions within that location, soil type, irrigation rate, soil amendment, fertilizer application method, cultivar, and plant age. Moreover, different temperatures may lead to different N mineralization and cycling rates. However, there were no N recommendations available for commercial production of SHB in Florida during the initial field establishment. The objectives of this study were to (1) determine the effect of N rates on the growth and yield of young SHB and (2) optimize N application rates for commercial blueberry production in Florida.

2. Materials and Methods

2.1. Plant Materials and Experimental Site

One-year-old plants of ‘Emerald’ and ‘Farthing’ SHB were obtained from a north Florida nursery (Island Grove, FL) and planted in March 2015 at the University of Florida Plant Science Research and Education Unit in Citra, FL (29°24′ N latitude and 82°10′ W longitude). Weather data were obtained from the Florida Automated Weather Network (FAWN) weather station located at the research center. The soil was a well-drained Arredondo sandy soil [10], with pH ~5.8. Sulfuric acid (38%) applied daily through drip irrigation to maintain soil pH at approximately 5.3. Plants were planted in beds in which 787.5 m3 ha−1 of pine (Pinus elliottii L.) bark was incorporated into the top 20 cm soil. Urea, as pre-plant N, was evenly mixed into the pine bark layer at an N rate of 0.39 kg m−3, which is a standard commercial practice for minimizing N immobilization in the growing season [11]. Each bed was 60 cm wide and 15 cm high and was covered by black woven ground cover fabric (Agfabric Pro 3.4 Oz Weed Barrier Landscape Fabric). Plant spacing was 90 cm in-row and 240 cm between rows with a planting density of ~4600 plants ha−1.

2.2. Experimental Design and Treatments

A separate randomized complete block design with five replications was used for each cultivar and each was treated as a separate experiment. The two experiments were located side by side. Each plot consisted of six plants. Two representative plants, excluding the end plants (guard plants), were randomly selected for data collection in each plot. The same five N fertilizer treatments were used in both experiments: 0, 42, 84, 168 and 336 kg ha−1 per year (labeled as 0N, 42N, 84N, 168N and 336N). The N source was 32N-0P-0K, containing 50% urea and 50% ammonium nitrate (NH4NO3) equal to 75% NH4-N and 25% NO3-N. All plants were fertilized with 27 kg ha−1 of P (phosphoric acid, H3PO4) and 101 kg ha−1 of K (potassium sulfate, K2SO4) each year based on the recommendations of Krewer and Ruter [11]. All fertilizers were applied daily through drip irrigation in the morning from 1 April 2015 to 30 November 2015, and from 26 February 2016 to 24 October 2016. Nitrogen was applied at the same rate for each treatment (0.17 kg N ha−1min−1) but for different lengths of time which were 0, 1, 2, 4, and 8 min for 0N, 42N, 84N, 168N, and 336N treatments, respectively. Water was applied during the remaining time to guarantee that all plants received the same amount of water. The five N rates were applied through five separate tubes (Netafim, Hatzerim, Israel) and P and K were applied together in another tube. The line for P and K ran for 4 min on each fertigation day at the rate of 0.03 kg and 0.10 kg ha−1min−1, respectively. The daily irrigation rate was adjusted as needed, ranging from 0.43 L during dormancy to 1.97 L plant−1 day−1 during the vigorous vegetative growth stage. Orifices on the drip tubes were spaced 30 cm apart and each had an output of 0.98 L hr−1. Each plant had six orifices in total within its allotted space. The fertilizer injector was a pressure type with a check valve, and an LMI Milton Roy Pump (Model#A151-823S1, Farmingdale, NJ, USA).

2.3. Plant Growth Measurement

Leaf samples were collected on 13 October 2015, 21 April 2016, 1 June 2016 and 22 August 2016 to determine total leaf N concentration. These dates correspond to the initiation of fall leaf coloration, beginning of fruit harvest, end of fruit harvest, and initiation of flower buds, respectively. Leaf P, K, Ca, Mg, S and micronutrient concentrations were analyzed from leaf samples collected on 13 October 2015 and 1 June 2016 sample dates. This interval comprises the completion of flower bud initiation, dormancy, vegetative and floral budbreak, and berry development. Each leaf sample consisted of approximately 50 recently fully expanded leaves that were sampled from all sides of each plant, except the end plants, in a plot. Dried leaf samples were ground to pass through a 20-mesh (1.0 mm) screen and analyzed using a LECO-Nitrogen Gas Analyzer (FP 628, Model#: 622-000-200, St. Joseph, MI 49085) for N and an inductively coupled argon plasma emission spectrophotometer for P, K, Ca, Mg, S, Fe, B, Cu, Mn, and Zn by the Waters Agricultural Laboratory (Camilla, GA). Since the young plants had irregularly shaped canopies, percent canopy ground cover [12] was measured instead of plant width. A digital camera (Canon PowerShot SX50 HS with a resolution of 12.1 megapixels) (Canon, Tokyo) was mounted 130 cm above the center of each plant to take pictures of the plant canopies. Plants that were adjacent to the data plants were separated by hand while taking pictures if canopies were touching or overlapping. The photographs were taken on two cloudy dates, 14 November 2015 and 27 October 2016, to avoid sunlight interference. The NIH ImageJ 1.50 analysis software (National Institutes of Health, Bethesda, MD, USA) was used to define the areas shown in the images and to measure areas within them.

2.4. Soil Sample Collection and Analysis

Soil cores were collected four times each year (29 April, 28 May, 27 July, and 6 October in 2015, and 23 Mar., 17 May, 18 July, and 15 Sept. in 2016) to evaluate soil nitrate levels at three depths (15, 30, and 76 cm). On each soil sampling day, the irrigation system was turned off until samples were collected. In each plot, one soil core (16.5 cm in height and 8.0 cm in diameter) was collected using an auger (PN071 JMC 3-inch Professional Sand Auger, Newton, IA) at each depth in the row, midway between two plants. Soil samples were analyzed at the Waters Agricultural Laboratory (Camilla, GA, USA) with the potassium chloride–cadmium reduction method using a flow injection analyzer (FIALAB 2500, Model#: 1.0606, Seattle, WA 98103).

2.5. Fruit Yield and Quality Measurements

Flower buds were pruned off to prevent fruit production during the first growing season. In the second year, the percentages of open flowers were visually estimated at seven-day intervals by the same observer from 26 January to 29 March 2016. Ripe fruit from the two data plants per plot were harvested for both cultivars. Berries are considered ripe at color break from red to blue. ‘Emerald’ plants were harvested twice a week from 18 April 2016 to 7 June 2016 for a total of fourteen harvests. ‘Farthing’ plants were harvested once a week in the first and last two weeks, and twice a week during the middle period from 11 April 2016 to 15 June 2016 for a total of fifteen harvests. The few berries that matured after the last harvest date were removed and not counted in the yield. The total fresh weight of the berries was measured at each harvest date. Seasonal mean berry weight was calculated using a weighted average of 25 berries per plot at each harvest date. The total berry numbers were the sum of berry numbers at each harvest date, which were estimated based on the total berry weight divided by the average berry weight. At each of the early (‘Emerald’ 2 May 2016; ‘Farthing’ 9 May 2016), mid (‘Emerald’ 9 May 2016; ‘Farthing’ 16 May 2016), and late (‘Emerald’ 16 May 2016; ‘Farthing’ 23 May 2016) season, 25-berry subsamples were used to determine berry diameter, firmness, total soluble solid concentration (TSS) and titratable acidity (TTA). The ratio of TSS to TTA was then calculated. Berry diameter and fruit firmness were measured with a firmness tester (FirmTech 2, BioWorks, Wamego, Kansas) at a minimum force setting of 50 g and a maximum setting of 350 g on the day of harvest. After firmness measurements, berries were sealed in ziploc bags and frozen in a −20 °C freezer for later TSS and TTA analyses. The thawed berries were ground with a blender (Chefman immersion blender, Model#: RJ19-MS-PBG-CA, Mahwah, NJ, USA). After centrifuging (ThermoFisher Scientific, Model#: Sorvall Legend XTR Centrifuge, Osterode am Harz, Germany) and filtering with cheese cloth, juice TSS (expressed as °Brix) was measured with an automatic refractometer (Ametek Reichert Technologies, Depew, NY, USA). Titratable acidity was determined by using an automatic titrator (Methrohm, Riverview, FL, USA), titrating 6 mL of juice with 0.1 N NaOH up to pH 8.2, and expressed as percent of citric acid.

2.6. Data Analysis

The effect of the N rate on each measured variable and the effect of the sampling date on the leaf N concentration were analyzed by one-way analysis of variance (ANOVA) using RStudio [13]. Comparisons among treatments were performed using Tukey’s honestly significant difference (Tukey’s HSD) test at the 0.05 level. The linear and quadratic regressions between variables except yield, and N rates, were analyzed if the ANOVA indicated a significant N treatment effect on the variable [14]. The regressions mentioned above, linear plateau regression between yield and N rates, and linear correlations among each pair of traits (berry number, berry diameter, berry weight, yield, and ground cover percent) were all analyzed using RStudio with the ‘nlstools’ and ‘easynls’ packages.

3. Results and Discussion

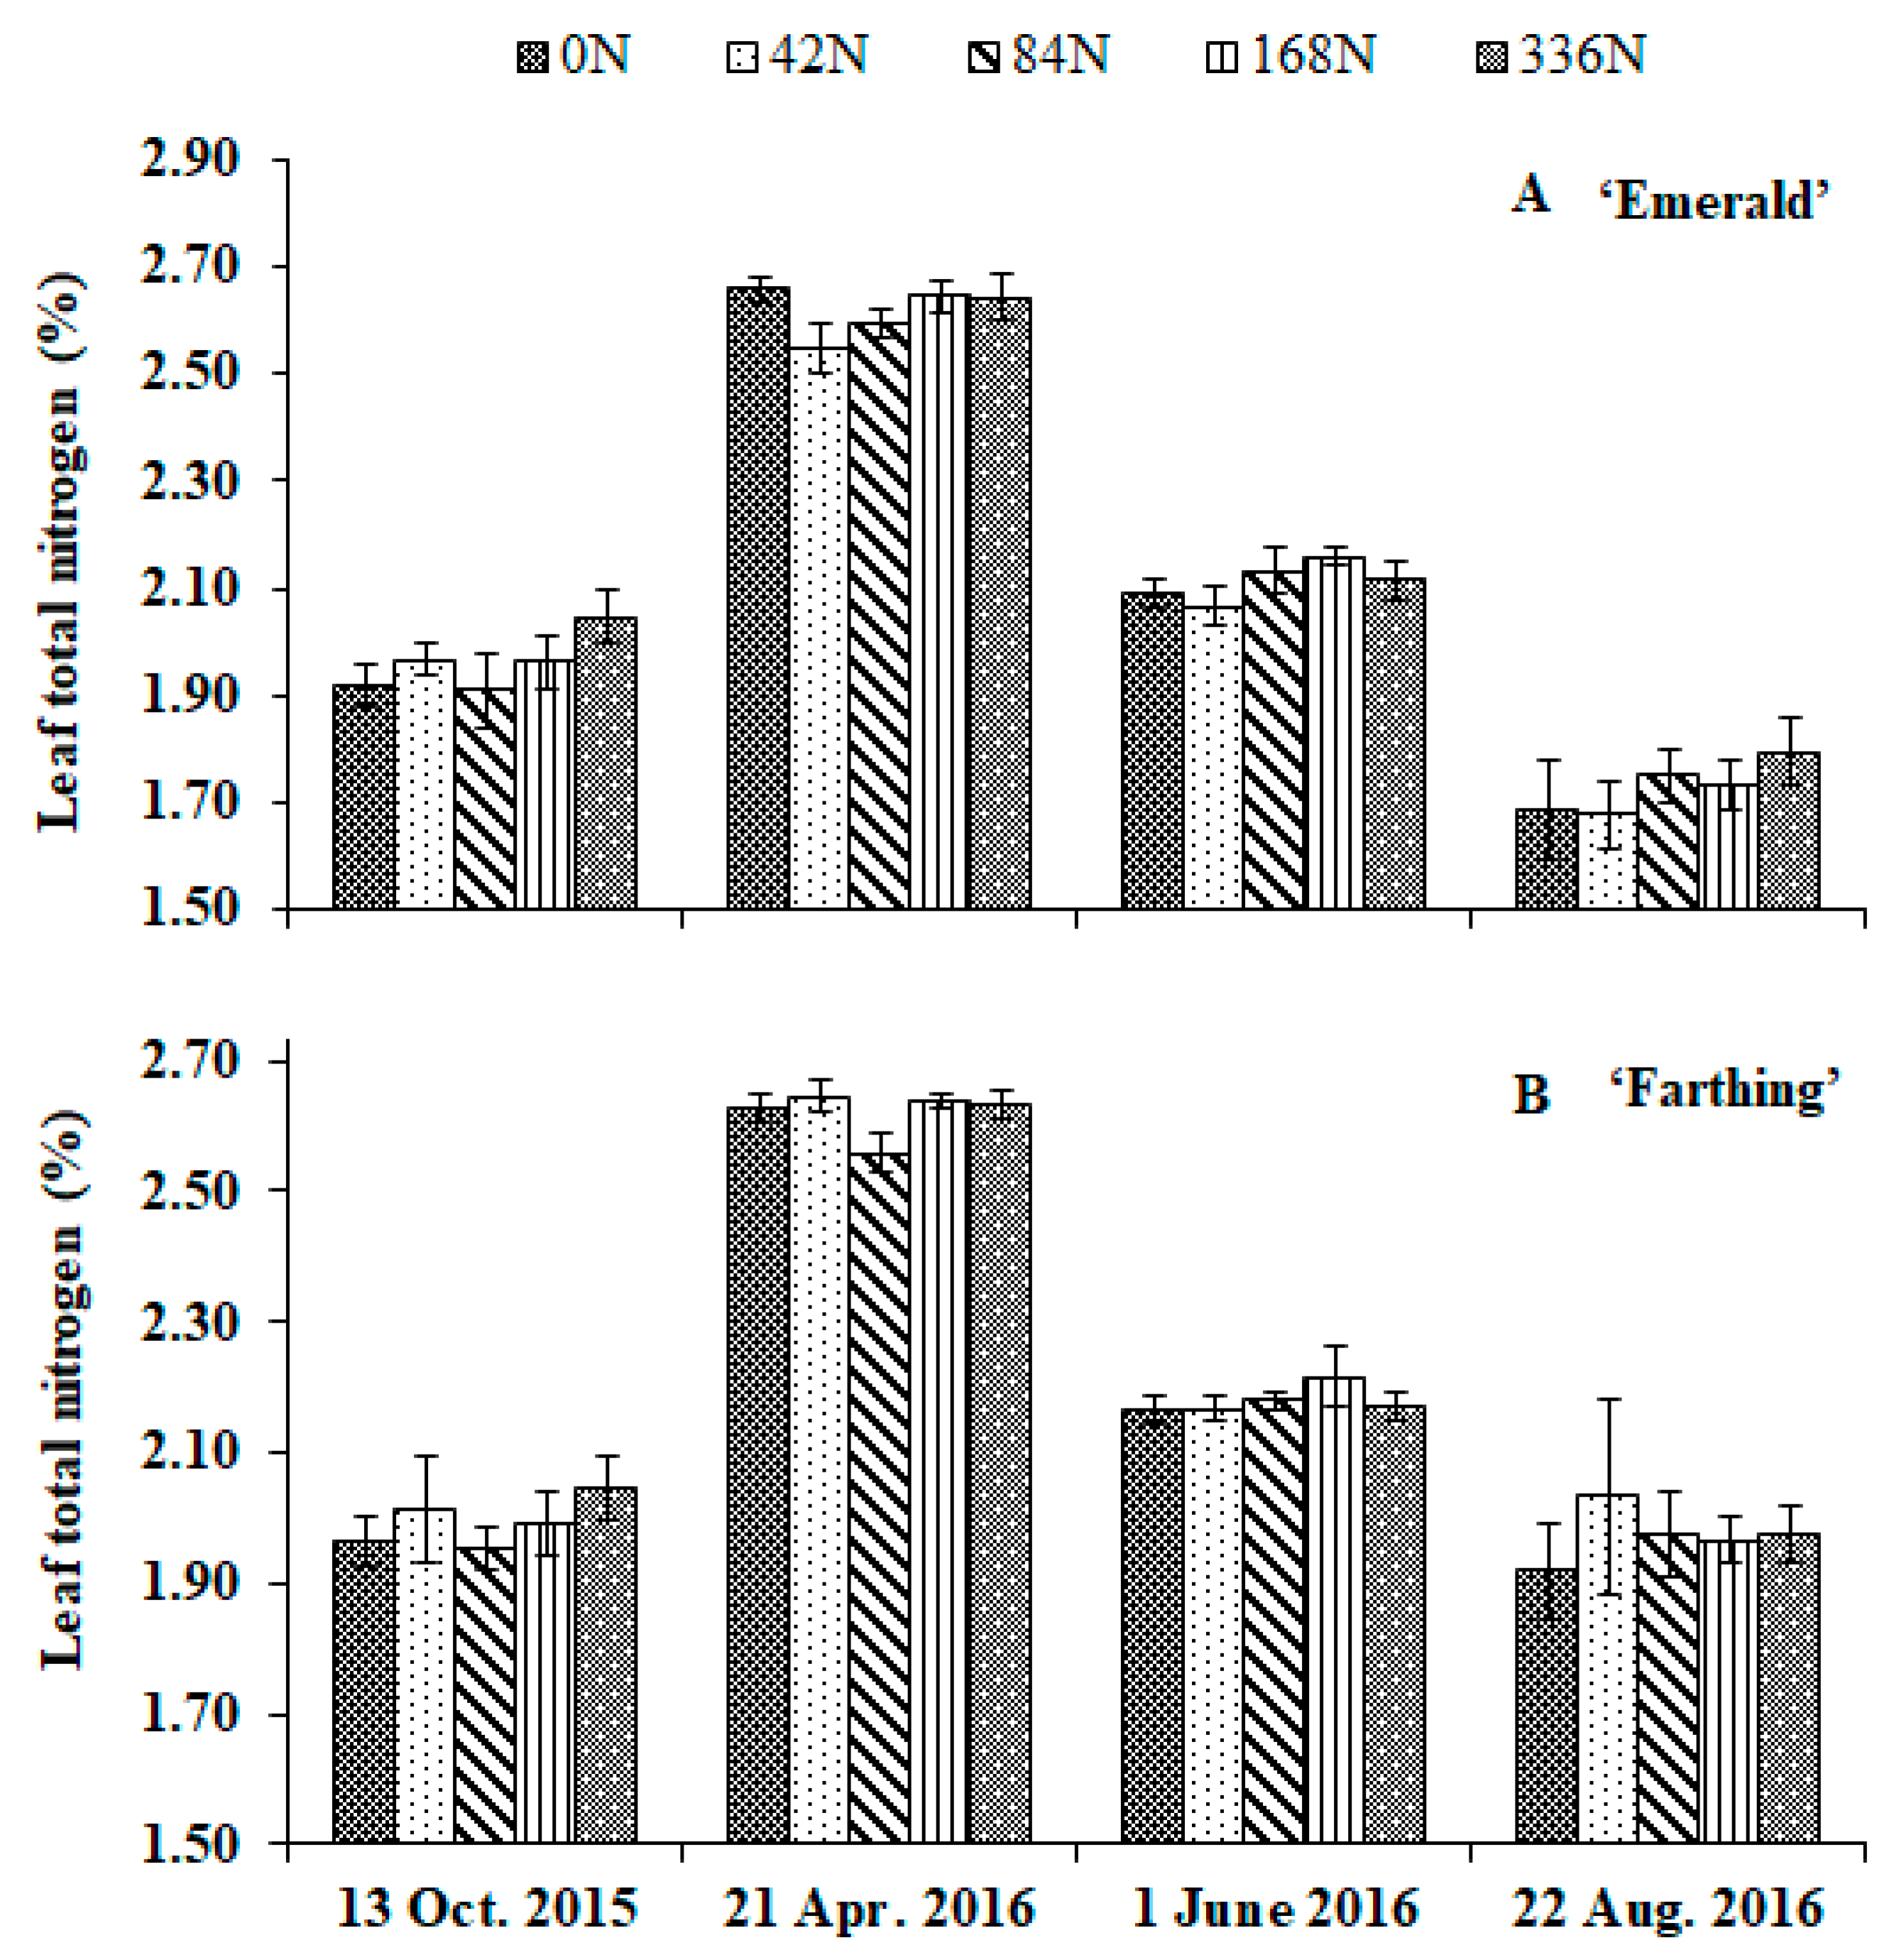
3.1. Leaf Nutrient Concentration

Due to the similarity of the seasonal pattern of leaf N concentration for the two cultivars, only the data for ‘Emerald’ are shown (Figure 1). There were no differences in total leaf N concentration among N treatments within a sampling date for both cultivars. The similar leaf N concentration of the 0N plants with the plants receiving N fertigation was likely due to the pre-plant N and N release from pine bark decomposition [11]. Additionally, mobilization of N reserves stored in the roots and stems may have contributed to the similarities in leaf N concentration for 2016. Seasonal leaf N concentrations ranged from 1.7% to 2.6%. The sufficiency range for SHB leaf N concentration in summer is 1.44% to 1.65% [15], with 2.5% N considered excessive [16]. However, the sufficient leaf N range may vary with cultivars and locations [17]. Leaf N concentration increased significantly from the end of the growing season (October 2015) to the early harvest season (April 2016), then declined continuously through the end of August (p < 0.01) when other plant tissues also demanded a high amount of N [4]. During this growth stage, new and old stems had more N than leaves [4]. Decreased leaf N concentrations from spring to fall was also found in young NHB ‘Bluecrop’ [5] and may be attributed to the remobilization and translocation of N from leaves to stronger sinks, including fruit, new leaves, stems and crown. From late August to early winter, N is remobilized from leaves prior to leaf abscission, and accumulates as reserves in the perennial parts of the plant.
Nitrogen rates had no effect on other leaf nutrients for either cultivar in either year. This differs from the findings of Bryla et al. [17] and is likely due to site and cultivar variability [17,18,19]. Leaf P concentration averaged 0.12% for both cultivars across the two sampling dates, which is similar to the findings of Bryla et al. [17] for young NHB in their second season. Leaf K concentration was 1.05% in October 2015 and decreased to 0.57% after harvest in 2016. The decrease in leaf K may be due to the translocation of K from leaves to support flower and fruit development. Bryla et al. [17] did not find a fluctuation in leaf K in their study and they speculated that low fruit loads reduced the amount of leaf K translocation. The seasonal patterns for leaf Ca, Mg, S, B, and Zn varied with cultivar, but concentrations at both sampling dates were within the optimum range [16], averaging 0.84%, 0.25%, 0.23%, 67 mg kg−1, and 17 mg kg−1, respectively. Leaf Mn concentrations were 615 mg kg-1 for ‘Emerald’ and 547 mg kg-1 for ‘Farthing’ in October 2015, above the optimum range of 50 to 350 mg kg−1 [16]. However, concentrations decreased to within the optimum range (313.15 mg kg−1) by June 2016 for both cultivars. Leaf Fe concentrations for both sampling dates averaged 54 mg kg−1 for ‘Emerald’ and 60 mg kg−1 for ‘Farthing’, which were below the optimum range of 60 to 200 mg kg−1 [16]. The average Cu concentration for ‘Emerald’ at the two dates was 4 mg kg-1, which was below the optimum range of 5 to 20 mg kg−1 [16]. Leaf Cu in ‘Farthing’ was a little below 5 mg kg−1 in October 2015 but increased to 6 mg kg−1 in June 2016. There were no signs of Fe or Cu deficiency in plants. These results suggest that leaf nutrient standards for young SHB may need to be improved.

3.2. Soil Nitrate Concentration

Due to the influence of pre-plant N and small plant size with limited root systems, there were no consistent differences in soil nitrate among treatments, sampling dates, or cultivars in 2015 (data not shown). There was a tendency for greater soil nitrate concentrations in the 336N treatment than in the other treatments. For example, in the ‘Emerald’ field, the respective soil nitrate concentrations throughout the year for 336N averaged 15.20 ± 1.01 and 7.43 ± 1.43 mg kg−1 at the 30 cm and 76 cm depths, respectively. Conversely, all the other treatments averaged 3.34 ± 0.35 and 4.02 ± 0.36 mg kg−1 at the aforementioned depths. In 2016, the differences in soil nitrate levels among the treatments were similar for both cultivars, thus only the ‘Emerald’ data is presented. In March and May 2016, the 336N treatment had greater soil nitrate concentrations than the other N rates at all three depths (Table 1).
In July (after harvest when plants were at the vegetative growth stage), there were no significant differences among the treatments at any depth. In September, soil nitrate levels for the 336N treatment were significantly greater than the other treatments at the top two depths. At the 76 cm depth, however, soil nitrate levels were similar for all N treatments in both cultivars, except for a greater concentration in the 168N compared with the 0N treatment for ‘Emerald’. At all the sampling dates and depths where N treatments affected soil nitrate concentration, there was a positive linear or quadratic correlation, which indicated that the higher N rates increased the risk of N leaching.
There were few roots found in soil below the incorporated pine bark layer (i.e., below 20 cm) for either ‘Emerald’ or ‘Farthing’. Williamson and Miller [2] also reported that the roots of three to four-year-old ‘Misty’ and ‘Star’ SHB were shallow and concentrated in the upper 15 cm of soil. The soil nitrate levels of the 336N treatment were higher than those of the other N treatments at 76 cm depths (below the root zone) at the sampling dates in March and May 2016, which indicated a low N requirement in the early season and greater nitrate leaching. Similar results have been reported by Fang et al. [4] in young ‘Emerald’, Banados [3] in young NHB and in mature NHB, and other crops such as peach (Prunus persica L.) [20]. However, after fruit harvest and through fall of 2016 when the plants were in a vigorous vegetative growth stage, soil nitrate levels at 76 cm were similar between the 336N treatment and the other treatments. This similarity may be attributed to the increase in plant N uptake in response to N removed from plants during fruit harvest and N used for vegetative growth. In a container study, young ‘Emerald’ plants exhibited significantly greater N uptake after fruit harvest than during reproductive growth [4]. Banados et al. [5] reported 17% of the total N was removed during fruit harvest in young NHB plants with 50 kg N ha−1. To supplement the N removed through fruit harvest, plants may have absorbed more N from the soil during the postharvest period. This agrees with the results obtained from other fruit crops such as pears (Pyrus communis L.) [21] and nectarines (Prunus persica L.) [22]. Birkhold and Darnell [23] reported that currently assimilated N became the primary N supply for rabbiteye blueberry (V. virgatum Ait.) vegetative growth following fruit harvest. Additionally, there was likely a flush of root growth after berry harvest [4], which increased N uptake in the postharvest period.
Overall, the results from soil nitrate concentration suggested that the annual N application rate can be decreased by reducing N applications in the early season when plants have a lower N requirement.

3.3. Plant Growth

The percentage of ground cover in 2015 indicates that relative plant canopy size was significantly larger in the 336N treatment than in the 0N, 42N, and 84N treatments for both cultivars, but was similar to the 168N treatment (Table 2). In the second year, the percentage of ground cover of the two cultivars responded differently to the N rates. ‘Emerald’ plants with 336N had significantly larger canopies than those with lower N rates. However, the percentage of ground cover of ‘Farthing’ did not differ between the 84N and 336N treatments (Table 2). In both years, a significant linear relationship was found between the N rate and the percentage of ground cover for both cultivars. For ‘Emerald’, the coefficient of determination (R2) increased from 0.45 in 2015 to 0.56 in 2016, suggesting the increased importance of the N rate in determining canopy size. However, for ‘Farthing’, increasing N rates from 84N to 336N did not significantly increase the canopy size in the second season and N rates only explained 37% of the variation in the percentage of ground cover. Bryla and Machado [7] reported that canopy cover increased as N fertigation rates increased from 50 to 150 kg ha−1 in young NHB ‘Bluecrop’. Furthermore, they speculated that the increase would continue at higher N rates. They also pointed out that the plant canopy can reach a maximum at lower N rates when granular N fertilizer with microspray was used, as fertigation tended to reduce N use efficiency especially for young plants with small root systems [7]. Thus, the response of young plants’ percentage of ground cover to N rates depended on cultivars as well as application methods.

3.4. Bloom Time

Visual ratings of bloom indicated that plants fertilized at higher N rates flowered earlier compared with those fertilized at lower N rates. ‘Emerald’ fertilized with 336N reached 95% bloom three to four weeks earlier than those with 0N, 42N, and 84N (Table 3). There was no significant difference in flowering time between 168N and 336N. Although the effects of N rates on bloom of ‘Farthing’ were not as obvious as those of ‘Emerald’, 95% bloom in ‘Farthing’ was advanced by at least one week with 168N and 336N compared with the lower N treatments (Table 3). The advancement in bloom at the greater N rates may be due to the increased accumulation of N reserves at the higher rates compared with the lower N rates and, therefore, the increased allocation of stored N from the previous season to flower buds in those treatments, as described by [24] for peach. ‘Emerald’ started flowering at the end of January, prior to any vegetative budbreak. However, ‘Farthing’ broke vegetative and reproductive buds at approximately the same time, which may have increased competition for stored N and carbohydrate in ‘Farthing’, reducing partitioning to reproductive growth [24], and may explain why increased N had less effect on the advancement of bloom in ‘Farthing’. Regression analyses revealed a linear relationship for bloom time and N rates for both cultivars. However, doubling the rate from 168N to 336N only advanced average bloom time by 1.4 weeks for ‘Emerald’ and 0.6 weeks for ‘Farthing’ and these differences were not significant as determined by pairwise comparison. Thus, the effect of the N rate on advancing bloom decreased as the N rate increased above 168N.

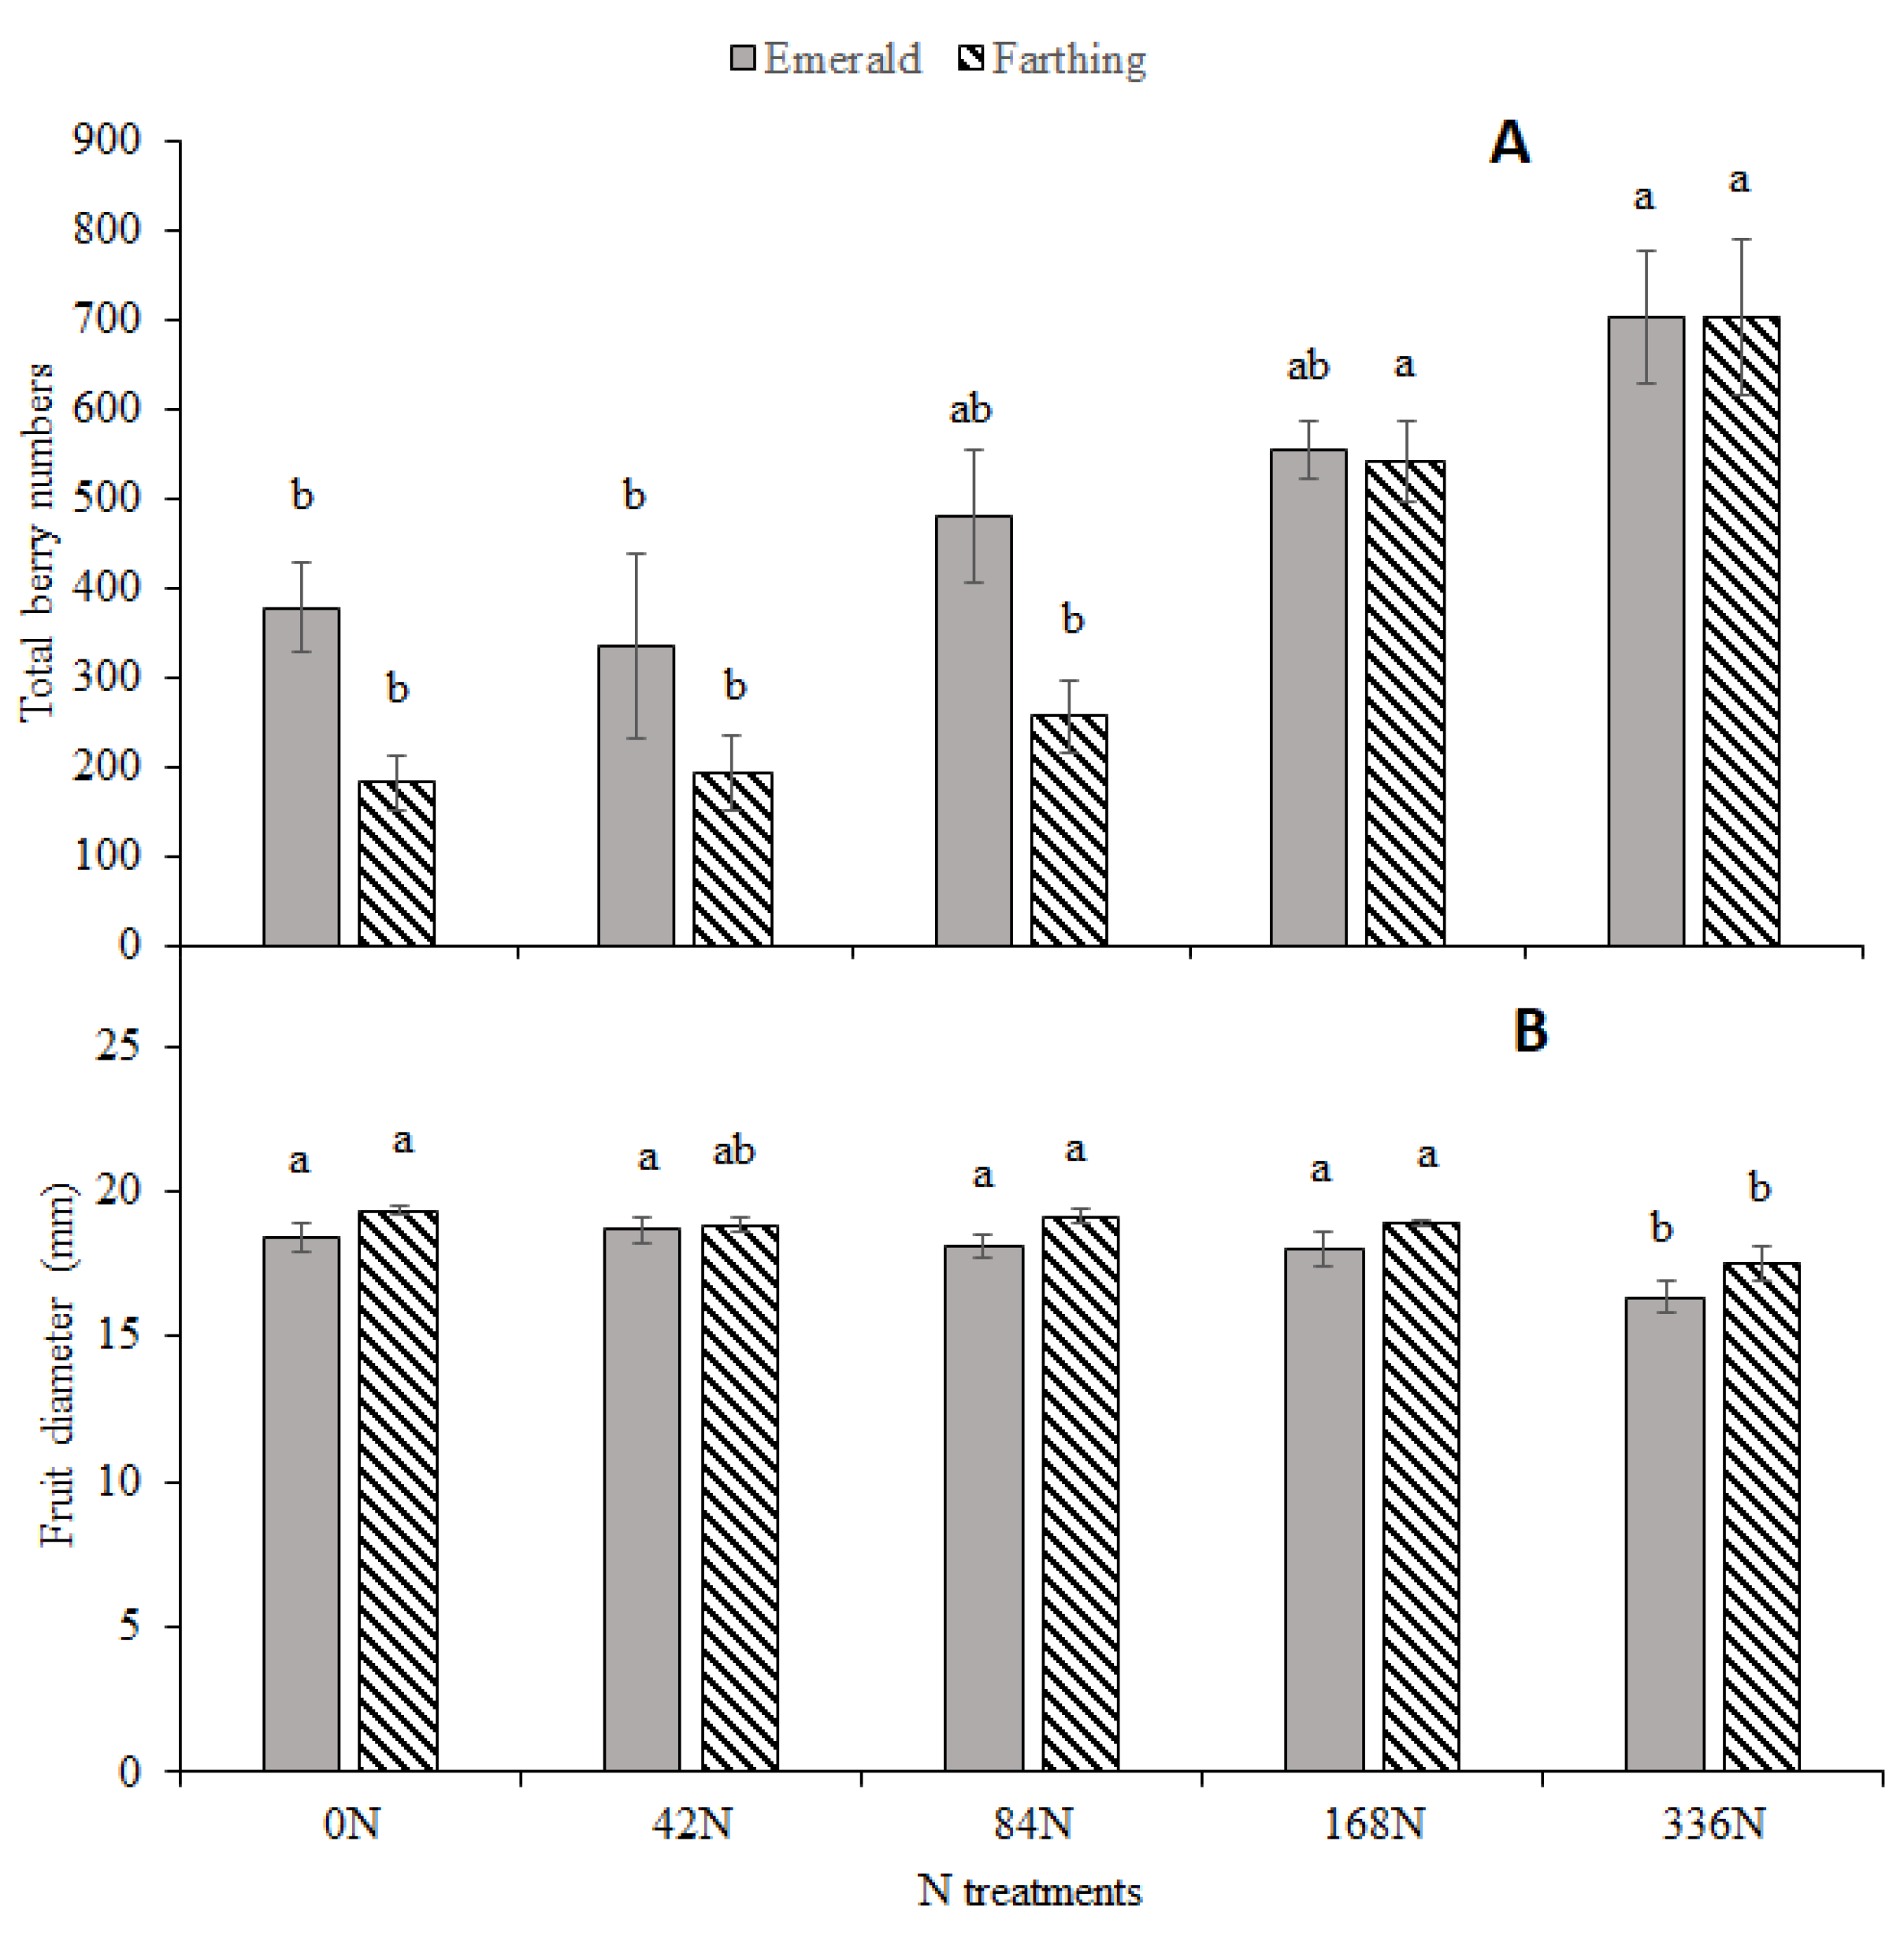
3.5. Fruit Yield, Berry Number, Berry Size

The advancement in bloom at the greater N rates was followed by earlier harvests in both cultivars. ‘Emerald’ plants with 336N reached 50% harvest 3–4 d earlier than those with 168N, and more than 1.5 weeks earlier than those with 84N, 42N, and 0N (Table 4). In the first week, about 20% of ‘Emerald’ fruit was harvested in the 336N treatment, with 5% or less for the other treatments. For ‘Farthing’, the 336N fertilizer rate did not advance fruit harvest compared to 168N treatment (Table 4). However, plants with 336N reached 50% harvest one week earlier than those with 84N, 42N, and 0N. Similarly, plants with 168N advanced to 50% harvest one week earlier than those with 42N and 0N. This advancement of fruit harvest at greater N rates is similar to the results from Wilber and Williamson [25], who reported an advancement in fruit ripening at medium (20.1 g/plant/year) and high N rates (30.0 g/plant/year) compared to low N rates (10.5 g/plant/year) for SHB ‘Misty’, but not for ‘Star’.
The relationships between fruit yield and N rates fit the linear plateau model for both cultivars (Figure 2). The predicted curves showed that yield increased with N rates until N rates reached 221.8 kg ha−1 for ‘Emerald’ and 205.8 for ‘Farthing’ for a maximum yield of 1.40 and 1.46 kg plant−1, respectively. Ehret et al. [26] found that increasing N rates from 0 to 43 kg ha−1 did not increase yield of two-year-old NHB plants. Similarly, in our study, there were no differences in the yield of plants treated with 0N, 42N, or 84N according to the pairwise comparison. However, N rates of 168N and 336N increased yield significantly. Banados et al. [5] found that young NHB had greater yields with 50 than with 0 kg ha−1 N; however, yields decreased as N rate increased to 100 kg ha−1, likely due to salt stress. A notable difference between the two studies was that total N rate in their study was divided into three applications that were broadcast on the soil surface [5], while plants in our study were fertigated with low N concentrations daily.
Additionally, ammonium-N tends to accumulate more in soil or organic mulch under broadcast than fertigation [26], especially in sandy soil and pine bark with a low water-holding capacity. Thus, plants fertigated with 168N or 336N in our study did not shown any symptoms of salt stress but had greater yields.
Williamson and Miller [2] found a significant linear correlation between canopy volume and fruit yield in mature ‘Misty’ and ‘Star’ SHB with R2 value 0.558 and 0.546, respectively. In the present study, the percentage of ground cover at the end of the previous season was significantly correlated with yield as well and explained 40% and 53% of yield variability in ‘Emerald’ and ‘Farthing’, respectively (Figure 3).
Plants fertilized with 336N had almost two times as many berries as those with 0N or 42N for ‘Emerald’, and at least two times as many as those with 0N, 42N, or 84N for ‘Farthing’ (Figure 4A). Plants in the 168N treatment did not have significantly fewer fruit than those in the 336N treatment. There were significant linear correlations between berry numbers and N rates, yield, and the percentage of ground cover for both cultivars (Figure 3). The berry numbers explained 86% and 94% of the yield variability for ‘Emerald’ and ‘Farthing’, respectively.
‘Emerald’ berry weight decreased significantly in the 336N compared with the 42N treatment, averaging 1.95 and 2.37 g, respectively. ‘Farthing’ berry weight was significantly decreased in the 336N (~2.18 g) compared with 0N or 84N treatments (2.63 and 2.58 g, respectively). There were no differences in berry weight among the 0N, 42N, 84N and 168N treatments for either cultivar, which is similar to the results found by Kozinski [27] on ‘Bluecrop’ NHB. The effects on berry diameter were like those on berry weight. Berry diameter was smaller in the 336N than in the other N rates except for ‘Farthing’ at 42N (Figure 4B). There were negative correlations between N rate and berry diameter, and between the number of berries and berry diameter and weight for both cultivars, as well as between N rates and berry weight for ‘Farthing’ (Figure 3). Reduced berry size from the highest N rate may be due to insufficient carbon source supply for the high sink demand from heavy fruit loads [28]. Berry size is the general basis for sale in fresh markets, with larger berries receiving a greater price. Compared to the berries from the 168N treatment, berries from the 336N treatment were about 1.5 mm smaller. Thus, the greatest yield in 336N may not result in the greatest profitability for growers due to the low price of small berries and high cost of picking.

3.6. Fruit Quality

There was no significant difference in ‘Emerald’ berry firmness among the treatments in the early or middle season, averaging 202.2 and 215.9 g mm−1, respectively (data not shown). In the late season, however, ‘Emerald’ fruit were firmer in the 336N treatment (222 g mm−1) compared with the other N rates, which averaged 205.5 g mm−1. ‘Farthing’ fruit were firmer in the 336N compared with the 0N, 84N or 168N treatments in the early and late seasons and firmer than all other N rates in the mid-season (Table 5). Regression analyses indicated positive linear correlations between N rates and berry firmness in the ‘Emerald’ late season and ‘Farthing’ whole season fruit. This is likely because berries from 336N were the smallest throughout the harvest season, and previous work on blueberry [29] and strawberry [30] showed that firmness was negatively correlated with berry size. Although the effects of soil N rates on fruit firmness is cultivar-specific and changed with harvest season, all firmness values were within the acceptable range [31].
There were no significant differences in the ratio of TSS to TTA among the N treatments throughout the season for ‘Emerald’, averaging 12.3, 12.7, and 16.6 for early, mid- and late season, respectively. The seasonal pattern of TSS to TTA ratio in ‘Farthing’ fruit was slightly different (Table 5). In the early season, the ratio was significantly greater for 168N than for 42N. There was a negative quadratic correlation between the N rate and TSS to TTA ratio during this period. There was no effect of N rate on the TSS to TTA ratio in the mid-season, but berries from the 336N treatment in the late season had a significantly greater TSS to TTA ratio than those from the 0N, 42N, and 84N treatments. There was a significant positive linear correlation between N rates and TSS to TTA ratio during the late season. For both cultivars, berries had greater sweetness perception in the late season than in the early and mid-seasons, as indicated by the increased TSS to TAA ratio. This may be attributed to (1) more carbohydrate source from leaf photosynthesis due to more leaves in the late season and (2) the smaller berry size later in the season with a possibly greater concentration of photosynthates. Considerable seasonal and cultivar variations in TSS and TTA were reported in NHB as well [32]. Therefore, the responses of fruit TSS and TTA to soil N concentrations also tended to be cultivar-specific and varied with harvest season [33].

4. Conclusions

Greater N rates advanced bloom and berry harvest dates in the young SHB blueberry. Increasing N rate increased plant canopy size, fruit yield, and the number of berries, but decreased berry size. Plants with 336N had the smallest berries throughout the season. In this study, we did not find effects of N rates on leaf nutrient concentrations. Applying N up to the rate of 336 kg ha−1 showed a greater risk of nitrate leaching, especially during spring. The effect of N rates on fruit quality varied with cultivars and harvest seasons. Based on the linear plateau regression analysis, plants can reach their maximum yields at the annual N rate of 222 kg ha−1 for ‘Emerald’ and 206 kg ha−1 for ‘Farthing’ through fertigation. Thus, under our experimental conditions, the optimum N annual rates with daily fertigation for young ‘Farthing’ and ‘Emerald’ production in Florida appear to be around 200 to 220 kg ha−1. Soil nitrate levels suggest that the N demand for the SHB blueberry may be greater after fruit harvest than during the early to mid-spring. Adjusting N application rates based on plants’ needs and avoiding over-irrigation to reduce nutrient leaching may result in a lower N requirement.

Author Contributions

Conceptualization, J.W. and G.L.; methodology and formal analysis, Y.F., J.W., R.D., G.L. and Y.L.; writing—original draft preparation Y.F. writing—review and editing Y.F., J.W., R.D., G.L. and Y.L.; project administration J.W. and G.L., and funding acquisition; J.W. and G.L. All authors have read and agreed to the published version of the manuscript.

Funding

This study was financially supported by USDA-AMS through 2014 Florida Specialty Crop Block Grant program (Contract number: 00096225).

Acknowledgments

The authors would like to thank Island Grove Ag Products: Nursery Division for providing free blueberry plants and pine bark, Eric Ostmark for his help in managing the trial and James Colee for his assistance in statistical analysis.

Conflicts of Interest

The authors declare no conflict of interest.

References

  1. National Agriculture Statistics and Services (NASS); United Stated Department of Agriculture (USDA). Noncitrus Fruits and Nuts 2018 Summary. Agricultural Statistics Board. 2019. Available online: https://www.nass.usda.gov/Publications/Todays_Reports/reports/ncit0619.pdf (accessed on 18 January 2020).
  2. Williamson, J.G.; Miller, E.P. Effects of fertilizer rate and form on vegetative growth and yield of southern highbush blueberry in pine bark culture. HortTechnology 2009, 19, 152–157. [Google Scholar] [CrossRef] [Green Version]
  3. Banados, M.P. Dry Weight and 15N-Nitrogen and Partitioning, Growth, and Development of Young and Mature Blueberry Plants. Ph.D. Thesis, Oregon State University, Corvallis, OR, USA, 2006. Available online: http://ir.library.oregonstate.edu/xmlui/bitstream/handle/1957/9649/Banados_Maria_P_2006.pdf?sequence=1&origin=publication_detail (accessed on 19 December 2019).
  4. Fang, Y.; Williamson, J.; Darnell, R.; Li, Y.; Liu, G. Nitrogen Uptake and Allocation at Different Growth Stages of Young Southern Highbush Blueberry Plants. HortScience 2017, 52, 905–909. [Google Scholar] [CrossRef] [Green Version]
  5. Banados, M.P.; Strik, B.C.; Bryla, D.R.; Righetti, T.L. Response of highbush blueberry to nitrogen fertilizer during field establishment, I: Accumulation and allocation of fertilizer nitrogen and biomass. HortScience 2012, 47, 648–655. [Google Scholar] [CrossRef]
  6. White, L.D. The Effect of Pre-Plant Incorporation with Sawdust, Sawdust Mulch, and Nitrogen Fertilizer Rate on Soil Properties and Nitrogen Uptake and Growth of ‘Elliott’ Highbush Blueberry. Master’s Thesis, Oregon State University, Corvallis, OR, USA, 2006. Available online: http://ir.library.oregonstate.edu/xmlui/bitstream/handle/1957/1363/WholeThesis.pdf?sequence=1 (accessed on 19 December 2019).
  7. Bryla, D.R.; Machado, R.M. Comparative effects of nitrogen fertigation and granular fertilizer application on growth and availability of soil nitrogen during establishment of highbush blueberry. Front. Plant Sci. 2011, 2, 1–8. [Google Scholar] [CrossRef] [PubMed] [Green Version]
  8. Bryla, D.R.; Strik, B.C. Nutrient requirements, leaf tissue standards, and new options for fertigation of northern highbush blueberry. HortTechnology 2015, 25, 464–470. [Google Scholar] [CrossRef] [Green Version]
  9. Hanson, E.J. Nitrogen fertilization of highbush blueberry. In Proceedings of the VIII International Symposium on Vaccinium Culture, ISHS Acta Horticulturae 715, 347–352, Sevilla, Spain, 31 August 2006. [Google Scholar]
  10. Thomas, B.P.; Law, L.; Stankey, D.L. Soil survey of Marion County Area, Florida. USDA/Natural Resources Conservation Service. 1979. Available online: https://www.nrcs.usda.gov/Internet/FSE_MANUSCRIPTS/florida/FL608/0/Marion.pdf (accessed on 10 March 2020).
  11. Krewer, G.W.; Ruter, J.M. Fertilizing Highbush Blueberries in Pine Bark Beds. 2009. Available online: http://athenaeum.libs.uga.edu/bitstream/handle/10724/12290/B1291.pdf?sequence=1 (accessed on 19 December 2019).
  12. Campillo, C.; Prieto, M.H.; Daza, C.; Monino, M.J.; Garcia, M.I. Using digital images to characterize canopy coverage and light interception in a processing tomato crop. Hortscience 2008, 43, 1780–1786. [Google Scholar] [CrossRef]
  13. RStudio Team. RStudio: Integrated Development for R; RStudio, Inc.: Boston, MA, USA, 2016; Available online: http://www.rstudio.com/ (accessed on 19 December 2019).
  14. Hochmuth, G.; Hanlon, E.; Overman, A. Fertilizer Experimentation, Data Analyses, and Interpretation for Developing Fertilization Recommendations-Examples with Vegetable Crop Research; University of Florida Institution of Food and Agriculture Science: Gainesville, FL, USA, 2011; Available online: https://edis.ifas.ufl.edu/ss548 (accessed on 19 December 2019).
  15. Mills, A.H.; Jones, J.B. Plant Analysis Handbook II: A Practical Sampling, Preparation, Analysis and Interpretation Guide; Micro-Macro: Athens, GA, USA, 1996. [Google Scholar]
  16. Ballinger, W.E.; Kenworthy, A.L.; Bell, H.K.; Benne, E.J.; Bass, S.T. Relationship between nutrient element content of blueberry foliage and fruit. Mich. State Univ. Q. Bull. 1958, 40, 906–911. [Google Scholar]
  17. Bryla, D.R.; Strik, B.C.; Banados, M.P.; Righetti, T.L. Response of highbush blueberry to nitrogen fertilizer during field establishment—II. Plant nutrient requirements in relation to nitrogen fertilizer supply. HortScience 2012, 47, 917–926. [Google Scholar] [CrossRef]
  18. Cummings, G.A. Plant and soil effects of fertilizer and lime applied to highbush blueberries. J. Am. Soc. Hortic. Sci. 1987, 103, 302–305. [Google Scholar]
  19. Cummings, G.; Bickford, C.; Nelson, L. Fertilizer and lime rates influence highbush blueberry growth and foliar elemental content during establishment. J. Am. Soc. Hortic. Sci. 1971, 96, 184–186. [Google Scholar]
  20. Nario, A.; Pino, I.; Zapata, F.; Albornoz, M.P.; Baherle, P. Nitrogen (15N) fertilizer use efficiency in peach (Prunus persica L.) cv. Goldencrest trees in Chile. Sci. Hortic. 2003, 97, 279–287. [Google Scholar] [CrossRef]
  21. Tagliavini, M.; Quartieri, M.; Millard, P. Remobilised nitrogen and root uptake of nitrate for spring leaf growth, flowers and developing fruits of pear (Pyrus communis L.) trees. Plant Soil 1997, 195, 137–142. [Google Scholar] [CrossRef]
  22. Tagliavini, M.; Millard, P.; Quartieri, M. Storage of foliar-absorbed nitrogen and remobilization for spring growth in young nectarine (Prunus persica var. nectarina) trees. Tree Physiol. 1998, 18, 203–207. [Google Scholar] [CrossRef] [PubMed] [Green Version]
  23. Birkhold, K.T.; Darnell, R.L. Contribution of storage and currently assimilated nitrogen to vegetative and reproductive growth of rabbiteye blueberry. J. Am. Soc. Hortic. Sci. 1993, 118, 101–108. [Google Scholar] [CrossRef] [Green Version]
  24. George, A.P.; Nissen, R.J. Effects of water stress, nitrogen and paclobutrazol on flowering, yield and fruit quality of the low-chill peach cultivar, ‘Flordaprince’. Sci. Hortic. 1992, 49, 197–209. [Google Scholar] [CrossRef]
  25. Wilber, W.L.; Williamson, J.G. Effects of fertilizer rate on growth and fruiting of containerized southern highbush blueberry. HortScience 2008, 43, 143–145. [Google Scholar] [CrossRef] [Green Version]
  26. Ehret, D.L.; Frey, B.; Forge, T.; Helmer, T.; Bryla, D.R.; Zebarth, B.J. Effects of nitrogen rate and application method on early production and fruit quality in highbush blueberry. Can. J. Plant Sci. 2014, 94, 1165–1179. [Google Scholar] [CrossRef]
  27. Kozinski, B. Influence of mulching and nitrogen fertilization rate on growth and yield of highbush blueberry. In Proceedings of the VIII International Symposium on Vaccinium Culture; Acta Horticulturae; ISHS: Leuven, Belgium, 2006; Volume 715, pp. 231–236. [Google Scholar]
  28. Maust, B.E.; Williamson, J.G.; Darnell, R.L. Flower bud density affects vegetative and fruit development in field-grown southern highbush blueberry. HortScience 1999, 34, 607–610. [Google Scholar] [CrossRef] [Green Version]
  29. Casamali, B.; Darnell, R.L.; Kovaleski, A.P.; Olmstead, J.W.; Williamson, J.G. Vegetative and Reproductive Traits of Two Southern Highbush Blueberry Cultivars Grafted onto Vaccinium arboreum Rootstocks. HortScience 2016, 51, 880–886. [Google Scholar] [CrossRef] [Green Version]
  30. Ourecky, D.K.; Bourne, M.C. Measurement of strawberry texture with an Instron machine. Proc. Am. Soc. Hort. Sci. 1968, 93, 317–325. [Google Scholar]
  31. Ehlenfeldt, M.K.; Martin, R.B. A survey of fruit firmness in highbush blueberry and species-introgressed blueberry cultivars. HortScience 2002, 37, 386–389. [Google Scholar] [CrossRef] [Green Version]
  32. Skupień, K. Chemical composition of selected cultivars of highbush blueberry fruit (Vaccinium corymbosum L.). Folia Hortic. 2006, 18, 47–56. [Google Scholar]
  33. Beckles, D.M. Factors affecting the postharvest soluble solids and sugar content of tomato (Solanum lycopersicum L.) fruit. Postharvest Biol. Technol. 2012, 63, 129–140. [Google Scholar] [CrossRef]
Figure 1. Effect of nitrogen fertigation rate on leaf N concentrations of young ‘Emerald’ (A) and ‘Farthing’ (B) blueberry plants in 2015 and 2016. Columns indicate means of five replicates and bars represent ± 1 std. error. There were no significant differences among the treatments on each sampling date according to Tukey’s honestly significant difference test (p > 0.05).
Agronomy 10 00389 g001
Figure 2. The linear-plateau model regression between N rates and yield (g/plant). Cultivar ‘Emerald’: yield (g/plant) = 724.944 + 3.021Nrate for Nrate ≤ 221.84 kg/ha, and Yield = 1395.13 g/plant for Nrate > 221.84 kg/ha. Cultivar ‘Farthing’: yield (g/plant) = 339.52 + 5.43Nrate for Nrate ≤ 205.83 kg/ha, and Yield = 1456.39 g/plant for Nrate > 205.83 kg/ha.
Agronomy 10 00389 g002
Figure 3. Correlations among N rate, berry number, berry weight, berry diameter, yield, and ground cover percent for ‘Emerald’ (A) and ‘Farthing’ (B). The numbers are the correlation coefficient (R) between variables. The ground cover percent data are from the first year (2015) and the yield data (2016) are from the second year when the first harvest occurred. Asterisks (*) indicates the correlation is significant at * p ≤ 0.05, ** 0.01, or *** 0.001.
Agronomy 10 00389 g003
Figure 4. Effect of nitrogen fertigation rate on total berry numbers (A) and fruit diameter (B) of young ‘Emerald’ and ‘Farthing’ blueberry plants in 2016. Columns indicate means of five replicates and bars represent ± 1 std. error. Means with the same letter are no different among N treatments according to Tukey’s honestly significant difference test (p > 0.05).
Agronomy 10 00389 g004
Table 1. Effect of nitrogen fertigation rate on soil nitrate level of young ‘Emerald’ plants in 2016.
Soil Nitrate (mg kg−1)
N (kg/ha/year)23 March17 May18 July15 September
15 cm z
01.19 b y2.19 c3.101.86 b
421.94 b2.05 c4.580.81 b
841.64 b1.92 c2.842.58 b
1683.30 b8.31 b7.967.99 b
3366.60 a13.62 a2.7934.06 a
Significance xL ***L ***NSL ***
r-value w0.850.920.88
30 cm
01.23 b2.30 b1.591.09 b
421.70 b2.64 b4.010.40 b
841.12 b2.89 b1.771.97 b
1682.17 b7.28 b6.624.49 b
3365.40 a17.51 a2.0823.63 a
SignificanceL ***L ***NSL ***
r-value0.790.880.80
76 cm
00.75 b1.91 b1.220.40 b
420.73 b2.41 b1.511.55 ab
840.85 b1.92 b3.871.26 ab
1681.43 b2.64 b5.793.86 a
3364.31 a7.49 a0.853.72 ab
SignificanceL ***L ***NSL **
r-value0.810.760.59
z Depth of sample from the soil surface. y Means followed by the same letter, within the soil sampling date and soil depth, are not different at α ≤ 0.05 according to Tukey’s honestly significant difference test. x NS, **, *** Nonsignificant or significant at P< 0.01, or 0.001, respectively. Linear response (L) for nitrogen rate at ** or ***. w R value: coefficient of correlation.
Table 2. Effect of nitrogen fertigation rate on percentage of ground cover after the cessation of canopy growth of young ‘Emerald’ and ‘Farthing’ plants in 2015 and 2016.
N (kg/ha/yr)‘Emerald’ Ground Cover (%)‘Farthing’ Ground Cover (%)
2015201620152016
014.38 b z57.25 b9.03 b60.39 b
4211.91 b58.88 b8.97 b60.82 b
8413.90 b70.06 b8.00 b77.21 ab
16819.65 ab70.42 b16.44 a83.36 ab
33623.13 a93.85 a17.36 a87.1 a
Significance yL ***L ***L ***L ***
R value x0.690.760.750.63
z Means followed by the same letter, within each year and cultivar, are not different at α ≤ 0.05 by Tukey’s honestly significant difference test. y *** Significant at p < 0.001. Linear response (L) for nitrogen rate at ***. x R value: coefficient of correlation.
Table 3. Effect of nitrogen fertigation rate on the time of 95% bloom in young ‘Emerald’ and ‘Farthing’ blueberry plants.
Weeks z
N (kg/ha/yr)EmeraldFarthing
08.70 a y10.50 a
428.50 a10.20 ab
847.20 ab10.50 a
1685.60 bc9.60 bc
3364.20 c9.00 c
Significance xL ***L ***
R value w−0.89−0.8
z Week counting started from 26 January 2016. y Means followed by the same letter, within cultivar, are not different at α ≤ 0.05 by Tukey’s honestly significant difference test. x *** Significant at p < 0.001. Linear response (L) for nitrogen rate at ***. w R value: coefficient of correlation.
Table 4. Effect of nitrogen fertigation rate on the time of harvest in young ‘Emerald’ and ‘Farthing’ blueberry plants in 2016.
Cumulative Percentage of Yield (%)
N (kg/ha/yr)Week 16 zWeek 17Week 18Week 19Week 20Week 21Week 22Week 23Week 24Week 25
‘Emerald’
0-0.40 b y5.04 c23.80 b51.15 b80.07 b93.86100--
42-0.62 b8.16 c30.02 b59.60 b83.99 ab92.91100--
84-1.85 b13.37 c39.21 b67.45 ab87.42 ab95.25100--
168-5.04 b31.43 b60.17 a82.84 a95.47 a97.62100--
336-21.53 a49.49 a72.09 a87.15 a95.57 a98.15100--
‘Farthing’
01.01 b1.84 b6.02 b15.95 b40.39 c68.85 c86.67 b93.37 b96.36 ab100
421.56 b2.21 b6.89 b17.04 b42.81 c71.75 bc85.67 b92.85 b95.62 b100
840.91 b1.96 b8.77 b21.25 b47.76 bc73.38 bc89.29 b94.59 ab97.60 ab100
1682.79 ab4.44 ab13.72 b25.62 ab55.29 ab80.39 ab92.83 a96.82 ab98.31 ab100
3364.98 a8.21 a24.28 a36.64 a63.80 a83.75 a94.28 a97.76 a98.84 a100
z Julian week. y Means followed by the same letter, within the week and cultivar, are not different at α ≤ 0.05 by Tukey’s honestly significant difference test.
Table 5. Effect of nitrogen fertilizer rate on fruit firmness and total soluble solids to titratable acidity ratio of young ‘Farthing’ blueberry plants in 2016.
Fruit Firmness (g/mm)Total Soluble Solids to Titratable Acidity Ratio
N (kg/ha/yr)2-May9-May16-May9-May16-May23-May
0N254.0 b239.2 b229.2 b11.51ab z14.1115.63 bc
42N263.3 ab247.6 b231.5 ab10.33 b11.9514.70 c
84N251.4 b239.4 b225.0 b12.11 ab14.5216.10 bc
168N253.4 b239.0 b219.4 b13.97 a14.6419.71 ab
336N272.2 a271.2 a248.5 a12.00 ab12.8421.98 a
Significance yL *L ***L *Q *NSL ***
R value x0.40.650.4−0.530.8
z Means followed by the same letter, within sampling date and cultivar, are not different at α ≤ 0.05 by Tukey’s honestly significant difference test. y NS, *, *** Nonsignificant or significant at p < 0.05 or 0.001, respectively. Quadratic response (Q), linear response (L) for nitrogen rate at * or ***. x R value: coefficient of correlation.

