Article

The Combined Effect of Drought Stress and Nitrogen Fertilization on Soybean

Institute of Crop Sciences, University of Debrecen, 4032 Debrecen, Hungary
*
Author to whom correspondence should be addressed.
Agronomy 2020, 10(3), 384; https://doi.org/10.3390/agronomy10030384
Submission received: 24 January 2020 / Revised: 23 February 2020 / Accepted: 9 March 2020 / Published: 11 March 2020

Abstract

:
Soybean is one of the most important crops worldwide; however, its production and produced seed quality are challenged by the increasingly reported drought waves because of its relative susceptibility to drought stress conditions. Nitrogen (N) is a major macronutrient that has distinctive influence on soybean, especially if applied in correct rates. Moreover, N has an additive importance under drought stress conditions. An experiment was carried out in Debrecen, Hungary in 2017, 2018, and 2019 to investigate the sole and the combined effects of N application under different irrigation regimes on soybean physiology, yield, and its components in addition to the quality of the produced yield. Results showed that the morpho-physiological traits, in addition to the yield component traits were influenced by both fertilization rates and irrigation regimes. Most importantly, high N rate is not recommended with the absence of drought conditions as, compared to low rate, it decreased flower and pod number per plant, plant height, and seed yield. On the other hand, high N rate enhanced most traits under drought stress conditions. 100-seed weight had the highest correlation with yield, followed by flower and pod number per plant, plant height, and Normalized Difference Vegetation Index (NDVI).

1. Introduction

Soybean has the highest average area harvested among all legumes [1]. Soybean is reported to be sensitive to several abiotic stresses as compared to other legumes and crops [2,3,4]. A major abiotic stress, affecting soybean production and quality is drought stress [5,6], and with the fact that the intensity of drought stress conditions was increasingly noticed and recorded among the past few decades [7], understanding the influence of drought stress on crops became vital, as such understanding can be exploited in irrigation-scheduling which, in part reduces drought-related fluctuations in food production [8].
Crop-drought susceptibility differs from a stage to another during the crop’s life cycle [9,10]. This conclusion was reported on soybean [11,12]. Moreover, it was reported that soybean plants have low water demands at vegetative stages, whereas these demands increase during reproductive stages [13]. As such, early drought, during vegetative stages, might not affect soybean final seed yield [14,15,16]; moreover, it was reported that even at early reproductive stages (particularly flowering stages) it did not measurably affect yield, whereas drought during pod filling stages significantly decreased the yield [17]. However, Lozovaya et al. [18] reported that relative drought stress during seed formation (R6) stage enhanced the seeds’ quality by increasing many isoflavones; however, seed formation was affected. Yield reduction is correlated with both flower and pod abortion as a consequence of drought conditions [6]. Moreover, soybean plants subjected to drought at vegetative stages had less leaf area, less photosynthesis rate, and less biomass; however, it was possible for the stressed plants to partially recover during post-stress period. On the other hand, drought occurred later during reproductive stages resulted in higher flower-abortion rate and reduced developed pods and seeds, with less opportunity to recover, resulting in noticeable yield loss [19,20].
Desclaux and Roumet [21] reported that soybean morphology was significantly influenced by drought, especially during reproductive stages. For example, Freitas et al. [22] reported that plant height of soybean plants was affected by drought. Both yield and seed quality of soybean are significantly influenced by drought stress conditions [23]. In addition, chlorophyll production was reported to be influenced by drought stress [24].
Not only the stage, but also both the duration of the drought occurrence and the genotype have a role in the damage level [25,26]. For example, it was reported that drought stress has different effects on different soybean cultivars in the study area, as yield, protein, and oil concentrations of certain cultivars were measurably reduced by drought but were increased in other cultivars [27]. The authors attributed these different results to the different potentials of each cultivar for coping with drought stress, in addition to the timing when plants suffered from stress.
Nitrogen (N) is one of the most important macronutrients for plant growth and yield; it is essential for total chlorophyll content and protein synthesis. Because of its high protein concentration in the seeds (40%, on average), soybean plants have high N requirements [28]. In addition, N is essentially needed for soybean’s vegetative growth in order to produce optimum biomass [29]. N deficiency causes N from leaves to be remobilized to the seeds, which in part will lead to decreased photosynthesis and eventually reduced yield [30]. Wani et al. [31] reported that relatively small N rates resulted in significant responses from grain legumes. N fertilizer was reported to especially be important under abiotic stresses [32]. However, the prices of N-fertilizers were increased as a result of the increased cost of the energy required for manufacturing. In addition, nitrous oxide, a greenhouse gas that contaminates water with nitrate, is formed from N-fertilizers [33]. Therefore, minimizing chemical N-fertilizers seems to be crucial, especially with the fact that N2-fixed nitrogen, in the case of legumes, is a cheaper source with no similar environmental effects.
As a newly entered crop in the study area, no published work on the sole response of soybean plants to different levels of drought stress and to different rates of N-fertilizer on the physio-morphological level, nor on the quantitative and/or qualitative traits was found. This research aims at evaluating the sole and combined influence of drought stress and nitrogen-fertilizer application on soybean (Glycine max (L.) Merrill. cv. Pannonia Kincse).

2. Materials and Methods

A field experiment was carried out in the experimental station of the University of Debrecen (Látókép) (N. latitude 47°33′, E. longitude 21°27′) on soybean (cv. Pannonia Kincse, Bonefarm, Hungary) during 2017, 2018, and 2019 growing seasons. Soil type of the site is calcareous chernozem. Before sowing in 2017, soil samples were collected from two depths; 0–25 cm and 25–50 cm, and the following data of soil components were provided by the chemical analysis (averaged over the two depths); pH: 6.41, OM: 2.46%, N: 3.97 ppm, P2O5: 90.7 ppm, K2O: 206.7 ppm. Sowing dates were 23 April in 2017 and 26 April in 2018 and 2019, and harvest dates were 15 September in 2017 and 16 September in 2018 and 2019.
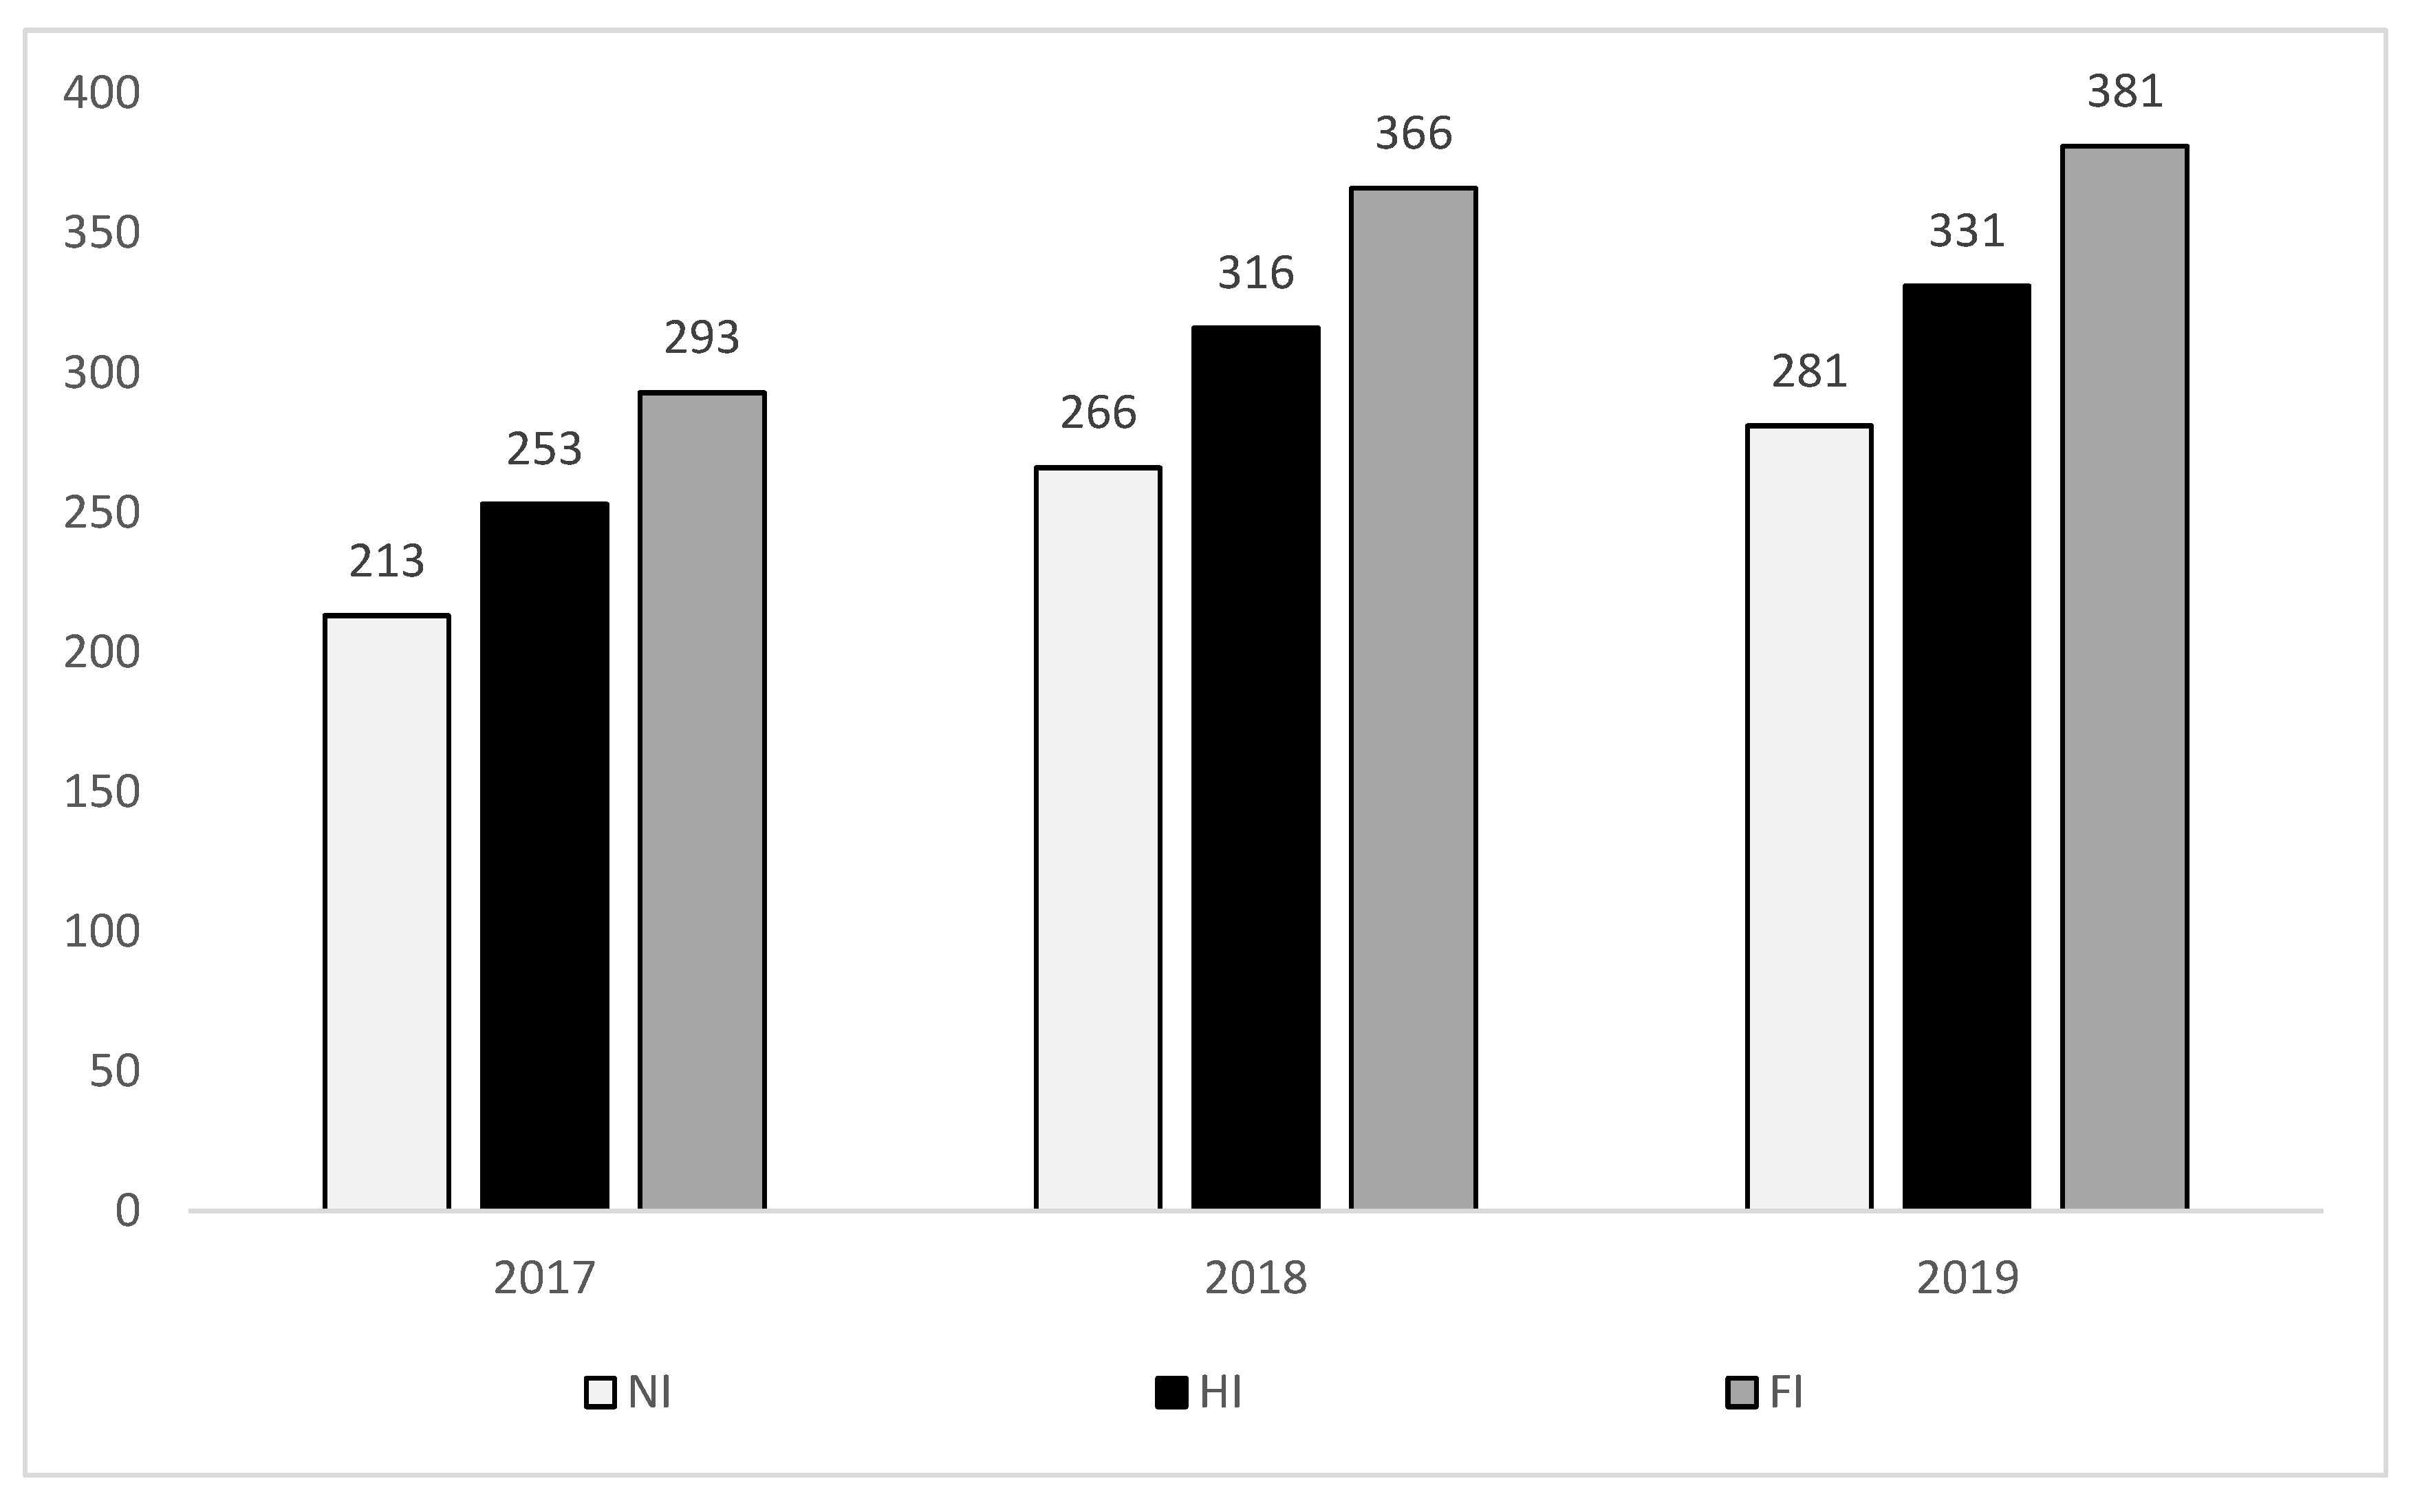
The experimental design was split-plot design, with three irrigation regimes; non-irrigated, half-irrigated, and fully irrigated (NI, HI, and FI, respectively) being the main plots, and three N-fertilizer (NH4NO3) rates (applied with sowing as a single application); 0, 35, and 105 kg ha−1 N (0N, 35N and 105N, respectively) being the sub-plots with four replicates each. NI treatment received only precipitation as water irrigation amount, whereas HI treatment received, in addition to precipitation, a total of 40 mm of irrigation water in 2017 and 50 mm in 2018 and 2019. FI treatment, on the other hand, received, in addition to precipitation, a total of 80 mm of irrigation water in 2017 and 100 mm in 2018 and 2019 (Figure 1). Based on the daily monitoring of precipitation and temperature, field capacity (FC) was regularly tested in all plots, and irrigation was applied in HI and FI treatments whenever soil water content reached 65–70% FC. FC of NI treatment reached a minimum value of 30% in 2018 and 35% in 2017 and 2019.
Final plot number was 36 (3 irrigation regime × 3 fertilization rates × 4 replications). The plot area was 49.68 m² with 12 rows in each plot.
LAI (leaf area index) values were recorded using SS1–SunScan canopy analysis system (Delta-T Devices, Cambridge, UK). Relative chlorophyll content (in the form of SPAD) (soil plant analysis development) was measured using SPAD-502Plus (Konica Minolta, Tokyo, Japan). NDVI (Normalized Difference Vegetation Index) values were recorded using Trimble Greenseeker Handheld (AS Communications Ltd., Cambridgeshire, UK). Ten randomly selected plants from the middle rows of each plot were used for the mentioned traits, and three measurements from the second most developed trifoliate (one measurement for each leaflet) were taken and then averaged. All traits were measured at four different stages of soybean’s life cycle [34]; fourth node (V4), full bloom (R2), full pod (R4), and full seed (R6).
Flower number per plant was counted at R2 stage. Pod number per plant was counted at R4 stage. Plant height was measured at R6 stage using a standard ruler. Ten randomly selected plants from the middle rows of each plot were used for the mentioned traits.
Seed yield was calculated by harvesting the middle 4 m of each plot and adjusting the yield to 13% moisture content. Hundred-seed weight was calculated after oven-drying the seeds at 65 °C until constant weight. Both protein and oil concentrations were determined using NIR analyser Granolyser (Pfeuffer, Kitzingen, Germany).
SPSS software was run to analyze and compare the means (ANOVA) and to indicate the effect size (by means of Partial Eta Squared), followed by Tukey post-hoc test to indicate the statistically different means, and Pearson’s correlation to indicate correlation coefficient (IBM SPSS ver.26, USA software). All data presented and analyzed are means of the three years of experiment.

3. Results

3.1. SPAD

Except for an insignificant decrease in 105N treatment compared to 35N counterpart, increasing fertilization rate was accompanied by increases in SPAD values in all fertilization treatments; the increase was significant in 105N treatment at both V4 and R6 stages as compared to 0N counterparts. However, no measurable changes were estimated when fertilization rate was increased from 35 to 105 kg ha−1. On average, 35N and 105N resulted in 1.4 and 2.4% increase in SPAD values, respectively compared to 0N counterpart (Table 1). Fertilization was positively correlated with SPAD trait at all stages, but more obviously at V4 and R6 stages where the correlation was significant (Table 2).
Regardless of the fertilization treatment, SPAD values increased when the plants reached early reproductive stage (R2), then a relatively slight decrease was recorded at R4 stage, followed by rapid increase at R6 stage (Table 1).
Drought at both vegetative (V4) and early reproductive (R2 and R4) stages enhanced SPAD trait; however, drought resulted in significantly less SPAD values at late reproductive stage (R6) (Table 3).
Under all irrigation regimes, SPAD values increased along with plants’ life stage development (except for a reduction at R4 stage under fully irrigated system) (Table 3). The correlation coefficient, with irrigation treatments, was negative at both V4 and R4 stages, but positive at both R2 and R6 stages (Table 4).

3.2. NDVI

Fertilization relatively enhanced NDVI values at all studied stages. On average, NDVI was 0.5% and 1.2% higher in 35N and 105N treatments, respectively, compared to 0N treatment (Table 5). NDVI was positively correlated with fertilization treatments at all stages, being significant only at V4 stage (Table 2).
Regardless of fertilization treatment, NDVI was measurably increased when plants entered early reproductive stage (R2), followed by gradual, slight reductions at the next reproductive stages (Table 5).
At both V4 and R2 stages, drought enhanced NDVI values, whereas it resulted in lower NDVI values at the later stages (R4 and R6). Fully irrigated regime could increase NDVI values while plants were developing from stage to stage, whereas NDVI peaked at R2 stage under both non-and half-irrigated regimes and started degrading after that stage (Table 6). Correlation with irrigation was negative at the first-two studied stages (V4 and R2), but positive at the later stages (R4 and R6) (Table 4).

3.3. LAI

Compared to 0N counterpart, 105N treatment significantly increased LAI value at all stages except the late reproductive stage R6 where the LAI values were very close in all fertilization treatments. LAI values rapidly increased with plants’ life cycle development, peaking at R4 stage, followed by reducing LAI values in all fertilization treatments (Table 7). In all fertilization treatments, the correlation coefficient decreased with the development of plants through stages, being significant and positive at all stages except for the late R6 stage (Table 2).
Drought significantly positively affected LAI at V4 stage; however, it resulted in reducing LAI values at all reproductive stages, especially at R4 stage where the reduction was significant. Regardless of the irrigation regime, gradual enhancements in LAI values with plants’ development were recorded until the peak at R4 stage, where LAI started degrading later (Table 8). The correlation coefficient gradually increased from stage to another until R4 stage; after that it started decreasing with staying positive (Table 4).

3.4. Plant Height

Both irrigation and fertilization, in addition to their interaction had no significant effect on this trait. However, slightly positive correlation coefficient was estimated with both irrigation and fertilization (Table 9 and Table 10).
Regardless of the irrigation regime, increasing fertilization rate was accompanied by enhancement in plant height; 35N and 105N treatments resulted in 2.4% and 3.9% taller plants, respectively (averaged among all three irrigation regimes) (Table 11).
Plant height was positively affected by irrigation; however, the ratios of enhancement differed between half- and fully irrigated regimes. Half-irrigated regimes resulted in 2.8%, 4.6%, and 5.1% taller plants, whereas fully irrigated regime resulted in 4.7%, 7.1%, and 5.3% taller plants in 0N, 35N, and 105N treatments, respectively. Moreover, the difference was significant in both 35N and 105N treatments under fully irrigated regime as compared to non-irrigated counterparts but only for 105N treatment under half-irrigated regime (Table 11).

3.5. Flower Number per Plant

The effect of both irrigation and fertilization, in addition to their interaction, on this trait was significant. This trait was significantly correlated with fertilization and highly significantly correlated with irrigation (Table 9 and Table 10).
Under all irrigation regimes, increasing fertilization rate resulted in higher flower number per plant (except 105N under fully irrigated regime as compared to 35N counterpart). On average, 35N treatment enhanced this trait by 6.5% compared to 0N, and 105N had a slight, additional enhancement by 1.4% (Table 12). The effect size of fertilization on this trait was estimated as 9.3%.
Half-irrigated regime significantly increased flower number per plant in all fertilization treatments compared to non-irrigated counterparts; the average increase was 18.1%. However, further water irrigation amounts (fully irrigated regime) did not further enhance this trait except in 35N treatment, yet average increase, compared to non-irrigated counterpart, was 16.7% (Table 12). Irrigation explained 34.2% of differences in flower number per plant.

3.6. Pod Number per Plant

The sole effect of irrigation and fertilization, in addition to their interaction, on pod number per plant were highly significant. Moreover, highly significant correlation coefficient was estimated for this trait with both fertilization and irrigation (Table 9 and Table 10).
Fertilization influence was very similar to flower number per plant trait (Table 13), and 15.8% of changes in this trait were explained by fertilization effect.
Similar trend was recorded in this trait under the different irrigation regimes as flower number per plant trait; the average increase was 21.2% and 14.4% in half- and fully irrigated regimes, respectively compared to non-irrigated counterpart (Table 13). Total of 47.3% of changes in this trait were caused by irrigation.

3.7. 100-Seed Weight

Only fertilization had a highly significant effect on this trait. Moreover, the correlation with fertilization was highly significant, whereas no correlation with irrigation could be estimated (Table 9 and Table 10).
Fertilization enhanced the 100-seed weight, regardless of irrigation regime. The average enhancement was 10.6% and 11.2% in 35N and 105N, respectively compared to 0N counterpart (Table 14).
Both half- and fully irrigated regimes could enhance this trait, compared to non-irrigated counterpart, in both 0N and 35N treatments, but not 105N (Table 14).

3.8. Yield

Yield correlation with irrigation and, to a higher extent, with fertilization was positive (Table 9 and Table 10).
Fertilization increased the yield under all three irrigation regimes, again except 105N treatment under fully irrigated regime, introducing a conclusion that moderate fertilization is an advisable practice under all irrigation regimes, whereas high rates of N are only recommended under relative drought conditions. On average, 35N treatment resulted in a 6.3% increase, whereas 105N had 6.9% higher yield as compared to non-fertilized (0N) counterpart (Table 15).
Although it was not statistically significant, yet irrigation could enhance the yield under all fertilization rates except for fully irrigated treatment in 105N rate where a reduction in the yield was recorded compared to non-and half-irrigated counterparts. Averaged among the three fertilization rates, half-irrigation regime increased the yield by 4.6%, whereas fully irrigated regime had increased it by 5.6% compared to non-irrigated counterpart (Table 15).
100-seed weight, pod number per plant, flower number per plant, NDVI, fertilization, and irrigation were positively correlated with the final seed yield, whereas yield was negatively correlated with protein concentration, SPAD, LAI, and oil concentration (Table 16).

3.9. Protein Concentration

Both irrigation and fertilization had significant effects on protein concentration. Moreover, the correlation between this trait and the fertilization rate was highly significant, and the correlation with irrigation regimes was significant as well (Table 9 and Table 10).
Fertilization, regardless of irrigation regime, could enhance protein concentration only when applied in a high rate (105N). Protein concentration was 1.9% and 1.1% higher in 105N treatment in half- and fully irrigated, respectively; moreover, it was significantly higher (by 7.3%) under non-irrigated regime, and this high fertilization rate, under non-irrigated regime, resulted in the best protein concentration compared to all other N rates and irrigation regimes (Table 17; Figure 2), which implies the importance of N application in relatively high rates under drought stress conditions as it could alleviate the effect of drought in reducing protein concentration recorded in both 0N and 35N treatments, and even resulting in the highest protein concentration. The effect size (calculated as partial Eta squared) of fertilization (28.4%) was higher than that of irrigation (15.4%); i.e., 28.4% of the differences among protein concentration values can be explained by the changes in fertilization rates, whereas 15.4% can be explained by different irrigation regimes.
Irrigation increased protein concentration in both 0N and 35N; moreover, the increase in fully irrigated treatment (by 5.3 and 4.5% in 0N and 35N, respectively) was significant compared to non-irrigated counterpart. On the other hand, non-irrigated treatment resulted in relatively higher protein concentration in 105N treatment as compared to the other two irrigation regimes. (Table 17; Figure 2).

3.10. Oil Concentration

Oil concentration was only highly significantly affected (p < 0.01) by irrigation. However, the correlation coefficient was negative in relation with fertilization, and to a higher level, with irrigation (Table 9 and Table 10); i.e., increasing fertilization or irrigation water amount resulted, in most cases, in reducing oil concentration, which can be confirmed by the values in the table.
Fertilization, especially applied in higher (105N) rate decreased oil concentration, regardless of irrigation regime (Table 18). Overall fertilization effect on oil concentration was 7.5%.
Oil concentration was reversely affected by increasing irrigation water amounts. The reduction ratios in fully irrigated, compared to non-irrigated, regime (by 4.0% and 4.4%) were significant in both 0N and 35N treatments, respectively but not in 105N treatment (where the reduction ratio was 2.3%) (Table 18). The effect size of irrigation on this trait was 36.1%.

4. Discussion

Our results showed that higher SPAD values at both vegetative (V4) and early reproductive (R2 and R4) stages were recorded under drought stress conditions. Gavili et al. [35] reported that both moderate and severe drought conditions significantly increased soybean SPAD values by 11% and 20%, respectively. The authors justified this increase by the increased N concentrations caused by the decreased fresh or dry matter, and the enhanced N concentration will, in turn, enhance the chlorophyll content. Bredemeier [36] reported similar conclusion on maize. In their experiment, Fenta et al. [37] subjected three soybean cultivars to drought stress by withholding irrigation at V3 stage for 28 days (the plants, however, received precipitation amount of 34 mm during this period). The authors reported that SPAD values of the three cultivars were reduced by drought. Drought reduced chlorophyll concentration by 7% in soybean plants [38]. SPAD values enhanced with applied fertilization. [39] concluded that the application of 200 kg ha−1 of N insignificantly enhanced chlorophyll content (by 1.8% under non-stressed conditions and by 3% when drought stress occurred at R2 stage). Increasing N rate resulted in better SPAD values at different stages in soybean [40]. Similar conclusion was reported by Shafagh-Kolvanagh et al. [41].
We found out that drought decreased LAI values at all studied reproductive (R2, R4, and R6) stages, especially at R4 stage where the reduction was significant. Similarly, Gavili et al. [35] reported that moderate and severe drought (corresponding to 70% and 55% FC, respectively) significantly decreased plant leaf area by 29% and 35% at V10 stage, 23% and 31% at V3 stage, and 26% and 36% at R6 stage. Karam et al. [42] concluded that LAI decreased by 52% under drought stress conditions imposed at R2 stage. Pagter et al. [43] explained the decreased LAI under drought stress conditions to be the result of less newly produced leaves with a smaller size and a higher falling rate. Severe drought stress imposed at R4 stage resulted in 61.4% less leaf area in soybean [8]. Moosavi et al. [44] reported decreased leaf area in canola plants as a result of drought stress application. Çakir [45] also reported a 23.5% decrease in leaf area when maize plants were subjected to drought stress conditions during the tasseling period. High rate of N significantly increased LAI value at all stages except the late reproductive stage R6 where the LAI values were very close in all fertilization treatments. Caliskan et al. [32] concluded that soybean LAI linearly increased with increased N rates. DeMooy et al. [46] and Watanabe et al. [47] reported that adding N fertilizer before reproductive stages enhances growth and LAI, consequently flowering and yield.
Our results showed that drought enhanced NDVI values at early stages, but reduced them at later stages. Crusiol et al. [48] concluded that NDVI was higher in two soybean cultivars under early drought conditions, but not under late drought. Drought significantly reduced NDVI as reported by Camoglu et al. [49]. Fertilization insignificantly enhanced NDVI values. Similar conclusion was reported on wheat [50] and maize [51].
Plant height was, on average, reduced by 4.0% and 5.3% under drought stress conditions compared to half- and fully irrigated regimes, respectively. Both Newark [52] and El Kheir et al. [53] reported decreased plant height under drought stress conditions. Gavili et al. [35] reported a 33% and 60% plant height reduction in their experiment under 70% and 55% FC conditions, respectively. Soybean plants had 22.4% shorter plants when severe drought stress occurred at R4 stage, whereas only 9% reduction was reported when same severe drought occurred at R6 stage [8]. Drought reduced soybean plant height by 31.1% [22]. Neilson and Nelson [54] explained this reduction in plant height under drought by the delayed stem elongation caused by shortened distance among nodes. An indeterminate soybean cultivar (OAC Bayfield) was put under two drought stress severities; W1 and W2 (corresponding to 25% and 50% of crop evapotranspiration (ETc), respectively as compared to control, 100% ETc) at R1 stage [55]. Plant height decreased by 33% and 28% in W1 and W2 treatments, respectively after 9 days of stress application. Furthermore, 16 days of drought imposition resulted in 56% and 47% reduction in plant height in W1 and W2 treatments, respectively. Plant height was relatively enhanced by fertilization. Similar conclusion was reported earlier by Hanway and Weber [56] and Dadson and Acquaah [57].
In our experiment, drought (non-irrigated regime) significantly decreased flower number per plant in all fertilization treatments compared to half-irrigated counterparts. He et al. [58] reported that cyclic drought (where water was withheld from V5–V6 stage until reaching 30% field capacity (FC), and then plants were re-watered to 100% FC, and again water was withheld in order to reach 30% FC) resulted in 53.8% decreased flower number per plant, whereas terminal drought (where no irrigation was applied after V5–V6 stage) further increased that ratio to 72.5%. In their experiment, Atti et al. [55] reported that flower number per plant decreased by 79.4% and 58.8% in W1 and W2 treatments, respectively. The authors explained this decrease by both reduced node number and increased flower abortion as a result of drought stress application. Flower number in chickpea was reported to have an important role on the final yield [59]. Flower number per plant was enhanced by fertilization. Similarly, Purcell and King [60] reported that applying N fertilizer increased flower number in plants by reducing flower abortion rate. Brevedan et al. [61] reported similar conclusion under both greenhouse and field conditions.
Both irrigation regimes resulted in enhanced pod number per plant compared to drought-stressed counterpart, which was similarly reported by Pookpakdi et al. [62] and Pawar et al. [63] and later by He et al. [58]; the authors concluded that cyclic and terminal drought stress resulted in 42.3% and 90.4% less pods per plant. Westgate and Peterson [64] concluded that drought stress during flowering caused a 70% reduction in pod number per plant. Exposing soybean plants to drought at pod filling stages decreased pod number per plant by 36.6%, whereas a 42.6% reduction was recorded when drought was imposed at flowering stage [65]. Pod number decreased from 25 to 15 when available water decreased from 100 to 70% FC, and further reduction to 55% FC further decreased pod number to 14 [35]. In their experiment, Iqbal et al. [66] decreased FC from 100 to 50% at R4 stage to study the effect of drought at this stage on soybean; they reported that pod number per plant significantly decreased by 21.4% as a consequence of drought imposition, and when FC was further reduced to 20%, another significant reduction (by 34.7% compared to 100% FC treatment) was recorded in this trait. Leport et al. [67] concluded that decreased pod number majorly affects the seed yield of chickpea.
Drought-stressed treatment reduced final seed yield relative to both irrigated treatments. Previously, Foroud et al. [14] and Fenta et al. [37] reported that drought decreased the seed yield of soybean plants. Reductions in seed yield under drought stress conditions were also reported by Liu et al. [6] and Masoumi et al. [68]. Moreover, seed yield was reduced by 57.4% and 95.3% as a result of cyclic and terminal drought stress, respectively [58]. Moderate drought at R4 stage reduced soybean seed yield by 31.2% (averaged on both years of experiment), whereas severe drought at the same stage resulted in 77.7% less seed yield [8]. The same researchers also reported that subjecting soybean plants to moderate and severe drought at R6 stage decreased the final seed yield by 33.4% and 62.4%, respectively. When drought was imposed at R4 stage, soybean plants had 32.0% and 48.7% less seed yield under 50% and 20% FC, respectively compared to 100 FC control [66]. The authors concluded that the decrease in seed yield was mainly caused by increased number of empty pods, decreased number of seeds per plant, decreased 100-seed weight, and decreased number of pods per plant. Jumrani and Bhatia [69] subjected soybean plants to drought stress at two different stages; V4 and R5. They reported that the seed yield was decreased by 28% and 74%, respectively compared to control treatment where no drought stress was imposed, concluding that drought had much higher effect when it was imposed at reproductive stage R5 as compared to vegetative stage V4. Fertilization increased the yield under all irrigation regimes except when high rate was applied with the absence of drought, so a conclusion that low-rate fertilization is recommended under all irrigation regimes, whereas high rates of N are only recommended under relative drought conditions can be drawn. A 10% increase in seed yield was recorded with the application of 200 kg ha−1 N under drought stress imposed at R2 stage, whereas the same application decreased the yield by 1.5% under drought-free conditions [39]. Hungria et al. [70] also reported that the application of 200 kg ha−1 of N-fertilizer did not increase the yield. Other reports also concluded that N-fertilizer application resulted in better seed yield under drought stress conditions [30,71]. The application of N fertilizer increased soybean drought tolerance as it enhanced the accumulation of both shoot nitrogen and shoot biomass under drought stress conditions, whereas under well-watered conditions, N decreased yield to 2597 kg ha−1 relative to 2728 kg ha−1 [60]. Under severe drought stress, every 1 kg ha−1 of N fertilizer resulted in extra 1.2 kg ha−1 seeds [72]. Seneviratne et al. [73] reported that a relatively small amount of N fertilizer (46 kg/ha) significantly increased the seed yield by 84.7%. Similar conclusion was reported by Purcell and King [60] that N fertilizer significantly increased the yield to 2798 kg ha−1 compared to 2373 kg ha−1 without N fertilizer; they associated this increase to increased seed number because of decreased flower and pod abortion.
Our results showed that drought-stressed treatment had, on average, less protein concentration compared to both irrigated counterparts. Similarly, Sepanlo et al. [65] concluded that drought stress imposed on soybean plants at pod filling stage resulted in 15.5% reduction in protein concentration in the seeds. Reduced protein concentration under drought stress conditions was also reported by Turner et al. [74] and Carrera et al. [75]. Fertilization enhanced protein concentration under all irrigation regimes when applied in a high rate. Previously, Bloom [76] reported that increasing applied-N rate was accompanied by enhanced protein concentration. Rotundo and Westgate [77] reported that the addition of N fertilizer during the vegetative stages led to about 2% increase in protein concentration; they also concluded from their meta-analysis study that adding N fertilizer increased the protein content about 27% in all study environments; particularly, the increase was about 8% in field studies. N fertilizer dose also has a significant effect on the seed protein content; the dose of 100 kg/ha increased seed protein by just 2%, whereas the dose of 200 kg/ha resulted in 14% increase in seed protein [78].
We found that drought stress resulted in better oil concentration compared to both irrigated treatments. Sepanlo et al. [65] reported that drought at flowering stage increased oil concentration in soybean seeds by 5.7%, and further increased it (by 19.7%) when drought was imposed at pod filling stage. Boydak et al. [79] also concluded that drought stress enhanced oil concentration.
Based on the current results, it can be concluded that the current climatic conditions in the study area have different effects on different traits of the selected soybean cultivar; however, the final seed yield is relatively stable under different irrigation regimes, most probably because this cultivar belongs to the middle maturity group (group I) which allows it to recover the possible effects of the short drought periods affecting the study area, especially with the fact that other certain traits (particularly seed oil concentration) were relatively enhanced by these periods of drought. Moreover, it could be confirmed that high N-fertilizer doses (105 kg ha−1 N in our case) did not result in measurably better yield except under non-irrigated regime, whereas a starter, small dose (35 kg ha−1 N) could result in better seed yield under all irrigation regimes. However, the high N-fertilizer rate resulted in the best seed protein concentration, regardless of irrigation regime, which might be of certain importance depending on the desired quality components in the produced seeds.
Based on the correlation analysis of the final seed yield with the studied traits (Table 16), it can be noticed that periodical NDVI, compared to both SPAD and LAI, measurements can give an initial estimation of the expected yield and can be, consequently, an advisable, easy-to-apply practice. Plant height, in addition to the studied yield components (flower and pod number per plant and 100-seed weight) had also a strong correlation with the final seed yield.

Author Contributions

Conceptualization, O.B. and A.S.; methodology, A.S.; validation, O.B. and A.S.; formal analysis, O.B.; investigation, O.B. and A.S.; writing—original draft preparation, O.B.; supervision, A.S.; project administration, A.S.; funding acquisition, O.B. All authors have read and agreed to the published version of the manuscript.

Funding

This research was funded by the EFOP-3.6.3-VEKOP-16-2017-00008 project. The project is co-financed by the European Union and the European Social Fund.

Conflicts of Interest

The authors declare no conflict of interest.

References

  1. FAO. 2019. Available online: http://www.fao.org/faostat/en/#data (accessed on 25 December 2019).
  2. Van Heerden, P.D.R.; Krüger, G.H.J. Photosynthetic limitation in soybean during cold stress. S. Afr. J. Sci. 2000, 96, 201–206. [Google Scholar]
  3. Silveira, J.A.G.; Costa, R.C.L.; Viegas, R.A.; Oliveira, J.T.A.; Figueiredo, M.V.B. N-Compound accumulation and carbohydrate shortage on N2 fixation in drought-stressed and rewatered cowpea plants. Span. J. Agric. Res. 2003, 1, 65–75. [Google Scholar] [CrossRef] [Green Version]
  4. Talebi, R.; Ensafi, M.H.; Baghebani, N.; Karami, E.; Mohammadi, K.H. Physiological responses of chickpea (Cicer arietinum) genotypes to drought stress. Environ. Exp. Biol. 2013, 11, 9–15. [Google Scholar]
  5. Turner, N.; Begg, J.; Rawson, H.; English, S.; Hearn, A. Agronomic and Physiological Responses of Soybean and Sorghum Crops to Water Deficits. III. Components of Leaf Water Potential, Leaf Conductance, 14co2 Photosynthesis and Adaptation to Water Deficits. Funct. Plant Biol. 1978, 5, 179–194. [Google Scholar] [CrossRef]
  6. Liu, A.M.; Feng, Z.M.; Yan, L.Z.; Ge, Y.U. Study on soybean throughput based on cultivated land resources restriction in China. J. Nat. Resour. 2003, 18, 430–436. [Google Scholar]
  7. Vurukonda, S.S.K.P.; Vardharajula, S.; Shrivastava, M.; SkZ, A. Enhancement of drought stress tolerance in crops by plant growth promoting rhizobacteria. Microbiol. Res. 2016, 184, 13–24. [Google Scholar] [CrossRef] [PubMed]
  8. Wei, Y.; Jin, J.; Jiang, S.; Ning, S.; Liu, L. Quantitative Response of Soybean Development and Yield to Drought Stress during Different Growth Stages in the Huaibei Plain, China. Agronomy 2018, 8, 97. [Google Scholar] [CrossRef] [Green Version]
  9. Hsiao, T.C. Plant Responses to Water Stress. Ann. Bot. 1973, 89, 801. [Google Scholar] [CrossRef]
  10. Doorenbos, J.; Kassam, A.H. Yield response to water. Irrig. Agric. Dev. 1980, 33, 257–280. [Google Scholar]
  11. Frederick, J.R.; Camp, C.R.; Bauer, P.J. Drought-Stress Effects on Branch and Mainstem Seed Yield and Yield Components of Determinate Soybean. Crop Sci. 2001, 41, 759–763. [Google Scholar] [CrossRef]
  12. Aminifar, J.; Mohsenabadi, G.; Biglouei, M.H.; Samiezadeh, H. Effect of deficit irrigation on yield, yield components and phenology of soybean cultivars in Rasht region. Int. J. Agrisci. 2012, 2, 143–148. [Google Scholar]
  13. Mian, M.A.R.; Bailey, M.A.; Ashley, D.A.; Wells, R.; Carter, T.E.; Parrott, W.A.; Boerma, H.R. Molecular Markers Associated with Water Use Efficiency and Leaf Ash in Soybean. Crop Sci. 1996, 36, 1252–1257. [Google Scholar] [CrossRef] [Green Version]
  14. Foroud, N.; Mündel, H.H.; Saindon, G.; Entz, T. Effect of level and timing of moisture stress on soybean yield, protein, and oil responses. Field Crops Res. 1993, 31, 195–209. [Google Scholar] [CrossRef]
  15. Turner, N.C. Further progress in crop water relations. Adv. Agron. 1997, 58, 293–338. [Google Scholar]
  16. Melvin, S.R.; Irmak, S.; Payero, J.O. Response of Soybean to Deficit Irrigation in the Semi-Arid Environment of West-Central Nebraska. Trans. ASAE 2005, 48, 2189–2203. [Google Scholar]
  17. Yan, C.J.; Wang, W.B.; Xiao-Jie, T.U.; Wang, C.L.; Zhang, L.J.; Qiang, D.U.; Song, S.H. Effect of Drought Stress at Different Growth Stage on Yield and Root Characteristics of Soybean. Soybean Sci. 2013, 1, 59–67. [Google Scholar]
  18. Lozovaya, V.V.; Lygin, A.V.; Ulanov, A.V.; Nelson, R.L.; Daydé, J.; Widholm, J.M. Effect of temperature and soil moisture status during seed development on soybean seed isoflavone concentration and composition. Crop Sci. 2005, 45, 1934–1940. [Google Scholar] [CrossRef] [Green Version]
  19. Bhatia, V.S.; Jumrani, K. A maximin-minimax approach for classifying soybean genotypes for drought tolerance based on yield potential and loss. Plant Breed 2016, 136, 691–700. [Google Scholar] [CrossRef]
  20. Jumrani, K.; Bhatia, V.S.; Pandey, G.P. Impact of elevated temperatures on specific leaf weight, stomatal density, photosynthesis and chlorophyll fluorescence in soybean. Photosynth. Res. 2017, 131, 333–350. [Google Scholar] [CrossRef]
  21. Desclaux, D.; Roumet, P. Impact of drought stress on the phenology of two soybean (Glycine max L. Merr) cultivars. Field Crops Res. 1996, 46, 61–70. [Google Scholar] [CrossRef]
  22. Freitas, M.E.; de Souza, L.C.F.; Salton, J.C.; Serra, A.P.; Mauad, M.; Cortez, J.W.; Marchetti, M.E. Crop rotation affects soybean performance in no-tillage system under optimal and dry cropping seasons. AJCS 2016, 10, 353–361. [Google Scholar]
  23. Bellaloui, N.; Mengistu, A. Seed composition is influenced by irrigation regimes and cultivar differences in soybean. Irrig. Sci. 2008, 26, 261–268. [Google Scholar] [CrossRef]
  24. Sandoval-Villa, M.; Wood, C.W.; Guertal, E.A. Tomato leaf chlorophyll meter readings as affected by variety, nitrogen form and night time nutrient solution strength. J. Plant Nutr. 2002, 25, 2129–2142. [Google Scholar] [CrossRef]
  25. Farooq, M.; Hussain, M.; Siddique, K.H. Drought stress in wheat during flowering and grain-filling periods. Crit. Rev. Plant Sci. 2014, 33, 331–349. [Google Scholar] [CrossRef]
  26. Senapati, N.; Stratonovitch, P.; Paul, M.J.; Semenov, M.A. Drought Tolerance during Reproductive Development Is Important for Increasing Wheat Yield Potential under Climate Change in Europe. J. Exp. Bot. 2018, 70, 2549–2560. [Google Scholar] [CrossRef] [Green Version]
  27. Basal, O.; Szabó, A. Does drought stress always negatively affect the yield and quality of soybean in Hungary? Acta Agrar. Debr. 2019, 2, 37–40. [Google Scholar] [CrossRef]
  28. Bellaloui, N.; Bruns, H.A.; Abbas, H.K.; Mengistu, A.; Fisher, D.K.; Reddy, K.N. Effects of row-type, row-spacing, seeding rate, soil-type, and cultivar differences on soybean seed nutrition under us Mississippi Delta conditions. PLoS ONE 2015, 10, e0129913. [Google Scholar] [CrossRef]
  29. Fageria, N.; Baligar, V. Enhancing nitrogen use efficiency in crop plants. Adv. Agron. 2005, 88, 97–185. [Google Scholar]
  30. Salvagiotti, F.; Cassman, K.G.; Specht, J.E.; Walter, D.T.; Weiss, A.; Dobermann, A. Nitrogen uptake, fixation and response to fertilizer N in soybeans: A review. Field Crops Res. 2008, 108, 1–13. [Google Scholar] [CrossRef] [Green Version]
  31. Wani, S.P.; Rupela, O.P.; Lee, K.K. Sustainable agriculture in the semi-arid tropics through biological nitrogen-fixation in grain legumes. Plant Soil 1995, 174, 29–49. [Google Scholar] [CrossRef]
  32. Caliskan, S.; Ozkaya, I.; Caliskan, M.E.; Arslan, M. The effects of nitrogen and iron fertilization on growth, yield and fertilizer use efficiency of soybean in a Mediterranean-type soil. Field Crops Res. 2008, 108, 126–132. [Google Scholar] [CrossRef]
  33. Sinclair, T.R.; Vadez, V. The future of grain legumes in cropping systems. Crop Pasture Sci. 2012, 63, 501–512. [Google Scholar] [CrossRef] [Green Version]
  34. Fehr, W.R.; Caviness, C.E. Stages of Soybean Development; Special Report 80; Iowa State University, Agricultural and Home Economics Experiment Station: Ames, IA, USA, 1977; pp. 3–11. [Google Scholar]
  35. Gavili, E.; Moosavi, A.A.; Haghighi, A.A.K. Does biochar mitigate the adverse effects of drought on the agronomic traits and yield components of soybean? Ind. Crops Prod. 2019, 128, 445–454. [Google Scholar] [CrossRef]
  36. Bredemeier, C. Laser-Induced Chlorophyll Fluorescence Sensing as a Tool for Site Specific Nitrogen Fertilizer Evaluation under Controlled Environmental and Field Conditions in Wheat and Maize. Ph.D. Thesis, Technical University of Munich, Munich, Germany, 2005; p. 219. [Google Scholar]
  37. Fenta, B.A.; Beebe, S.E.; Kunert, K.J.; Burridge, J.D.; Barlow, K.M.; Lynch, J.P.; Foyer, C.H. Field phenotyping of soybean roots for drought stress tolerance. Agronomy 2014, 4, 418–435. [Google Scholar] [CrossRef] [Green Version]
  38. Cerezini, P.; Fagotti, D.D.S.L.; Pípolo, A.E.; Hungria, M.; Nogueira, M.A. Water restriction and physiological traits in soybean genotypes contrasting for nitrogen fixation drought tolerance. Sci. Agric. 2017, 74, 110–117. [Google Scholar] [CrossRef] [Green Version]
  39. Cerezini, P.; Kuwano, B.H.; dos Santos, M.B.; Terassi, F.; Hungria, M.; Nogueira, M.A. Strategies to promote early nodulation in soybean under drought. Field Crops Res. 2016, 196, 160–167. [Google Scholar] [CrossRef]
  40. Islam, M.M.; Ishibashi, Y.; Nakagawa, A.C.S.; Tomita, Y.; Zhao, X.; Iwaya-Inoue, M.; Arima, S.; Zheng, S.-H. Nitrogen manipulation affects leaf senescence during late seed filling in soybean. Acta Physiol. Plant. 2017, 39, 42. [Google Scholar] [CrossRef]
  41. Shafagh-Kolvanagh, J.; Zehtab-Salmasi, S.; Javanshir, A.; Moghaddam, M.; Nasab, A.D.M. Effects of nitrogen and duration of weed interference on grain yield and SPAD (chlorophyll) value of soybean (Glycine max (L.) Merrill.). J. Food Agric. Environ. 2008, 6, 368–373. [Google Scholar]
  42. Karam, F.; Masaad, R.; Sfeir, T.; Mounzer, O.; Rouphael, Y. Evapotranspiration and seed yield of field grown soybean under deficit irrigation conditions. Agric. Water Manag. 2005, 75, 226–244. [Google Scholar] [CrossRef]
  43. Pagter, M.; Bragato, C.; Brix, H. Tolerance and physiological responses of Phragmites australis to water deficit. Aquat. Bot. 2005, 81, 285–299. [Google Scholar] [CrossRef]
  44. Moosavi, A.A.; Mansouri, S.; Zahedifar, M.; Sadikhani, M.R. Effect of water stress and nickel application on yield components and agronomic characteristics of canola grown on two calcareous soils. Arch. Agron. Soil Sci. 2014, 60, 1747–1764. [Google Scholar] [CrossRef]
  45. Çakir, R. Effect of water stress at different development stages on vegetative and reproductive growth of corn. Field Crops Res. 2004, 89, 1–16. [Google Scholar] [CrossRef]
  46. DeMooy, C.J.; Pesek, J.; Spaldon, E. Mineral nutrition of soybeans. In Soybeans: Improvement, Production and Uses; Agronomy Series; Caldwell, B.E., Ed.; ASA Publishers: Madison, WI, USA, 1973; pp. 276–352. [Google Scholar]
  47. Watanabe, I.; Tabuchi, K.; Nakano, H. Response of soybean to supplemental nitrogen after flowering. In Soybean in Tropical and Subtropical Cropping Systems; Shanmugasundaram, S., Sulzberger, E.W., Mclean, B.T., Eds.; AVRDC: Shanhua, Taiwan, 1986; pp. 301–308. [Google Scholar]
  48. Crusiol, L.G.T.; Carvalho, J.F.C.; Sibaldelli, R.N.R.; Neiverth, W.; do Rio, A.; Ferreira, L.C.; Procopio, S.O.; Mertz-Henning, L.M.; Nepomuceno, A.L.; Neumaier, N.; et al. NDVI variation according to the time of measurement, sampling size, positioning of sensor and water regime in different soybean cultivars. Precis. Agric. 2017, 18, 470–490. [Google Scholar] [CrossRef] [Green Version]
  49. Camoglu, G.; Demirel, K.; Genc, L. Use of infrared thermography and hyperspectral data to detect effects of water stress on pepper. Quant. InfraRed Thermogr. J. 2018, 15, 81–94. [Google Scholar] [CrossRef]
  50. Saleem, M.F.; Ma, B.L.; Voldeng, H.; Wang, T.-C. Nitrogen Nutrition on Leaf Chlorophyll, Canopy Reflectance, Grain Protein and Grain Yield of Wheat Varieties with Contrasting Grain Protein Concentration. J. Plant Nutr. 2010, 33, 1681–1695. [Google Scholar] [CrossRef]
  51. Mupangwa, W.; Nyagumbo, I.; Mutsamba, E.; Mhlanga, B.; Mataruse, J. Maize responses to reduced tillage, different plant residue mulch and nitrogen fertilizer on granitic sandy soils of Zimbabwe. S. Afr. J. Plant Soil 2018, 35, 367–376. [Google Scholar] [CrossRef]
  52. Newark, D.E. Plant Growth with Limited Water-Report. Energy Res. Abstr. 1991, 17, 1812. [Google Scholar]
  53. El Kheir, M.S.A.A.; Kandil, S.A.; Mekki, B.B. Physiological Response of Two Soybean Cultivars Grown Under Water Stress Conditions as Affected by CCC Treatment. J. Physiol. Sci. 1994, 18, 179–200. [Google Scholar]
  54. Neilson, D.C.; Nelson, N.O. Black bean sensitivity to water stress at various growth stages. Crop Sci. 1998, 28, 422–427. [Google Scholar]
  55. Atti, S.; Bonnell, R.; Smith, D.; Prasher, S. Response of an Indeterminate Soybean {Glycine max (L.) Merr} to Chronic Water Deficit During Reproductive Development Under Greenhouse Conditions. Can. Water Resour. J. 2004, 29, 209–222. [Google Scholar] [CrossRef] [Green Version]
  56. Hanway, J.J.; Weber, C.R. Accumulation of N, P and K by soybean (Glycine max (L) Merrill) plants. Agron. J. 1971, 63, 406–408. [Google Scholar] [CrossRef]
  57. Dadson, R.B.; Acquaah, G. Rhizobium japonicum, Nitrogen and Phosphorus Effects on Nodulation, Symbiotic Nitrogen Fixation and Yield of Soybean (Glycine max (L.) Merrill) in The Southern Savanna of Ghana. Field Crops Res. 1984, 9, 101–108. [Google Scholar] [CrossRef]
  58. He, J.; Du, Y.-L.; Wang, T.; Turner, N.C.; Yang, R.-P.; Jin, Y.; Xi, Y.; Zhang, C.; Cui, T.; Fang, X.-W.; et al. Conserved water use improves the yield performance of soybean (Glycine max (L.) Merr.) under drought. Agr. Water Manag. 2017, 179, 236–245. [Google Scholar] [CrossRef]
  59. Fang, X.W.; Turner, N.C.; Yan, G.J.; Li, F.M.; Siddique, K.H.M. Flower number, pod production, pollen viability, and pistil function are reduced and flower and pod abortion increased in chickpea (Cicer arietinum L.) under terminal drought. J. Exp. Bot. 2010, 61, 335–345. [Google Scholar] [CrossRef] [PubMed] [Green Version]
  60. Purcell, L.C.; King, C.A. Drought and Nitrogen Source Effects on Nitrogen Nutrition, Seed Growth and Yield in Soybean. J. Plant Nutr. 1996, 19, 969–993. [Google Scholar] [CrossRef]
  61. Brevedan, R.E.; Egli, D.B.; Leggett, J.E. Influence of N nutrition on flower and pod abortion and yield of soybeans. Agron. J. 1978, 70, 81–84. [Google Scholar] [CrossRef]
  62. Pookpakdi, A.; Thiravirojana, K.; Saeradee, I.; Chaikaew, S. Response of new soybean accessions to stress during reproductive phase. Kasetsart J. Nat. Sci. 1990, 24, 378–387. [Google Scholar]
  63. Pawar, V.S.; Patit, P.O.; Dahi Walur, S.D.; Magar, S.S. Effect of irrigation schedule based on critical growth stages on yield, quality and water use of chickpea (Cicer arietinum L.) on vertisol. Ind. J. Agric. Sci. 1992, 62, 402–404. [Google Scholar]
  64. Westgate, M.E.; Peterson, C.M. Flower and Pod Development in Water-Deficient Soybeans (Glycine max L. Merr.). J. Exp. Bot. 1993, 44, 109–117. [Google Scholar] [CrossRef]
  65. Sepanlo, N.; Talebi, R.; Rokhzadi, A.; Mohammadi, H. Morphological and physiological behavior in soybean (Glycine max) genotypes to drought stress implemented at pre- and post-anthesis stages. Acta Biol. Szeged. 2014, 58, 109–113. [Google Scholar]
  66. Iqbal, N.; Hussain, S.; Zhang, X.-W.; Yang, C.-Q.; Raza, M.A.; Deng, J.-C.; Ahmad, S.; Ashgar, M.A.; Zhang, J.; Yang, W.; et al. Imbalance Water Deficit Improves the Seed Yield and Quality of Soybean. Agronomy 2018, 8, 168. [Google Scholar] [CrossRef] [Green Version]
  67. Leport, L.; Turner, N.C.; Davies, S.L.; Siddique, K.H.M. Variation in pod production and abortion among chickpea cultivars under terminal drought. Eur. J. Agron. 2006, 24, 236–246. [Google Scholar] [CrossRef]
  68. Masoumi, H.; Darvish, F.; Daneshian, J.; Normohammadi, G.; Habibi, D. Effects of water deficit stress on seed yield and antioxidants content in soybean (Glycine max L.) cultivars. Afr. J. Agric. Res. 2011, 6, 1209–1218. [Google Scholar]
  69. Jumrani, K.; Bhatia, V.S. Impact of combined stress of high temperature and water deficit on growth and seed yield of soybean. Physiol. Mol. Biol. Plants 2018, 24, 37–50. [Google Scholar] [CrossRef] [PubMed]
  70. Hungria, M.; Franchini, J.C.; Campo, R.J.; Crispino, C.C.; Moraes, J.Z.; Sibaldelli, R.N.R.; Mendes, I.C.; Arihara, L. Nitrogen nutrition of soybean in Brazil: Contributions of biological N2 fixation and N fertilizer to grain yield. Can. J. Plant Sci. 2006, 86, 927–939. [Google Scholar] [CrossRef] [Green Version]
  71. Ray, J.D.; Fritschi, F.B.; Heatherly, L.G. Large applications of fertilizer N at planting affects seed protein and oil concentration and yield in the Early Soybean Production System. Field Crops Res. 2006, 99, 67–74. [Google Scholar] [CrossRef]
  72. Chen, Z.; MacKenzie, A.F.; Fanous, M.A. Soybean nodulation and grain yield as influenced by N-fertilizer rate, plant population density and cultivar in southern Quebec. Can. J. Plant Sci. 1992, 72, 1049–1056. [Google Scholar] [CrossRef]
  73. Seneviratne, G.; Van Holm, L.H.J.; Ekanayake, E.M.H.G.S. Agronomic benefits of rhizobial inoculant use over nitrogen fertilizer application in tropical soybean. Field Crops Res. 2000, 68, 199–203. [Google Scholar] [CrossRef]
  74. Turner, N.C.; Davies, S.L.; Plummer, J.A.; Siddique, K.H.M. Seed Filling in Grain Legumes Under Water Deficits, with Emphasis on Chickpeas. Adv. Agron. 2005, 87, 211–250. [Google Scholar]
  75. Carrera, C.; Martinez, M.J.; Dardanelli, J.; Balzarini, M. Water deficit effect on the relationship between temperature during the seed fill period and soybean seed oil and protein concentrations. Crop Sci. 2009, 49, 990–998. [Google Scholar] [CrossRef]
  76. Bloom, A.J. Rising carbon dioxide concentrations and the future of crop production. J. Sci. Food Agric. 2006, 86, 1289–1291. [Google Scholar] [CrossRef]
  77. Rotundo, J.L.; Westgate, M.E. Meta-analysis of environmental effects on soybean seed composition. Field Crop Res. 2009, 110, 147–156. [Google Scholar] [CrossRef]
  78. Miransari, M. Soybeans, Stress, and Nutrients. In Environmental Stresses in Soybean Production. Soybean Production; Miransari, M., Ed.; Nikki Levy: Chippenham, UK, 2016; Volume 2, pp. 273–298. [Google Scholar]
  79. Boydak, E.; Alpaslan, M.; Hayta, M.; Gercek, S.; Simsek, M. Seed composition of soybeans grown in the Harran region of Turkey as affected by row spacing and irrigation. J Agric. Food Chem. 2002, 50, 4718–4720. [Google Scholar] [CrossRef] [PubMed]
Figure 1. Irrigation amounts during the vegetative period of soybean (cv. Pannonia Kincse) in 2017, 2018, and 2019 in Debrecen, Hungary. NI: non-irrigated, HI: half-irrigated, FI: fully irrigated.
Agronomy 10 00384 g001
Figure 2. The effect of different fertilization rates on the seed protein concentration (%) of soybean (cv. Pannonia Kincse) under different irrigation regimes, averaged among 2017, 2018 and 2019 in Debrecen, Hungary.
Agronomy 10 00384 g002
Table 1. The effect of different fertilization rates on soil plant analysis development (SPAD) at different stages of soybean’s (cv. Pannonia Kincse) life cycle, averaged among 2017, 2018 and 2019 in Debrecen, Hungary.
Stage0N35N105N
V441.5 ± 2.3 b42.0 ± 2.0 a,b42.7 ± 2.4 a
R242.2 ± 2.5 a43.1 ± 2.4 a42.7 ± 2.4 a
R441.8 ± 1.9 a42.3 ± 2.1 a42.4 ± 2.6 a
R644.4 ± 3.1 b44.8 ± 3.5 a,b46.2 ± 2.8 a
Average42.5 ± 2.543.1 ± 2.643.5 ± 2.8
Different letters after means ± SD (a, b) indicate significant difference at 0.05 level among fertilization treatments within a certain stage.
Table 2. Correlation coefficient of SPAD, Normalized Difference Vegetation Index (NDVI), and leaf area index (LAI) traits at different stages with fertilization treatments.
StageSPADNDVILAI
V40.229 *0.229 *0.357 **
R20.0880.0060.300 **
R40.1060.0880.236 *
R60.233 *0.053−0.012
Overall0.150 **0.0900.092
** Correlation is significant at the 0.01 level (2-tailed); * Correlation is significant at the 0.05 level (2-tailed).
Table 3. The effect of different irrigation regimes on SPAD at different stages of soybean’s (cv. Pannonia Kincse) life cycle, averaged among 2017, 2018, and 2019 in Debrecen, Hungary.
StageNon-IrrigatedHalf-IrrigatedFully Irrigated
V442.6 ± 2.6 a41.7 ± 2.1 a41.9 ± 2.1 a
R242.7 ± 2.5 a42.4 ± 2.6 a43.0 ± 2.3 a
R442.7 ± 2.1 a42.4 ± 2.3 a,b41.4 ± 2.1 b
R643.2 ± 3.4 c45.3 ± 2.5 b46.9 ± 2.5 a
Average42.8 ± 2.343.0 ± 2.643.3 ± 2.5
Different letters after means ± SD (a, b) indicate significant difference at 0.05 level among irrigation regimes within a certain stage.
Table 4. Correlation coefficient of SPAD, NDVI, and LAI traits at different stages with irrigation treatments.
StageSPADNDVILAI
V4−0.128−0.033−0.226 *
R20.056−0.282 **0.114
R4−0.233 *0.1030.272 **
R60.474 **0.211 *0.091
Overall0.0730.0310.057
** Correlation is significant at the 0.01 level (2-tailed); * Correlation is significant at the 0.05 level (2-tailed).
Table 5. The effect of different fertilization rates on NDVI at different stages of soybean’s (cv. Pannonia Kincse) life cycle, averaged among 2017, 2018, and 2019 in Debrecen, Hungary.
Stage0N35N105N
V475.7 ± 5.6 a76.7 ± 5.1 a78.6 ± 5.0 a
R284.2 ± 1.9 a84.2 ± 1.5 a84.3 ± 1.4 a
R483.2 ± 3.2 a83.5 ± 2.8 a83.8 ± 2.9 a
R682.8 ± 4.5 a83.3 ± 4.2 a83.4 ± 4.6 a
Average81.5 ± 4.081.9 ± 4.182.5 ± 4.4
Same letter indicates no significant difference at 0.05 level among fertilization treatments within a certain stage.
Table 6. The effect of different irrigation regimes on NDVI at different stages of soybean’s (cv. Pannonia Kincse) life cycle, averaged among 2017, 2018, and 2019 in Debrecen, Hungary.
StageNon-IrrigatedHalf-IrrigatedFully Irrigated
V477.5 ± 5.5 a76.4 ± 5.3 a77.1 ± 5.3 a
R284.6 ± 1.1 a84.6 ± 1.3 a83.5 ± 2.1 b
R483.0 ± 3.5 a83.7 ± 2.9 a83.8 ± 2.4 a
R681.7 ± 4.3 a83.7 ± 3.5 a83.9 ± 3.9 a
Average81.7 ± 4.582.1 ± 3.782.1 ± 3.8
Different letters after means ± SD (a, b) indicate significant difference at 0.05 level among irrigation regimes within a certain stage.
Table 7. The effect of different fertilization rates on LAI at different stages of soybean’s (cv. Pannonia Kincse) life cycle, averaged among 2017, 2018, and 2019 in Debrecen, Hungary.
Stage0N35N105N
V41.9 ± 0.09 b2.0 ± 0.1 b2.4 ± 0.1 a
R24.6 ± 0.8 b5.2 ± 1.0 a,b5.8 ± 1.1 a
R48.1 ± 1.1 b8.4 ± 1.1 a,b9.0 ± 1.2 a
R66.4 ± 0.9 a6.5 ± 0.8 a6.5 ± 0.7 a
Average5.3 ± 0.85.5 ± 0.85.9 ± 0.9
Different letters after means ± SD (a, b) indicate significant difference at 0.05 level among fertilization treatments within a certain stage.
Table 8. The effect of different irrigation regimes on LAI at different stages of soybean’s (cv. Pannonia Kincse) life cycle, averaged among 2017, 2018, and 2019 in Debrecen, Hungary.
StageNon-IrrigatedHalf-IrrigatedFully Irrigated
V42.3 ± 0.09 a2.0 ± 0.08 a,b1.9 ± 0.1 b
R25.0 ± 0.7 a5.1 ± 0.4 a5.4 ± 0.6 a
R47.9 ± 0.8 b8.8 ± 0.9 a8.9 ± 0.9 a
R66.1 ± 0.6 a6.9 ± 0.8 a6.4 ± 0.8 a
Average5.3 ± 0.85.7 ± 0.85.7 ± 0.7
Different letters after means ± SD (a, b) indicate significant difference at 0.05 level among irrigation regimes within a certain stage.
Table 9. Correlation coefficient of yield and yield components traits with fertilization treatments.
Protein ConcentrationOil ConcentrationYieldPlant HeightFlower NumberPod Number100-Seed Weight
0.286 **−0.1200.195 *0.0900.229 *0.259 **0.286 **
** Correlation is significant at the 0.01 level (2-tailed); * Correlation is significant at the 0.05 level (2-tailed).
Table 10. Correlation coefficient of yield and yield components traits with irrigation treatments.
Protein ConcentrationOil ConcentrationYieldPlant HeightFlower NumberPod Number100-Seed Weight
0.244 *−0.368 **0.1510.1160.456 **0.419 **0.000
** Correlation is significant at the 0.01 level (2-tailed); * Correlation is significant at the 0.05 level (2-tailed).
Table 11. The effect of different fertilization rates on plant height (cm) of soybean (cv. Pannonia Kincse) under different irrigation regimes, averaged among 2017, 2018, and 2019 in Debrecen, Hungary.
Treatment0N35N105NAverage
Non-Irrigated87.8 ± 16.1 a,188.7 ± 18.3 b,190.4 ± 16.9 b,189.0 ± 16.7
Half-Irrigated90.3 ± 17.6 a,192.8 ± 17.7 a,b,195.0 ± 15.1 a,192.7 ± 15.0
Fully Irrigated91.9 ± 14.0 a,195.0 ± 16.8 a,195.2 ± 15.8 a,194.0 ± 16.6
Average90.0 ± 15.692.2 ± 17.393.5 ± 15.691.9 ± 16.1
Different letters after means ± SD (a, b) indicate significant difference at 0.05 level among irrigation regimes within certain fertilization treatment; Different numbers after means ± SD (1, 2) indicate significant difference at 0.05 level among fertilization treatments within certain irrigation regime.
Table 12. The effect of different fertilization rates on flower number per plant of soybean (cv. Pannonia Kincse) under different irrigation regimes, averaged among 2017, 2018, and 2019 in Debrecen, Hungary.
Treatment0N35N105NAverage
Non-Irrigated49.3 ± 2.1 b,151.0 ± 4.9 b,152.5 ± 4.0 b,150.9 ± 4.0
Half-Irrigated57.4 ± 6.8 a,258.3 ± 6.3 a,1,264.4 ± 6.4 a,160.1 ± 7.1
Fully Irrigated56.0 ± 4.0 a,b,263.7 ± 10.0 a,158.6 ± 6.4 a,b,1,259.4 ± 7.7
Average54.2 ± 5.857.7 ± 8.958.5 ± 7.456.8 ± 7.7
Different letters after means ± SD (a, b) indicate significant difference at 0.05 level among irrigation regimes within certain fertilization treatment. Different numbers after means ± SD (1, 2) indicate significant difference at 0.05 level among fertilization treatments within certain irrigation regime.
Table 13. The effect of different fertilization rates on pod number per plant of soybean (cv. Pannonia Kincse) under different irrigation regimes, averaged among 2017, 2018, and 2019 in Debrecen, Hungary.
Treatment0N35N105NAverage
Non-Irrigated40.5 ± 1.8 b,142.3 ± 3.4 b,144.8 ± 3.6 b,142.5 ± 3.5
Half-Irrigated49.3 ± 5.5 a,250.7 ± 4.8 a,1,254.5 ± 2.9 a,151.5 ± 5.0
Fully Irrigated45.6 ± 3.1 a,252.8 ± 5.9 a,147.4 ± 4.3 b,248.6 ± 5.4
Average45.1 ± 5.248.6 ± 6.648.9 ± 5.547.5 ± 6.0
Different letters after means ± SD (a, b) indicate significant difference at 0.05 level among irrigation regimes within certain fertilization treatment; Different letters after means ± SD (1, 2) indicate significant difference at 0.05 level among fertilization treatments within certain irrigation regime.
Table 14. The effect of different fertilization rates on 100-seed weight (g) of soybean (cv. Pannonia Kincse) under different irrigation regimes, averaged among 2017, 2018, and 2019 in Debrecen, Hungary.
Treatment0N35N105NAverage
Non-Irrigated17.3 ± 1.9 a,218.7 ± 3.1 a,1,220.6 ± 2.3 a,118.8 ± 2.8
Half-Irrigated18.9 ± 2.9 a,120.3 ± 2.6 a,120.6 ± 3.2 a,119.9 ± 2.9
Fully Irrigated17.6 ± 2.0 a,120.3 ± 3.4 a,118.7 ± 2.5 a,118.8 ± 2.9
Average17.9 ± 2.419.8 ± 3.119.9 ± 2.819.2 ± 2.9
Different letters after means ± SD (a, b) indicate significant difference at 0.05 level among irrigation regimes within certain fertilization treatment; Different numbers after means ± SD (1, 2) indicate significant difference at 0.05 level among fertilization treatments within certain irrigation regime.
Table 15. The effect of different fertilization rates on the yield (kg ha−1) of soybean (cv. Pannonia Kincse) under different irrigation regimes, averaged among 2017, 2018, and 2019 in Debrecen, Hungary.
Treatment0N35N105NAverage
Non-Irrigated4261.7 ± 754.3 a,14608.5 ± 624.4 a,14842.3 ± 860.2 a,14570.8 ± 769.7
Half-Irrigated4638.0 ± 727.8 a,14830.1 ± 416.1 a,14874.3 ± 622.8 a,14780.8 ± 520.3
Fully Irrigated4681.5 ± 530.4 a,14999.8 ± 552.4 a,14798.8 ± 619.1 a,14826.7 ± 637.7
Average4527.1 ± 685.84812.8 ± 547.04838.5 ± 689.84726.1 ± 653.8
Different letters after means ± SD (a, b) indicate significant difference at 0.05 level among irrigation regimes within certain fertilization treatment; Different numbers after means ± SD (1, 2) indicate significant difference at 0.05 level among fertilization treatments within certain irrigation regime.
Table 16. Correlation coefficient of yield components, fertilization treatments and irrigation regimes with the final seed yield. (100-SW: 100-seed weight, PN: pod number, FN: flower number, PH: plant height, FR: fertilization rate, IR: irrigation regime, PC: protein concentration, OC: oil concentration).
100-SWPNFNPHNDVIFRIRPCSPADLAIOC
0.521 **0.471 **0.462 **0.447 **0.436 **0.195 *0.151−0.034−0.048−0.061−0.245 *
** Correlation is significant at the 0.01 level (2-tailed); * Correlation is significant at the 0.05 level (2-tailed).
Table 17. The effect of different fertilization rates on the seed protein concentration (%) of soybean (cv. Pannonia Kincse) under different irrigation regimes, averaged among 2017, 2018, and 2019 in Debrecen, Hungary.
Treatment0N35N105NAverage
Non-Irrigated35.8 ± 1.2 b,235.8 ± 1.0 b,238.4 ± 1.2 a,136.7 ± 1.7
Half-Irrigated37.0 ± 1.3 a,b,136.6 ± 1.7 a,b,137.7 ± 1.8 a,137.1 ± 1.7
Fully Irrigated37.7 ± 2.2 a,137.4 ± 1.8 a,138.1 ± 1.6 a,137.7 ± 1.8
Average36.8 ± 1.836.6 ± 1.738.1 ± 1.537.2 ± 1.8
Different letters after means ± SD (a, b) indicate significant difference at 0.05 level among irrigation regimes within certain fertilization treatment. Different numbers after means ± SD (1, 2) indicate significant difference at 0.05 level among fertilization treatments within certain irrigation regime.
Table 18. The effect of different fertilization rates on the seed oil concentration (%) of soybean (cv. Pannonia Kincse) under different irrigation regimes, averaged among 2017, 2018, and 2019 in Debrecen, Hungary.
Treatment 0N35N105NAverage
Non-Irrigated22.5 ± 0.9 a,122.5 ± 0.8 a,122.0 ± 0.6 a,122.3 ± 0.8
Half-Irrigated21.8 ± 0.7 a,b,121.8 ± 0.7 b,121.6 ± 0.7 a,121.7 ± 0.8
Fully Irrigated21.6 ± 0.5 b,121.5 ± 0.7 b,121.5 ± 1.0 a,121.5 ± 0.6
Average22.0 ± 0.821.9 ± 0.821.7 ± 0.821.9 ± 0.8
Different letters after means ± SD (a, b) indicate significant difference at 0.05 level among irrigation regimes within certain fertilization treatment; Different numbers after means ± SD (1, 2) indicate significant difference at 0.05 level among fertilization treatments within certain irrigation regime.

