Article

Genome-Wide Identification, Structure Characterization, and Expression Profiling of Dof Transcription Factor Gene Family in Wheat (Triticum aestivum L.)

1
Engineering Research Center of Ecology and Agricultural Use of Wetland, Ministry of Education/Hubei Collaborative Innovation Center for Grain Industry/Forewarning and Management of Agricultural and Forestry Pests, Hubei Engineering Technology Center/College of Agriculture, Yangtze University, Jingzhou 434000, China
2
Institute of Plant Protection, Sichuan Academy of Agricultural Sciences/Key Laboratory of Integrated Pest Management of Crop in Southwest China, Ministry of Agriculture, Chengdu 610066, China
3
Institute of Food Crops, Hubei Academy of Agricultural Science, Wuhan 430064, China
*
Author to whom correspondence should be addressed.
These authors contributed equally to this work.
Agronomy 2020, 10(2), 294; https://doi.org/10.3390/agronomy10020294
Submission received: 20 January 2020 / Revised: 12 February 2020 / Accepted: 17 February 2020 / Published: 19 February 2020
(This article belongs to the Special Issue Bioinformatics Applied to Genetic Improvement of Crop Species)

Abstract

:
DNA binding with one finger (Dof) proteins are plant-specific transcription factors with crucial roles in plant growth and stress response. Even so, little is known about them in wheat. In this study, 108 wheat Dof (TaDof) genes across 21 chromosomes were detected. Although variable in sequence length, molecular weight, and isoelectric point, all TaDof proteins contained conserved zinc-finger structures and were phylogenetically divided into 7 sub-groups. Exon/intron and motif analyses suggested that TaDof structures and conserved motifs were similar within sub-groups but diverse among sub-groups. Many segmental duplications were identified and Ka/Ks and inter-species synthetic analyses indicated that polyploidization was main reason for increased number of TaDofs. Prediction and experimental confirmation revealed that TaDofs functioned as transcription factors in the nucleus. Expression pattern profiling showed that TaDofs specifically affected growth and development, and biotic and abiotic stress responses. Wheat miRNAs and cis-regulator were predicted as essential players in molding TaDofs expression patterns. qRT-PCR analysis revealed that TaDofs were induced by salt and drought stresses. Customized annotation revealed that TaDofs were widely involved in phytohormone response, defense, growth and development, and metabolism. Our study provided a comprehensive understanding to wheat TaDofs.

1. Introduction

Transcriptional regulation plays a crucial role in many biological processes, such as signal transduction and response to abiotic and biotic stress in plants [1,2,3]. A typical transcription factor contains four functional regions: a DNA binding region, a transcriptional regulatory region (including activation and inhibition domains), an oligomerization site, and a nuclear localization signal region [4]. Transcription factors enter the nucleus at specific times to interact with the cis-acting elements of gene promoters or the functional regions of other transcription factors to regulate gene transcription and expression [5].
The Dof (DNA binding with one finger) protein family is one class of plant-specific transcription factors belonging to the zinc finger super-family. They are typically composed of 200 to 400 amino acids (aa) [6,7]. The first gene containing a Dof domain was reported in maize [8]. They were then identified in many plant species including dicots (including Arabidopsis thaliana [9], Pinus taeda [10], Solanum lycopersicum [11], and Musa nana [12]), and monocots (including Oryza sativa [9] and Zea mays [13]). Dof proteins have two functional domains, a DNA-binding domain at the N-terminus and a transcriptional regulatory domain at the C-terminus [14]. The DNA binding domain, also named the Dof domain, has a unique, conserved zinc finger domain that is rich in Cys residues [15]. It is a bifunctional domain that mediates both DNA-protein and protein-protein interaction [7,15]. Dof domains commonly include 52 conserved aa with a CX2CX21CX2C signature motif at the N-terminus. Within the region, four Cys residues and Zn2+ form a zinc finger that functions as a Cys2/Cys2 domain [6]. Variation in the less conserved C-terminus domain allows Dof proteins to be regulated by signals from multiple metabolic pathways resulting in many transcription outputs and a diverse range of functions [16].
Dof transcription factors have roles in numerous physiological processes, such as tissue differentiation, pollen development, leaf polarity, guard cell development, and cell cycle regulation. For example, ZmDof1 in maize affects pollen development by negatively regulating expression of the pollen-specific gene Zm401 [17]. AtDof2.4 and AtDof5.8 in Arabidopsis regulate development of vascular bundles through their promoter function, whereas AtDof6 negatively regulates seed germination through interaction with TCP14 protein [18,19]. Many studies have shown that Dof transcription factors are involved in regulation of biotic and abiotic stress response [20,21]. For example, the action of SlCDF1 and SlCDF3, two Dof transcription factors in tomato, caused improved drought and salt stress tolerance in transgenic plants [22]; and CDF3, a cycling DOF factor in Arabidopsis, promoted drought, cold, and osmotic stress tolerance [23].
Crops are challenged by many types and levels of stresses such as salt and drought [24,25]. As one of the world’s most important staple crops, wheat (Triticum aestivum L.) is affected by various kinds of stress that limits the achievement of yield potential [26]. Given the important roles of Dof transcription factors in plant growth and development, as well as in plant response to biotic and abiotic stresses, a comprehensive understanding of Dof in wheat (TaDof) would be useful for resistance breeding and TaDofs function deciphering. We therefore performed systemic in silico and experimental analyses of TaDofs in order to gain knowledge of the gene classification, chromosomal location, phylogenetic relationships, conserved motifs, sub-cellular localization, and expression patterns. Furthermore, the miRNAs that possibly target TaDofs and the upstream cis-regulatory elements of TaDofs were predicted to further explore the transcriptional regulatory mechanisms of TaDofs. Finally, we identified possible functions of TaDofs by alignment to those Dof genes with experimentally determined functions in other plant species.

2. Materials and Methods

2.1. Identification and Classification the Dof Gene Family Members from Wheat

The reference genome and protein sequences of hexaploid wheat were downloaded from the International Wheat Genome Sequencing Consortium website (IWGSC RefSeq v1.1, https://wheat-urgi.versailles.inra.fr/Seq-Repository/Assemblies) [27]. Dof sequences of Arabidopsis, maize, and rice were downloaded from the TAIR10 database (http://www.arabidopsis.org/index.jsp, Arabidopsis Information Resource), the MaizeGDB database (https://www.maizegdb.org/, Maize Genetics and Genomics Database), and the RGAP database (http://rice.plantbiology.msu.edu/, Rice Genome Annotation Project), respectively. Dof protein sequences were used as queries to perform BLASTp searches against the wheat proteins with expected cutoff values ≤ 1e-5. All hits were retrieved and further searched using the Hidden Markov Model (HMM) profile of the Dof domain (PF002701) downloaded from the Pfam website (http://pfam.sanger.ac.uk/search). All resulting sequences were analyzed by Pfam to verify the presence of the Dof-specific structural conserved domain.

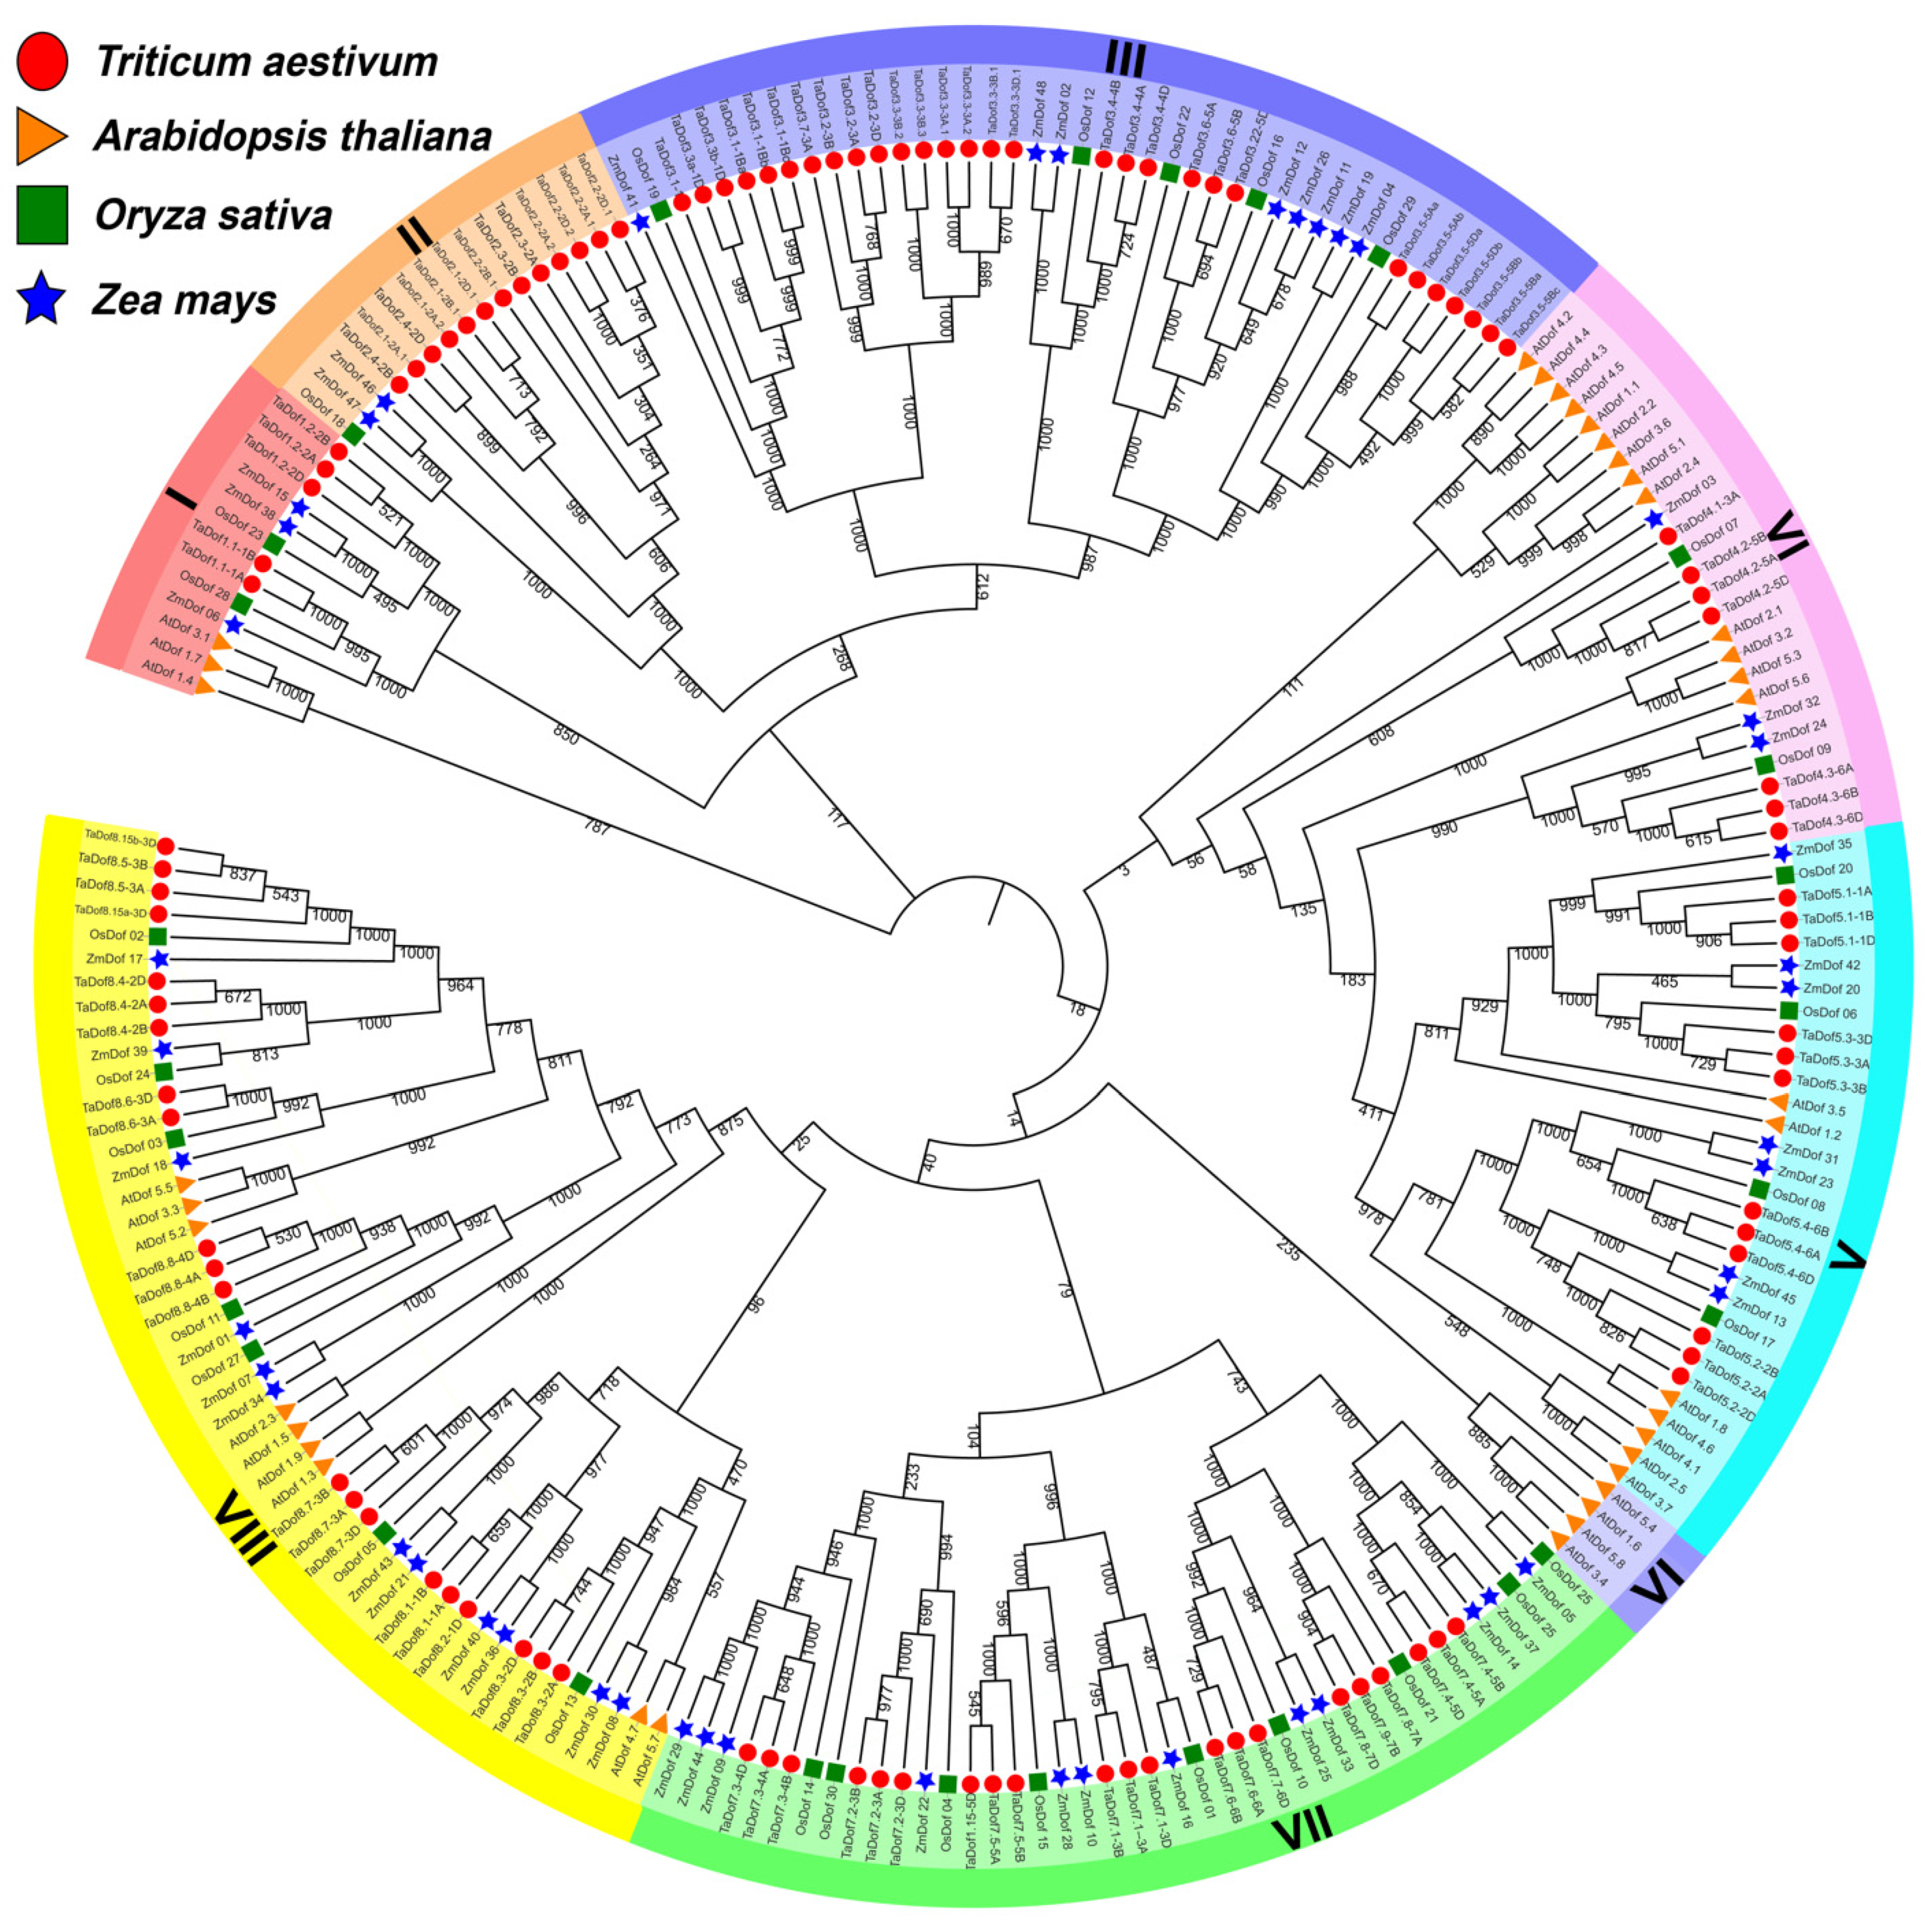
2.2. Phylogenetic Analysis of Dof Genes

The global alignment of protein sequences was performed by ClustalW2.1 with default parameters. Then, an unrooted phylogenetic tree was constructed with MEGA7.0 software using a Maximum Likelihood (ML) method based on an LG model, and 1000 bootstrap test replicates were used during the construction with other parameters as default [28]. Interactive Tree of Life (IToL, version3.2.317, http://itol.embl.de) was used to produce a midpoint rooted base tree.

2.3. Chromosomal Locations

The chromosomal locations of TaDof genes were extracted from genome annotation documents (GFF3 file) in the IWGSC v1.1 database. R package “LinkageMapView” was used to draft a map for the distribution map of Dof genes in corresponding chromosomes.

2.4. Characterization of Predicted TaDof Proteins

Physico-chemical features of the TaDof proteins, including length, molecular weight, theoretical isoelectric point, instability index, atomic composition, and amino acid composition were predicted using the protein identification and analysis tools in ExPASy Server10 (https://prosite.expasy.org/). Sub-cellular localizations of TaDof proteins were predicted using Plant-mPLoc (http://www.csbio.sjtu.edu.cn/bioinf/plant-multi/).

2.5. Analysis of Dof Motifs and Gene Structures

Annotation information related to TaDofs was examined using webtool GSDS (http://gsds.cbi.pku.edu.cn/index.php) to predict TaDof gene structure, intron and exon distribution, and intron and exon boundaries. Conserved sequences in the TaDof genes were identified using MEME Suite and MAST Primer Search software tools [28]. The parameters were established using known Dof protein sequences from Arabidopsis, rice and maize, and were then applied to identify conserved sequences in TaDofs as follows: each sequence could contain any number of non-overlapping occurrences of each motif, the total number of different motifs was 20, and motif length ranging from 6 to 50 aa. The functions of the predictive motifs were analyzed using InterPro (http://www.ebi.ac.uk/interpro) and SMART (http://coot.embl-heidelberg.de/SMART), and TBtools software (https://github.com/CJ-Chen/TBtools) was used for graphical visualization [29].

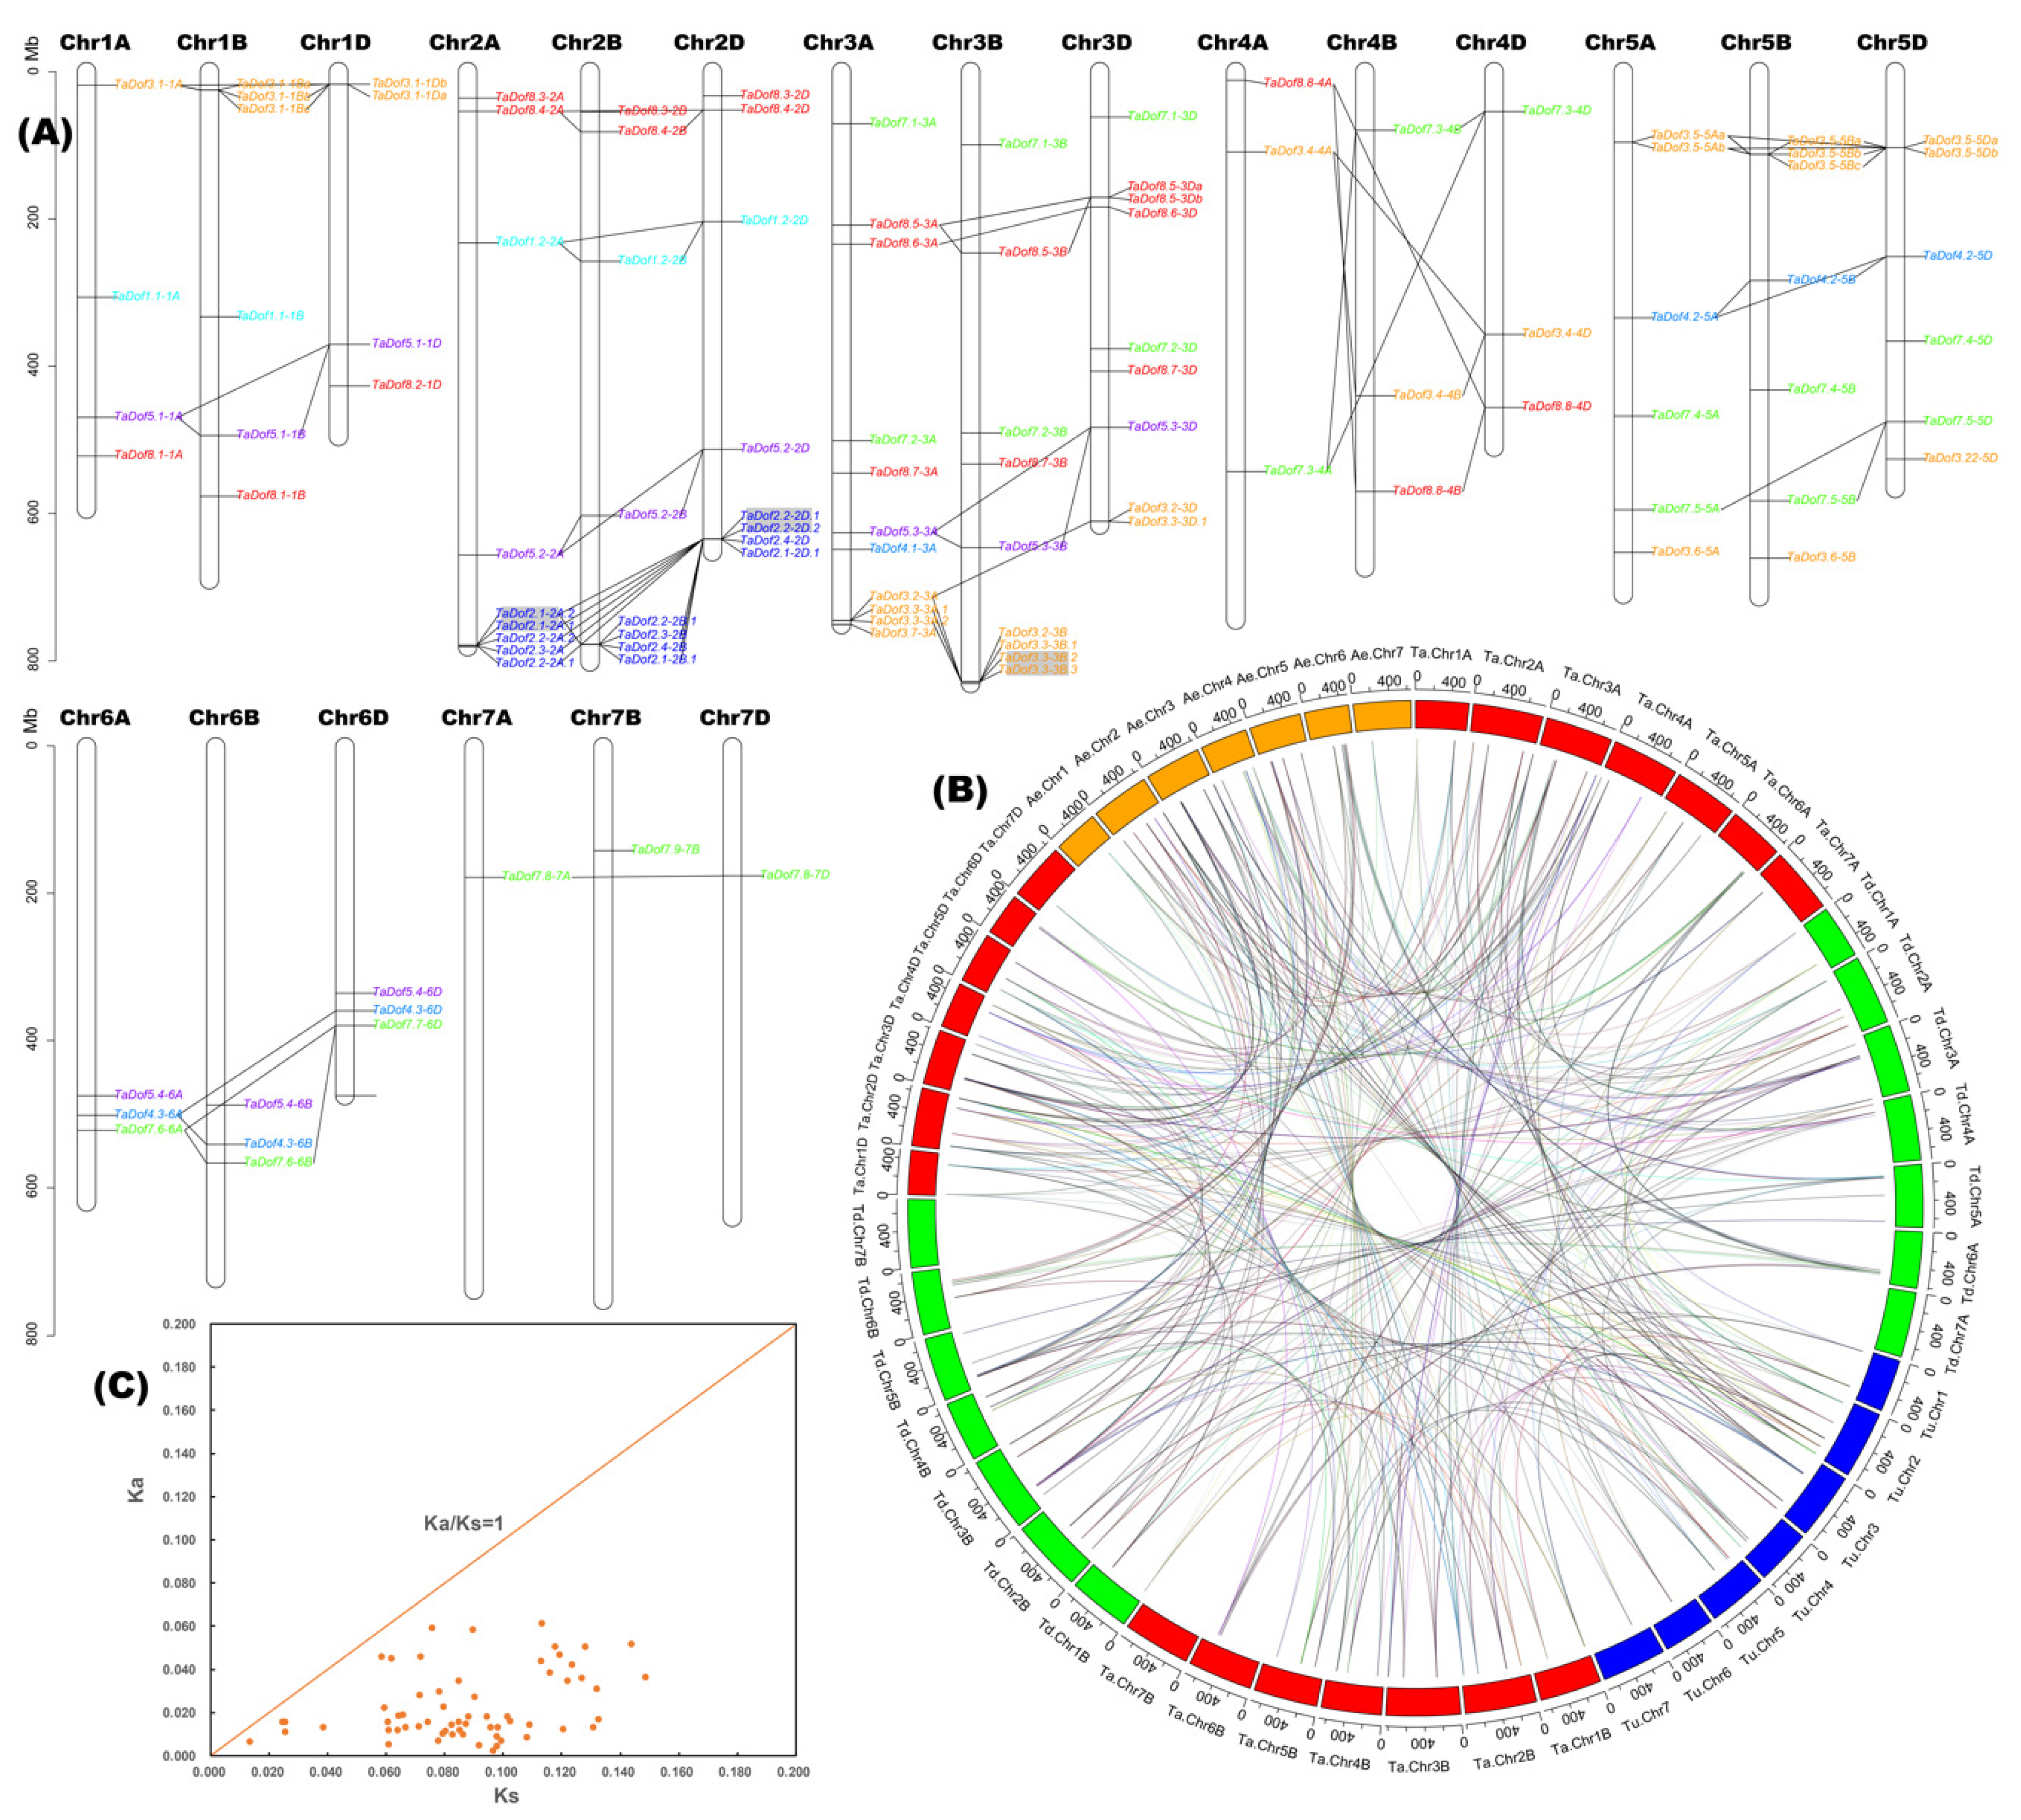
2.6. Gene Duplication and Ka/Ks Analyses

Gene duplications were classified into tandem duplication and segmental duplication events. Tandem duplication was determined using the following judgement criteria: (1) Length of the aligned region > 80%; (2) identity > 80%; (3) threshold ≤ 10−10; (4) only one duplication can be admitted when genes are closely linked; and (5) intergenic distance < 25 kb. If gene pairs meet criteria (1), (2) and (3) and located on different chromosomes, they were considered as segmental duplications [29]. After identification of a duplication, the Ks value and Ka/Ks ratio were calculated, and selection pressure and selection mode were analyzed. Information including the IDs of duplication gene pairs and the corresponding CDS sequences were collected. And the files containing this information were transformed into the form required by software TBtools, then were put into TBtools to calculate the Ka and Ks values and Ka/Ks ratios by using a built-in function called Simple Ka/Ks Calculator which uses muscle to do the codon alignment. The formula T = Ks/2λ × 10−6 Mya was used to estimate the time (T) of duplication in millions of years (Mya), where λ = 6.5 × 10⁻⁹ represented the rate of replacement of each locus per herb plant year [30]. The reference genomes of Aegilops tauschii (DD), T. urartu (AA), and T. dicoccoides (AABB) were download from NCBI, and Dof gene identification followed the same procedure as for TaDof genes. The duplication gene pairs between species were identified and used to carry out the inter-species synthetic analysis using R package “circlize”.

2.7. Functional Annotation Sub-Cellular Localization Prediction, and Experimental Confirmation

Multiple databases, including GO (Gene Ontology), were used to perform functional annotation of TaDof genes [31,32]. For experimental confirmation, total RNA of wheat was extracted using a Plant RNA Kit (Omega, London, UK) and cDNA was synthesized using RevertAid First Strand cDNA Synthesis Kit (Thermos Scientific, Madison, WI, USA). Full length TaDofs were amplified by Phanta HS Master Mix (Vazyme, Nanjing) using corresponding primers (Additional file 1: Table S1) (synthesized by Sangon Biotech, Shanghai, China). After linearization with XhoI (NEB, Nanjing, China), the plant expression vector pART27:GFP was purified by a Cycle-pure Kit (Omega). PCR products were inserted into lined pART27:GFP using ClonExpress II One Step Cloning Kit (Vazyme). Positive clones were transformed into Agrobacterium tumefaciens for transient expression in leaves of Nicotiana benthamiana. A fluorescence microscope (Olympus FV3000, Tokyo, Japan) was used to observe sub-cellular localization after three days.

2.8. Expresssion Pattern Analysis of TaDofs Using Lager-Scale Transcriptome Data

The original transcriptome data were obtained from a comprehensive study of wheat expression profiles following 337 different situations [33]. The expression profiles of TaDof genes represented by TPM (transcripts per million) were manually extracted and used to generate the expression heatmap and overview boxplot using R package “pheatmap” and R function “boxplot”.

2.9. Identification of miRNA and Cis-Regulatory Element

To identify miRNAs targeting TaDofs, mature miRNA sequences from wheat and TaDofs sequences were submitted to the online tool psRNATarget set with default parameters [34]. For promoter analysis, 1.5 Kb sequences upstream of the transcription start site of TaDof genes were retrieved and subjected to search for cis-regulatory elements by the CARE program (http://bioinformatics.psb.ugent.be/webtools/plantcare/html/) in the PlantCARE database [35].

2.10. Real Time-Quantitative PCR (RT-qPCR)

Two-leaf wheat seedlings (cultivar Emai 170) were treated with mannitol (15.03 g/L), NaCl (2.41 g/L), and PEG with an osmotic potential of −0.5 MPa (84.36 g/L). Normal growth seedlings were used as control. Leaf and root tissues were harvested after 2, 4, 8, 12, 24, 72, and 120 h. Total RNA was extracted using a Plant RNA Kit (Omega) and cDNA was synthesized using a RevertAid First Strand cDNA Synthesis Kit (Thermos Scientific) from 1 μg RNA. qRT-PCR was performed on a CFX 96 Real-Time PCR system (Bio-Rad, Hercules, CA, USA) using 20 µL reaction system, including 10 µL of SYBR Green Master Mix (Vazyme), 1 µL of each primer (10 µM), 2 µL of template (about 100 ng/µL), and 6 µL of ddH2O, to explore the expression levels of TaDofs genes. The protocol was carried out as following: pre-denaturation at 95 °C for 30 s (step 1), denaturation at 95 °C for 5 s (step 2), and primer annealing/extension and collection of fluorescence signal at 60 °C for 20 s (step 3). The next 40 loops started in step 2. ADP-ribosylation factor Ta2291 (Forward: GCTCTCCAACAACATTGCCAAC, Reverse: GCTTCTGCCTGTCACATACGC) was used as housekeeping gene for qRT-PCR analysis. Relative quantities were calculated using the 2−△△ct method [36]. Each sample was assayed in three replications, and each replication contains two technical repeats. Primers used for real-time PCR are listed in Additional file 1: Table S2 (synthesized by Sangon Biotech, Shanghai, China).

3. Results

3.1. Identification of 108 TaDofs in Seven Sub-Groups

Dof family members (TaDofs) in wheat were identified by a genome-wide search by the Hidden Markov Model (HMM) and BLASTp analyses using Dof genes from Arabidopsis (36), maize (47), and rice (30) as queries (Additional file 1: Table S3). One hundred and eight non-redundant full-length TaDofs were identified (Additional file 2: File S1). To examine their evolutionary relationships in wheat and the other plant species a phylogenetic tree was constructed by multiple sequence alignment of all 108 Dof proteins using the Maximum Likelihood (ML) method (Figure 1). The predicted TaDof genes were classified into seven sub-groups (I, II, III, IV, V, VII, and VIII) based on the phylogenetic tree and earlier reports [9]. Each TaDof was renamed based on its phylogenetic relationship with AtDofs [9]. Sub-group III contained the largest number of TaDofs (29 genes, 26.85%), followed by sub-groups VII (22, 20.37%) and VIII (22, 20.37%). Sub-group VI had only four members, that were present only in Arabidopsis, hence indicating that they may be dicot-specific. Alternative splicing of isoforms was predicted for TaDof3.1-1B, TaDof3.1-1D, TaDof3.5-5A, TaDof3.5-5B, TaDof3.5-5D, and TaDof8.5-3D (Table 1).

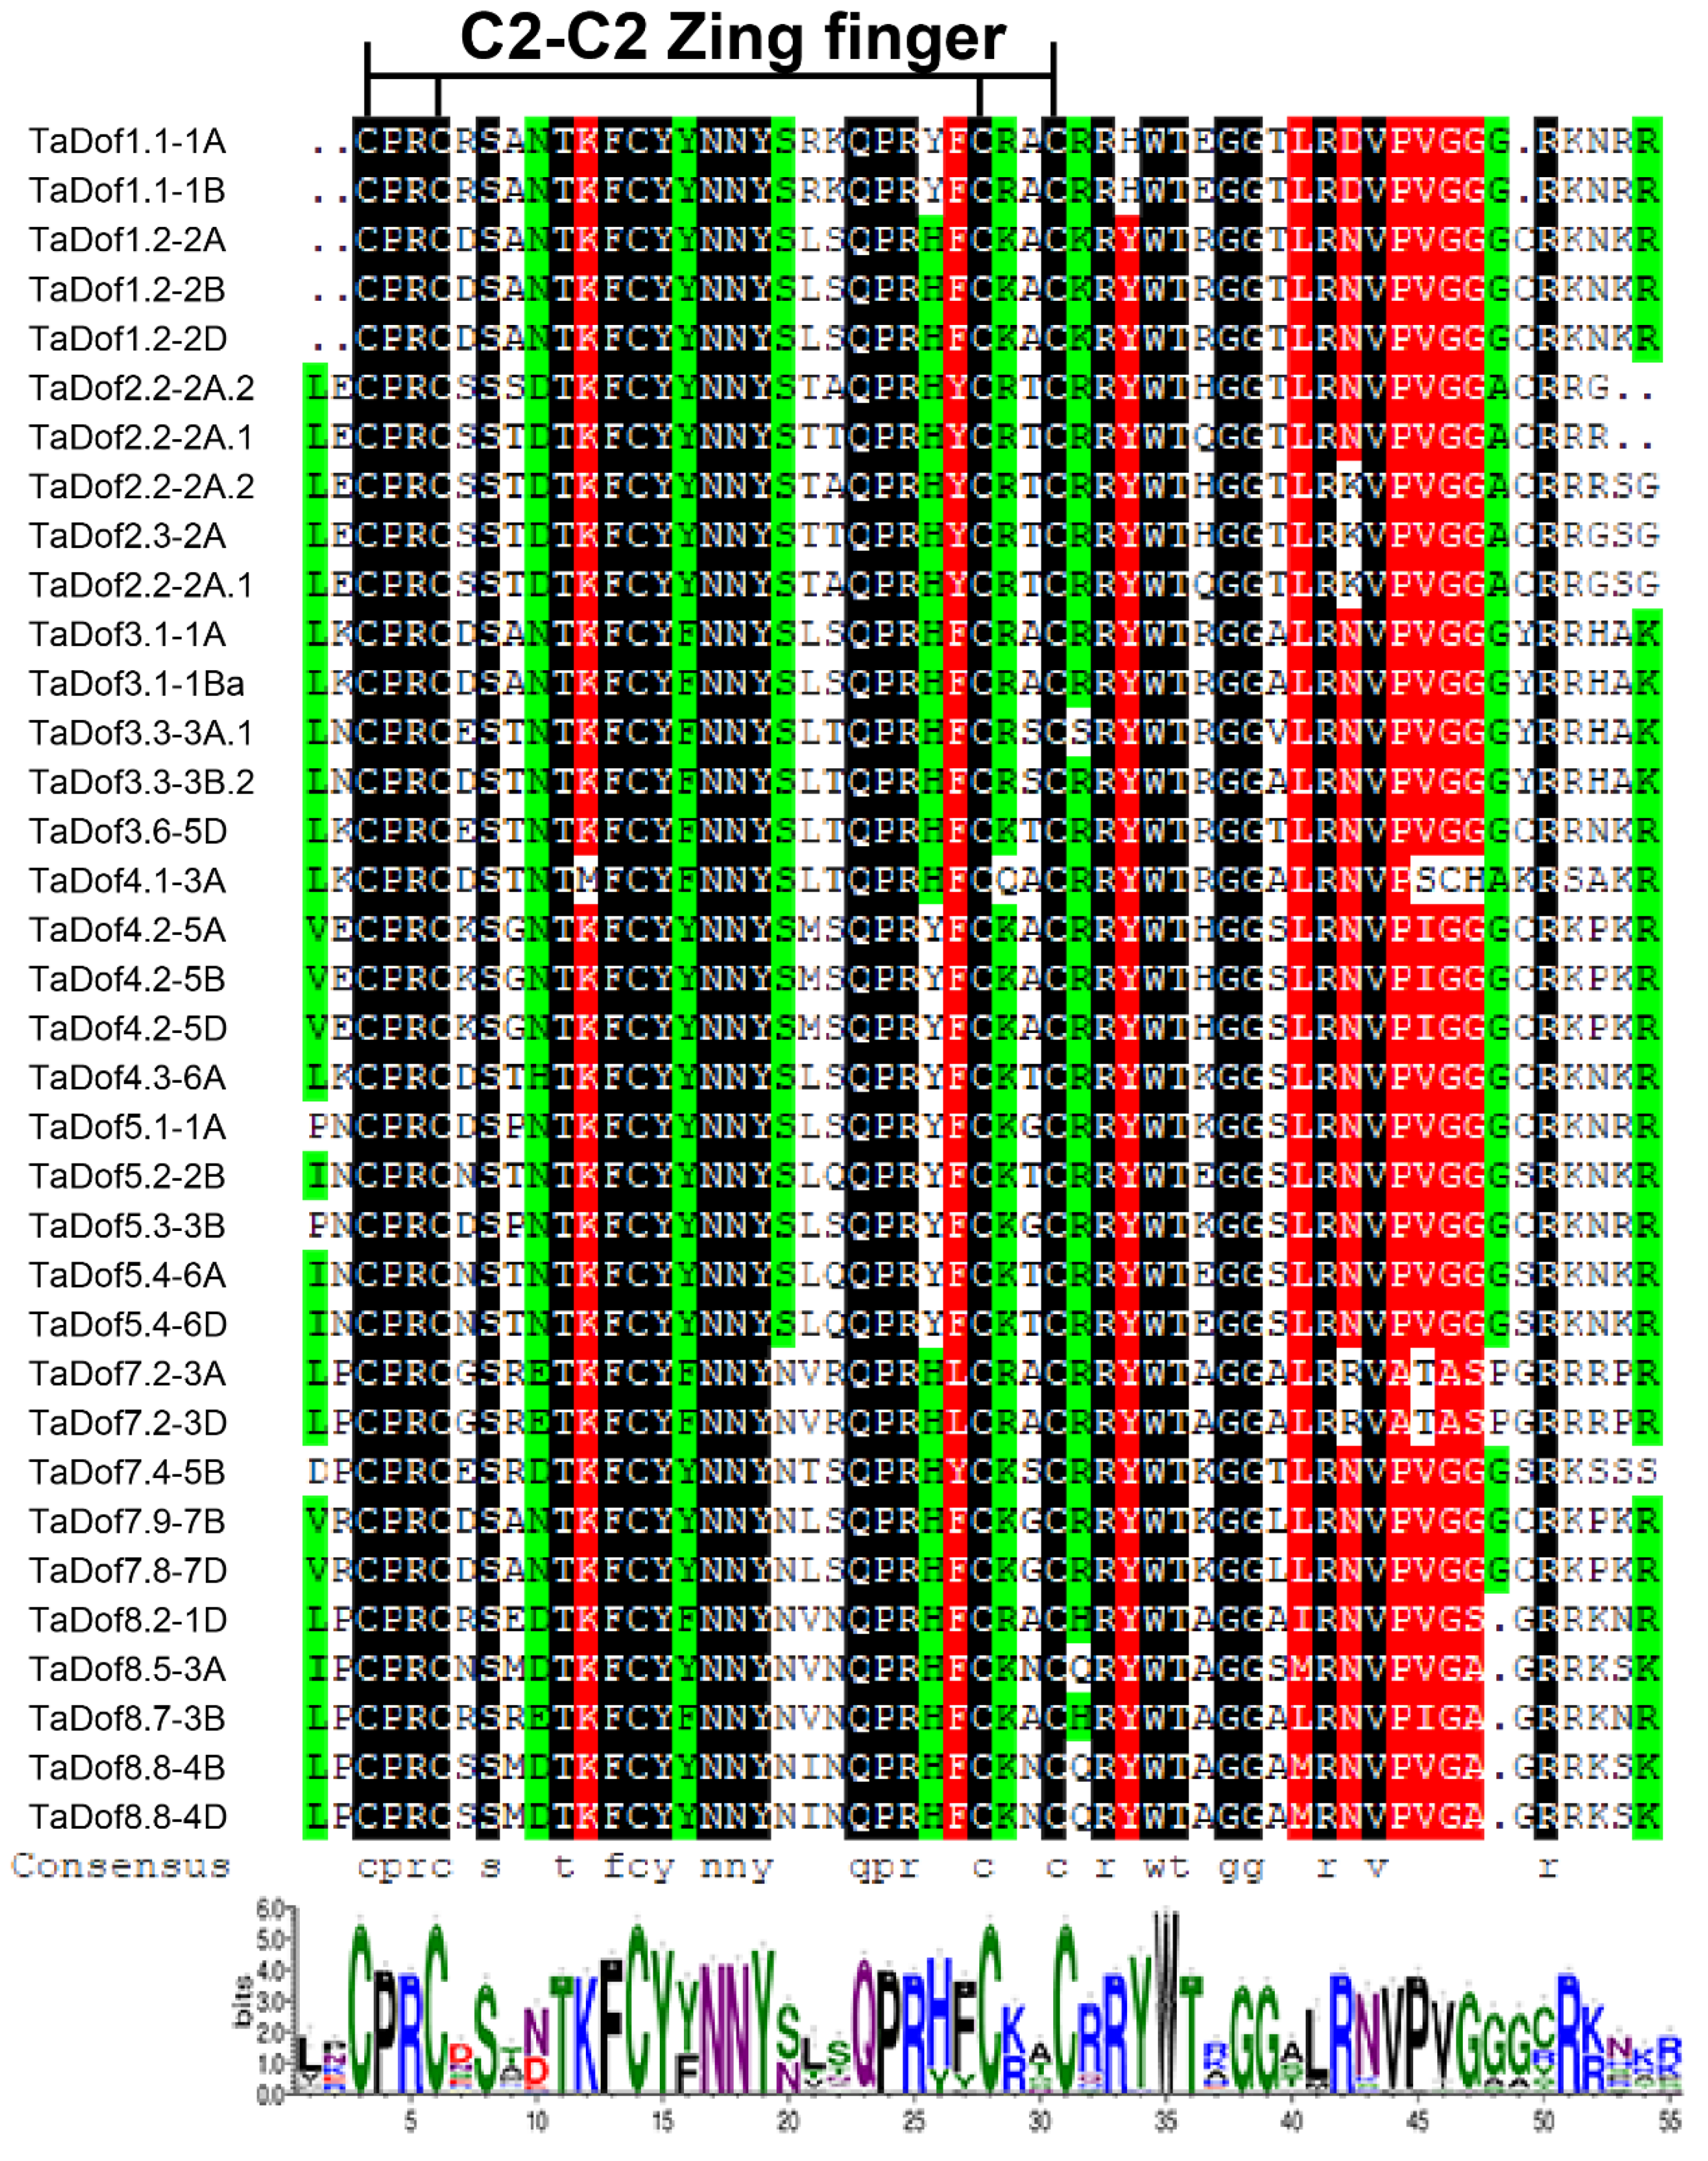
3.2. The Variable TaDof Proteins Contain a Conserved Zinc-Finger Structure

ExPASy Server 10 (http://www.expasy.org/tools/) online analytical system was used to analyze the properties of the 108 TaDof proteins, including length, molecular weight (MW), isoelectric point (pI), grand average hydropathy (GRAVY), and instability index (Table 1). The lengths ranged from 152 (TaDof7.2-3D) to 631 (TaDof4.1) amino acids (average length 329 aa); MWs ranged from 15.76 kDa (TaDof7.2-3D) to 69.61 kDa (TaDof4.1); theoretical pIs ranged from 4.66 (TaDof5.3-3D) to 10.46 (TaDof7.2-3A/7.4/7.6); and the instability indices varied from 42.25 (TaDof4.2-5A) to 83.66 (TaDof2.2-2B.1), indicating that all were unstable. GRAVY analysis showed that all TaDof proteins were hydrophilic. Protein characterization revealed that TaDofs are hydrophilic, unstable, and variable in length, MW, and pI (Table 1).
Generally, Dof proteins have a DNA-binding domain of 40–60 amino acid residues at the N-terminus. Multiple sequence alignment analysis revealed that all TaDofs contained a typical ZF-Dof domain, including a highly conserved repeat containing four cysteines to combine with zinc ions. This domain has a highly conserved CX2CX21CX2C single structure that is essential for the zinc finger configuration and loop stability. Multiple protein sequence alignments of Dof DNA-binding domains revealed that all included 17 highly conserved amino acids “CPRC-S-T-FCY-NNY-QPR-C-C” in the 29 amino acid residues containing the CX2CX21CX2C single zinc-finger structure (Figure 2).

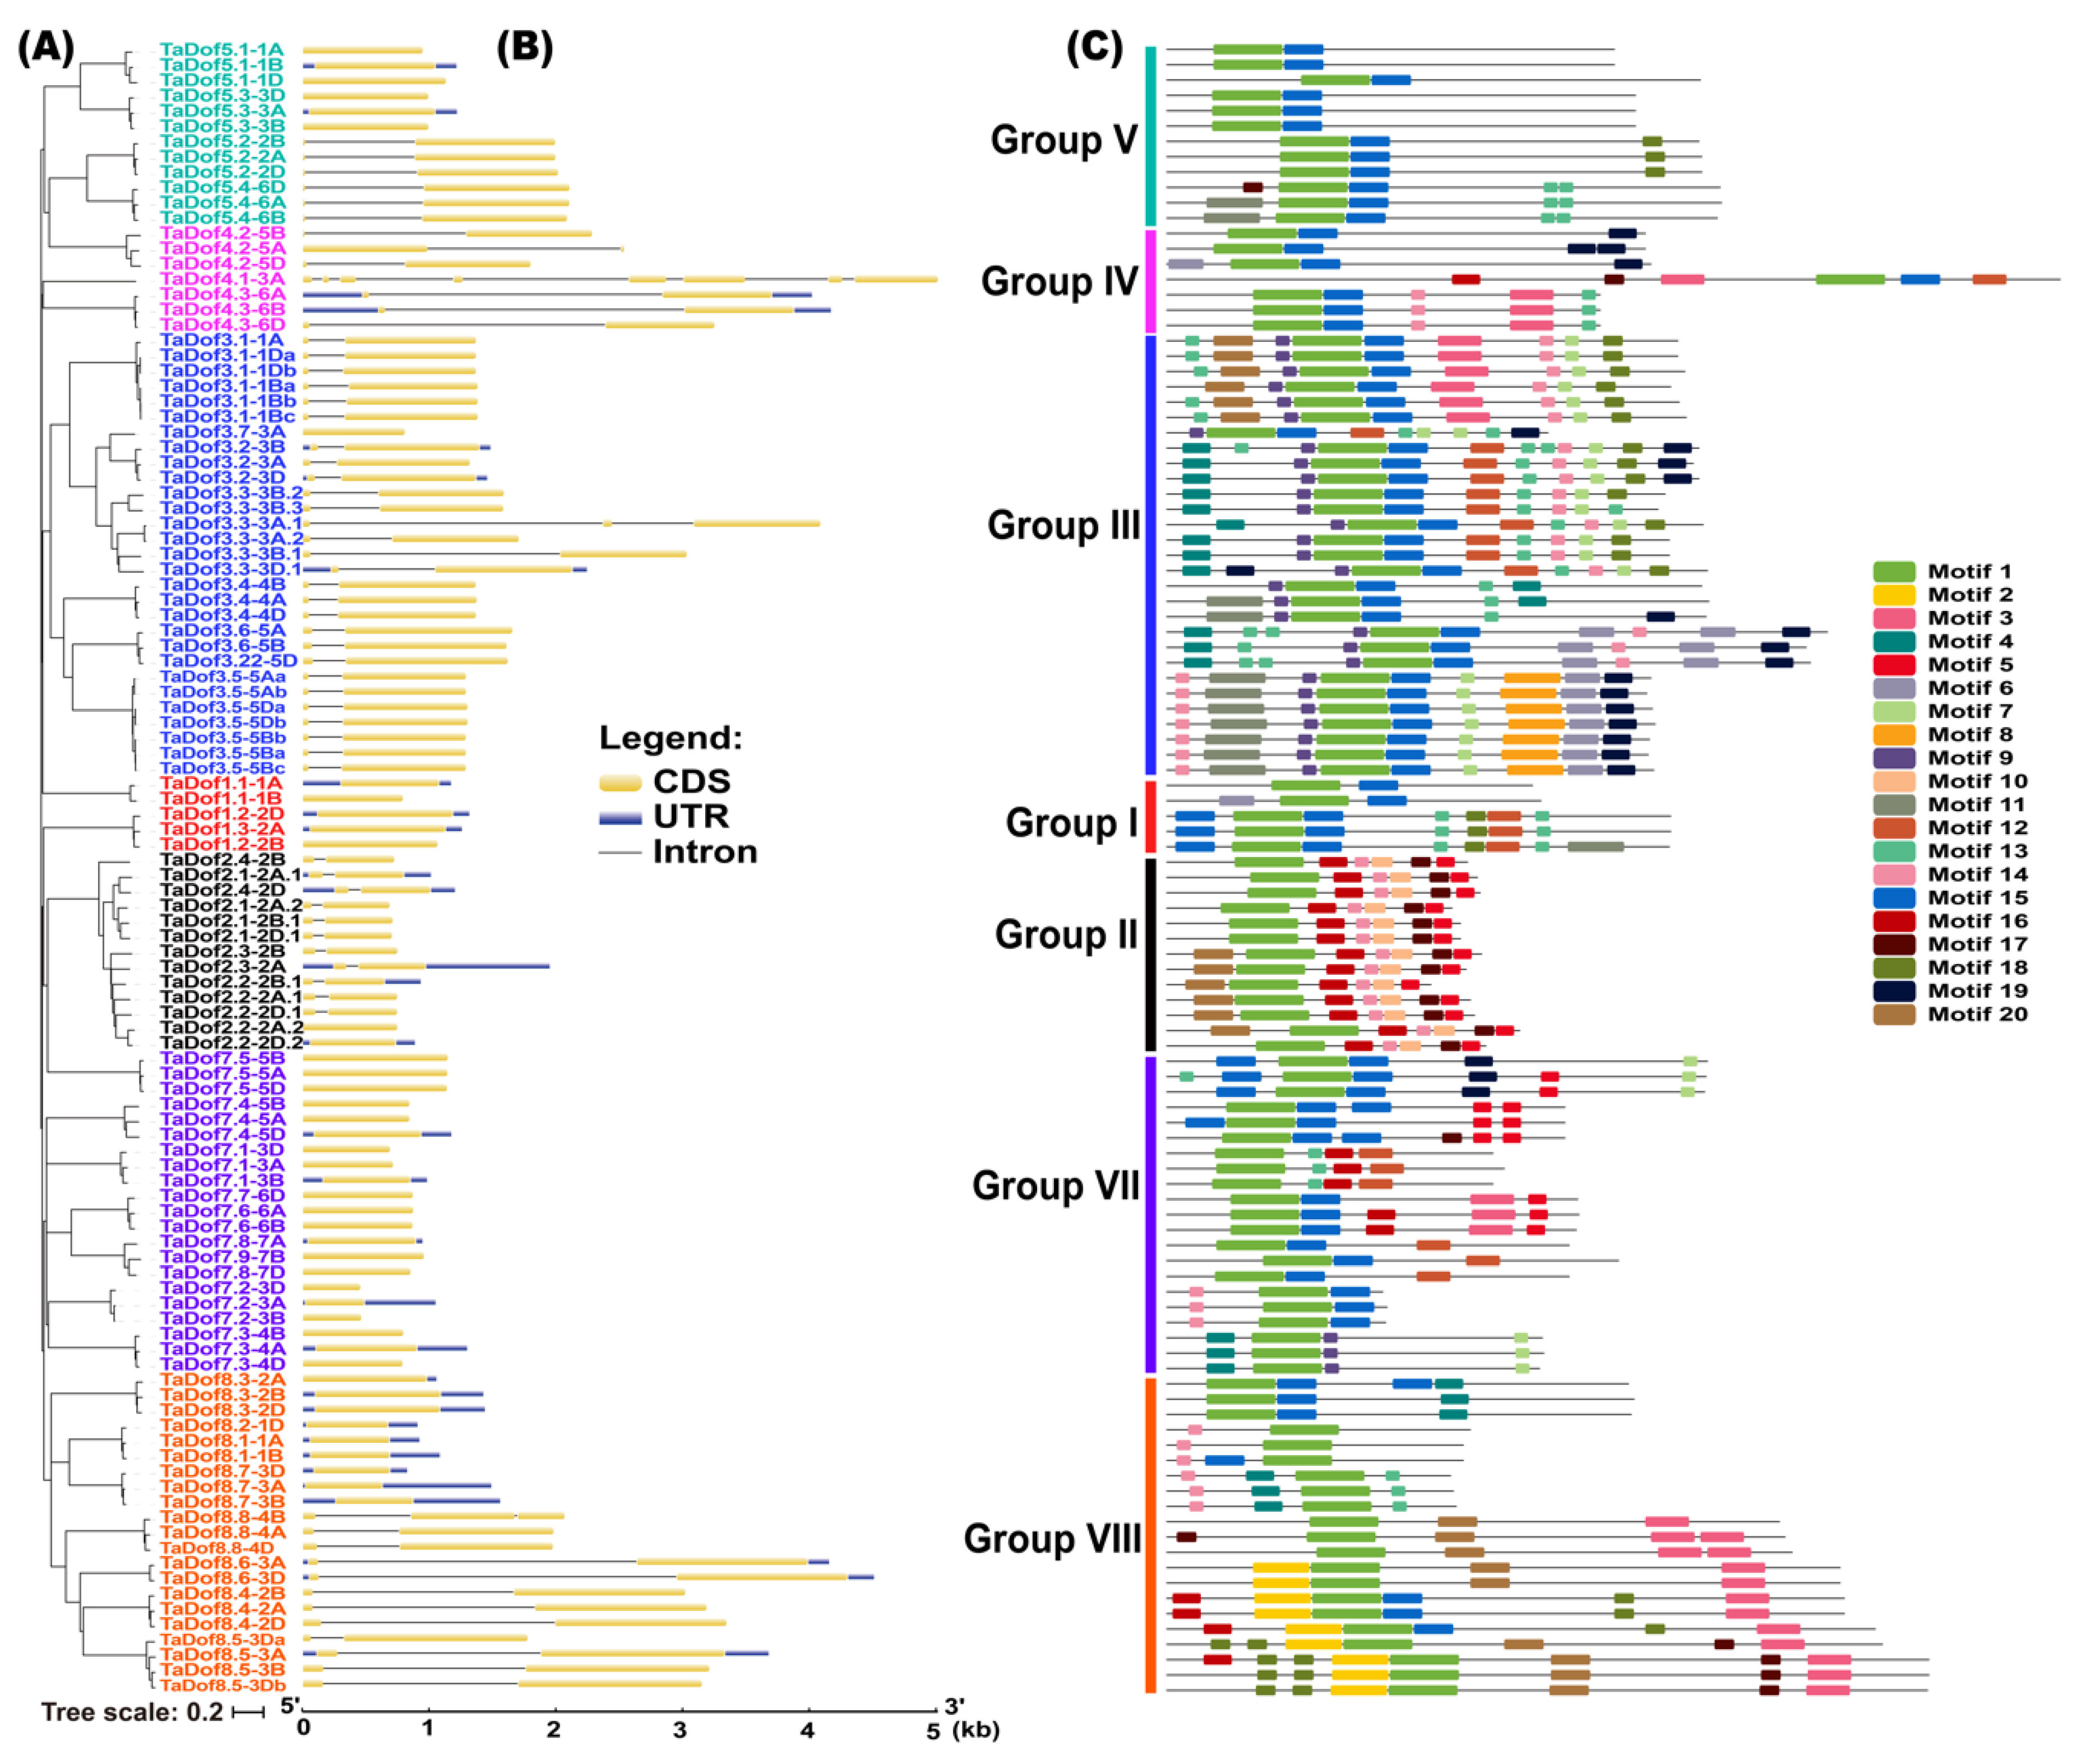
3.3. Gene Structure and Conserved Motifs Are Similar Intragroup but Diverse Intergroup

Exon–intron structural diversity often has a role in the evolution of gene families and could provide information regarding duplication events and evolutionary patterns within gene families [37,38]. The phylogenetic relationships of TaDofs were shown in Figure 3A, and the intron/exon distribution patterns of the TaDof genes were shown in Figure 3B. Most of them had zero to two introns, but TaDof4.1 had seven introns. Sub-group I and VII genes had no introns. Among the 13 sub-group II genes, 11 contained one intron, and 2 (TaDof2.1-2A.2 and TaDof2.2-2D.1) had none. The numbers of introns in sub-groups III and VIII varied from 0 to 2; TaDof3.3-3A.1 and TaDof8.8-4B contain two, TaDof3.3-3A.3 and remaining 11 contained none. Most sub-group IV genes had one intron, except for TaDof4.1, which contained seven. Six sub-group V genes contained one intron and six had none. Generally, there were similar numbers and lengths of exons and introns in the same sub-group (Figure 3B). Divergence between groups suggest that TaDof genes are evolving into more diverse exon–intron structures as a means of functional diversification.
The locations of conserved domains were determined by SMART and were visualized by the MEME program to reveal TaDof gene diversification. Twenty conserved motifs, namely 1 to 20, were identified (Figure 3C and Additional file 1: Table S4). The number of motifs in each TaDof protein ranged from two to 12; all TaDofs contained motif 1 and most of them had motif 15 (Additional file 3: Figure S1). Some sub-group-specific motifs, such as motif 10 and motifs 4 and 9 were identified only in sub-groups II and III, respectively. TaDofs that clustered together in the phylogenetic tree usually contained similar motifs, suggesting similar functions of TaDofs within the same sub-group. The results of gene structures and motif locations thus indicated that most members were conserved within sub-groups, but showed divergence between sub-groups.

3.4. Polyploidization is the Main Basis of Member Expansion of TaDofs

Distribution and synteny of family members were analyzed to better understand the chromosomal locations and duplication events in TaDofs. According to the genomic location of each TaDof family member, we used R package “LinkageMapView” to draft a chromosome distribution map of TaDof genes (Figure 4A, Additional file 1: Table S5). TaDof genes were distributed across all 21 wheat chromosomes, with numbers in each chromosome ranging from one to 11. The distribution was not random; there were several regions with three to five TaDofs clustered together. For example, chromosome 2B had four TaDofs in a short chromosome region (about 200 Kb), and chromosome 3A had three TaDofs in a 300 Kb region. Only one TaDof gene, a member of Group VII, was located on each homoeologous group 7 chromosomes. The density of TaDof genes was highest (29, 26.85%) in homoeologous group 3 (Figure 4A). Gene duplication analysis detected 63 pairs, including three tandem and 60 segmental duplications. Tandem duplications caused gene clusters or hotspot regions, e.g., the cluster on homoeologous group 2 chromosomes (A, B, and D). Segmental duplications resulted in homologous genes, that potentially expand the number of TaDof gene groups. For example, TaDof7.8-7A, TaDof7.9-7B, and TaDof7.8-7D in chromosomes 7A, 7B, and 7D are homologous to each other and represented segmental duplications (Figure 4A, Additional file 1: Table S6).
The non-synonymous substitution rate (Ka), synonymous substitution rate (Ks), and Ka/Ks for the 63 duplicated pairs were calculated to reveal evolutionary constraints acting on all duplicated TaDof genes (Figure 4C, Additional file 1: Table S6). It is generally believed that the ratio of non-synonymous to synonymous mutation rates (Ka/Ks) can be used in evaluating the selection force of a coding sequence [30]. The Ka/Ks ratios for these 63 duplicated pairs were less than 1 (Figure 4C), implying that all duplicated gene pairs tended to be under negative selection pressure. The Ks values, which were used to estimate the time of occurrence of duplication events, indicated that 63 copies of Dof duplication genes occurred about 1.55 to 12.92 million years (average 7.17, 48 values in 63 earlier than 5.5) ago, the time period mostly before the wheat polyploidization event (Additional file 1: Table S6). Further syntenic analysis was extended to common wheat (AABBDD) and progenitor species Aegilops tauschii (DD), T. urartu (AA), and T. dicoccoides (AABB). Identical orthologues were found in similar genomic regions among the A, B, and D sub-genomes and their corresponding progenitors (Figure 4B, Additional file 1: Table S7). Summarizing the results of the above duplication events, Ka/Ks, intra- and inter-species syntenic analysis, it suggested that expansion of TaDof genes occurred with polyploidization, and hence that polyploidization was the main reason for high numbers of TaDof genes.

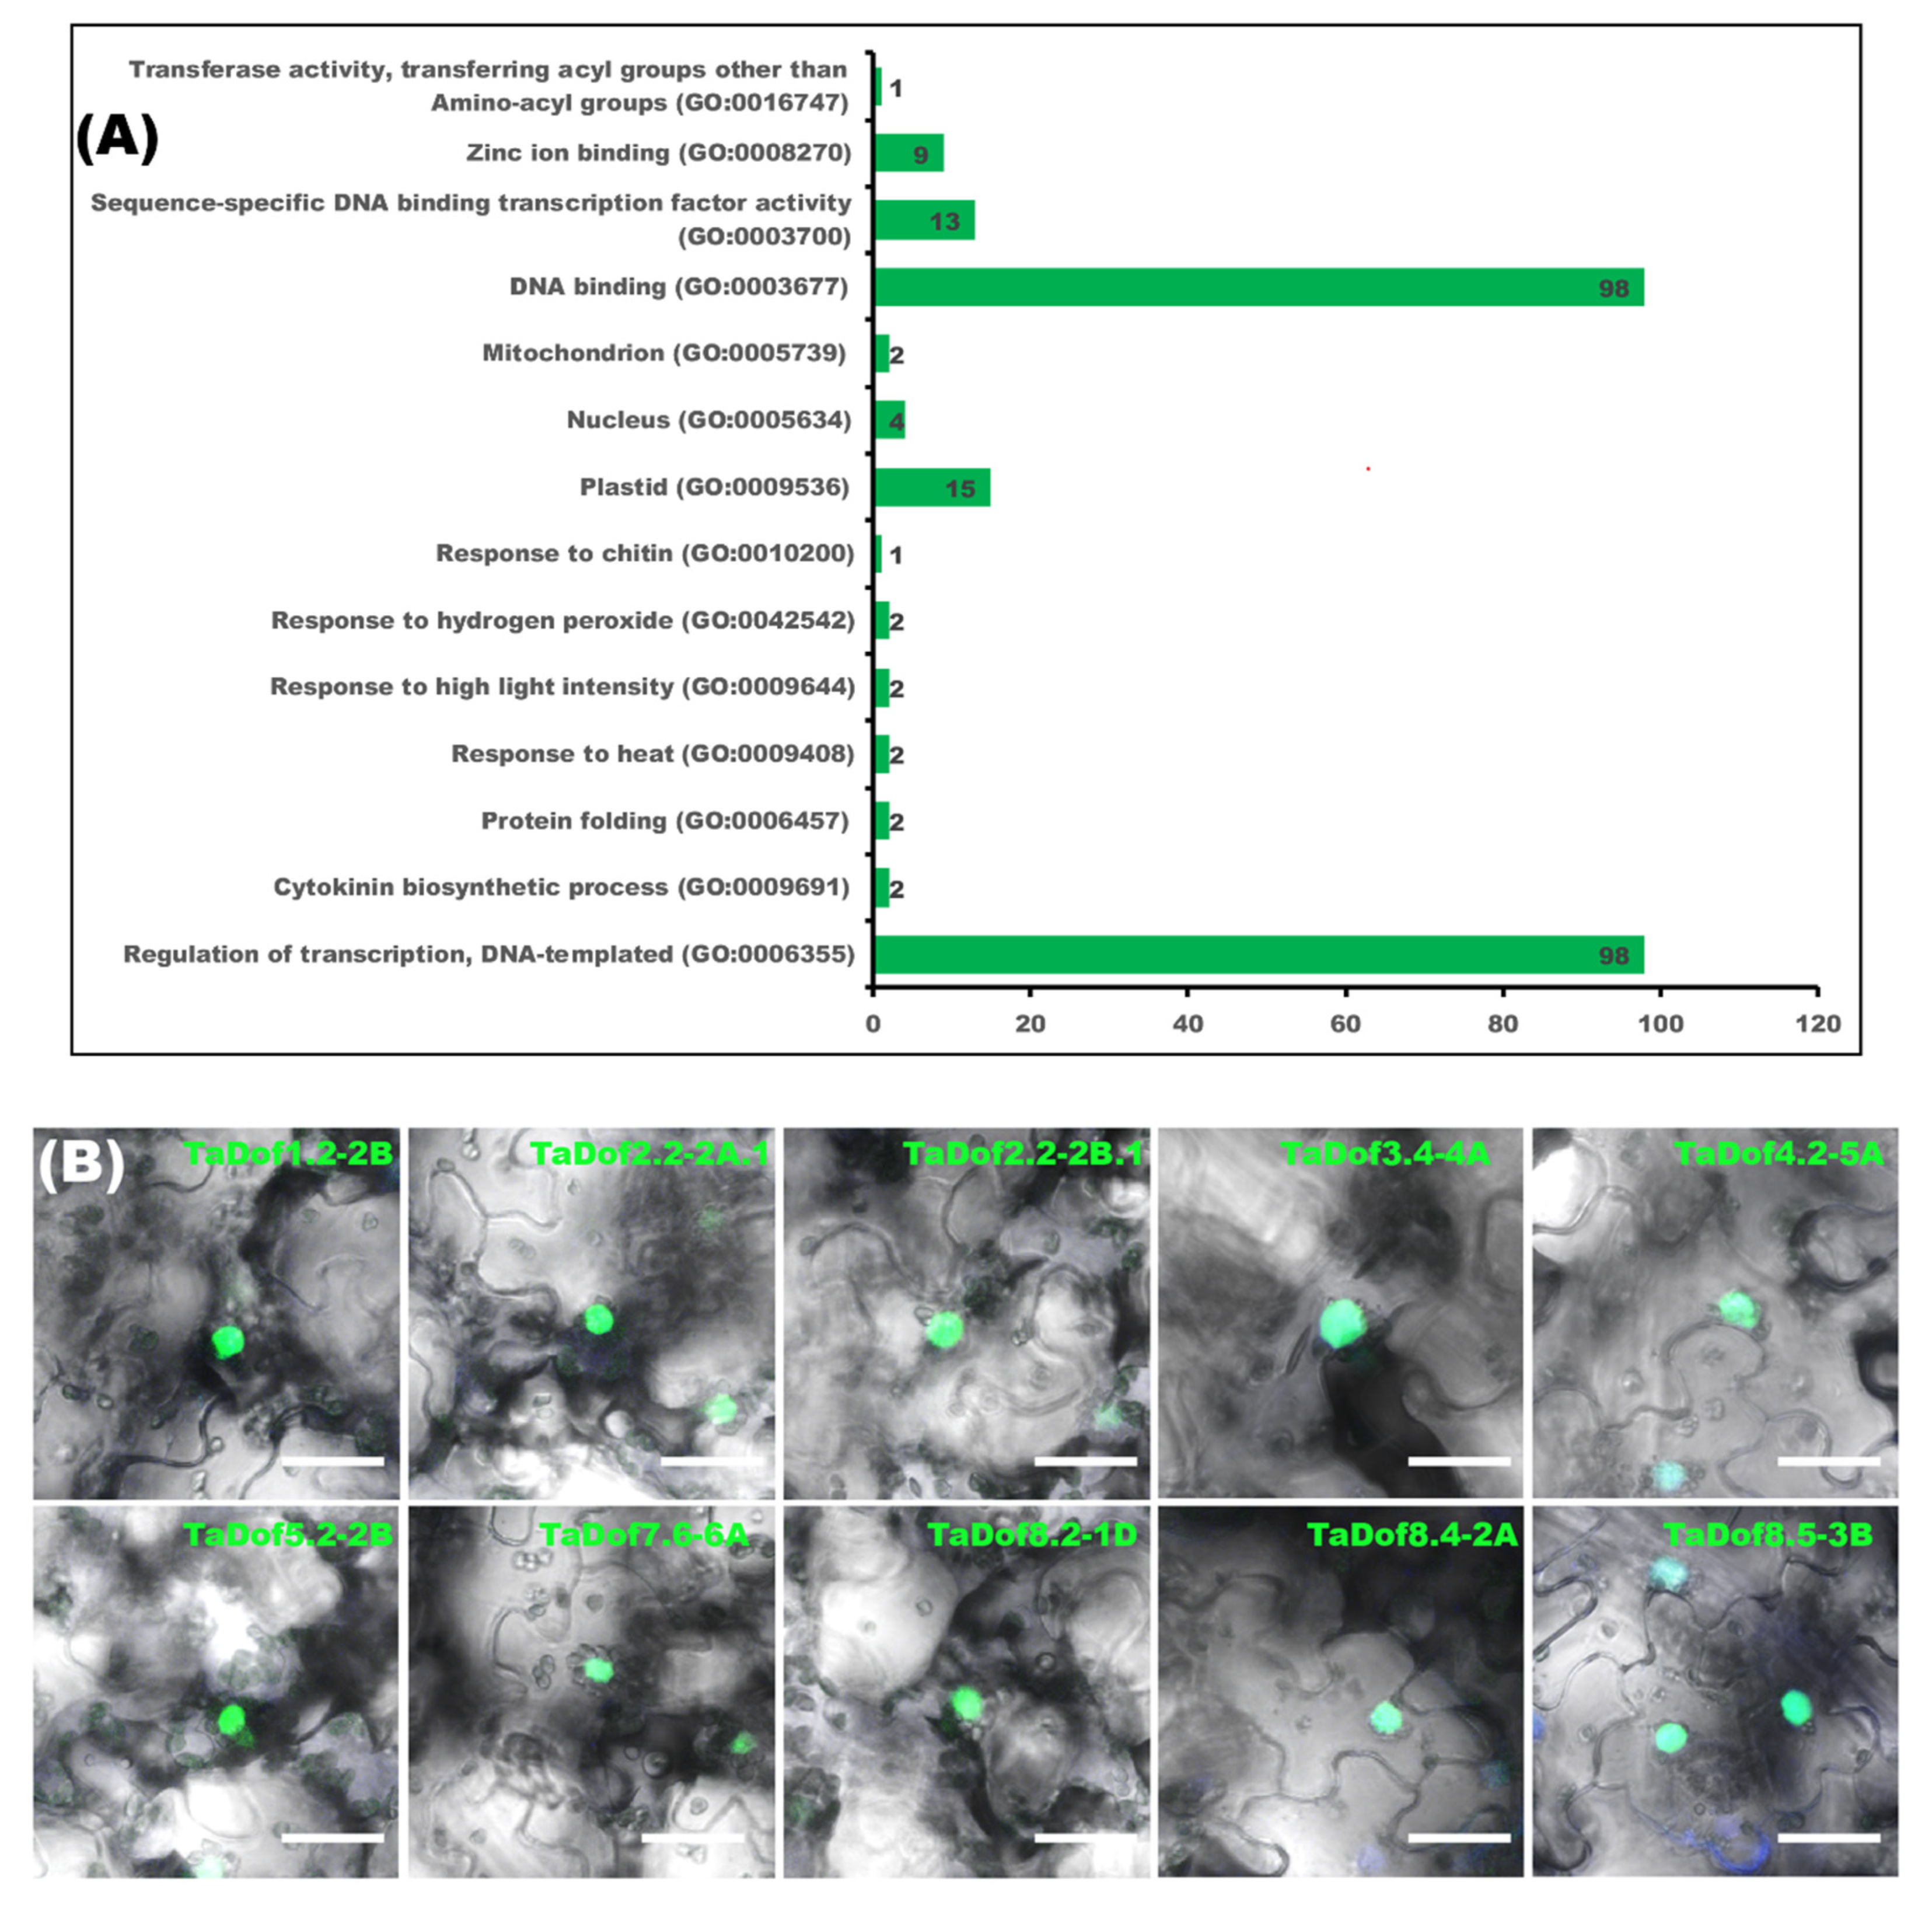
3.5. Nuclear Localizations of TaDofs Match Their Regulatory Roles during Transcription

Gene ontology (GO) annotation was performed to predict TaDof functions. Enrichment analysis showed that most TaDofs (98) were annotated under GO terms ‘regulation of transcription, DNA-templated’ (GO:0006355) and ‘DNA binding’ (GO:0003677). Several TaDofs (e.g., TaDof1.1-1A and TaDof1.1-1B) were annotated under ‘response to heat’ (GO:0009408), ‘response to high light intensity’ (GO:0009644), ‘response to hydrogen peroxide’ (GO:0042542), and ‘response to chitin’ (GO:0010200), implying multiple functions of TaDofs (Figure 5A, Additional file 1: Table S8). Sub-cellular localizations of TaDofs were predicted using the online tool Plant-mPLoc and all were localized in the nucleus, suggesting that they function as transcription factors in same cell compartment. To confirm the nuclear localizations, ten selected genes were constructed into the plant expression vector pART27:NGFP and transiently expressed in Nicotiana benthamiana leaves. Confocal microscopy confirmed their transcription factor roles, all ten were localized in the nucleus (Figure 5B).

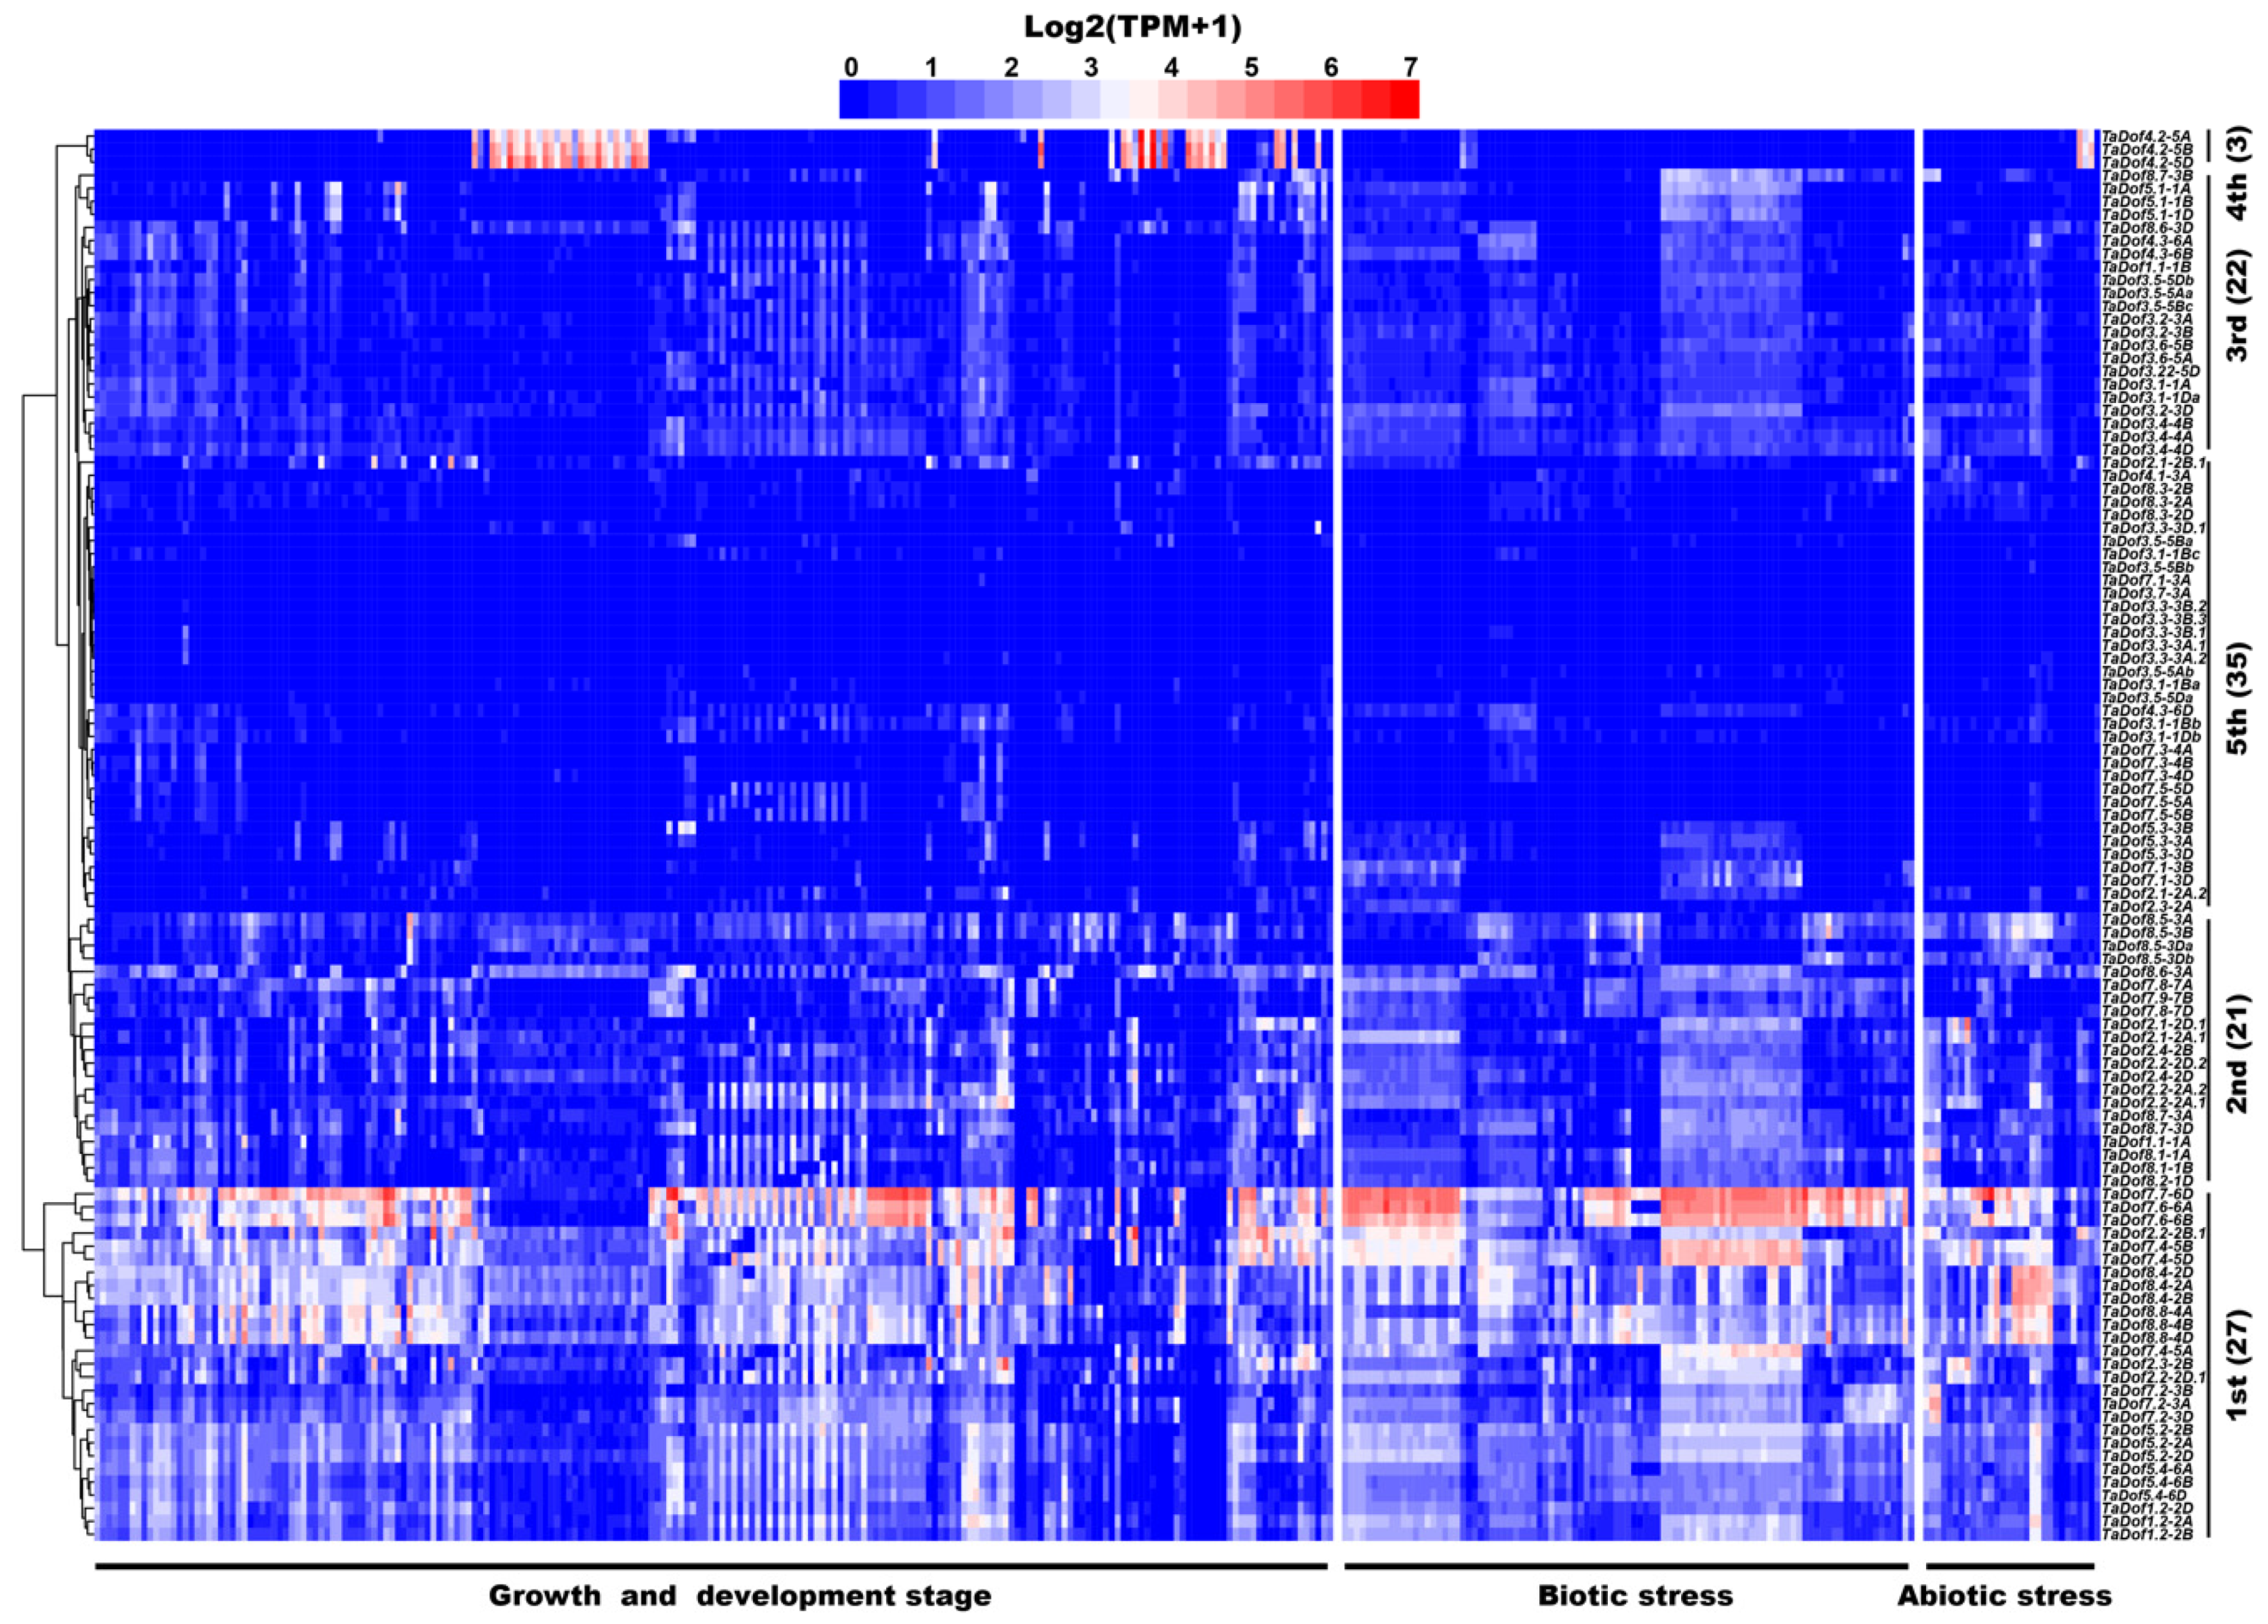
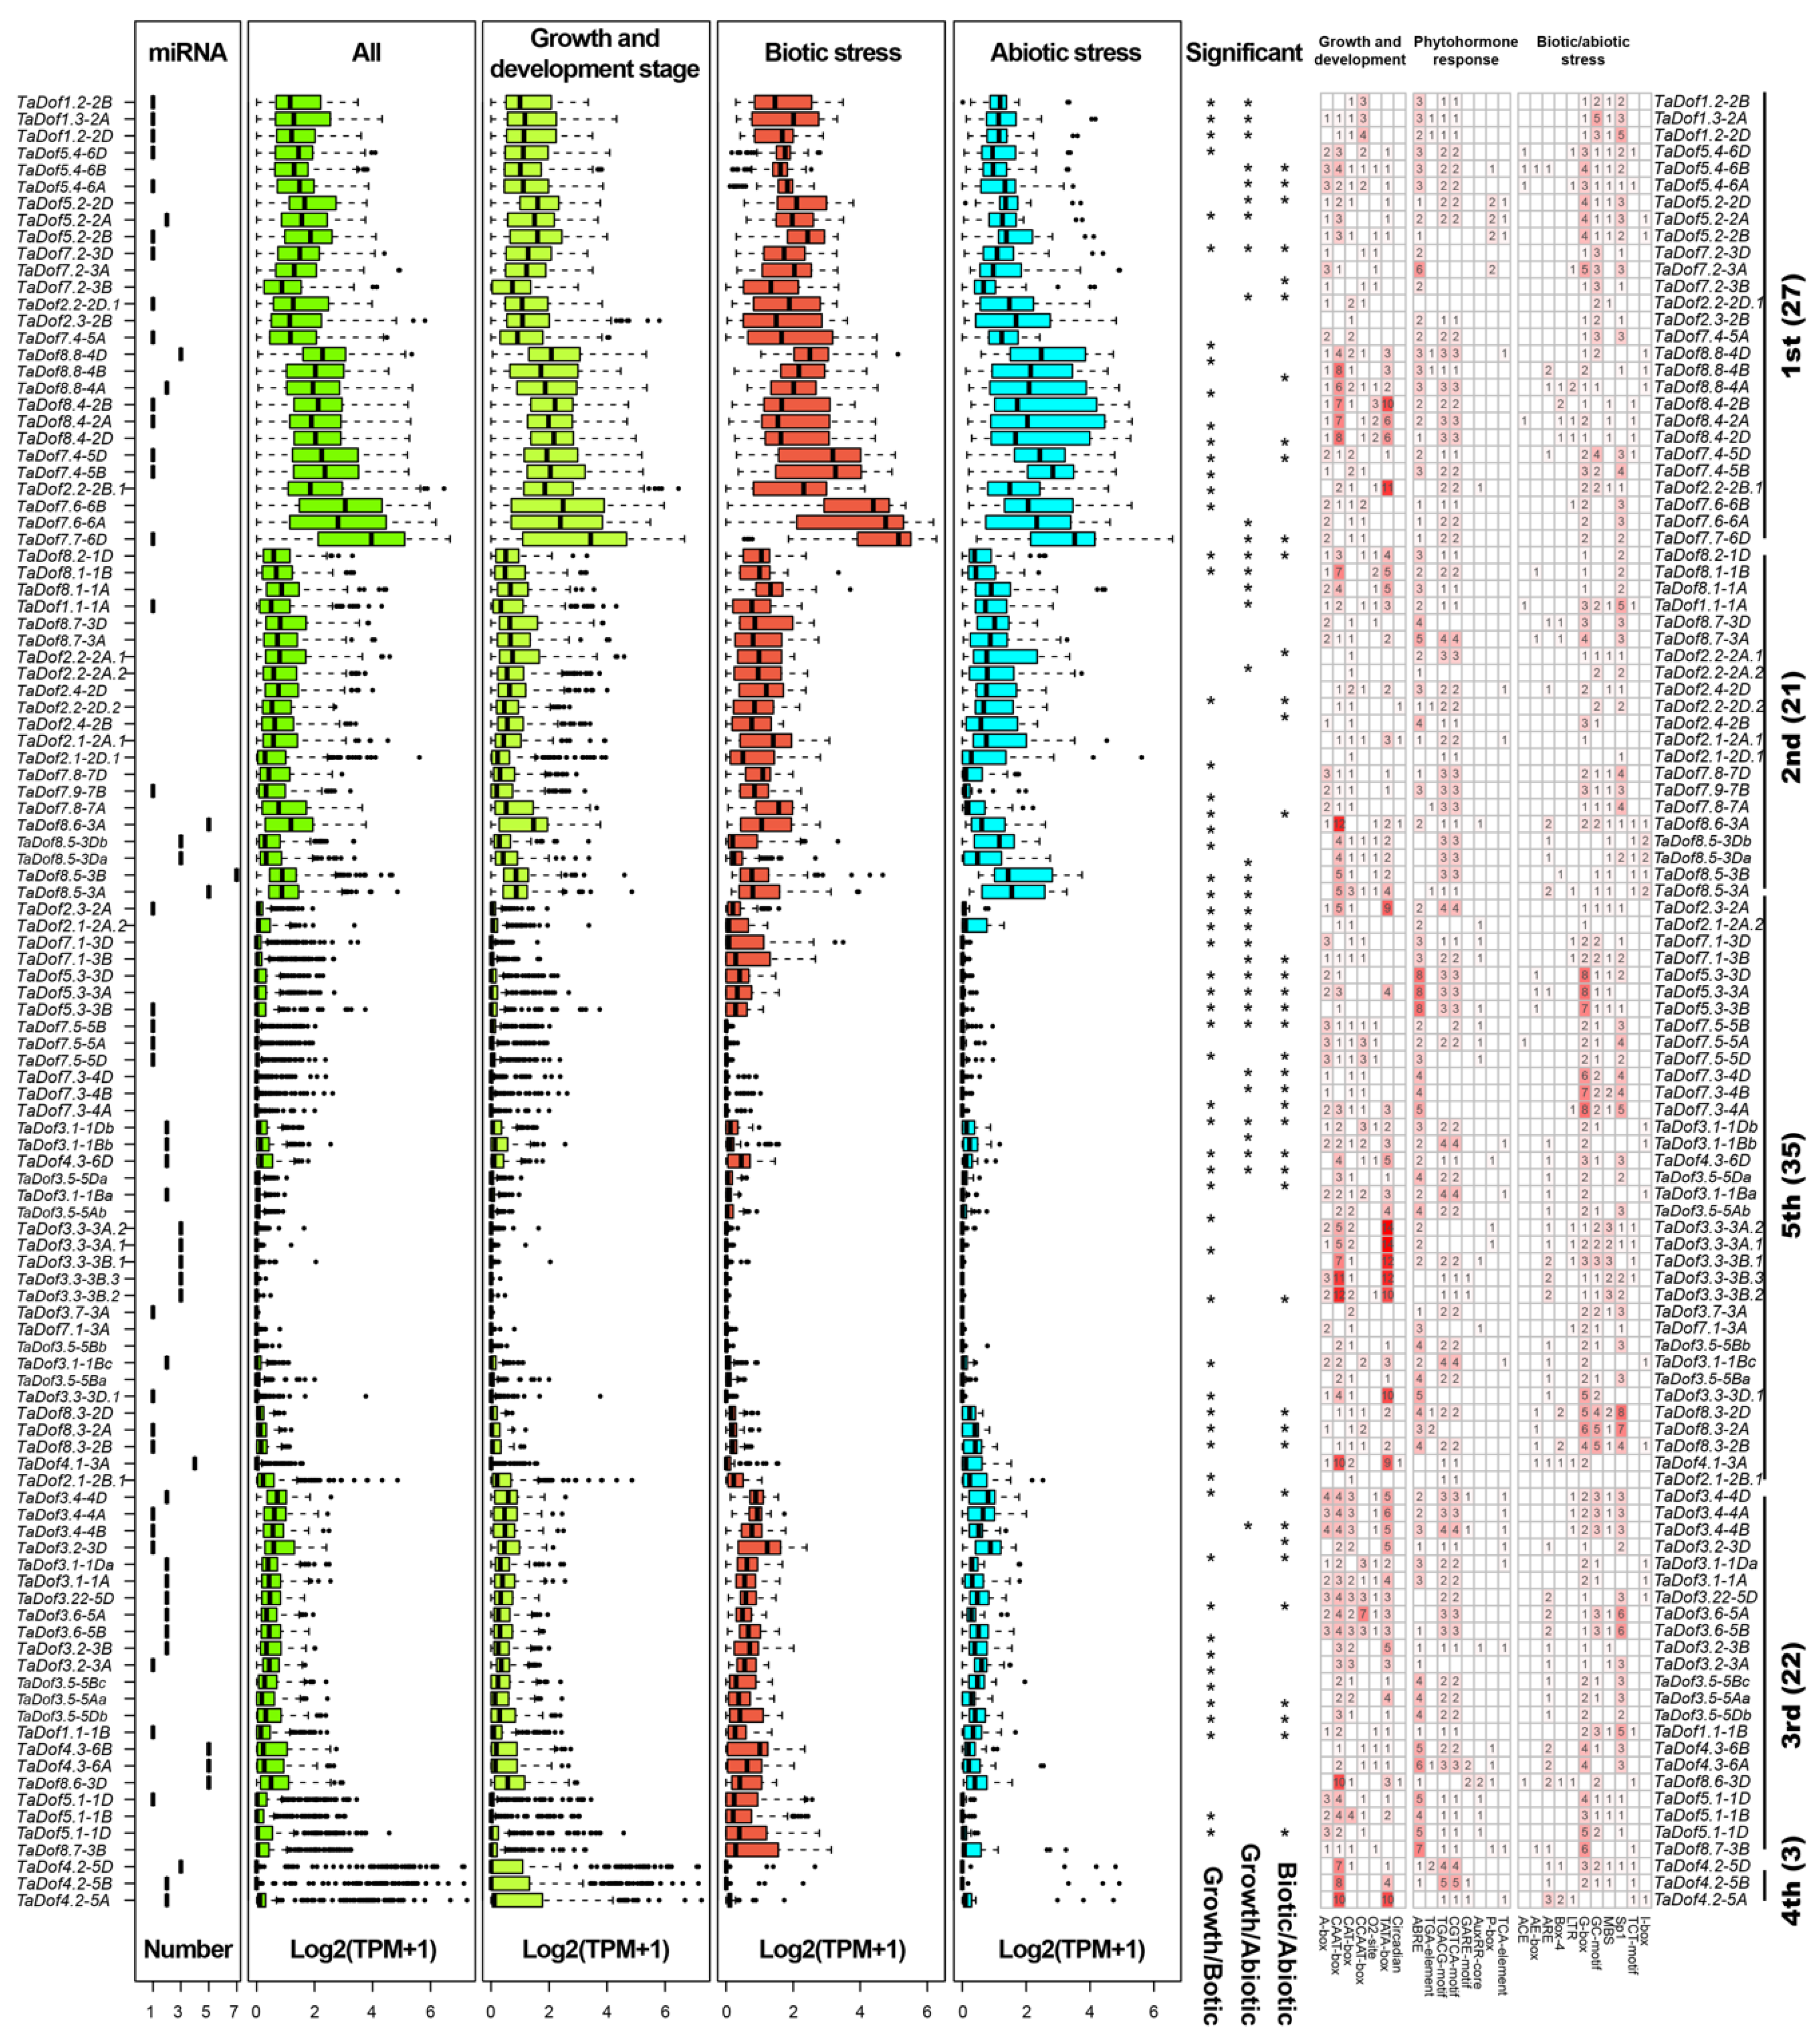
3.6. Transcriptome Analysis Revealed Diverse Expression Patterns of TaDofs

Expression profiles were mined from a comprehensive profiling study on wheat samples from 337 different situations including different growth and development stages, and multiple biotic and abiotic stresses (Additional file 1: Table S9) [33]. The expression heatmap and overview boxplot of the TaDof genes were drawn using the R package “pheatmap” and R function “boxplot” (Figure 6 and Figure 7). As shown in Figure 6 and Figure 7, almost all TaDof genes were expressed in at least one of 337situation, except for TaDof3.3-3A.3 (cutoff value: TPM > 0.1). TaDofs could be divided into five classes based on expression patterns. The 1st class contained 27 members with average expression levels in TPM ranging from 1.39 to 20.23 (average value, 4.90). These genes were widely expressed across hundreds of situations, but the expression levels varied among different tissues at different growth stages, and under different biotic and abiotic stresses. The 2nd and 3rd classes contained 21 and 22 members and showed relatively low expression levels (average values, 1.21 and 1.05) in most conditions. Genes belonging to 2nd class members were highly induced under certain conditions; for example, TaDof2.1-2D.1 and TaDof2.1-2A.1 were up-regulated by heat stress, TaDof8.1-1A by chitin and flg22 treatment, TaDof8.5-3B at 24 h post stripe rust infection, and TaDof2.2-2A.1 in stem (two node stage). Genes in the 3rd class were not, or only lightly, induced in most situations. Genes TaDof4.2-5A, TaDof4.2-5B, and TaDof4.2-5D in 4th class were barely expressed in most situations, but were specifically induced in anthesis-associated processes (average value, 4.46). The 5th class contained 35 members that were barely expressed under most situations (Figure 6).

3.7. miRNAs and Cis-Regulators Are Essential Players in Molding TaDofs Expression Patterns

MicroRNAs are widely accepted essential players in posttranscriptional gene regulation by mRNA transcript cleavage and/or protein inhibition of translation [39]. Using TaDof genes and mature wheat miRNA sequences as queries, the miRNAs targeting TaDofs were predicted using the online tool psRNATarget. About 63 TaDof genes were targets of 43 wheat miRNAs, ranging from one to seven miRNAs for each targeted TaDof. Thirty-one TaDofs were targeted by one miRNA, 16 were targeted by two miRNAs, 9 were targeted by three miRNAs, 1 TaDof were targeted by four miRNAs, 5 TaDofs were targeted by six miRNAs, and 1 TaDof was targeted by seven miRNAs (Figure 7, Additional file 1. Table S10). Further integration analysis of the numbers of miRNAs and TaDof expression patterns (represented by TPM means and SD), it seems the barely expressed TaDofs (e.g., TaDof3.3-3A.1, TaDof4.1, and TaDof3.3-3B.2 in class 5 with small TPM mean values) were commonly targeted by more miRNAs, whereas the stably expressed ones (e.g., TaDof8.1-1A, TaDof2.1-2A.2, and TaDof7.8-7D in class 2 with low TPM SD values) were not. Strongly induced TaDofs (e.g., TaDof4.2-5A, TaDof4.3-6A with large TPM SD values) were usually targeted by miRNAs, implying the roles of miRNAs as modulators of TaDof expression patterns (Figure 7).
Gene functions can be predicted by bioinformatic analyses of cis-regulatory elements. This was performed by retrieving 1.5 Kb upstream sequences from transcription start sites of TaDof genes. PlantCARE database searches identified a large number of cis-regulators (2492 representing 26 kinds) (Figure 7, Additional file 1: Table S9), including elements responsible for ‘plant development and growth’ (7 kinds), ‘phytohormone response’ (8 kinds), and ‘biotic/abiotic stresses’ (11 kinds) in the promoter regions of TaDofs, suggesting roles in multiple metabolic and response processes. Among the cis-regulatory elements, CAAT-box (307 individuals, sequence pattern: GGGTCAATCT) and TATA-box (284 individuals, sequence pattern: TATAATAAT) for ‘plant development and growth’, ABRE (266 individuals, ABA responsive element, sequence pattern: ACGTC/GCCGCTGGC) for ‘phytohormone responses’, G-box (247 individuals, light-responsive element, sequence pattern: CACGTC), and TCT-motif (211 individuals, light-responsive element, sequence pattern: TCTTAC) for ‘biotic/abiotic stresses’ were generally present in the promoters of most TaDofs. Integration analysis of the cis-regulators with the expression patterns of TaDofs revealed that TaDofs with significantly different expression patterns between ‘growth and development stage’ and ‘biotic stress’ (growth/biotic) or between ‘growth and development stage’ and ‘abiotic stress’ (growth/abiotic) usually contained distinctive cis-regulator contents (Figure 7), suggesting specific roles of the elements in modulating TaDof expression.

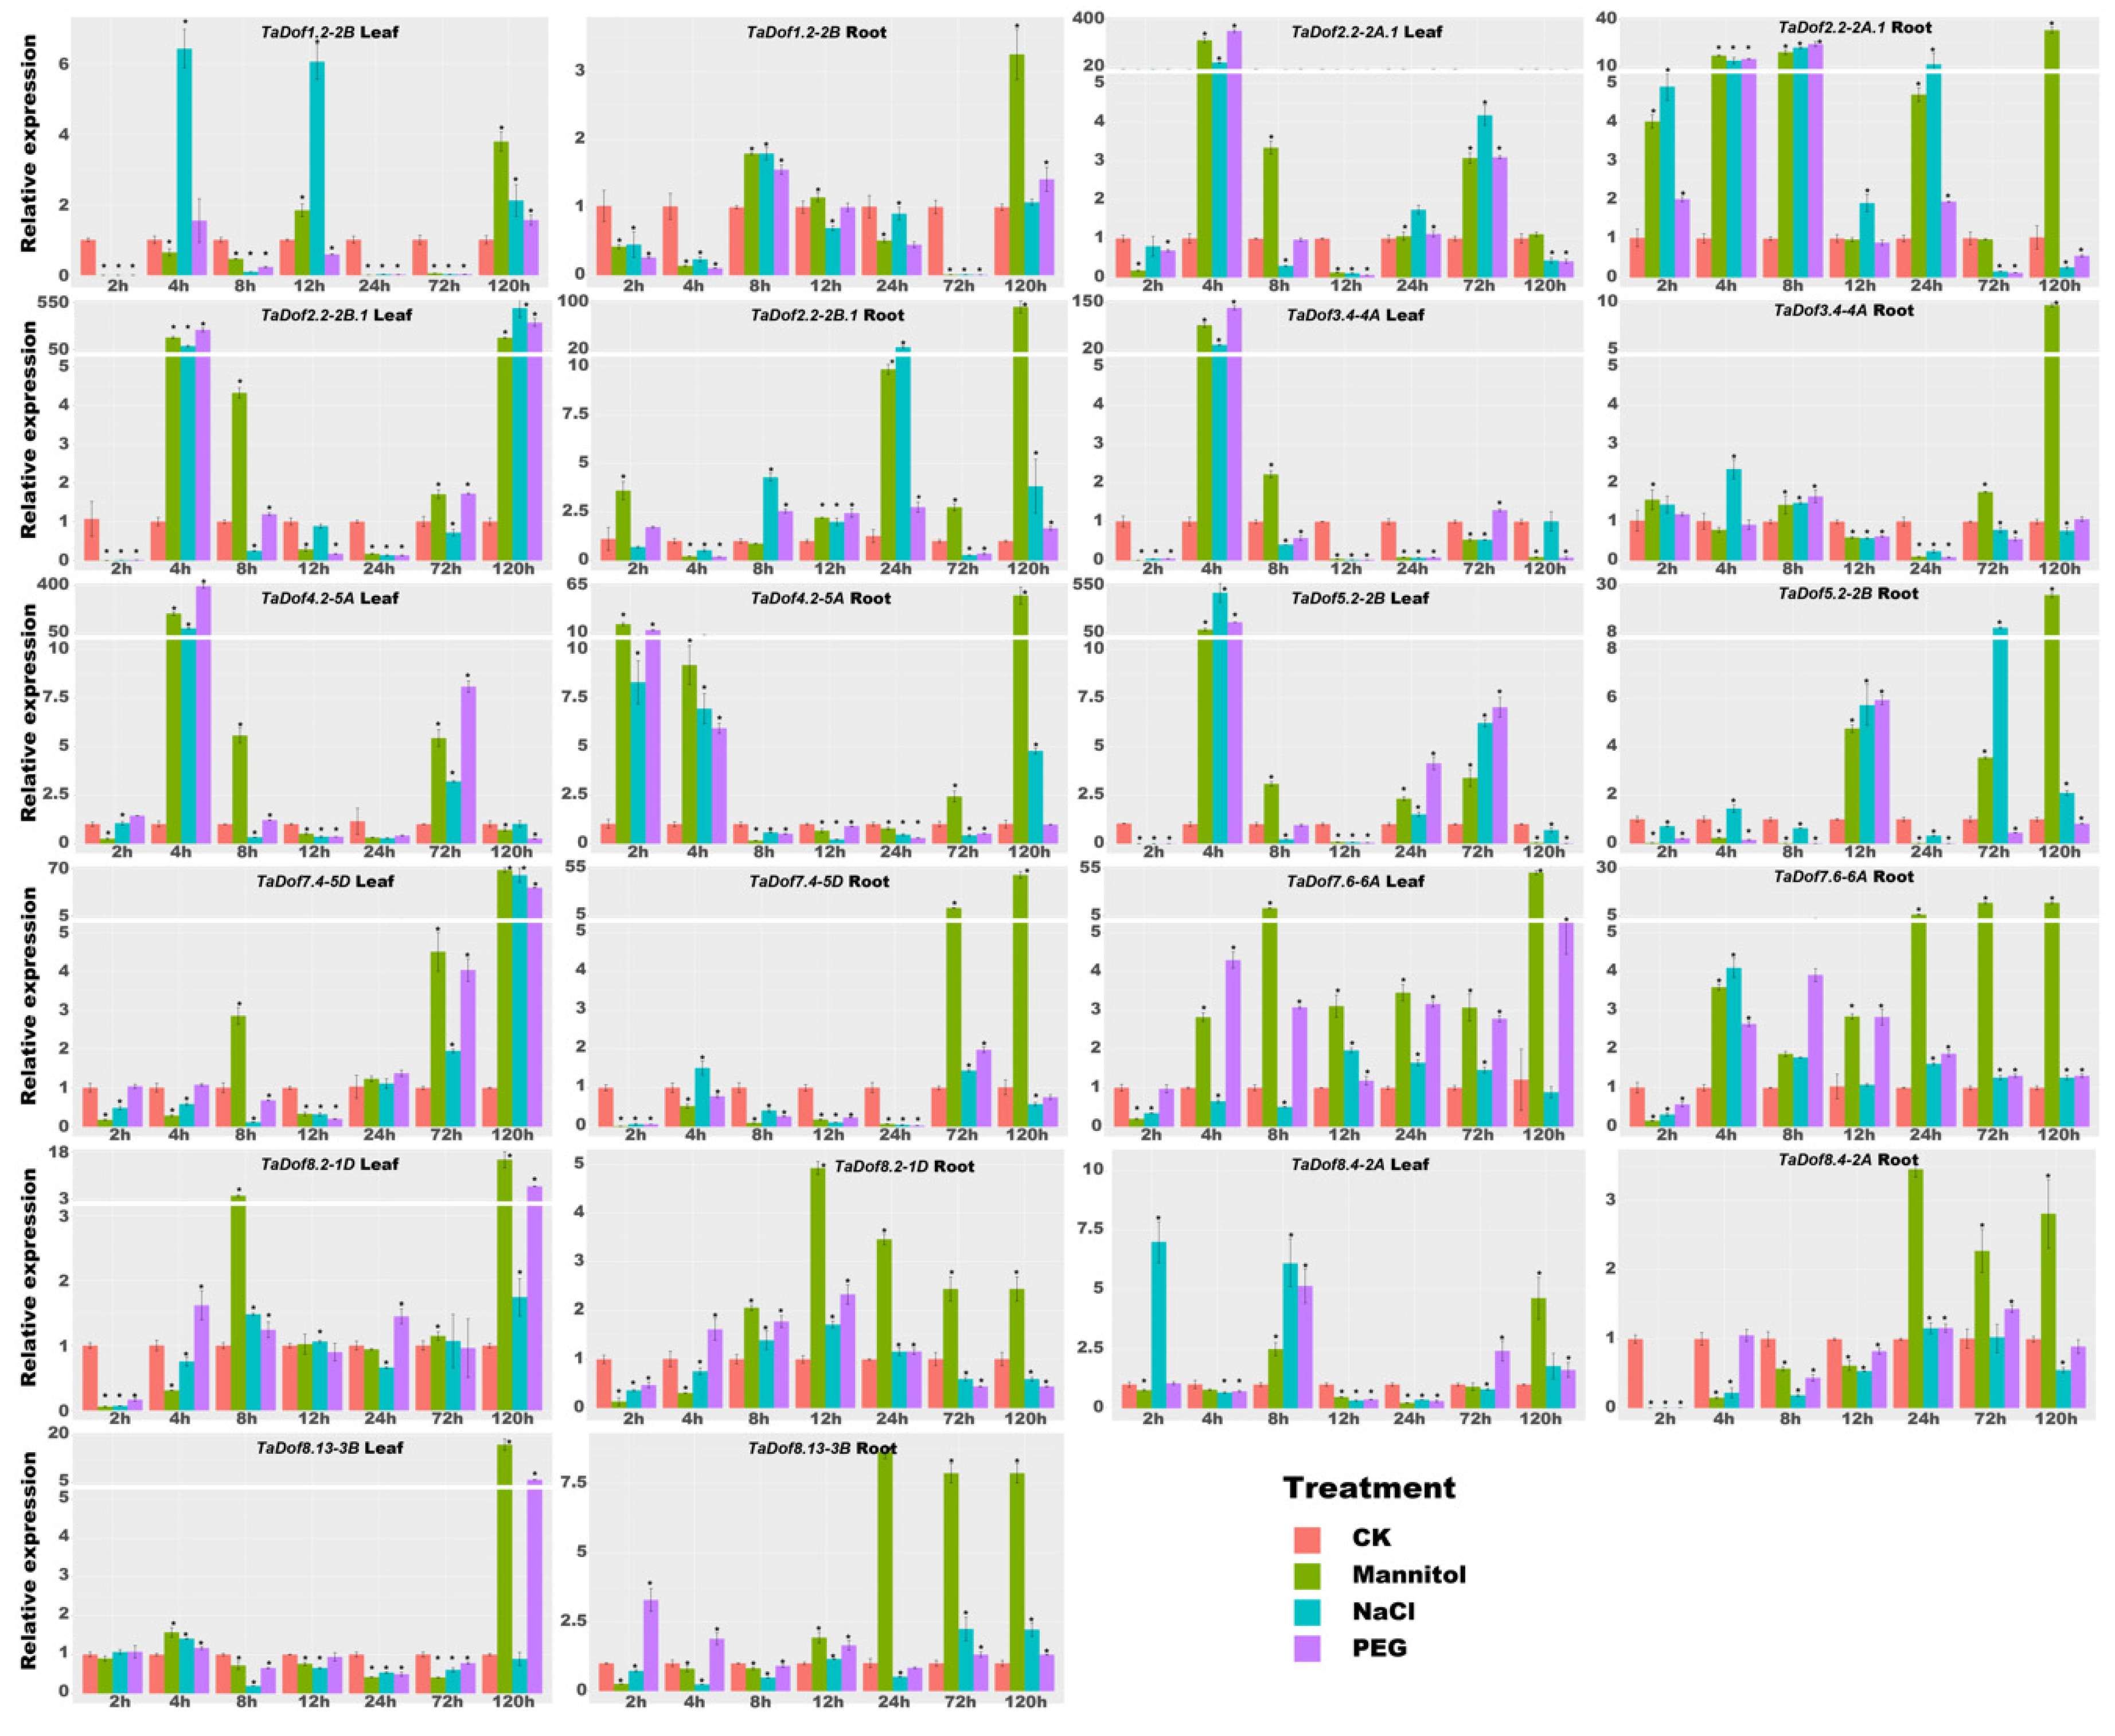
3.8. qRT-PCR Confirmed the Response Capability of TaDofs to Stress Conditions

In order to explore functions of TaDof genes in regulation of stress response, 11 TaDof genes (Figure 8, Additional file 1: Table S2) from the seven groups were used to examine expression patterns under salt, PEG, and mannitol stresses using qRT-PCR. The expression patterns of these TaDofs varied between tissues and stress treatments (Figure 8). All 11 TaDofs responded to all three stress conditions, but the response speeds and intensities were different.
qRT-PCR results showed that there was considerable variation in expression patterns of the TaDof genes over time. The majority of genes were downregulated in leaves at the beginning of NaCl treatment, but began to be up-regulated after 4 h, except for TaDof8.2-1D and TaDof8.4-2A, expression levels of which were lower than the CK at 2 h and 4 h. After NaCl treatment for 12 h, eight of the Dof genes were significantly down-regulated, including TaDof4.2-5A, TaDof7.4-5D, TaDof8.5-3B, TaDof2.2-2A.1, TaDof3.4-4A, TaDof5.2-2B, TaDof7.6-6A, and TaDof8.4-2A. After NaCl treatment for 24 h and 120 h, most of these genes examined were greatly down- and up-regulated, respectively. Under mannitol stress, all tested genes were downregulated, but 5 of them (TaDof2.2-2B.1, TaDof4.2-5A, TaDof2.2-2A.1, TaDof5.2-2B, and TaDof7.6-6A) were up-regulated at 4 h and 8 h. The expression levels of 8 and 7 genes were decreased at 24 h and 72 h, respectively, whereas 7 were up-regulated at 72 h.
In the roots under salt stress, expression levels of TaDof8.5-3B, TaDof7.6-6A, TaDof8.2-1D, and TaDof8.4-2A were depressed at the initial stage of stress but thereafter increased, whereas the expression level of TaDof2.2-2A.1 was high at the beginning of salt treatment but was subsequently depressed compared with the control. Under salt stress, TaDof8.2-1D showed down-regulation before 4 h and after 72 h, whereas exhibited higher expression from 8 to 24 h of treatments. Under mannitol stress, TaDof5.2-2B, TaDof8.2-1D, TaDof8.5-3B, and TaDof8.4-2A were downregulated at the beginning of stress treatment, but was up-regulated at 8 h or 12 h compared with the control. The expression level of TaDof8.4-2A increased gradually from 2 to 12 h, and then then decreased to the end of the time courses. However, its expression levels were higher than the CK from 8 h onwards. TaDof4.2-5A was upregulated at the beginning (2 to 4 h) and end (72 to 120 h) of NaCl treatment, but was down-regulated between 8 and 24 h. The expression levels of TaDof2.2-2A.1 and TaDof7.6-6A were increased at most time points, except for 12 h and 2 h for TaDof2.2-2A.1 and TaDof7.6-6A, respectively, when the expression levels of these two genes were lower.
Since both mannitol and PEG induced osmotic stress, it was not surprising that similar expression patterns were identified for most of the 11 genes across most treatment time points. For example, the expression patterns of TaDof2.2-2B.1 and TaDof5.2-2B in the leaves, and TaDof1.2-2B, TaDof7.4-5D, TaDof7.6-6A, and TaDof8.4-2A in the roots were increased or decreased synchronously in response to mannitol and PEG across time points, but with differing response amplitudes different between the two treatments. However, there were exceptions; for example, several genes, including TaDof4.2-5A, TaDof7.4-5D, TaDof8.5-3B, and TaDof8.4-2A in leaves and TaDof8.5-3B, TaDof4.2-5A, TaDof8.2-1D, and TaDof5.2-2B in roots showed differential expression levels at the initial and/or final stages of treatment with mannitol and PEG stress.

3.9. Possible Diverse Roles of TaDofs Were Uncovered by BLASTp Searches

Forty-two Dofs with experimentally proved functions in different species were subjected to BLASTp searching (E-value < 1e-20, percent identity > 80%) (functional descriptions and corresponding reference can be found in Additional file 1: Table S12, gene sequences in Additional file 2: File S2). Sixty-six TaDofs hit 25 of the proven Dofs (Table 2). Our customized functional annotations suggested that TaDofs were widely involved in the phytohormone response, defense, growth and development, and metabolism. For example, three anthesis-associated genes, TaDof4.2-5A, TaDof4.2-5B, and TaDof4.2-5D, specifically induced in flowering, hit barley BPBF, which has a role in endosperm specificity; TaDof4.3-6B and TaDof4.3-6D hit rice OsDof3, which is involved in gibberellin response; TaDof8.5-3B hit rice Rdd1, which is a regulator of photoperiodic flowering response; TaDof7.1-3A and TaDof7.1-3D hit Arabidopsis SCAP1, which specifically regulates stomatal development; and TaDof8.1-1A hit sweet potato SRF1, which is involved in carbon metabolism (Table 2, Additional file 1: Table S13).

4. Discussions

4.1. A Large Number of TaDof Genes Are Present in Common Wheat

Numerous physiological and biochemical processes in plants are regulated by transcription factors. Knowledge of the structure and function of transcription factors at the whole-genome level will help in understanding gene regulatory networks in individual species [4,29]. As plant-specific transcription factors, Dof (DNA binding with one finger) genes have important roles in plant growth and development [3,6,7]. However, the specific function(s) of most Dof genes remains unknown. Prediction of Dof genes genome-wide became possible with completion of genome sequencing. In this study, we analyzed the structure, phylogenetic relationships, chromosomal locations, sub-cellular localization, gene duplication events, cis-elements, and expression patterns of Dof genes in wheat (TaDofs); 108 TaDof genes were identified. Dof genes were previously identified in several species, including Arabidopsis (36 genes) [9], rice (30) [9], tomato (34) [11], soybean (78) [40], corn (46) [13], potato (35) [41], chrysanthemum (20) [42], and foxtail genomes (36) [43]. A larger number of TaDof genes were detected, but this was likely caused by the allohexaploid genome of wheat.
Analysis of protein sequences encoded by the 108 TaDof genes showed the presence of many conserved domains, consistent with the classification of Dof transcription factor family genes (Figure 2) [7]. Basic amino acids and hydrophobic amino acid residues such as Pro, Lys, Ile, and Leu were present in the N-terminus, whereas Arg, Tyr, Thr, Gly, and Trp were common in the C-terminus.
Systematic classification of TaDof proteins should help to understand this transcription factor family. Yanagisawa [44] classified the Dof family into seven distinct sub-populations. Lijavetzky et al. [9] collected Dof transcription factors of Arabidopsis and rice, and divided them into four sub-families, named Aa, Bb, Cc, and Dd. They further divided each sub-group into groups based on the number of introns. Moreno-Risueno et al. [10] conducted a more comprehensive classification using 116 Dof genes from seven species and divided the Dof family into seven sub-groups, A to G. The members of each sub-group had high similarity in terms of conserved amino acid species and their numbers, and number of introns; for example, sub-groups A, F, and G contained introns whereas sub-groups B, C, and E did not. Comparing with these earlier classification rules, wheat Dof family were consistent with the classifications by Yanagisawa [44] and Lijavetzky et al. [9]. However, the number of introns in the wheat sub-groups did not follow the classification rules proposed by Moreno-Risueno et al. [10]. For example, TaDof2.1-2A.2 and TaDof2.2-2D.2 in sub-group II do not contain introns, whereas other TaDof2 genes contain one intron; and most of TaDofs in sub-group III had one intron, except for TaDof3.3-3A.3, which contained no intron. TaDofs mostly followed the conserved structures of Dof genes reported by Yanagisawa [44] and Lijavetzky et al. [9], but also included some species-specific structures. Our phylogenetic tree likewise divided TaDof genes into 7 sub-groups. In common with maize and rice, no wheat Dof gene clustered with Arabidopsis sub-group VI, suggesting that the Dof genes in graminaceous plants had diverged. Apparently, some TaDof genes evolved independently after differentiation of monocots and dicots.

4.2. Negatviely Selected TaDof Genes Expand by Polyploidization

Duplication is an important evolutionary process in gene family expansion, and duplicated genetic material provides opportunities for functional differentiation [29]. Therefore, gene duplication analysis can help us to better understand the evolution of genes and species. Sixty pairs of segmentally duplicated and three pairs of tandemly duplicated TaDof genes were identified. Most of the segmentally duplicated gene pairs (60/63) were from the same phylogenetic group, with high sequence similarities. Most TaDofs in segmentally duplicated pairs were located at similar positions in homoeologous chromosomes, supporting polyploidization as the main cause of expansion in for TaDof number. Two analyses were performed for confirmation. Firstly, non-synonymous substitution rates (Ka), synonymous substitution rates (Ks), and Ka/Ks ratios were calculated for 63 pairs of duplicated genes (Figure 4C, Additional file 1: Table S6). The Ka/Ks ratios were less than 1 (Figure 4C), implying that all duplicated gene pairs were negatively selected. Ks values used to estimate the time of occurrence of repetitive events revealed that 63 duplications occurred about 1.55 to 12.92 million years (average 7.17, 48 values in 63 earlier than 5.5) ago, the time period mostly before the wheat polyploidization event [45]. Secondly, syntenic analysis was expanded to the wheat progenitor species Aegilops tauschii (DD), T. urartu (AA), and T. dicoccoides (AABB) for comparison with common wheat (AABBDD). Identical orthologues were found in the corresponding genomic regions among the A, B, D sub-genomes of wheat and the progenitor species (Figure 4B, Additional file 1: Table S7). Considering the fact of that duplicated TaDof gene pairs were under negative selection force, it is apparent that polyploidization was the main reason for the higher number of TaDof family genes.

4.3. Integration of Expression Profiles, miRNA, and Cis-Elements Uncovers Complex Regulatory Patterns of TaDofs

Data from a comprehensive study of wheat expression profiles containing 337 different situations were analyzed to reveal the expression patterns of 108 TaDof genes (Additional file 1: Table S9) [33]. The results revealed variable regulation models of TaDof genes in different plant development stages and environment situations (Figure 6). However, it is still unclear how the expression of TaDofs was affected by specific conditions. Gene promoters and miRNAs are essential factors in modulation of gene expression patterns, and they have been shown to regulate gene expression at both the transcriptional and posttranscriptional levels [31,32,39]. We analyzed the cis-regulatory elements of TaDofs and wheat miRNAs that target TaDofs (Additional file 1: Tables S10 and S11). Integration of expression profiles for miRNAs and the cis-elements of TaDofs led to some interesting results. For example, genes TaDof4.2-5A, TaDof4.2-5B, and TaDof4.2-5D specifically induced during anthesis were targeted by two or three miRNAs; they had numerous ‘growth and development’ associated cis-regulators in their promoter regions, whereas cis-regulators related to ‘phytohormone response’ and ‘biotic/abiotic stress’ were limited in number. Based on these results, it can be speculated that cis-regulators are responsible for anthesis stage-specific induction and miRNAs are responsible for expression suppression during other growth and development stages. Seven to eight G-box motifs (‘biotic/abiotic stress’ kind of cis-regulators) were detected in the promoter regions of TaDof5.3-3A, TaDof5.3-3B, and TaDof5.3-3D, and their expression levels were highly induced by biotic stress, but were not induced by abiotic stress. This implied the regulatory roles of cis-regulators in three genes responding to biotic stress. Additionally, TaDof5.3-3A and TaDof5.3-3D were not targeted by miRNA, suggesting miRNA played no or undetected roles in modulating the expression patterns of two genes. TaDof5.4-6A, which was targeted by tae-miR398 and had diverse cis-regulators, was highly expressed in various growth and development conditions. Its expression level was further induced by biotic and abiotic stresses, suggesting that tae-miR398 releases TaDof5.4-6A from suppression under stress conditions. In summary, miRNAs and cis-elements are possible regulators likely involved in complex regulation of TaDofs expression. Besides miRNA and cis-elements there are many other regulators of gene expression, such as DNA methylation and transcription factors. Thus, more experimental evidence is needed to further detail the regulation mechanisms of TaDofs. Our results provide valuable clues for experimental validation of regulation patterns by miRNAs and cis-elements.

4.4. A Large Number of TaDof Genes Are Present in Common Wheat

Numerous physiological and biochemical processes in plants are regulated by transcription factors. Knowledge of the structure and function of transcription factors at the whole-genome level will help in understanding gene regulatory networks in individual species [4,29]. As plant-specific transcription factors, Dof (DNA binding with one finger) genes have important roles in plant growth and development [3,6,7]. However, the specific function(s) of most Dof genes remains unknown. Prediction of Dof genes genome-wide became possible with completion of genome sequencing. In this study, we analyzed the structure, phylogenetic relationships, chromosomal locations, sub-cellular localization, gene duplication events, cis-elements, and expression patterns of Dof genes in wheat (TaDofs); 108 TaDof genes were identified. Dof genes were previously identified in several species, including Arabidopsis (36 genes) [9], rice (30) [9], tomato (34) [11], soybean (78) [40], corn (46) [13], potato (35) [41], chrysanthemum (20) [42], and foxtail genomes (36) [43]. A larger number of TaDof genes were detected, but this was likely caused by the allohexaploid genome of wheat.

4.5. Functional Clues of Nuclear Localizaed TaDofs Were Uncovered by Customized Annotation

As transcription factors, Dof genes are believed to function in the nucleus to regulate the expression of target genes [16]. All TaDofs were predicted to be localized in nucleus. Localization of 10 TaDofs was confirmed through confocal laser scanning microscopy following transient expression in Nicotiana benthamiana leaves (Figure 5B). We then annotated TaDofs with multiple public databases, and Gene Ontology (GO) enrichment analysis showed that most TaDofs (98) were annotated under GO terms ‘regulation of transcription, DNA-templated’ (GO:0006355) and ‘DNA binding’ (GO:0003677). Several TaDofs were annotated under ‘response to heat’ (GO:0009408), ‘response to high light intensity’ (GO:0009644), ‘response to hydrogen peroxide’ (GO:0042542), and ‘response to chitin’ (GO:0010200), implying multifaceted roles (Figure 5A, Additional file 1: Table S8). To further decipher the roles of TaDofs, 42 Dofs with experimentally supported functions were collected (Additional file 1: Table S12). After BLASTp searching, 25 of them were hit by 62 TaDofs (Table 2, Additional file 1: Table S13). According to our customized functional annotations, it was apparent that TaDofs are widely involved in aspects of phytohormone response, defense, growth and development, and metabolism. For example, TaDof4.2-5A, TaDof4.2-5B, and TaDof4.4-5D were specifically induced in samples at anthesis (Additional file 1: Table S9). These three genes hit barley BPBF, which has a role in endosperm specificity [46], implying their specific roles in wheat anthesis stage. OsDof3 is controlled by gibberellin to regulate the expression of Type III carboxypeptidase (CPD3) in rice [47]. Our BLASTp searching showed that TaDof4.3-6B and TaDof4.3-6D hit OsDof3, suggesting that these wheat Dofs may involve in gibberellin response through regulating wheat CPD3. Rdd1 is a regulator of photoperiodic flowering in rice and plays a role in grain size determination [48]. BLASTp searching showed that TaDof8.5-3B hit Rdd1, implying a role of TaDof8.5-3B in photoperiodic flowering and grain development. SRF1 has a role in modulating carbohydrate metabolism in the storage root of sweet potato through negative regulation of Ibβfruct2, which encodes an isoform of vacuolar invertase [49]. TaDof8.1-1A hit SRF1, suggesting TaDof8.1-1A may take part in carbon metabolism (Table 2).

5. Conclusions

A large number of TaDof genes identified in common wheat were separated into seven sub-groups. Although variable in length, MW, and pI, all TaDof proteins contain a conserved zinc-finger structure. Exon/intron and motif analysis showed that TaDof gene structures and conserved motifs were similar within groups but diverse between groups. Ka/Ks analysis and inter-species syntenic analysis suggested that polyploidization was the main cause of high numbers of TaDofs. Based on GO annotation, sub-cellular localization prediction, and experimental confirmation TaDofs were shown to function as transcription factors in the nucleus. Large-scale expression profiling revealed variable regulation models of TaDof genes in different growth and development stage, biotic stress, and abiotic stress situations, and integration analysis with miRNAs and the cis-regulators, the possible transcriptional regulatory networks of TaDofs were further explored, which provide valuable information for further experimental studies. qRT-PCR analysis revealed that the expression levels of selected TaDofs were significantly altered by salt and drought stress. Through BLASTp searches the possible roles of TaDofs were manually annotated by alignment to Dofs with experimentally supported functions in other species. Our results provide valuable clues for further analysis of the regulatory mechanisms and specific functions of TaDof genes in wheat, especially their roles in stress response.

Supplementary Materials

The following are available online at https://www.mdpi.com/2073-4395/10/2/294/s1, Figure S1: Sequence logos for 2 motifs in Dof domains, Table S1: Primers used for TaDof gene cloning, Table S2: qRT-PCR primers for TaDof genes, Table S3: Dof genes in Arabidopsis, Oryza sativa, and Zea mays, Table S4: Multilevel consensus sequences in TaDof genes identified by MEME, Table S5: Chromosome locations of TaDof genes in the Chinese Spring wheat reference genome, Table S6: Ka/Ks analysis and estimated divergence time for duplicated TaDof genes, Table S7: Duplication of gene pairs among wheat and three progenitor species, Table S8: Functional annotation of wheat Dof genes, Table S9: TaDof gene expression levels represented by TPM values, Table S10: Wheat miRNAs targeting TaDofs, Table S11: The cis-elements in upstream sequences of TaDof genes, Table S12: Function prediction of TaDofs by BLASTp searching, Table S13: BLASTp search results, File S1: Sequences of Dof genes and coding proteins used in this research, File S2: Sequences of Dof genes with experimentally supported functions.

Author Contributions

J.Y. and D.M. conceived the study. Z.F., W.J. and J.Y. designed the experiments and wrote the manuscript. Z.F., W.J., Y.H., Y.L., S.W., Y.Z., and D.M. performed the bioinformatics analysis and made the subcellular observations. W.J., D.M., Y.H., and J.Y. collected and analyzed the public datasets. All authors have read and agreed to the published version of the manuscript.

Funding

This research was funded by “National Key R&D Program of China (2017YFD0100800 and 2018YFD0200500)”, “The Major Program of Technological Innovation of Hubei Province (2018ABA085)”, “Ministry of Agriculture, Southwest Agricultural Crop Pest Management Key Laboratory Open Fund (2018-XNZD-01)”, and “Open Project Program of Engineering Research Center of Ecology and Agricultural Use of Wetland, Ministry of Education (KF201802 and KF201909)”.

Acknowledgments

We thank Yongli Qiao for comments on the initial project design and data analysis, R. A. McIntosh for editorial review of the manuscript.

Conflicts of Interest

The authors declare no conflict of interest. The funders had no role in the design of the study; in the collection, analyses, or interpretation of data; in the writing of the manuscript, or in the decision to publish the results.

Abbreviations

TaDofWheat Dof
DofDNA binding with one finger
aaAmino acids
MLMaximum Likelihood
MWMolecular weight
pIIsoelectric point
GRAVYGrand average hydropathy
KaNon-synonymous substitution rate
KsSynonymous substitution rate
Ka/KsRatio of non-synonymous to synonymous mutation rates
GOGene ontology
qRT-PCRquality real time PCR
GFPGreen fluorescent protein
TPMtranscripts per kilobase of exon model per million mapped reads

References

  1. Boccaccini, A.; Santopolo, S.; Capauto, D.; Lorrai, R.; Minutello, E.; Serino, G.; Costantino, P.; Vittorioso, P. The Dof protein DAG1 and the DELLA protein GAI cooperate in negatively regulating the AtGA3ox1 gene. Mol. Plant 2014, 7, 1486–1489. [Google Scholar] [CrossRef] [Green Version]
  2. Ma, J.; Li, M.Y.; Wang, F.; Tang, J.; Xiong, A.S. Genome-wide analysis of Dof family transcription factors and their responses to abiotic stresses in Chinese cabbage. BMC Genom. 2015, 16, 33. [Google Scholar] [CrossRef] [Green Version]
  3. Zhang, X.; Yin, Y.J.; Fan, B.; Li, H.J.; Fei, X.Y.; Cui, X.Y. Advances on the structural characteristics and function of Dof transcription factors in plant. Crops 2016, 2, 14–20. [Google Scholar]
  4. Liu, L.; White, M.J.; Macrae, T.H. Transcription factors and their genes in higher plants functional domains, evolution and regulation. Eur. J. Biochem. 2010, 262, 247–257. [Google Scholar] [CrossRef]
  5. Cai, M.; Yuan, T.; Duan, L.; Li, X.; Wang, S. Identification of potential protein regulators bound to the tissue-specific positive and negative cis-acting elements of a green tissue-specific promoter in rice. Plant Biol. 2010, 10, 771–777. [Google Scholar] [CrossRef]
  6. Umemura, Y.; Ishiduka, T.; Yamamoto, R.; Esaka, M. The Dof domain, a zinc finger DNA-binding domain conserved only in higher plants, truly functions as a Cys2/Cys2 Zn finger domain. Plant J. 2004, 37, 741–749. [Google Scholar] [CrossRef] [Green Version]
  7. Yanagisawa, S.; Schmidt, R.J. Diversity and similarity among recognition sequences of Dof transcription factors. Plant J. 1999, 17, 209–214. [Google Scholar] [CrossRef]
  8. Yanagisawa, S.; Izui, K. Molecular cloning of two DNA-binding proteins of maize that are structurally different but interact with the same sequence motif. J. Biol. Chem. 1993, 268, 16028–16036. [Google Scholar]
  9. Lijavetzky, D.; Carbonero, P.; Vicente-Carbajosa, J. Genome-wide comparative phylogenetic analysis of the rice and Arabidopsis Dof gene families. BMC Evol. Biol. 2003, 3, 17. [Google Scholar] [CrossRef] [Green Version]
  10. Moreno-Risueno, M.A.; Martínez, M.; Vicente-Carbajosa, J.; Carbonero, P. The family of DOF transcription factors: From green unicellular algae to vascular plants. Mol. Genet. Genomic. 2007, 277, 379–390. [Google Scholar] [CrossRef]
  11. Cai, X.F.; Zhang, Y.Y.; Zhang, C.J.; Zhang, T.Y.; Hu, T.X.; Ye, J.; Zhang, J.H.; Wang, T.T.; Li, H.X.; Ye, Z.B. Genome-wide analysis of plant-specific Dof transcription factor family in tomato. J. Integr. Plant Biol. 2013, 55, 552–566. [Google Scholar] [CrossRef]
  12. Ge, M.; Lv, Y.; Li, T.; Zhang, T.F.; Zhang, X.L.; Zhao, H. Genome-wide identification and analysis of Dof transcription factor family in maize. Sci. Agric. Sin. 2014, 47, 4563–4572. [Google Scholar]
  13. Dong, C.; Hu, H.; Xie, J. Genome-wide analysis of the DNA-binding with one zinc finger (Dof) transcription factor family in bananas. Genome 2016, 59, 1085–1100. [Google Scholar] [CrossRef]
  14. Diaz, I.; Vicente-Carbajosa, J.; Abraham, Z.; Martínez, M.; Isabel-La, M.; Carbonero, P. The GAMYB protein from barley interacts with the Dof transcription factor BPBF and activates endosperm specific genes during seed development. Plant J. 2002, 29, 453–464. [Google Scholar] [CrossRef]
  15. Krohn, N.M.; Yanagisawa, S.; Grasser, K.D. Specificity of the stimulatory interaction between chromosomal HMBG proteins and the transcription factor Dof2 and its negative regulation by protein kinase CK2 mediated phosphorylation. J. Biol. Chem. 2002, 27736, 32438–32444. [Google Scholar] [CrossRef] [Green Version]
  16. Noguero, M.; Atif, R.M.; Ochatt, S.; Thompson, R.D. The role of the DNA-binding one zinc finger (DOF) transcription factor family in plants. Plant Sci. 2013, 209, 32–45. [Google Scholar] [CrossRef]
  17. Yang, J.; Yang, M.F.; Zhang, W.P.; Chen, F.; Shen, S.H. A putative flowering-time-related Dof transcription factor gene, JcDof3, is controlled by the circadian clock in Jatropha curcas. Plant Sci. 2011, 181, 667–674. [Google Scholar] [CrossRef]
  18. Konishi, M.; Yanagisawa, S. Sequential activation of two Dof transcription factor gene promoters during vascular development in Arabidopsis thaliana. Plant Physiol. Biochem. 2007, 45, 623–629. [Google Scholar] [CrossRef]
  19. Rueda-Romero, P.; Barrero-Sicilia, C.; Gomez-Cadenas, A.; Carbonero, P.; Onate-Sanchez, L. Arabidopsis thaliana DOF6 negatively affects germination in non-after-ripened seeds and interacts with TCP14. J. Exp. Bot. 2012, 63, 1937–1949. [Google Scholar] [CrossRef] [Green Version]
  20. Kang, W.H.; Kim, S.; Lee, H.A.; Choi, D.; Yeom, S.I. Genome-wide analysis of Dof transcription factors reveals functional characteristics during development and response to biotic stresses in pepper. Sci. Rep. 2016, 6, 33332. [Google Scholar] [CrossRef] [Green Version]
  21. Wang, H.; Zhao, S.; Gao, Y.C.; Yang, J. Characterization of Dof transcription factors and their responses to osmotic stress in poplar (Populus trichocarpa). PLoS ONE 2017, 12, e0170210. [Google Scholar] [CrossRef] [PubMed] [Green Version]
  22. Corrales, A.-R.; Nebauer, S.G.; Carrillo, L.; Fernández-Nohales, P.; Marqués, J.; Renau-Morata, B.; Granell, A.; Pollmann, S.; Vicente-Carbajosa, J.; Molina, R.-V.; et al. Characterization of tomato cycling Dof factors reveals conserved and new functions in the control of flowering time and abiotic stress responses. J. Exp. Bot. 2014, 65, 995–1012. [Google Scholar] [CrossRef] [PubMed] [Green Version]
  23. Corrales, A.-R.; Carrillo, L.; Lasierra, P.; Nebauer, S.G.; Dominguez-Figueroa, J.; Renau-Morata, B.; Pollmann, S.; Granell, A.; Molina, R.-V.; Vicente-Carbajosa, J.; et al. Multifaceted role of cycling DOF factor 3 (CDF3) in the regulation of flowering time and abiotic stress responses in Arabidopsis. Plant Cell Environ. 2017, 40, 748–764. [Google Scholar] [CrossRef] [PubMed]
  24. Yin, J.; Jia, J.; Lian, Z.; Hu, Y.; Guo, J.; Huo, H.; Zhu, Y.; Gong, H. Silicon enhances the salt tolerance of cucumber through increasing polyamine accumulation and decreasing oxidative damage. Ecotoxicol. Environ. Saf. 2019, 169, 8–17. [Google Scholar] [CrossRef] [PubMed]
  25. Zhu, Y.X.; Gong, H.J.; Yin, J.L. Role of silicon in mediating salt tolerance in plants: A review. Plants 2019, 8, 147. [Google Scholar] [CrossRef] [Green Version]
  26. Yin, J.L.; Fang, Z.W.; Sun, C.; Zhang, P.; Lu, C.; Wang, S.P.; Ma, D.F.; Zhu, Y.X. Rapid identification of a stripe rust resistant gene in a space-induced wheat mutant using specific locus amplified fragment (SLAF) sequencing. Sci. Rep. 2018, 8, 3086. [Google Scholar] [CrossRef] [PubMed]
  27. Appels, R.; Eversole, K.; Feuillet, C.; Keller, B.; Rogers, J.; Stein, N.; Ronen, G. Shifting the limits in wheat research and breeding using a fully annotated reference genome. Science 2018, 361, eaar7191. [Google Scholar] [PubMed] [Green Version]
  28. Zhu, Y.X.; Yang, L.; Liu, N.; Yang, J.; Zhou, X.K.; Xia, Y.C.; He, Y.; He, Y.Q.; Gong, H.J.; Ma, D.F.; et al. Genome-wide identification, structure characterization, and expression pattern profiling of aquaporin gene family in cucumber. BMC Plant Biol. 2019, 19, 345. [Google Scholar] [CrossRef]
  29. Jiang, W.; Yang, L.; He, Y.; Zhang, H.; Li, W.; Chen, H.; Ma, D.; Yin, J. Genome-wide identification and transcriptional expression analysis of superoxide dismutase (SOD) family in wheat (Triticum aestivum). PeerJ 2019, 7, e8062. [Google Scholar] [CrossRef] [Green Version]
  30. Peterson, G.I.; Masel, J. Quantitative prediction of molecular clock and Ka/Ks at short timescales. Mol. Biol. Evol. 2009, 26, 2595–2603. [Google Scholar] [CrossRef] [Green Version]
  31. Yin, J.; Liu, M.; Ma, D.; Wu, J.; Li, S.; Zhu, Y.; Han, B. Identification of circular RNAs and their targets during tomato fruit ripening. Postharvest Biol. Tec. 2018, 136, 90–98. [Google Scholar] [CrossRef]
  32. Zhou, R.; Zhu, Y.X.; Zhao, J.; Fang, Z.W.; Wang, S.P.; Yin, J.L.; Chu, Z.H.; Ma, D.F. Transcriptome-wide identification and characterization of potato circular RNAs in response to Pectobacterium carotovorum subspecies brasiliense infection. Int. J. Mol. Sci. 2018, 19, 71. [Google Scholar] [CrossRef] [PubMed] [Green Version]
  33. Ramírez-González, R.H.; Borrill, P.; Lang, D.; Harrington, S.A.; Brinton, J.; Venturini, L.; Khedikar, Y. The transcriptional landscape of polyploid wheat. Science 2018, 361, eaar6089. [Google Scholar] [CrossRef] [PubMed] [Green Version]
  34. Zhu, Y.X.; Jia, J.H.; Yang, L.; Xia, Y.C.; Zhang, H.L.; Jia, J.B.; Zhou, R.; Nie, P.Y.; Yin, J.L.; Ma, D.F.; et al. Identification of cucumber circular RNAs responsive to salt stress. BMC Plant Biol. 2019, 19, 164. [Google Scholar] [CrossRef] [Green Version]
  35. Song, J.; Ma, D.; Yin, J.; Yang, L.; He, Y.; Zhu, Z.; Tong, H.; Chen, L.; Zhu, G.; Liu, Y.; et al. Genome-wide characterization and expression profiling of squamosa promoter binding protein-like (SBP) transcription factors in wheat (Triticum aestivum L.). Agronomy 2019, 9, 527. [Google Scholar] [CrossRef] [Green Version]
  36. Yin, J.; Gu, B.; Huang, G.; Tian, Y.; Quan, J.; Lindqvist-Kreuze, H.; Shan, W. Conserved RXLR effector genes of Phytophthora infestans expressed at the early stage of potato infection are suppressive to host defense. Front. Plant Sci. 2017, 8, 2155. [Google Scholar] [CrossRef] [Green Version]
  37. Riechmann, J.L.; Heard, J.; Martin, G.; Reuber, L.; Jiang, C.; Keddie, J.; Adam, L.; Pineda, O.; Ratcliffe, O.J.; Samaha, R.R.; et al. Arabidopsis transcription factors: Genome-wide comparative analysis among eukaryotes. Science 2000, 290, 2105–2110. [Google Scholar] [CrossRef]
  38. Qu, L.J.; Zhu, Y.X. Transcription factor families in Arabidopsis: Major progress and outstanding issues for future research. Curr. Opin. Plant Biol. 2006, 9, 544–549. [Google Scholar] [CrossRef]
  39. Jia, J.; Lu, W.; Zhong, C.; Zhou, R.; Xu, J.; Liu, W.; Gou, X.; Wang, Q.; Yin, J.; Xu, C. The 25–26 nt small RNAs in Phytophthora parasitica are associated with efficient silencing of homologous endogenous genes. Front. Microbiol. 2017, 8, 773. [Google Scholar] [CrossRef]
  40. Guo, Y.; Qiu, L.J. Genome-wide analysis of the Dof transcription factor gene family reveals soybean-specific duplicable and functional characteristics. PLoS ONE 2013, 8, e76809. [Google Scholar] [CrossRef] [Green Version]
  41. Venkatesh, J.; Park, S.W. Genome-wide analysis and expression profiling of DNA-binding with one zinc finger (Dof) transcription factor family in potato. Plant Physiol. Biochem. 2015, 94, 73–85. [Google Scholar] [CrossRef] [PubMed]
  42. Song, A.P.; Gao, T.W.; Li, P.L.; Chen, S.M.; Guan, Z.Y.; Wu, D.; Xin, J.J.; Fan, Q.Q.; Zhao, K.K.; Chen, F.D. Transcriptome-wide identification and expression profiling of the Dof transcription factor gene family in Chrysanthemum morifolium. Front. Plant Sci. 2016, 7, 199. [Google Scholar] [CrossRef] [PubMed] [Green Version]
  43. Cheng, L.; Liu, B.L.; Liu, P.; Xing, H.R.; Zhang, A.Y.; Zhang, L. Genome-wide analysis and expression profiling of DOF family in Setaria viridis. Mol. Plant Breed. 2018, 13, 4226–4234. [Google Scholar]
  44. Yanagisawa, S. The Dof family of plant transcription factors. Trends Plant Sci. 2002, 7, 555–560. [Google Scholar] [CrossRef]
  45. Peng, J.H.; Sun, D.; Nevo, E. Domestication evolution, genetics and genomics in wheat. Mol. Breed. 2011, 28, 281. [Google Scholar] [CrossRef]
  46. Mena, M.; Vicente-Carbajosa, J.; Schmidt, R.; Carbonero, P. An endosperm-specific DOF protein from barley, highly conserved in wheat, binds to and activates transcription from the prolamin-box of a native B-hordein promoter in barley endosperm. Plant J. 1998, 16, 53–62. [Google Scholar] [CrossRef] [Green Version]
  47. Washio, K. Identification of Dof proteins with implication in the gibberellin-regulated expression of a peptidase gene following the germination of rice grains. Biochim. Et Biophys. Acta 2001, 1520, 54–62. [Google Scholar] [CrossRef]
  48. Iwamoto, M.; Higo, K.; Takano, M. Circadian clock- and phytochrome-regulated Dof-like gene, Rdd1, is associated with grain size in rice. Plant Cell Environ. 2009, 32, 592–603. [Google Scholar] [CrossRef]
  49. Tanaka, M.; Takahata, Y.; Nakayama, H.; Nakatani, M.; Tahara, M. Altered carbohydrate metabolism in the storage roots of sweetpotato plants overexpressing the SRF1 gene, which encodes a Dof zinc finger transcription factor. Planta 2009, 230, 737–746. [Google Scholar] [CrossRef]
Figure 1. Phylogenetic tree of Dof proteins in wheat, maize, rice, and Arabidopsis. Protein sequences were aligned using ClustalW2 and the phylogenetic tree was constructed using the Bootstrap ML tree method (1000 replicates) in MEGA 7.0 software. Each type is marked by a different color. Bootstrap values are shown on the branches. Dofs from wheat, rice, maize, and Arabidopsis are distinguished by different shapes.
Agronomy 10 00294 g001
Figure 2. Multiple sequence alignment of Dof domains in identified wheat Dof proteins. Sequences were aligned using MEGA7.0, and manually refined. Identical amino acids are shown at the bottom and the four cysteine residues are indicated at the top. A sequence LOGO view based on the sequence alignment is shown at the bottom.
Agronomy 10 00294 g002
Figure 3. Phylogenetic relationships, exon–intron structures and motif compositions of wheat Dof (TaDof) proteins. (A) Multiple alignment of Dof proteins in Triticum aestivum L. The tree was constructed using MEGA7 with a bootstrap of 1000 by the maximum likelihood (ML) method. (B) Exon–intron structures of Dof genes in Triticum aestivum L. obtained from the GSDS database. Lengths of exons and introns for each TaDof gene are displayed proportionally. Untranslated regions (UTRs), exons and introns are represented by blue, yellow and black boxes/lines, respectively. (C) MEME analysis of TaDofs protein motif compositions. MAST was used to show the models of motif compositions in Dof amino acid sequences. Each box with a specific color indicates a motif and black lines represent non-conserved sequences.
Agronomy 10 00294 g003
Figure 4. Syntenic analysis of TaDofs. (A) Chromosomal locations of 108 Dof genes in wheat. Gene classes are in different colors. Cyan, Group I; dark blue, Group II; orange, Group III; blue, Group IV; purple, Group V; green, Group VII; dark red, Group VIII. Segmentally duplicated homologous genes and tandemly duplicated genes are indicated with gray lines and gray rectangles, respectively. (B) Genome-wide syntenic analysis among common wheat (Ta, AABBDD, red box) and progenitor species Aegilops tauschii (Ae, DD, orange box), T. urartu (Tu, AA, blue box), and T. dicoccoides (Td, AABB, green box). (C) Ka/Ks values for duplicated TaDof gene pairs.
Agronomy 10 00294 g004
Figure 5. Functional annotation and sub-cellular localization analysis of TaDofs. (A) GO (Gene Ontology) annotation of TaDof genes. (B) Sub-cellular localization of TaDofs were experimentally confirmed by microscopy. Images were merged by bright field, green fluorescence, and DAPI channels (Bar = 25 um).
Agronomy 10 00294 g005
Figure 6. Expression pattern profiling of TaDofs using large-scale transcriptome data. Depth of the color represents the level of gene expression. Log2(TPM+1) was used to scale the expression levels of TaDofs. TaDofs were divided into five groups (1st, 2nd, 3rd, 4th, and 5th) according expression patterns.
Agronomy 10 00294 g006
Figure 7. Integration of expression profiles, miRNAs, and cis-elements. Box “All” contained all 337 profiling situations and “growth and development stage” contained 211 conditions, “biotic stress” contained 97 conditions, and “abiotic stress” contained 29 conditions. t-tests were used to analyze the significance of expression pattern differences among “growth and development stage”, “biotic stress”, and “abiotic stress” (shortened as Growth/Biotic, Growth/Abiotic, and Biotic/Abiotic) (*, p < 0.05). The numbers of miRNAs targeting corresponding TaDofs are shown in the “miRNA” panel. The numbers of cis-elements in TaDof promoters are shown in the “Growth and development”, “Phytohormone response”, and “Biotic/abiotic stress” panels.
Agronomy 10 00294 g007
Figure 8. The qRT-PCR results. t-tests were used to determine significant differences in expression patterns for CK versus mannitol, NaCl and PEG treatments (*, p < 0.05).
Agronomy 10 00294 g008
Table 1. DNA binding with one finger (Dof) gene family members in wheat.
GroupDof GeneGene ID1 Length2 MW3 pI4 Ins5 Ali6 GRAVY
ITaDof1.1-1ATraesCS1A02G171300.125826.149.4458.4653.14−0.353
TaDof1.1-1BTraesCS1B02G185900.126426.549.3655.3351.93−0.329
TaDof1.2-2ATraesCS2A02G225900.135635.67.6952.5961.69−0.229
TaDof1.2-2BTraesCS2B02G249200.135535.687.7151.3861.01−0.262
TaDof1.2-2DTraesCS2D02G231600.135635.717.753.4760.81−0.265
IITaDof2.1-2A.1TraesCS2A02G590800.121923.627.5975.8747.81−0.752
TaDof2.1-2B.1TraesCS2B02G592900.120722.288.1172.2854.83−0.65
TaDof2.1-2D.1TraesCS2D02G563400.120722.268.574.1150.14−0.717
TaDof2.1-2A.2TraesCS2A02G590700.120121.78.1777.1852.59−0.655
TaDof2.2-2A.1TraesCS2A02G591200.121422.816.1282.8948.5−0.61
TaDof2.2-2B.1TraesCS2B02G592600.118620.076.8983.6643.17−0.84
TaDof2.2-2D.1TraesCS2D02G563000.121723.226.0783.5246.04−0.751
TaDof2.2-2A.2TraesCS2A02G591000.124926.588.0880.8850.32−0.681
TaDof2.2-2D.2TraesCS2D02G563100.122523.986.5773.3553.51−0.644
TaDof2.3-2ATraesCS2A02G591100.121222.468.874.0851.04−0.621
TaDof2.3-2BTraesCS2B02G592700.122223.635.9374.0951.62−0.637
TaDof2.4-2BTraesCS2B02G592800.121223.176.8868.6649.43−0.799
TaDof2.4-2DTraesCS2D02G563200.121223.368.1769.151.86−0.578
IIITaDof3.1-1ATraesCS1A02G035200.136137.28.7262.4752.91−0.393
TaDof3.1-1BaTraesCS1B02G045000.135636.348.9156.9355.03−0.337
TaDof3.1-1BbTraesCS1B02G045000.236237.088.9156.4554.39−0.372
TaDof3.1-1BcTraesCS1B02G045000.336737.718.6156.1354.71−0.378
TaDof3.1-1DaTraesCS1D02G036700.136136.968.7758.6654.02−0.381
TaDof3.1-1DbTraesCS1D02G036700.236637.598.458.3154.34−0.387
TaDof 3.2-3ATraesCS3A02G532000.137238.548.6361.5834.57−0.732
TaDof 3.2-3BTraesCS3B02G608800.137638.778.4861.8534.2−0.746
TaDof 3.2-3DTraesCS3D02G537400.137638.638.4861.1634.2−0.716
TaDof 3.3-3A.1TraesCS3A02G532100.1379419.0656.6153.35−0.596
TaDof 3.3-3A.2TraesCS3A02G532200.135538.358.3653.4949.24−0.616
TaDof 3.3-3A.3TraesCS3A02G539000.126928.746.8854.8142.94−0.611
TaDof 3.3-3B.1TraesCS3B02G608900.135537.78.9155.3151.44−0.521
TaDof 3.3-3B.2TraesCS3B02G609000.135237.658.6958.1542.44−0.651
TaDof 3.3-3B.3TraesCS3B02G609100.134736.896.9555.2148.41−0.554
TaDof 3.3-3D.1TraesCS3D02G537500.138241.68.8656.4643.48−0.804
TaDof3.4-4ATraesCS4A02G097800.138339.729.4266.8847.6−0.565
TaDof3.4-4BTraesCS4B02G206800.137939.359.567.0748.47−0.557
TaDof3.4-4DTraesCS4D02G207600.138139.479.6265.8247.09−0.557
TaDof3.5-5AaTraesCS5A02G078100.134235.278.9154.657.49−0.338
TaDof3.5-5AbTraesCS5A02G078100.233934.888.9154.6557.99−0.326
TaDof3.5-5BaTraesCS5B02G087600.134034.938.9155.3458.97−0.332
TaDof3.5-5BbTraesCS5B02G087600.234135.068.9155.7758.8−0.341
TaDof3.5-5BcTraesCS5B02G087600.334435.448.9155.7158.28−0.353
TaDof3.5-5DaTraesCS5D02G093800.134135.428.9152.0857.03−0.377
TaDof3.5-5DbTraesCS5D02G093800.234535.688.9151.6256.7−0.379
TaDof3.6-5ATraesCS5A02G479400.146747.919.4344.6356.75−0.673
TaDof3.6-5BTraesCS5B02G492600.145246.279.359.8945.66−0.588
TaDof3.6-5DTraesCS5D02G493000.145546.479.355.8644.53−0.594
IVTaDof4.1-3ATraesCS3A02G403500.163169.628.1955.9767.29−0.5
TaDof4.2-5ATraesCS5A02G155900.133834.788.0942.2553.67−0.435
TaDof4.2-5BTraesCS5B02G154100.133835.218.7843.5750.8−0.464
TaDof4.2-5DTraesCS5D02G161000.134235.478.5947.7156.17−0.421
TaDof4.3-6ATraesCS6A02G274000.130632.648.0548.2361.41−0.355
TaDof4.3-6BTraesCS6B02G301500.130632.498.3246.6461.76−0.329
TaDof4.3-6DTraesCS6D02G254200.130632.468.3248.6860.78−0.342
VTaDof5.1-1ATraesCS1A02G275000.131633.515.354.3562.82−0.399
TaDof5.1-1BTraesCS1B02G284300.131633.595.3951.161.87−0.406
TaDof5.1-1DTraesCS1D02G274700.137740.26.4558.0970.5−0.284
TaDof5.2-2ATraesCS2A02G402200.137838.358.6547.9444.37−0.499
TaDof5.2-2BTraesCS2B02G420400.137638.118.6548.3944.6−0.508
TaDof5.2-2DTraesCS2D02G399500.137838.38.6547.6243.6−0.52
TaDof5.3-3ATraesCS3A02G377000.133135.234.6853.9360.18−0.343
TaDof5.3-3BTraesCS3B02G409600.133135.224.6853.4960.48−0.349
TaDof5.3-3DTraesCS3D02G370100.133135.234.6653.558.7−0.393
TaDof5.4-6ATraesCS6A02G255500.139240.238.4551.6244.46−0.64
TaDof5.4-6BTraesCS6B02G270100.138940.128.4550.7545.78−0.624
TaDof5.4-6DTraesCS6D02G236700.139140.058.4550.3544.32−0.635
VIITaDof7.1-3ATraesCS3A02G106500.123825.319.4165.4472.69−0.221
TaDof7.1-3BTraesCS3B02G125100.123024.439.2166.2670.09−0.28
TaDof7.1-3DTraesCS3D02G108600.123024.479.3861.270.09−0.259
TaDof7.2-3ATraesCS3A02G271700.11551610.4670.9348.62−0.541
TaDof7.2-3BTraesCS3B02G305400.115415.8910.4667.5848.57−0.523
TaDof7.2-3DTraesCS3D02G271300.115215.7710.4674.4745.92−0.597
TaDof7.3-4ATraesCS4A02G234000.126628.049.4654.3761.47−0.306
TaDof7.3-4BTraesCS4B02G081500.126527.859.350.9264.64−0.272
TaDof7.3-4DTraesCS4D02G080100.126327.729.2755.262.93−0.283
TaDof7.4-5ATraesCS5A02G251800.128128.694.8962.9344.77−0.557
TaDof7.4-5BTraesCS5B02G249800.128128.844.9359.9646.83−0.507
TaDof7.4-5DTraesCS5D02G259700.128128.864.8664.2845.84−0.576
TaDof7.5-5ATraesCS5A02G401800.138139.479.4264.754.67−0.448
TaDof7.5-5BTraesCS5B02G406500.138239.519.4266.4254.53−0.442
TaDof7.5-5DTraesCS5D02G412000.138039.269.3366.9455.58−0.422
TaDof7.6-6ATraesCS6A02G287700.129130.385.5771.4350.52−0.42
TaDof7.6-6BTraesCS6B02G317100.128930.315.9268.3352.53−0.401
TaDof7.7-6DTraesCS6D02G268400.129030.215.9169.8950.34−0.417
TaDof7.8-7ATraesCS7A02G213400.128429.156.8145.6453.87−0.251
TaDof7.8-7DTraesCS7D02G215300.128429.026.7149.1756.3−0.222
TaDof7.9-7BTraesCS7B02G120600.131932.928.6249.7254.39−0.378
VIIITaDof8.1-1ATraesCS1A02G334100.120922.249.650.1157.51−0.494
TaDof8.1-1BTraesCS1B02G347400.120922.279.653.5658.9−0.476
TaDof8.2-1DTraesCS1D02G336600.121423.019.3248.0459.35−0.516
TaDof8.3-2ATraesCS2A02G079200.132632.889.1162.1350.46−0.372
TaDof8.3-2BTraesCS2B02G094000.133033.279.1659.6848.67−0.376
TaDof8.3-2DTraesCS2D02G076600.132833.049.2463.4448.96−0.383
TaDof8.4-2ATraesCS2A02G100800.142751.045.6259.0950.19−0.659
TaDof8.4-2BTraesCS2B02G118000.147950.925.8853.2851−0.629
TaDof8.4-2DTraesCS2D02G100300.150153.356.2753.2851.68−0.615
TaDof8.5-3ATraesCS3A02G180600.153958.125.0654.9151.45−0.815
TaDof8.5-3BTraesCS3B02G210300.153958.135.1458.751.47−0.806
TaDof8.5-3DaTraesCS3D02G185500.150655.035.7352.4854.8−0.72
TaDof8.5-3DbTraesCS3D02G185500.253857.945.155.6151.75−0.798
TaDof8.6-3ATraesCS3A02G189600.147651.917.1456.8667.21−0.544
TaDof8.6-3DTraesCS3D02G193100.147651.916.5454.3164.75−0.555
TaDof8.7-3ATraesCS3A02G306800.120222.059.7866.4649.95−0.732
TaDof8.7-3BTraesCS3B02G329700.120422.199.6468.2550.39−0.692
TaDof8.7-3DTraesCS3D02G295100.120021.89.9172.1747.05−0.774
TaDof8.8-4ATraesCS4A02G017700.143747.278.1552.7751.94−0.75
TaDof8.8-4BTraesCS4B02G286400.143346.788.4548.5555.75−0.663
TaDof8.8-4DTraesCS4D02G285100.144247.628.1548.5255.48−0.689
1 Length, Amino acid length; 2 MW, Molecular weight, KDa; 3 pl, Isoelectric point; 4 Ins, Instability index; 5 Ali, Aliphatic index; 6 GRAVY, Grand average hydropathy.
Table 2. Customized functional annotations of TaDofs.
IDSpeciesFunctionHits of Wheat TaDof Genes
NtBBF1TobaccoAuxin responseTaDof3.4-4A, TaDof3.15-4B, TaDof3.4-4D, TaDof4.3-6A, TaDof5.1-1D, TaDof7.6-6A, TaDof7.6-6B, TaDof7.7-6D, TaDof8.3-2A, TaDof8.3-2B, TaDof8.3-2D
OsDof3RiceGibberellin responseTaDof4.3-6B, TaDof4.3-6D
AtDof3.4/OBP1ArabidopsisCell cycle, defense responseTaDof7.6-6A, TaDof7.6-6B, TaDof7.7-6D
AtDof4.1ArabidopsisTranscriptional repressorTaDof5.1-1A, TaDof5.4-6A, TaDof5.4-6B, TaDof5.4-6D, TaDof5.1-1B, TaDof5.1-1D, TaDof5.2-2A, TaDof5.2-2B, TaDof5.2-2D
GmDof17-1MaizeGrowth inhibitionTaDof5.3-3A, TaDof5.3-3B, TaDof5.3-3D
AtDof2.4ArabidopsisVascular developmentTaDof3.6-5A, TaDof4.3-6A, TaDof4.3-6B, TaDof4.3-6D, TaDof7.1-3D
AtDof5.1ArabidopsisLeaf axial patterningTaDof1.2-2A, TaDof1.2-2B, TaDof1.2-2D, TaDof3.4-4A, TaDof3.15-4B, TaDof3.4-4D, TaDof3.6-5A, TaDof3.5-5B, TaDof3.3-3B.1, TaDof4.3-6A, TaDof4.3-6B, TaDof4.3-6D, TaDof8.3-2A, TaDof8.3-2B, TaDof8.3-2D
AtDof5.4/OBP4ArabidopsisRoot hair growthTaDof5.1-1B, TaDof5.1-1D, TaDof5.3-3A, TaDof5.3-3B, TaDof5.3-3D, TaDof7.5-5A, TaDof7.5-5B, TaDof7.5-5D, TaDof7.1-3B
StDof1PotatoGuard cell specificityTaDof1.2-2A, TaDof1.2-2B, TaDof1.2-2D, TaDof3.6-5A, TaDof3.6-5B, TaDof3.22, TaDof4.1, TaDof4.3-6B, TaDof4.3-6D, TaDof7.5-5A, TaDof7.5-5B, TaDof7.5-5D, TaDof7.8-7A, TaDof7.9-7B, TaDof7.8-7D, TaDof8.3-2A, TaDof8.3-2B, TaDof8.3-2D
BPBFBarleyEndosperm specificityTaDof4.2-5A, TaDof4.2-5B, TaDof4.2-5D
WPBFWheatEndosperm specificityTaDof4.2-5A, TaDof4.2-5B, TaDof4.2-5D
COG1ArabidopsisSeed germination pathway mediated by lightTaDof8.5-3A, TaDof8.5-3B, TaDof8.5-3D, TaDof8.4-2A, TaDof8.4-2B, TaDof8.4-2D
DGA2ArabidopsisSeed germinatingTaDof3.5-5A, TaDof3.5-5B, TaDof3.5-5D, TaDof5.3-3A, TaDof5.3-3B, TaDof5.3-3D, TaDof7.5-5A, TaDof7.5-5B, TaDof7.5-5D
SADBarleySeed germinatingTaDof4.3-6A, TaDof4.3-6B, TaDof4.3-6D, TaDof5.1-1A, TaDof5.4-6A, TaDof5.4-6B, TaDof5.4-6D, TaDof5.1-1B, TaDof5.1-1D, TaDof5.3-3B, TaDof5.3-3D
MaDof23BananaFruit ripeningTaDof4.3-6A, TaDof4.3-6B, TaDof4.3-6D, TaDof7.5-5A, TaDof7.5-5D, TaDof8.3-2A, TaDof8.3-2B, TaDof8.3-2D
OsDof15RiceRoot meristem cell proliferation TaDof3.4-4A, TaDof3.15-4B, TaDof3.4-4D, TaDof3.5-5A, TaDof3.5-5B, TaDof3.5-5D, TaDof5.1-1A, TaDof5.1-1B, TaDof5.1-1D, TaDof5.3-3A, TaDof5.3-3B, TaDof5.3-3D, TaDof7.6-6A, TaDof7.6-6B, TaDof7.7-6D, TaDof7.8-7D, TaDof8.3-2A, TaDof8.3-2B, TaDof8.3-2D
OsDof24RiceDetermining flowering timeTaDof1.2-2A, TaDof1.2-2D, TaDof4.3-6A, TaDof4.3-6B, TaDof4.3-6D, TaDof5.1-1A, TaDof5.1-1B, TaDof5.1-1D, TaDof5.3-3A, TaDof5.3-3B, TaDof5.3-3D, TaDof7.1-3A, TaDof7.5-5A, TaDof7.5-5B, TaDof7.5-5D, TaDof7.6-6A, TaDof7.6-6B, TaDof7.7-6D, TaDof7.9-7B, TaDof7.8-7D, TaDof7.1-3B, TaDof7.1-3D, TaDof7.3-4A, TaDof7.3-4B, TaDof7.3-4D, TaDof8.3-2A, TaDof8.3-2B, TaDof8.3-2D
Rdd1RicePhotoperiodic floweringTaDof8.5-3B
SCAP1ArabidopsisDevelopment of functional stomataTaDof7.1-3A, TaDof7.1-3D
AtDof1.1/OBP2ArabidopsisGlucosinolate biosynthesisTaDof4.3-6A, TaDof4.3-6B, TaDof4.3-6D, TaDof5.3-3A, TaDof5.3-3B, TaDof5.3-3D
ZmDof1MaizePollen development, light response, carbon metabolism, nitrogen assimilationTaDof1.2-2A, TaDof1.2-2B, TaDof4.3-6A, TaDof4.3-6B, TaDof4.3-6D, TaDof5.3-3A, TaDof5.3-3B, TaDof5.3-3D, TaDof7.1-3A, TaDof7.5-5A, TaDof7.5-5B, TaDof7.5-5D, TaDof7.6-6A, TaDof7.6-6B, TaDof7.7-6D, TaDof7.9-7B, TaDof7.1-3B, TaDof7.1-3D
OsDOF18RiceCarbon and nitrogen metabolismTaDof1.2-2A, TaDof1.2-2D, TaDof4.3-6A, TaDof4.3-6B, TaDof4.3-6D, TaDof5.1-1A, TaDof5.1-1B, TaDof5.1-1D, TaDof5.3-3A, TaDof5.3-3B, TaDof5.3-3D, TaDof7.1, TaDof7.5-5A, TaDof7.5-5B, TaDof7.5-5D, TaDof7.6-6A, TaDof7.6-6B, TaDof7.7-6D, TaDof7.9-7B, TaDof7.8-7D, TaDof7.1-3B, TaDof7.1-3D, TaDof7.3-4A, TaDof7.3-4B, TaDof7.3-4D, TaDof8.3-2A, TaDof8.3-2B, TaDof8.3-2D
SRF1SweetpotatoCarbon metabolismTaDof8.1-1A
ZmDOF36MaizeStarch synthesisTaDof1.2-2D, TaDof2.1-2A.2, TaDof2.2-2D.1, TaDof2.4-2D, TaDof2.1-2D.1, TaDof2.1-2A.2, TaDof2.4-2A, TaDof2.2-2B.1, TaDof2.4-2B, TaDof2.1-2B.1, TaDof3.6-5A, TaDof3.6-5B, TaDof7.8-7A, TaDof7.9-7B, TaDof7.8-7D, TaDof7.1-3D, TaDof8.3-2A, TaDof8.3-2B, TaDof8.3-2D
OsDof25RiceC4 photosynthesisTaDof4.3-6A, TaDof4.3-6B, TaDof4.3-6D, TaDof5.1-1A, TaDof5.4-6A, TaDof5.4-6B, TaDof5.4-6D, TaDof5.1-1B, TaDof5.2-2A, TaDof5.2-2B, TaDof5.2-2D, TaDof5.3-3A, TaDof5.3-3B, TaDof5.3-3D, TaDof7.1-3A, TaDof7.5-5A, TaDof7.5-5B, TaDof7.5-5D, TaDof7.8-7A, TaDof7.9-7B, TaDof7.8-7D, TaDof7.1-3B, TaDof7.1-3D, TaDof7.3-4A, TaDof7.3-4B, TaDof7.3-4D, TaDof8.3-2A, TaDof8.3-2B, TaDof8.3-2D

