Abstract
In bioretention ponds proposed to manage urban runoff, floating elements with anchored macrophytes plants improve nutrient and pollutants removal and provide aesthetic benefits. To prompt the establishment and initial growth of plants in floating elements with substrate, the application of Osmocote (a controlled-release fertilizer) in tablet form was proposed. In a confined environment, eight treatments were compared, combining two substrates (peat and zeolite at a ratio of 1:1 or 2:1 v/v), two levels of fertilization (without or with addition of Osmocote plus tablets; 5 g plant−1), and the presence or absence of Mentha aquatica L. plants. For about 16 weeks, the amount and quality of water, along with plant growth and nutrient content, were monitored. The results showed better plant growth when Osmocote was supplied, with no effect of the substrate. The presence of the plant produced the almost total uptake of the nutrients contained in the tap water and released by the fertilizer. This indicates that the use of a controlled release fertilizer can improve plant growth without compromising water quality, hence being a valuable solution to promote plant establishment usable as routine practice when a bioretention basin is vegetated with floating elements with substrate.
1. Introduction
Stormwater retention ponds are widely used in the best management practices in North America, Australia, and Europe to sustainably manage stormwater runoff [1,2,3,4,5,6]. They are part of the Natural Water Retention Measures (NWRM), which were recently launched by the European Commission to protect and manage water resources using natural means and processes, particularly reducing their vulnerability to the negative effects of floods and droughts [7,8,9]. Bioretention ponds can also be defined as blue-green infrastructures [10], and are able, at the same time, to control stormwater runoff, thus reducing flooding and erosion, and improve water quality [11]. The first aspect involves the reduction of stormwater peak flows and total volumes and is mainly related to appropriate planning and sizing [4], whereas the second refers to the abatement of nutrients and pollutants that are directly linked to the presence of plant, the development of microbial population on the root systems surface, and other chemical-physical processes (e.g., sedimentation, filtration, volatilization, photo-oxidation) [1,12,13,14,15,16,17,18].
As a consequence of the need to have a high water storage capacity, bioretention basins often have a high depth that does not allow the adequate development of rooted macrophytes. The results are that bioretention ponds often fail to improve water quality [19,20,21]. A possible solution consists in the implementation of this technology with naturally or artificially occurring floating vegetation, which is a suitable and affordable means to improve stormwater treatment efficiency [19,22]. Particularly, basins with artificially floating vegetation are a hybridization of ponds and wetlands that utilize rooted, emergent macrophytes growing on a mat or raft floating on the surface of the water rather than rooted in the sediments. This solution offers potential advantages [23] because plants can tolerate the widely fluctuating water depths typical of stormwater systems and their root system provide oxygen [24] and a large surface area for microbial populations attachment [25], which are among the most important actors during the wastewater treatment process. In addition, the floating elements may or may not include a planting medium that provides better plant support and can possibly also act as a contaminant sorptive substrate [26,27,28,29,30].
However, due to its batch working, the function of retention ponds (stormwater runoff regulation and treatment) may negatively compromise floating vegetation establishment and development as consequence of low nutrient availability, especially at the end of a dry period that reduces the presence of water or at the end of a heavy rain period that produce water dilution. In turn, this has negative effects on treatment performances. It has to be mentioned that retention ponds are also meant to provide recreation areas and aesthetic amenities [20,31], hence, poor plant growth is undesirable also from this perspective.
The aim of this study was, first, to evaluate the effect of a controlled-release fertilizer used to promote the first establishment of Mentha aquatica L. and water quality in substrate-provided floating elements intended for bioretention ponds. Second, the suitability of substrates containing different rates of zeolite to retain nutrients and reduce their concentration in water was also evaluated, as this substrate is known for its high cation exchange capacity.
2. Materials and Methods
2.1. Setup of the Experiment
The study was conducted in a glass greenhouse at the “L. Toniolo” experimental farm of Padova University at Legnaro, Northeast Italy (45°20′ N; 11°57′ E). The greenhouse has an area of 230 m2 and is 6-m high at the ridge and 4-m high at the gutters. From February 7 o May 2, 2018, plants were grown under natural photoperiod conditions. The roof and sidewall vents were set for opening and closing at 25 °C and 22 °C, respectively, and the heating system set at 20 °C.
The experimental treatments considered two substrates and two fertilization treatments, both with and without plants. The substrates were formulated mixing sphagnum white peat with zeolite in two ratios (1:1 and 2:1 by volume). Peat was obtained from UAB Presto Durpes (Vilnius, Lithuania) and is characterized by a declared particle size of 0–40 mm and degree of humification of H2–H4. Zeolite was provided by Europomice (Milan, Italy) and is characterized by a declared particle size of 0–3 mm and a cation exchange capacity of 170 meq g−1. In Table 1, the selected physical and chemical characteristics of the raw materials and of the two formulated substrates are reported.

Table 1.
Physical-chemical characteristics of the raw materials and of the two substrates used in the experiment. The total amounts (mg tank−1) are reported in brackets.
The fertilizer used in this study was Osmocote Plus Tablet (12–24–6+ TE, 8–9 M, Scotts International B.V., Harderwijk, The Netherlands), a controlled-release fertilizer intended for aquatic plants with 1/3 of nitrogen (N) as nitrate-N and 2/3 as ammonium-N. The fertilizer was in tablet form, each with a weight of about 5 g. Fertilization treatment consisted in the application or not of one tablet per pot (hence supplying 600 mg, 524 mg, and 250 mg NPK per container).
Two-node cuttings of M. aquatica were rooted in perlite (Europomice, Milan, Italy). The cuttings were watered daily with a standard nutrient solution (approximately 150 mL per cutting), which was prepared by dissolving 1 g L−1 of a water soluble fertilizer (Flory 3 15–10–15, Euflor, Munich, Germany). After three weeks, 24 square net pots (11 cm × 11 cm, 11 cm height), lined with agricultural fleece, were filled with 900 mL of substrate (12 for each substrate). Rooted cuttings were selected for uniformity and transplanted (three per container) in half container of each substrate. At this moment, plants had a fresh weight of 7.13 ± 1.43 g and a dry weight of 0.70 ± 0.15 g. Plants were then allowed to establish for 14 days before initiation of the experiment. During this period, all containers were watered through subirrigation using individual saucers. Twenty-four black plastic crate boxes (62.5 cm × 37 cm, 26 cm height, 46 L volume) were filled with 35 L of tap water. The chemical characteristics of the water are reported in Table 2.
Table 2.
Ionic composition, pH, and electrical conductivity of the tap water used in the experiment.
A polystyrene panel (similar surface of the crate boxes and 3-cm height) was laid on the water surface, and one container (with or without plant according with the treatment) was plugged in a hole created in each panel, letting the bottom 7 cm of the container submerge in water (Figure 1). At last, in half of the containers with plants and in half of the container without plants, an Osmocote tablet was plugged close to the plant, just underneath the substrate surface. Three supplemental crate boxes, filled with water and only covered with a polystyrene panel, were also included in the experiment as an absolute control.
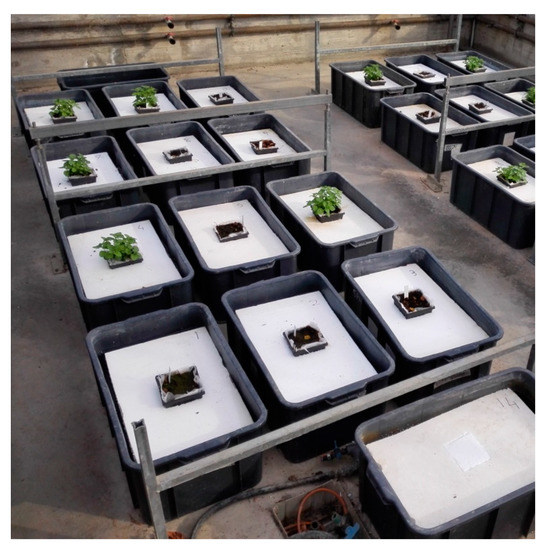
Figure 1.
Photograph of the experimental site showing the plastic crate boxes filled with the polystyrene panels floating on the water and bearing the net pots containing the substrates and, according to the experimental design, Mentha aquatica L. plants. At the bottom right of the picture, a crate box without pot and plant was used to evaluate water losses by evaporation.
2.2. Water Monitoring
Crate boxes were refilled with tap water two times (4 April and 3 May) during the experiment and at the end of the experiment (29 May) to restore the initial level of 35 L. The added water volume was recorded. At the beginning of the experiment, and at seven-day intervals, water was monitored for dissolved oxygen (mg L−1), pH, and electric conductivity (EC; μS cm−1) using a portable multi-parameter meter (HQ40d Portable Multi-Parameter Meter, Hach Lange GmbH, Düsseldorf, Germany). Water turbidity (NTU) was also measured using the 2100P Turbidimeter (Hach, Loveland, CO, US). The day in which the crate boxes were refilled, water was analyzed both before and after refilling. The tap water used to fill and refill the crate boxes and the water of all crate boxes at the end of the experiment was analyzed for anion (NO3−, PO43−, SO42−, Cl−) and cation (NH4+, K+, Ca2+, Mg2+, Na+) content by ion chromatography (ICS-900 system, Dionex Corp., Milan, Italy).
2.3. Plant Growth and Analysis
Plant height was measured every two weeks throughout the experiment. Furthermore, rooted cuttings at the beginning of the experiment and plants at the end were separate into above and below-ground plant organs, and fresh weight was recorded. Then, above and below-ground biomass were dried in a ventilated oven at 65 °C until constant weight to determine dry weight and dry matter content. During the experiment, phylloptosis occurred because of severe nutrient deficiency, which took place, in particular, in non-fertilized plants. Thus, dropped leaves were periodically collected and weighed. Thereafter, the biomass of the whole plant was recomposed, milled, and analyzed for mineral content. Total Kjeldahl nitrogen (TKN) was determined by the Kjeldahl method (Kjeltec 2300 Auto Analyser; Foss-Tecator, Hillerød, Denmark). The other mineral contents (P, K, Ca, Mg) were determined by inductively coupled plasma optical emission spectrometry (ICP-OES, Arcos EOP, Spectro A. I. GmbH, Kleve, Germany), adopting the procedure described by Zancan et al. [32]. Data were used to calculate the total nutrient uptake by multiplying concentrations by their respective dry weights. Analysis of nutrient content were performed also on three samples of the initial rooted cuttings (1.25%, 0.18%, 2.19%, 1.20%, and 0.45% of N, P, K, Ca, and Mg, respectively), so that the net nutrient uptake was determined.
2.4. Statistical Analysis
The study was arranged as a 2 × 2 × 2 factorial experiment in a completely randomized design with three replications. Data on water parameters were analyzed using a three-way ANOVA, and data on plant growth and analysis using a two-way ANOVA. When the ANOVA was significant (P < 0.05), means were differentiated by Tukey’s HSD test. Data collected on the supplemental crate boxes (absolute control) were only used to estimate water evaporation and the pattern of its parameters in standing water. In figures where data of absolute control are reported, means are presented ± standard deviation.
3. Results
3.1. Water Monitoring
Rapidly after experiment setup, the pH increased from about 6.5 to over 8 (Figure 2). From 28 March to 9 May, in the absence of plants, the pH values of water were constantly higher than those with plants. The plants affect the pH of the nutrient solution because of a selective ion uptake [33,34,35]. During rapid plant growth, and in normal sunlight conditions, the anion uptake is normally higher than that of cations because of the high needs for nitrogen (i.e., nitrates) [35], so that pH is increased. In the present experiment, the lower pH values observed with plants than without plants could be explained by the low availability of nitrates (the most important anion) in the water, even when the fertilizer was applied, as Osmocote has two-thirds of nitrogen in ammoniacal form.
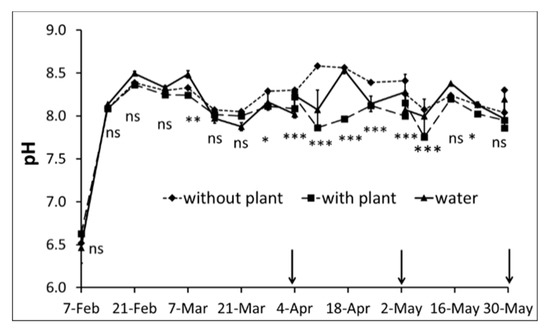
Figure 2.
Variation of water pH during the experiment. Arrows indicate the dates at which the water lost for evapotranspiration was restored. At each date, values of water are presented with bars of standard deviation; asterisks indicate statistical significance according to ANOVA (* P < 0.05, ** P < 0.01, *** P < 0.001, ns = not significant).
Electrical conductivity (EC) is a measure of the amount of salts that is dissolved in the water, and it is often determined as an easy way to evaluate overall nutrients release from fertilizers [36,37,38]. In general, the EC of the tap water tended to decrease over time, probably because of processes such as the precipitation of calcium carbonate and chlorine volatilization, which partially counteract with ion concentration due to water evaporation (Figure 3). The EC of tanks containing plants clearly increased over time and reached the highest values at the end of the experiment (+18.4% after the recovery of water lost for evapotranspiration) (Figure 3A). As it occurs in closed hydropic systems, EC increases because of the different plant uptake of water and nutrients and ion accumulation, particularly of the ballast or poorly absorbed ones [39]. In tanks set up with containers and substrates, but without plants, EC remained quite stable, as the depletion observed in only water was probably counteracted by the ion release from the substrates (Figure 3A). Figure 3B reinforces the latter assumption, indicating that the substrate containing the higher amount of zeolite (i.e., with higher ion concentration; cfr Table 1) was the one that produced the higher EC increase. It has to be reported that the presented main effects do not highlight the fact that in the treatments fertilized but without plants, the EC increased because of a nutrient release by fertilizer, and this release had a sigmoidal pattern (except for the EC change because of the water refill) in accordance with what has been reported in literature for a controlled-release fertilizer [40,41,42]. The effect of the fertilizer application is obvious, and, in fact, the supply of nutritional ions increased EC to a similar extent of the presence of the plant (Figure 3C).
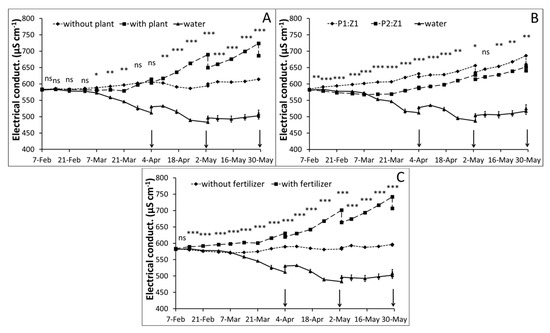
Figure 3.
Variation of water electrical conductivity during the experiment as affected by the presence or absence of plants (A), substrate (P1:Z1 and P2:Z1 indicate a peat to zeolite volumetric ratio of 1:1 and 2:1, respectively) (B), and with or without fertilizer application (C). Arrows indicate the dates in which the water lost for evapotranspiration was restored. At each date, values of water are presented with bars of standard deviation; asterisks indicate statistical significance according to ANOVA (* P < 0.05, ** P < 0.01, *** P < 0.001, ns = not significant).
At different dates, an interaction effect of the presence of the plant and fertilizer application on water EC was also observed (Figure 4). The first time (4 April), only four weeks passed from the beginning of the experiment, and in the absence of the plant, the fertilizer application led to an increase of EC that was not confirmed when the plant was present, probably because of its nutrient uptake (Figure 4A). Differently, at the last time (8 May), a significantly higher EC was also found in the presence of the plant, but in a much lower magnitude than when there was no plant (+20.0 and +8.3%, respectively) (Figure 4B).
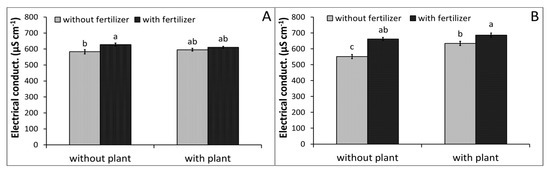
Figure 4.
Interaction effect of presence of plant and fertilizer application on water electrical conductivity on 4 April (A) and 8 May (B). Bars indicate standard error. Histogram values with different letters indicate significant differences according to Tukey’s HSD test (P < 0.05).
Figure 5A highlights that the main factor affecting the oxygen content in water was the presence of plants that use oxygen for aerobic respiration [43,44], hence reducing its concentrations. In floating systems, such as the cultivation system used in this experiment, oxygen depletion can lead to serious anoxia problems [44,45], but, in this experiment, the oxygen concentration levels were acceptable for plant growth. The application of fertilizer affected also the dissolved oxygen. When Osmocote was used, the lower values observed in the last five weeks were probably due to the higher growth of fertilized plants that, of course, had a higher demand in oxygen (Figure 5B).
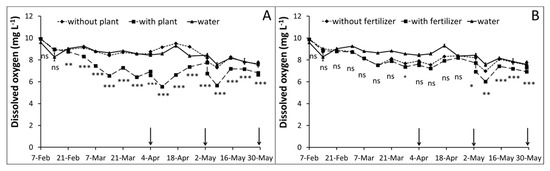
Figure 5.
Variation of the dissolved oxygen in water during the experiment as the affected by presence or absence of plants (A) and with or without fertilizer application (B). Arrows indicate the dates in which the water lost for evapotranspiration was restored. At each date, values of water are presented with bars of standard deviation; asterisks indicate statistical significance according to ANOVA (* P < 0.05, ** P < 0.01, *** P < 0.001, ns = not significant).
The turbidity of water was affected by plant and substrate main factors (Figure 6). In the absence of plants, the water turbidity was higher in the second half of the experiment, possibly because of the higher nutrient concentrations that promoted the growth of microalgae (Figure 6A). The initial high values of turbidity at the beginning of the experiment were, instead, mainly due to the use substrate and of the peat in particular (Figure 6B), of which the thinner particles dislodged from the container and were rapidly suspend in water.
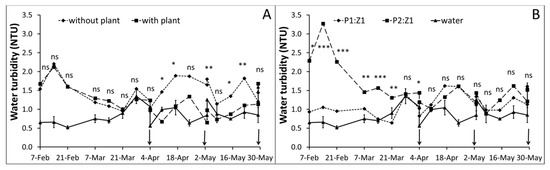
Figure 6.
Variation of water turbidity during the experiment as affected by the presence or absence of plants (A) and substrate (P1:Z1 and P2:Z1 indicate a peat to zeolite volumetric ratio of 1:1 and 2:1, respectively) (B). Arrows indicate the dates in which the water lost for evapotranspiration was restored. At each date, values of water are presented with bars of standard deviation; asterisks indicate statistical significance according to ANOVA (* P < 0.05, ** P < 0.01, *** P < 0.001, ns = not significant).
The amount of water lost by evapotranspiration throughout the experiment, which lasted for 111 days, is reported in Figure 7. Without plants, water was lost only through evaporation, and the application of fertilizer did not affect this parameter (on average, about 11 L). Values are a little higher than the only water control (10.3 L; data not shown), which did not experience evaporation from the substrate. Differently, fertilizer application with plants greatly increased losses of water by transpiration as a result of much higher biomass production. In particular, water loss by non-fertilized plants was 19.7 L, twice that of the treatment without plants (11.1 L, on average), and that of fertilized plants was further doubled (Figure 7). If we consider only transpiration, fertilized plants consumed three times that of non-fertilized plats (29.0 L vs. 9.2 L, corresponding, respectively, to 82 mL d−1 and 261 mL d−1 of average daily transpiration). It is worthy to remember that the tanks used in the experiment were initially filled with 35 L of water and restored to 35 L on two occasions (plus an additional one, at the end of the experiment, with the only purpose of evaluating overall water losses), so fertilized plant virtually used more than the water initially provided to the plants.
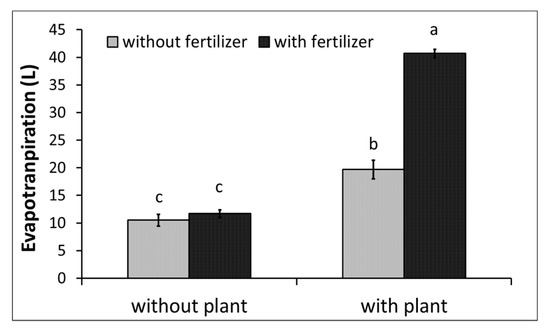
Figure 7.
Volumes of water lost by evapotranspiration during the experiment as affected by the presence of plant and fertilizer application. Bars indicate standard error. Histogram values with different letters indicate significant differences according to Tukey’s HSD test (P < 0.05).
3.2. Plant Growth
Plant growth was affected only by the fertilization treatment. Plant height increased significantly with fertilizer application as soon as four weeks from the beginning of the experiment (Figure 8). In particular, a strong reduction of the growth rate was noted in non-fertilized plants after March 21, when the nutrient concentrations in tap water were no longer able to sustain plant requests. At the end of the experiment, the plant height of fertilized plants was 143% higher than that of non-fertilized plants (Figure 8). No effect of the substrate was observed.
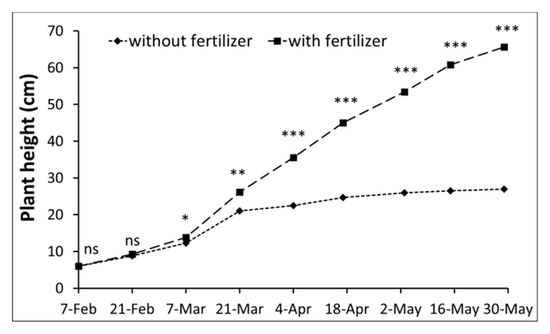
Figure 8.
Effect of fertilizer application on plant height during the experiment. At each date, values of water are presented with bars of standard deviation; asterisks indicate statistical significance according to ANOVA (* P < 0.05, ** P < 0.01, *** P < 0.001, ns = not significant).
Similarly, shoots and leaves biomass were respectively 190% and 166% higher in fertilized plants compared to the non-fertilized ones (Figure 9). Roots, which play an important role in the search for nutrients [46], were only 47.7% longer, hence significantly increasing the root-to-shoot ratio. On the contrary, as nutrient deficiency was, of course, higher in non-fertilized plants, necromass was significantly lower when Osmocote was supplied (Figure 9).
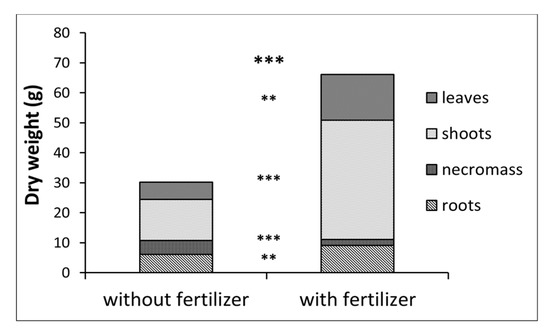
Figure 9.
Effect of fertilizer application on the dry weight of different plant organs. For each plant organ, asterisks indicate statistical significance according to ANOVA (** P < 0.01, *** P < 0.001). Bold asterisks indicate total dry weight significance.
3.3. Plant Nutrition and Quality of Water
Table 3 shows the total amount of macro- and meso-nutrients supplied with the tap water. Since these values wered derive from the sum of the initial volumes of water (equal for all) and the evapotranspirated volumes (different for each treatment) multiplied by the concentrations of nutrients in the tap water, the differences reflect those of the evapotranspiration (Figure 9), where only the presence of plant and application of the fertilizer and their interaction showed significant effects. The minor contributions, without significant differences, were observed in the tanks without the presence of the plants and with values similar to those of the control tanks. The highest values, on the other hand, were observed in tanks with plants and Osmocote fertilizer. It should also be noted that the supply of phosphate with water was negligible, as the analytical system used only detected phosphate in traces (detection limit of phosphate-P of 0.02 mg L−1) (Table 2 and Table 3).
Table 3.
Amount of nutrients (mg) supplied through the tap water in each treatment and water control only. P2:Z1 and P1:Z1 indicate substrates with a peat:zeolite ratio of 2:1 and 1:1 (v/v), respectively.
At the end of the experiment, the amount of nutrients remaining in the tanks of the only water control was 11% lower for N, unchanged for K, halved for Ca, and 13% lower for Mg compared to those supplied with fresh tap water (Table 3 and Table 4). This, at least in part, supports what previously was said about EC reduction in only water (Figure 3).
Table 4.
Amount of nutrients (mg) remaining in the water tanks in each treatment, and water control only, at the end of the experiment. P2:Z1 and P1:Z1 indicate substrates with a peat:zeolite ratio of 2:1 and 1:1 (v/v), respectively.
For the tanks of the different treatments, negligible amounts of the macronutrients were observed in the presence of the plant at the end of experiment. For instance, of the 319 mg and 59 mg of N and K supplied with tap water only, about 5 mg and 4 mg remained in the treatments with plant and fertilization. The amounts of Ca and Mg remained relatively high, with both reduced by only 55% and 50%, on average, in the two substrates (Table 3 and Table 4). Interestingly, the values of N, Ca, and Mg, observed in absence of plant and fertilization, were present to a major extent compared to the amounts supplied with the water as a result of the ion absorption to the exchange capacity of the substrate, while the K content increased for the high content in the substrate and in the zeolite component in particular (Table 1). Furthermore, with fertilizer application without plants, the contents of nutrients increased in N, P, and K compared with what was supplied with water, and further increased in K compared to treatments with no plants and no fertilizer. Osmocote did not contain Ca or Mg, so the amount of Ca remained the same, while that of Mg only slightly decreased (Table 3 and Table 4).
At last, it has to be pointed out that the comparison of two substrates containing different rates of raw materials was introduced with the intent of promoting nutrient adsorption to the ion exchange capacity of the zeolite. In fact, this material is known for being capable to retain nutrients and reduce their leaching [47,48,49]. However, in the present work, this ability of zeolite was not confirmed, and actually slightly increased release of P and K (Table 4), as it was the overall salt content (i.e., EC; cfr Figure 3).
The nutrient uptake by plants was affected by fertilization (P < 0.001) for all the nutrients considered. In fact, for fertilized plants, the amount of nutrients removed increased compared to the non-fertilized ones (+155%, +368%, +128%, +92%, and +108% for N, P, K, Ca, and Mg, on average, respectively; Table 5) as a result of a higher biomass production and, in the case of N, P, and K, of a higher concentration in the plant dry mattes as well (data not shown).
Table 5.
Nutrients uptake (mg) by Mentha aquatica L. plants. P2:Z1 and P1:Z1 indicate substrates with a peat:zeolite ratio of 2:1 and 1:1 (v/v), respectively.
Comparing Table 5 to Table 3, it is clear that the macronutrient uptakes by plant were greater than the nutrients supplied with tap water and, in the case of nitrogen, exceeded from a minimum of 13 mg to a maximum of 382 mg for P1:Z1 substrate and no fertilizer application, and P2:Z1 substrate and fertilizer application, respectively. As the amount of macronutrients remaining in the water at the end of the experiment was negligible, these higher uptakes must have been fulfilled in part from the nutrients released by the substrate (the only source in the non-fertilized treatments), part of which are soluble and then readily available in a short term (Table 1), and in part from the fertilizer. The nutrients supplied with the fertilizer were, however, greater than those taken up by plants. As only traces were found in the remaining water and considering that part of the nutrient’s needs were fulfilled by the substrates, this indicates that, at most, the 50.5% and 36% of the N applied with the fertilizer with the P1:Z1 and P2:Z1 substrates, respectively, and 73.5% and 76.5% for P remained in the prills of the Osmocote fertilizer or adsorbed by the ion exchange capacity of the substrate.
The agronomic and environmental efficiency of a fertilizer depends upon its ability to synchronize its nutrient release pattern to the plant uptake pattern [40,50]. The release profile of controlled release fertilizer is often represented by a sigmoid curve [42,51] similar to that of the nutrient uptake [40], as also demonstrated for cattail (Typha latifolia L.), an emergent aquatic plant [52]. The results are in line with the expectations, as both the plant height (Figure 8) and water EC in the fertilized treatment without plants showed this profile, and that only traces of nutrients were found in fertilized treatments with plants (Table 4).
As only a fraction of the nutrients supplied with the fertilizer were taken up by plants and were not present in the remaining water, it has to be pointed out that another fraction was still present in the substrate exchange capacity and/or in the Osmocote prill and could further support plant growth.
Controlled release fertilizers are commonly used in ornamental aquatic nurseries and pond management [53,54,55], but there is no scientific literature on their effectiveness in promoting plant growth while avoiding release in the medium, thus polluting the water. In the paddy environment, a higher nutrient efficiency of controlled release fertilizers has been proved compared to conventional granular ones [56,57,58], but the positive effect on the quality of the water was not evaluated as positively as in the present experiment.
4. Conclusions
Plant presence represents a key component of bioretention basins. For this reason, a rapid establishment of plants is desirable. To reach this goal, supplementary nutrients should be applied, but their release in the water should also be taken into account. The evaluation of the results obtained in our experiment highlights that the fertilization with Osmocote, a controlled-release fertilizer, of M. aquatica grown in a floating system intended for bioretention basins, sustained the plant growth and establishment without compromising the quality of water. Furthermore, the adoption of a substrate containing a higher rate of zeolite did not improve nutrient adsorption or reduce water pollution. Therefore, the application of Osmocote during plant establishment, no matter the substrate, could be a valuable solution usable as routine practice when a bioretention basin is vegetated with floating elements with substrate.
Author Contributions
Conceptualization, G.Z., C.M. and L.B.; methodology, G.Z., C.M., N.D.F. and L.B.; formal analysis, G.Z. and C.M.; investigation, G.Z., C.M. and N.D.F.; resources, G.Z. and M.B.; data curation, G.Z.; writing—original draft preparation, G.Z. and C.M.; writing—review and editing, G.Z., C.M., N.D.F., L.B. and M.B.; visualization, G.Z. and C.M.; supervision, G.Z.; funding acquisition, M.B. All authors have read and agreed to the published version of the manuscript.
Funding
This research was funded by the Ministero dell’Istruzione, dell’Università e della Ricerca, Italy - PRIN Project 2015 n. 2015AKR4HX_005 titled Green4water - Green infrastructures for management and protection of water.
Conflicts of Interest
The authors declare no conflict of interest.
References
- Mallin, M.A.; Ensign, S.H.; Wheeler, T.L.; Mayes, D.B. Pollutant removal efficacy of three wet detention ponds. J. Environ. Qual. 2002, 31, 654–660. [Google Scholar] [CrossRef] [PubMed]
- German, J.; Svensson, G. Stormwater pond sediments and water—Characterization and assessment. Urban Water J. 2005, 2, 39–50. [Google Scholar] [CrossRef]
- Drake, J.; Guo, Y. Maintenance of wet stormwater ponds in Ontario. Can. Water Resour. J. 2008, 33, 351–368. [Google Scholar] [CrossRef]
- Hancock, G.S.; Holley, J.W.; Chambers, R.M. A Field-Based Evaluation of Wet Retention Ponds: How Effective Are Ponds at Water Quantity Control? J. Am. Water Resour. Assoc. 2010, 46, 1145–1158. [Google Scholar] [CrossRef]
- Tixier, G.; Lafont, M.; Grapentine, L.; Rochfort, Q.; Marsalek, J. Ecological risk assessment of urban stormwater ponds: Literature review and proposal of a new conceptual approach providing ecological quality goals and the associated bioassessment tools. Ecol. Ind. 2011, 11, 1497–1506. [Google Scholar] [CrossRef]
- McAndrew, B.; Ahn, C.; Spooner, J. Nitrogen and sediment capture of a floating treatment wetland on an urban stormwater retention pond—The case of the rain project. Sustainability 2016, 8, 972. [Google Scholar] [CrossRef]
- EC 2013. Communication from the Commission to the European Parliament, the Council, the European Economic and Social Committee and the Committee of the Regions Green Infrastructure (GI)—Enhancing Europe’s Natural Capital; (COM (2013) 249 final of 6 May 2013); European Commission: Brussels, Belgium, 2013.
- Strosser, P.; Delacámara, G.; Hanus, A.; Williams, H.; Jaritt, N. A guide to Support the Selection, Design and Implementation of Natural Water Retention Measures in Europe. Capturing the Multiple Benefits of Nature-Based Solutions; Final version, April 2015, Directorate—General for Environment; European Commission: Brussels, Belgium, 2016.
- Collentine, D.; Futter, M.N. Realising the potential of natural water retention measures in catchment flood management: Trade-offs and matching interests. J. Flood Risk Manag. 2018, 11, 76–84. [Google Scholar] [CrossRef]
- Brears, R.C. Blue-Green Infrastructure in Managing Urban Water Resources. In Blue and Green Cities; Palgrave Macmillan Ed: London, UK, 2018. [Google Scholar]
- EPA. Stormwater Wet Pond and Wetland Management Guidebook; EPA 833-B-09-001; United States Environmental Protection Agency: Washington, DC, USA, 2009.
- Wu, J.S.; Holman, R.E.; Dorney, J.R. Systematic evaluation of pollutant removal by urban wet detention ponds. J. Environ. Eng. 1996, 122, 983–988. [Google Scholar] [CrossRef]
- Stottmeister, U.; Wießner, A.; Kuschk, P.; Kappelmeyer, U.; Kästner, M.; Bederski, O.; Muller, R.A.; Moormann, H. Effects of plants and microorganisms in constructed wetlands for wastewater treatment. Biotechnol. Adv. 2003, 22, 93–117. [Google Scholar] [CrossRef]
- DeBusk, K.M.; Hunt, W.F.; Line, D.E. Bioretention outflow: Does it mimic nonurban watershed shallow interflow? J. Hydrol. Eng. 2010, 16, 274–279. [Google Scholar] [CrossRef]
- Gallagher, M.T.; Snodgrass, J.W.; Ownby, D.R.; Brand, A.B.; Casey, R.E.; Lev, S. Watershed-scale analysis of pollutant distributions in stormwater management ponds. Urban Ecosyst. 2011, 14, 469–484. [Google Scholar] [CrossRef]
- Wium-Andersen, T.; Nielsen, A.H.; Hvitved-Jakobsen, T.; Vollertsen, J. Heavy metals, PAHs and toxicity in stormwater wet detention ponds. Water Sci. Technol. 2011, 64, 503–511. [Google Scholar] [CrossRef] [PubMed]
- Clark, S.E.; Pitt, R. Targeting treatment technologies to address specific stormwater pollutants and numeric discharge limits. Water Res. 2012, 46, 6715–6730. [Google Scholar] [CrossRef] [PubMed]
- Shelef, O.; Gross, A.; Rachmilevitch, S. Role of plants in a constructed wetland: Current and new perspectives. Water 2013, 5, 405–419. [Google Scholar] [CrossRef]
- Winston, R.J.; Hunt, W.F.; Kennedy, S.G.; Merriman, L.S.; Chandler, J.; Brown, D. Evaluation of floating treatment wetlands as retrofits to existing stormwater retention ponds. Ecol. Eng. 2013, 54, 254–265. [Google Scholar] [CrossRef]
- Al-Rubaei, A.M.; Engström, M.; Viklander, M.; Blecken, G.T. Effectiveness of a 19-year old combined pond-wetland system in removing particulate and dissolved pollutants. Wetlands 2017, 37, 485–496. [Google Scholar] [CrossRef]
- Schwartz, D.; Sample, D.J.; Grizzard, T.J. Evaluating the performance of a retrofitted stormwater wet pond for treatment of urban runoff. Environ. Monit. Assess. 2017, 189, 256. [Google Scholar] [CrossRef]
- Wang, C.Y.; Sample, D.J. Assessment of the nutrient removal effectiveness of floating treatment wetlands applied to urban retention ponds. J. Environ. Manag. 2014, 137, 23–35. [Google Scholar] [CrossRef]
- Headley, T.R.; Tanner, C.C. Constructed wetlands with floating emergent macrophytes: An innovative stormwater treatment technology. Crit. Rev. Environ. Sci. Technol. 2012, 42, 2261–2310. [Google Scholar] [CrossRef]
- Wang, Q.; Hu, Y.; Xie, H.; Yang, Z. Constructed wetlands: A review on the role of radial oxygen loss in the rhizosphere by macrophytes. Water 2018, 10, 678. [Google Scholar] [CrossRef]
- Kivaisi, A.K. The potential for constructed wetlands for wastewater treatment and reuse in developing countries: A review. Ecol. Eng. 2001, 16, 545–560. [Google Scholar] [CrossRef]
- Headley, T.; Tanner, C.C. Application of Floating Wetlands for Enhanced for Stormwater Treatment: A Review; Auckland Regional Council: Auckland, New Zealand, 2008.
- Islam, M.K. Nutrient Removal from Urban Stormwater Using Floating Treatment Wetland System. Master’s Thesis, University of Central Florida, Orlando, FL, USA, 2011. [Google Scholar]
- De Stefani, G.; Tocchetto, D.; Salvato, M.; Borin, M. Performance of a floating treatment wetland for in-stream water amelioration in NE Italy. Hydrobiologia 2011, 674, 157–167. [Google Scholar] [CrossRef]
- Chang, N.B.; Xuan, Z.; Marimon, Z.; Islam, K.; Wanielista, M.P. Exploring hydrobiogeochemical processes of floating treatment wetlands in a subtropical stormwater wet detention pond. Ecol. Eng. 2013, 54, 66–76. [Google Scholar] [CrossRef]
- Zanin, G.; Bortolini, L.; Borin, M. Assessing stormwater nutrient and heavy metal plant uptake in an experimental bioretention pond. Land 2018, 7, 150. [Google Scholar] [CrossRef]
- Backhaus, A.; Fryd, O. The aesthetic performance of urban landscape-based stormwater management systems: A review of twenty projects in Northern Europe. J. Landsc. Archit. 2013, 8, 52–63. [Google Scholar] [CrossRef]
- Zancan, S.; Cesco, S.; Ghisi, R. Effect of UV-B radiation on iron content and distribution in maize plants. Environ. Exp. Bot. 2006, 55, 266–272. [Google Scholar] [CrossRef]
- Haynes, R.J. Active ion uptake and maintenance of cation-anion balance: A critical examination of their role in regulating rhizosphere pH. Plant Soil 1990, 126, 247–264. [Google Scholar] [CrossRef]
- Neumann, G.; Römheld, V. Rhizosphere chemistry in relation to plant nutrition. In Marschner’s Mineral Nutrition of Higher Plants; Marschner, P., Ed.; Academic Press: Cambridge, MA, USA; Elsevier: Amsterdam, The Netherlands, 2012; pp. 347–368. [Google Scholar]
- Savvas, D.; Gianquinto, G.; Tuzel, Y.; Gruda, N. Soilless culture. In Good Agricultural Practices for Greenhouse Vegetable Crops: Principles for Mediterranean Climate Areas; Food and Agriculture Organization (FAO) of the United Nations: Rome, Italy, 2013; pp. 303–354. [Google Scholar]
- Husby, C.E.; Niemiera, A.X.; Harris, J.R.; Wright, R.D. Influence of diurnal temperature on nutrient release patterns of three polymer-coated fertilizers. HortScience 2003, 38, 387–389. [Google Scholar] [CrossRef]
- Merhaut, D.J.; Blythe, E.K.; Newman, J.P.; Albano, J.P. Nutrient release from controlled-release fertilizers in acid substrate in a greenhouse environment: I. Leachate electrical conductivity, pH, and nitrogen, phosphorus, and potassium concentrations. HortScience 2006, 41, 780–787. [Google Scholar] [CrossRef]
- Newman, J.P.; Albano, J.P.; Merhaut, D.J.; Blythe, E.K. Nutrient release from controlled-release fertilizers in a neutral-pH substrate in an outdoor environment: I. Leachate electrical conductivity, pH, and nitrogen, phosphorus, and potassium concentrations. HortScience 2006, 41, 1674–1682. [Google Scholar] [CrossRef]
- Signore, A.; Serio, F.; Santamaria, P. A targeted management of the nutrient solution in a soilless tomato crop according to plant needs. Front. Plant Sci. 2016, 7, 391. [Google Scholar] [CrossRef] [PubMed]
- Shaviv, A. Advances in controlled-release fertilizers. Adv. Agron. 2000, 71, 1–49. [Google Scholar]
- Timilsena, Y.P.; Adhikari, R.; Casey, P.; Muster, T.; Gill, H.; Adhikari, B. Enhanced efficiency fertilisers: A review of formulation and nutrient release patterns. J. Sci. Food Agric. 2015, 95, 1131–1142. [Google Scholar] [CrossRef] [PubMed]
- Chen, J.; Wei, X. Controlled-Release Fertilizers as a Means to Reduce Nitrogen Leaching and Runoff in Container-Grown Plant Production. In Nitrogen in Agriculture-Updates; IntechOpen: London, UK, 2018. [Google Scholar]
- Ehret, D.L.; Edwards, D.; Helmer, T.; Lin, W.; Jones, G.; Dorais, M.; Papadopoulos, A.P. Effects of oxygen-enriched nutrient solution on greenhouse cucumber and pepper production. Sci. Hortic. 2010, 125, 602–607. [Google Scholar] [CrossRef]
- Lara, L.J.; Egea-Gilabert, C.; Niñirola, D.; Conesa, E.; Fernández, J.A. Effect of aeration of the nutrient solution on the growth and quality of purslane (Portulaca oleracea). J. Hortic. Sci. Biotechnol. 2011, 86, 603–610. [Google Scholar] [CrossRef]
- Morard, P.; Silvestre, J. Plant injury due to oxygen deficiency in the root environment of soilless culture: A review. Plant Soil 1996, 184, 243–254. [Google Scholar] [CrossRef]
- Lynch, J.; Marschner, P.; Rengel, Z. Effect of internal and external factors on root growth and development. In Marschner’s Mineral Nutrition of Higher Plants; Marschner, P., Ed.; Academic Press: Cambridge, MA, USA; Elsevier: Amsterdam, The Netherlands, 2012; pp. 331–346. [Google Scholar]
- Nakhli, S.A.A.; Delkash, M.; Bakhshayesh, B.E.; Kazemian, H. Application of zeolites for sustainable agriculture: A review on water and nutrient retention. Water Air Soil Pollut. 2017, 228, 464. [Google Scholar] [CrossRef]
- Jakkula, V.S.; Wani, S.P. Zeolites: Potential soil amendments for improving nutrient and water use efficiency and agriculture productivity. Sci. Rev. Chem. Commun. 2018, 8, 1–15. [Google Scholar]
- Mahesh, M.; Thomas, J.; Arun Kumar, K.; Bhople, B.S.; Saresh, N.V.; Vaid, S.K.; Sahu, S.K. Zeolite farming: A sustainable agricultural prospective. Int. J. Curr. Microbiol. Appl. Sci. 2018, 7, 2912–2924. [Google Scholar] [CrossRef]
- Shaviv, A.; Raban, S.; Zaidel, E. Modeling controlled nutrient release from polymer coated fertilizers: Diffusion release from single granules. Environ. Sci. Technol. 2003, 37, 2251–2256. [Google Scholar] [CrossRef]
- Lammel, J. Cost of the different options available to the farmers: Current situation and prospects. In IFA International Workshop on En Hanced-Efficiency Fertilizers; International Fertilizer Industry Association: Paris, France, 2005. [Google Scholar]
- Jeke, N.; Zvomuya, F. Nutrient supply rates and phytoextraction during Wetland Phytoremediation of an End-of-Life Municipal Lagoon. Soil Sci. Soc. Am. J. 2018, 82, 1004–1012. [Google Scholar] [CrossRef]
- Flimlin, G. Establishing an Ornamental Aquatic Plant Culture Facility. Fact Sheet FS535. Rutgers NJAES Cooperative Extension. 2004. Available online: https://agrilifecdn.tamu.edu/fisheries/files/2013/09/Establishing-an-Ornamental-Aquatic-Plant-Culture-Facility.pdf (accessed on 8 July 2019).
- Flimlin, G.; Pomeroy, R. Growing Ornamental Aquatic Plants as a Business in the Northeastern United States. Northeastern Regional Aquaculture Center. 2008. Available online: https://agrilifecdn.tamu.edu/fisheries/files/2013/09/NRAC-Publication-No.-301-2008-%E2%80%93-Growing-Ornamental-Aquatic-Plants-as-a-Business-in-the-Northeastern-United-States.pdf (accessed on 8 July 2019).
- Sink, T.; Gwinn, J.; Gerke, H. Ornamental Ponds & Water Gardens in Texas; Texas A&M AgriLife Extension Service: College Station, TX, USA, 2014.
- Ye, Y.; Liang, X.; Chen, Y.; Liu, J.; Gu, J.; Guo, R.; Li, L. Alternate wetting and drying irrigation and controlled-release nitrogen fertilizer in late-season rice. Effects on dry matter accumulation, yield, water and nitrogen use. Field Crops Res. 2013, 144, 212–224. [Google Scholar] [CrossRef]
- Chalk, P.M.; Craswell, E.T.; Polidoro, J.C.; Chen, D. Fate and efficiency of 15 N-labelled slow-and controlled-release fertilizers. Nutr. Cycl. Agroecosyst. 2015, 102, 167–178. [Google Scholar] [CrossRef]
- Sirvi, R. Effect of Polymer Coated Urea on Growth and Yield of Rice (Oryza sativa L.). Ph.D. Thesis, Institute of Agricultural Sciences, Banaras Hindu University, Varanasi, India, 2015. [Google Scholar]


© 2020 by the authors. Licensee MDPI, Basel, Switzerland. This article is an open access article distributed under the terms and conditions of the Creative Commons Attribution (CC BY) license (http://creativecommons.org/licenses/by/4.0/).