Article

Evaluation of Different Crop Models for Simulating Rice Development and Yield in the U.S. Mississippi Delta

1
USDA-ARS Adaptive Cropping Systems Laboratory, 10300 Baltimore Avenue, Beltsville, MD 20705, USA
2
Department of Plant Science and Landscape Architecture, University of Maryland, College Park, MD 20742, USA
3
USDA Agricultural Research Service, Dale Bumpers National Rice Research Center, 2890 Hwy 130 E, Stuttgart, AR 72160, USA
*
Author to whom correspondence should be addressed.
Agronomy 2020, 10(12), 1905; https://doi.org/10.3390/agronomy10121905
Submission received: 28 October 2020 / Revised: 26 November 2020 / Accepted: 30 November 2020 / Published: 2 December 2020

Abstract

:
The United States is one of the top rice exporters in the world, but warming temperatures and other climate trends may affect grain yield and quality. The use of crop models as decision support tools for a climate impact assessment would be beneficial, but suitability of models for representative growing conditions need to be verified. Therefore, the ability of CERES-Rice and ORYZA crop models to predict rice yield and growing season duration in the Mississippi Delta region was assessed for two widely-grown varieties using a 34-year database. CERES-Rice simulated growth duration more accurately than ORYZA as a result of the latter model’s use of lower cardinal temperatures. An increase in base and optimal temperatures improved ORYZA accuracy and reduced systematic error (e.g., correlation coefficient increased by 0.03–0.27 and root mean square error decreased by 0.3–1.9 days). Both models subsequently showed acceptable skill in reproducing the growing season duration and had similar performance for predicting rice yield for most locations and years. CERES-Rice predictions were more sensitive to years with lower solar radiation, but neither model accurately mimicked negative impacts of very warm or cold temperatures. Both models were shown to reproduce 50% percentile yield trends of more than 100 varieties in the region for the 34-year period when calibrated with two representative cultivars. These results suggest that both models are suitable for exploring the general response of multiple rice cultivars in the Mississippi Delta region for decision support studies involving the current climate. The response of rice growth and development to cold injury and high temperature stress, and variation in cultivar sensitivity, should be further developed and tested for improved decision making tools.

1. Introduction

Rice (Oryza sativa L.) is a staple food for roughly half the world’s population and is the most important cereal food crop [1]. Continued yield increases are needed to meet the needs of a rising global population [2], but production is increasingly constrained in many agricultural areas by land and water availability [3,4,5] and frequency of heat stress episodes, where warmer temperatures occurring during critical stages of rice growth threaten yield stability [6,7,8]. The United States (U.S.) is the 4th largest rice exporter [9] and consistently produces the highest average yield per area in the world, in large part, due to high-input production systems [10]. With the primary production occurring in the Mississippi Delta region [4], the effects of current and future impacts of climate on rice yields in this multi-state area are of particular interest to the U.S. rice industry. The development of accurate decision support tools is needed to assess climate vulnerabilities and opportunities, and identify the extent to which environmental constraints limit rice yields so that adaptation approaches can be implemented.
Projected climate change, including increases in extreme climate events, are likely to impose a severe threat to agriculture [11]. Assessing possible impacts of interactions between rising CO2 concentration and temperature on crop production are worldwide food security concerns [12,13], especially in developing countries [11]. Crop models are well-suited to carry out integrated assessments involving interactions between management, environment, and genotype [14,15]. Many recent studies have focused on the impact assessment for rice in Asian countries by combining crop models with projected climate scenarios from global climate models. The magnitude of the changes in rice yield in response to climate change differs among studies due to differences in baseline climate, the projected climate scenarios used, and simulation methods. For example, Gupta and Mishra (2019) [16] examined the climate change impact on rice production in India, and found rice yield was expected to increase by 1.2% to 12.6% by mid-2050. Conversely, mid-century climate impacts in China by 2050s could lead to a 2.48% to 2.55% reduction in rice yield in the Yangtze River Basin [17]. Over the Songkhram River Basin in Thailand, the predicted changes in rice yield were −1.69% to −6.59% for 2030s and −7.81% to −10.20% for 2055s [18]. A thermal-time based modeling study focused on the practicality of ratooning was evaluated for the Mississippi Delta region [19], and Espe et al. (2016) [20] used the ORYZA model to evaluate rice yield potential for three U.S. production regions for several varieties. Despite insights, such studies have been produced with regard to long-term climate impact and possible risk on production of rice. We are not aware of other significant studies conducted for the U.S.
There also remain large uncertainties among rice models in simulating crop development and yield responses to rising temperatures that must be quantified and addressed in order to improve accuracy [21,22,23]. The past several decades have seen the development of multiple crop models for the same commodity, including rice, that can vary quite broadly in terms of the source code structure and representation of soil, plant, and atmospheric interactions [22]. These differences underscore the limited nature of crop modelling science in which significant knowledge gaps still exist that may limit model effectiveness in simulating differences in cultivar responses to climate events such as temperature stress [23]. For example, Li et al. (2015) [21] reported evidence of limited capability for individual rice crop models to consistently and accurately predict yield over different production conditions and, in particular, at low and high temperatures. An additional challenge for rice model studies in the U.S., and other countries, is the large number of rice varieties grown on-farm each year [24]. Thus, the ability to extend predictions of a model calibrated for one or two select cultivars to the broader set of commercially grown varieties commonly grown in the same production region is also of significant interest. Further assessments of strengths and weaknesses for individual rice models still need to be conducted to generate reliable decision support responses.
ORYZA [25,26] and CERES-Rice [27] are among the more popular physiological-based rice models and have been utilized in numerous studies outside the U.S. CERES-Rice is a radiation use efficiency-based model and was used to assess the impact of management options and variety on rice growth, development, and yield in response to different climatic zones and production conditions [28,29,30,31,32,33]. ORYZA utilizes leaf-level photosynthesis and respiration equations, and has been used primarily to assess the response of the indica sub-population of rice in the Philippines [34], Iran [35], China [36,37], Thailand [38], and India [39]. As with CERES-Rice, ORYZA has also been utilized for climate change studies, but these were primarily focused in Malaysia, Myanmar, Philippines, Thailand, and China [40]. Despite the wide-spread application of these models, Meinke (2014) [41] observed that nearly all cereal crop models had challenges simulating plant phenology correctly. Zhang et al. (2008) [42] and Horie et al. (1995) [40] found that ORYZA2000 in particular did not consistently simulate the growing season duration as well as others. However, this model was originally parameterized with experimental data for rice grown in tropical climate conditions [43,44]. As compared with the U.S. Mississippi Delta, this climate has relatively smaller variability in seasonal and diurnal temperatures, which may require re-parameterization of the cardinal temperatures [45]. In contrast, the CERES-Rice model adequately captured the effects of temperature on phenology in the mid-south region of the U.S. [46].
Model ensemble approaches composed of more than one model may be more robust for predicting climate responses [21,22]. In this context, evaluation of both CERES-Rice and ORYZA was relevant for the topic of developing reliable decision support for the Mississippi Delta region. While the majority of rice modeling studies focus on varieties in the indica sub-population, rice growers in the U.S. primarily use temperate or tropical japonica sub-populations [6]. It was not clear whether the models used for Asian country studies, such as ORYZA, are suitable for the U.S. The objectives of this study were, thus, to (1) calibrate CERES-Rice and re-parameterize the cardinal temperatures in ORYZA to simulate growth duration for representative cultivars in the U.S. Mississippi Delta region, (2) evaluate and compare model performance in reproducing observed grain yields, and (3) assess the extent to which each model can duplicate yield trends for a broader set of cultivars grown in the Delta when calibrated with a limited number of varieties. The results of the study will establish the accuracy of utilizing well-known rice models for Southeast U.S., verify the extent to which such models are able to predict the growing season duration, yield trends in comparison with multi-year observed data, and provide insights into model knowledge gaps associated with climate effects.

2. Materials and Methods

2.1. Observed Data

The Uniform Regional Rice Nursery (URRN) dataset was utilized for this study [24] and included replicated annual field trial results from federal and university rice breeders across multiple states in the U.S. Mississippi Delta region, which covers a rice growing area of about 800,000 ha [4,5]. Trials were conducted in 3.3 m2 field plots with two to four field replicates each year. Urea was applied in all plots as basal N fertilizer at rates ranging from 364 kg ha−1 to as high as 470 kg ha−1 for most years and locations, except for a lower application of 202 kg ha−1 in 2015 [24]. Trials were conducted that included 101 commercial varieties among others and included data on grain yield, days to heading, days to harvest, and plant height from 1983 to 2016. Not all varieties were grown each year as a result of new cultivar releases and decreased economic importance of older ones. However, cultivars Lemont, Cocodrie, Wells, Cypress, Priscilla, and CL161 were identified as the most well-represented varieties, and, of these, Lemont and Cocodrie were the most consistently grown at all locations and years. Based on availability of the most detailed data records, Lemont for years 1983–1998 and Cocodrie for 1999–2016 were used for this modeling activity at four locations (Stuttgart, Arkansas (AS), Crowley, Louisiana (LA), Stoneville, Mississippi (MS), and Beaumont, Texas (TX)).
Observed weather station data for daily maximum and minimum air temperature, solar radiation and rainfall were obtained from the following website: https://beaumont.tamu.edu/climaticdata/StationInventory.aspx?index=Inventory. Solar radiation was not available at Crowley, LA and Stoneville, MS, and was obtained from a nearby weather station using the same website. Climate conditions of all four sites were classified as a U.S. warm temperate climate regime with humid and hot summers [47]. However, locational differences with respect to in-season climatology, growing season duration, and day/night temperatures existed (Table 1). April to August is the main growing season of rice at Beaumont, TX and Crowley, LA, and these locations were also more humid and wetter compared to Stuttgart, AR and Stoneville, MS, with average seasonal total rainfall of 744 and 1033 mm during 1983–2016, respectively. In contrast, Stuttgart, AR and Stoneville, MS were relatively dryer in terms of total average seasonal rainfall in the range of 424 to 467 mm from 1983 to 2016 (Table 1). Soil texture and hydrological properties data, such as saturated volumetric water content and hydraulic conductivity, were obtained from the Food Agriculture Organization soil dataset FAO-UNESCO (1974) [48] and Pachepsky and Park (2015) [49].

2.2. CERES-Rice Model

2.2.1. Development

CERES-Rice includes nine phenological stages in which the duration is calculated using degree days [50,51]. The daily increment in heat units (HU, °Cd (degree-days) d−1), or daily thermal time, are as in Equation (1).
H U = ( T m a x + T m i n ) 2 T b a s e
where daily minimum (Tmin) and maximum (Tmax) air temperatures are above a base temperature (Tbase) of 9 °C and less than an optimal temperature (Topt) of 33 °C. When outside this range, HU is calculated by hourly temperature (Td) at the time of day (h) as in Equations (2) and (3).
T d = T b a s e   T d < T b a s e
T d   = ( T m a x   +   T m i n ) 2 +   ( ( T m a x T m i n )   ×   sin ( 3.14 / 12 ×   h ) 2   T b a s e <   T d <   T o p t
T d = T o p t   T d > T o p t
H U = 1 / 24 h = 1 24 ( T d )

2.2.2. Biomass Growth

Potential biomass production for each day is obtained by Equation (4).
P C A R B = R U E . I P A R P L T P O P
where PCARB is daily potential biomass production (g plant−1 d−1), RUE is radiation use efficiency (g MJ−1), PLTPOP is plant population (plant m−2), and IPAR is the fraction of photosynthetically active radiation (PAR, MJ) intercepted by the plants as:
I P A R =   P A R ×   ( 1 e ( k . L A I ) )
where k is the canopy light extinction coefficient and LAI is the green leaf area index. Potential biomass production may be limited by a non-optimal temperature, water stress, or nitrogen stress. Daily biomass is allocated among organs such as leaves, stems, roots, panicle, and grain according to carbon partitioning coefficients, which vary with the stage of development and general growing conditions [50].

2.3. ORYZA Model

2.3.1. Development

There are four main development stages determined by daily mean air temperature, water, nutrient stresses, and photoperiod for photoperiod-sensitive varieties. Cardinal temperatures include base (Tbase, °C), optimum (Topt, °C), and maximum temperatures (Thigh, °C), which default to 8, 30, and 42 °C, respectively, for all stages and cultivars [52]. The development rate has a bilinear response to temperature over short time periods (one hour). Hourly temperatures (Td, °C) are estimated by a sinusoidal function of daily minimum (Tmin, °C) and maximum (Tmax, °C) air temperatures.
T d =   ( T m a x + T m i n ) 2 +   ( ( T m a x T m i n ) × cos ( 0.2618 ( h 14 ) ) 2
where h is the time of day. Hourly increments in heat units (HUH, °Cd (degree-days) h−1) are given by Equation (7).
H U H = { 0   T d T b a s e   o r   T d T h i g h ( T d   T b a s e   )   24   T b a s e T d T o p t ( T o p t ( T d T o p t ) × ( T o p t T b a s e ) ( T h i g h T o p t ) ) / 24     T o p t T d T h i g h
where Tbase, Topt, and Thigh are the cardinal temperatures as previously defined. The daily increment in heat units (HU, °Cd (degree-days) d−1) is then calculated as:
H U = h = 1 24 ( H U H )

2.3.2. Biomass Growth

ORYZA uses a leaf-level photosynthesis algorithm to predict the CO2 assimilation rate. The total daily rate is affected by daily absorbed radiation, temperature, and LAI. Radiation fluxes, attenuation, and absorption are based on the work of Spitters et al. (1986) [53]. The assimilation rate is calculated for a single shaded and sunlit leaf at each of three canopy depths using Equations (9)–(11).
A L = A m ( 1 exp ( ε I a A m ) )
A m = ( 49.57 34.26 ) ( 1 exp ( 0.208 0.208 ( C O 2 60 ) 49.57 ) )
ε = ε 340   ppm ( 1 e x p ( 0.00305   C O 2 0.222 ) ) ( 1 e x p ( 0.00305 × 340 0.222 ) )
where AL is the gross CO2 assimilation rate (kg CO2 ha−1 leaf h−1), Am is the CO2 assimilation rate at light saturation, ε is the initial light-use efficiency (kg CO2 ha−1 leaf h−1 (J m−2 leaf s−1)), Ia is the amount of absorbed radiation for either shaded or sunlit leaf (J m −2 leaf s −1), and ε340 ppm is ε at a CO2 concentration of 340 ppm, which follows a function of average daytime temperature as in Goudriaan and van Laar (1994) [54]. Instantaneous rates of leaf CO2 assimilation over three depths in the canopy are integrated to obtain total canopy CO2 assimilation using a Gaussian integration at three different times during the day and then integrated into daily total rates of CO2 assimilation [55].
Assimilate is partitioned between shoots and roots according to partitioning coefficients changing with phenological progress. The gross daily growth rate (Gp, kg ha−1 d−1) is calculated according to Equation (12).
G p = ( A d x ( 30 34 ) R m + R t ) / Q m
where Ad is the daily rate of gross CO2 assimilation (kg ha−1 d−1), Rm is the maintenance respiration (kg ha−1 d−1), Rt is the amount of available stem reserves for growth (kg ha−1 d−1), and Q is the assimilate requirement for dry matter production (kg CH2O kg−1 dry matter).

2.4. Model Input Data and Calibration

Inputs required to run either model include plant phenotype characteristics, crop management, soil properties, and daily weather data as summarized in Table 2. For calibration, data from Stoneville, MS in 2005 was used for Cocodrie, and 2001 for Lemont [24]. The calibration data included yield, unit grain weight (g/1000 seed), sowing date, flowering, and harvest dates.
CERES-Rice was calibrated using the Genetic Coefficient Estimator (Gencalc), which is a software tool contained as part of the Decision Support System for Agrotechnology Transfer (DSSAT) interface [62] with results shown in Table 3. For ORYZA calibration, the DRATES calibration program was used based on procedures defined by Bouman and Van Laar (2006) [34]. Parameters describing biomass partitioning among plant organs and specific leaf area were fixed to that contained within the standard crop file included with ORYZA (v.3), but a difference in cultivar spikelet growth factor (SPGF) was obtained for each location. After this initial calibration, a re-parameterization was done to account for differences in cardinal temperatures between the U.S. and tropical climate conditions in which the model was originally developed for. A sensitivity analysis consisting of factorial combinations of three base (8, 9, and 12 °C), two optimal (30 and 33 °C), and two maximum temperature values (42 and 999 °C) was conducted to obtain an optimal cardinal temperature value set that reduced systematic error with respect to the growing season duration for either cultivar using this same data. Henceforth, this version of ORYZA was referred to as ‘re-parameterized.’ All other calibration values were the same as the original version (Table 3).

2.5. Model Simulations and Data Analysis

Model simulations were conducted to evaluate simulated versus observed growth durations for Lemont (1983–1998) at Stoneville, MS and Beaumont, TX and for Cocodrie at Stoneville (1999–2016), MS and Crowley, LA (2003–2016). Observed yield was available for comparison with simulations for Lemont between 1983 and 1998 and for Cocodrie from 1999 to 2016. Evaluation metrics for CERES-Rice, default-ORYZA, and the re-parameterized ORYZA included the slope and correlation coefficient obtained from the regression between simulated versus observed data, root mean square error (RMSE) (Equation (13)), index of agreement [63] (Equation (14)), and mean absolute percentage error (Equation (15)).
R M S E =   N 1 i = 1 N ( O i S i ) 2
where N is the number of observations (years), and O and S are observed and simulated values at year i. The index of agreement and mean absolute percentage error (MAPE) were defined as:
d = 1 i = 1 N ( S i O i ) 2 i = 1 N ( | S i O ¯ | + | O i O ¯ | ) 2 ,   0 d 1
M A P E = 1 N i = 1 N | O i S i O i | × 100 %
where d is the agreement index value, with symbols as defined above. After model evaluation, results from the model predictions of yield for these two varieties were compared against the URRN data to explore the distribution of observed versus simulated yields across all cultivars (up to 101) for a given year at each location to evaluate trends and identify off-nominal years with respect to yields.

3. Results

3.1. Comparison of Growth Duration

CERES-Rice generally showed better performance simulating rice growth duration as compared to default-ORYZA in term of the correlation coefficient and RMSE (Figure 1a,b). For Lemont, predicted growth duration from CERES-Rice was more highly correlated with observations at Stoneville, MS (r = 0.66) and Beaumont, TX (r = 0.55) than default-ORYZA (r = 0.49 and 0.38, respectively).Similarly, correlations were higher for CERES-Rice versus default-ORYZA for Cocodrie at Stoneville, MS (r = 0.55 versus 0.26), but were similar at Crowley, LA (r = 0.74 or r = 0.72) for either model. The standard deviation of observed growth duration (period of time from planting through harvest maturity) across all locations (between ±6.6 to ±11.5 days) was underestimated by both default-ORYZA (±2.5 to ±4.6 days) and CERES-Rice (±3 to ±5.4 days) (Figure 1c).
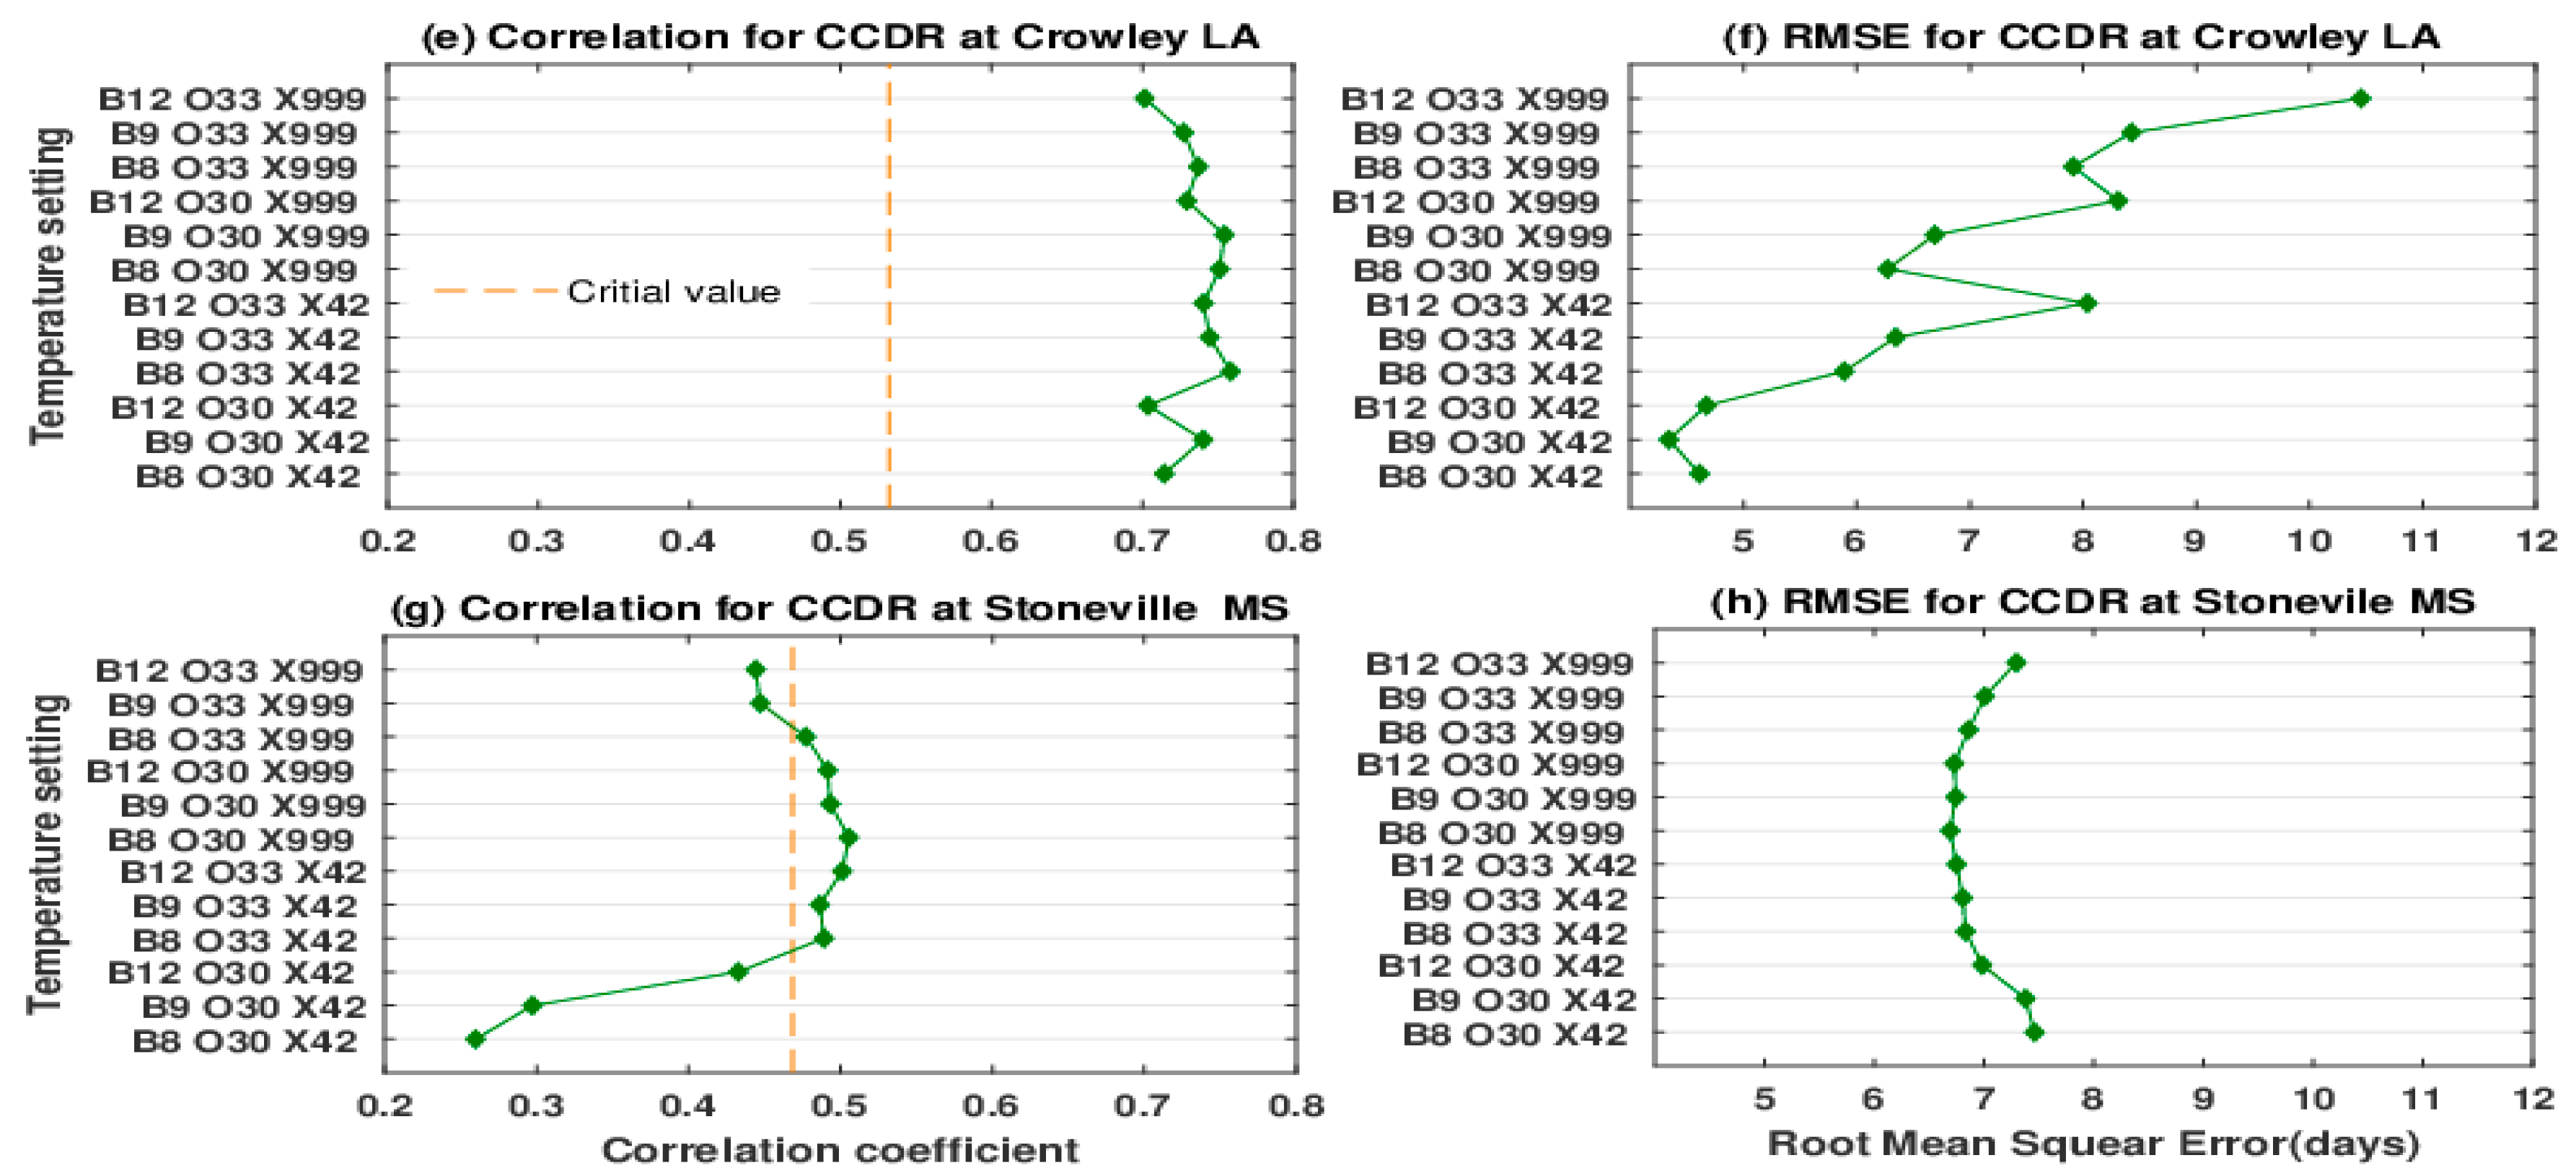
ORYZA cardinal temperatures were subsequently re-parameterized to better represent U.S. conditions. Optimal parameter values (with respect to improved correlation coefficients and RMSE) obtained via sensitivity analyses of ORYZA using factorial combinations of cardinal temperatures were 12 °C, 33 °C, and 42 °C (base, optimal, and maximum temperature) at Beaumont and Stoneville for Lemont, and Stoneville for Cocodrie (Figure 2). Slightly different values of 9, 30, and 42 °C were obtained for Cocodrie at Crowley, LA. However, for the simulations in this study, the same cardinal temperature values across all locations of 12 °C, 33 °C, and 42 °C for base, optimal, and maximum temperature, respectively, were used.
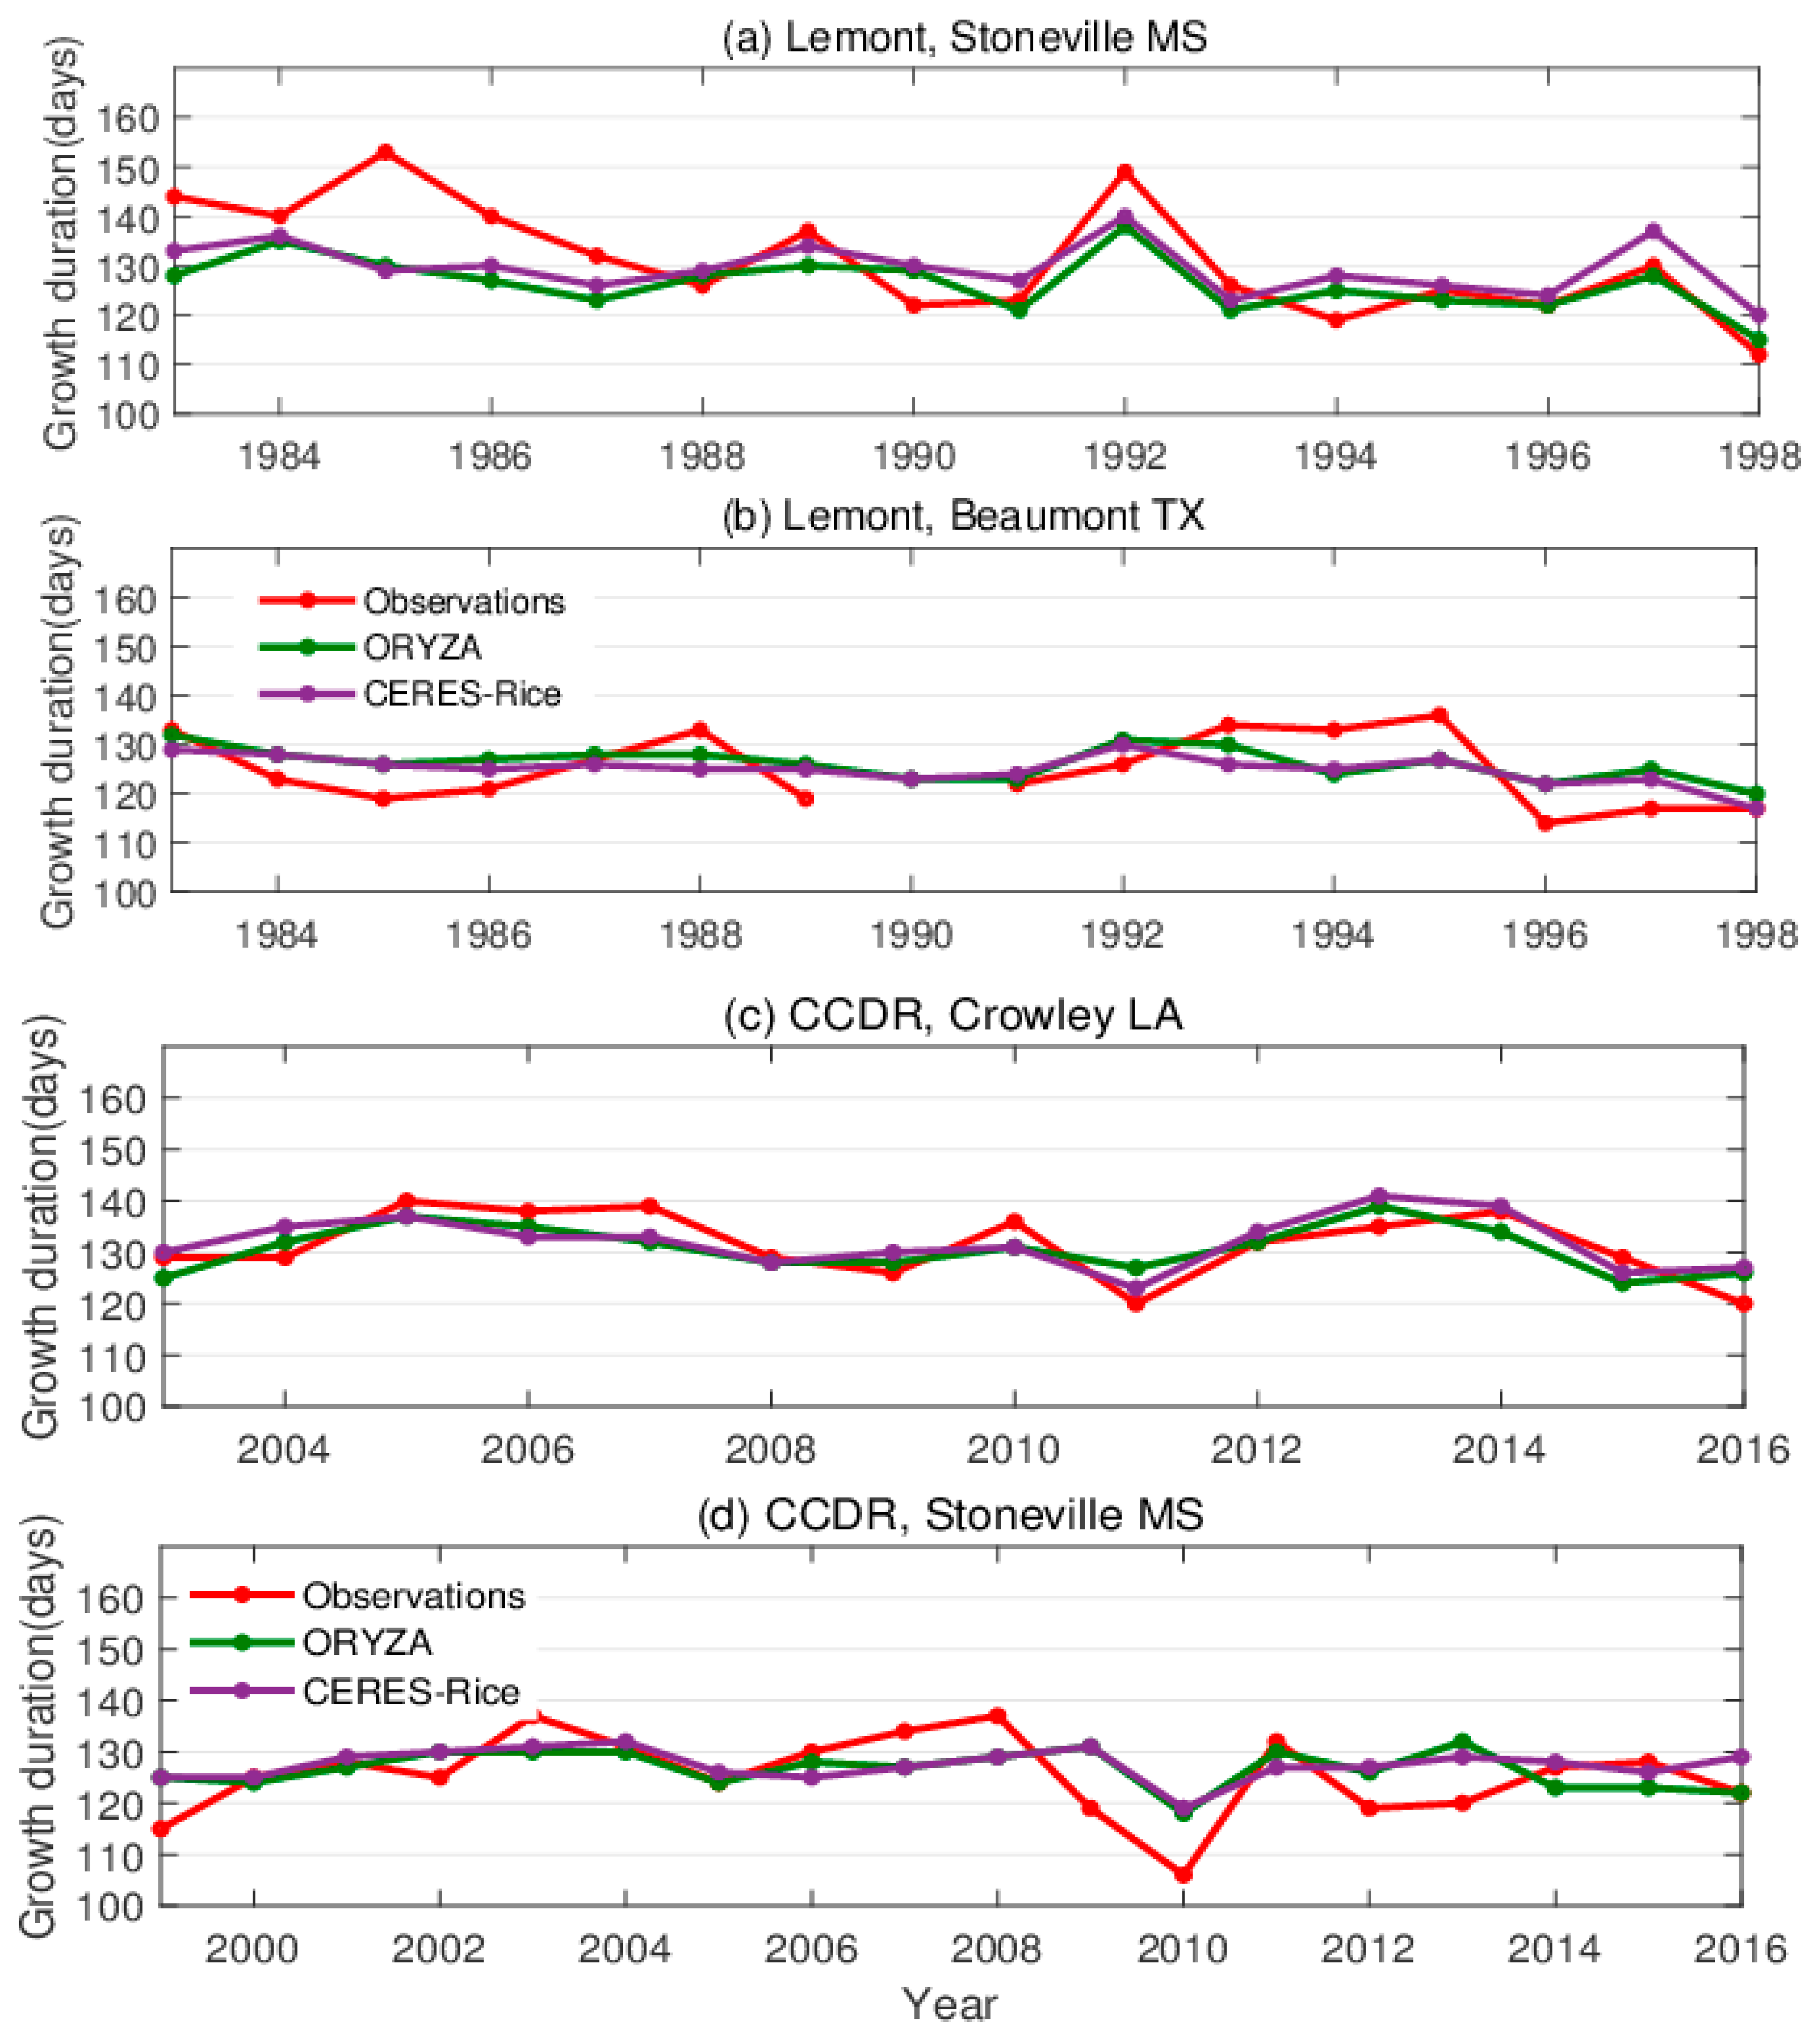
Similar performance metrics were obtained with re-parameterized ORYZA in predicting growth duration as compared to CERES-Rice (Figure 1, Re-ORYZA). These two models were able to capture the annual variation of observed growth duration for most years and locations for either cultivar (Figure 3). However, both models showed relatively low accuracy for certain years likely as a result of climate extremes. For examples, the years 1983 to 1987, and 1992 in Stoneville, MS for cultivar Lemont (Figure 3a) were most strongly underestimated by ORYZA and CERES-Rice, and were associated with later occurrence of frost in the growing season (minimum temperatures at 0 °C or below) as much as 20 days after the planting date as compared with the 34-year mean of nine days (Figure S3). Years 2009 and 2010 for Cocodrie (Figure 3d) at Stoneville, MS were associated with higher than average rainfall (>225 mm over the 465 mm annual season mean) and lower solar radiation, which may have had an indirect response on decreased growth duration not captured by the models. In contrast, growth duration observations at Crowley, LA for Cocodrie from 2003 to 2016 were well reproduced by both models (Figure 3c) possibly due to lower annual variability in mean temperature (Table 1 with a standard deviation of 0.6 °C).

3.2. Comparison of Observed and Simulated Yields

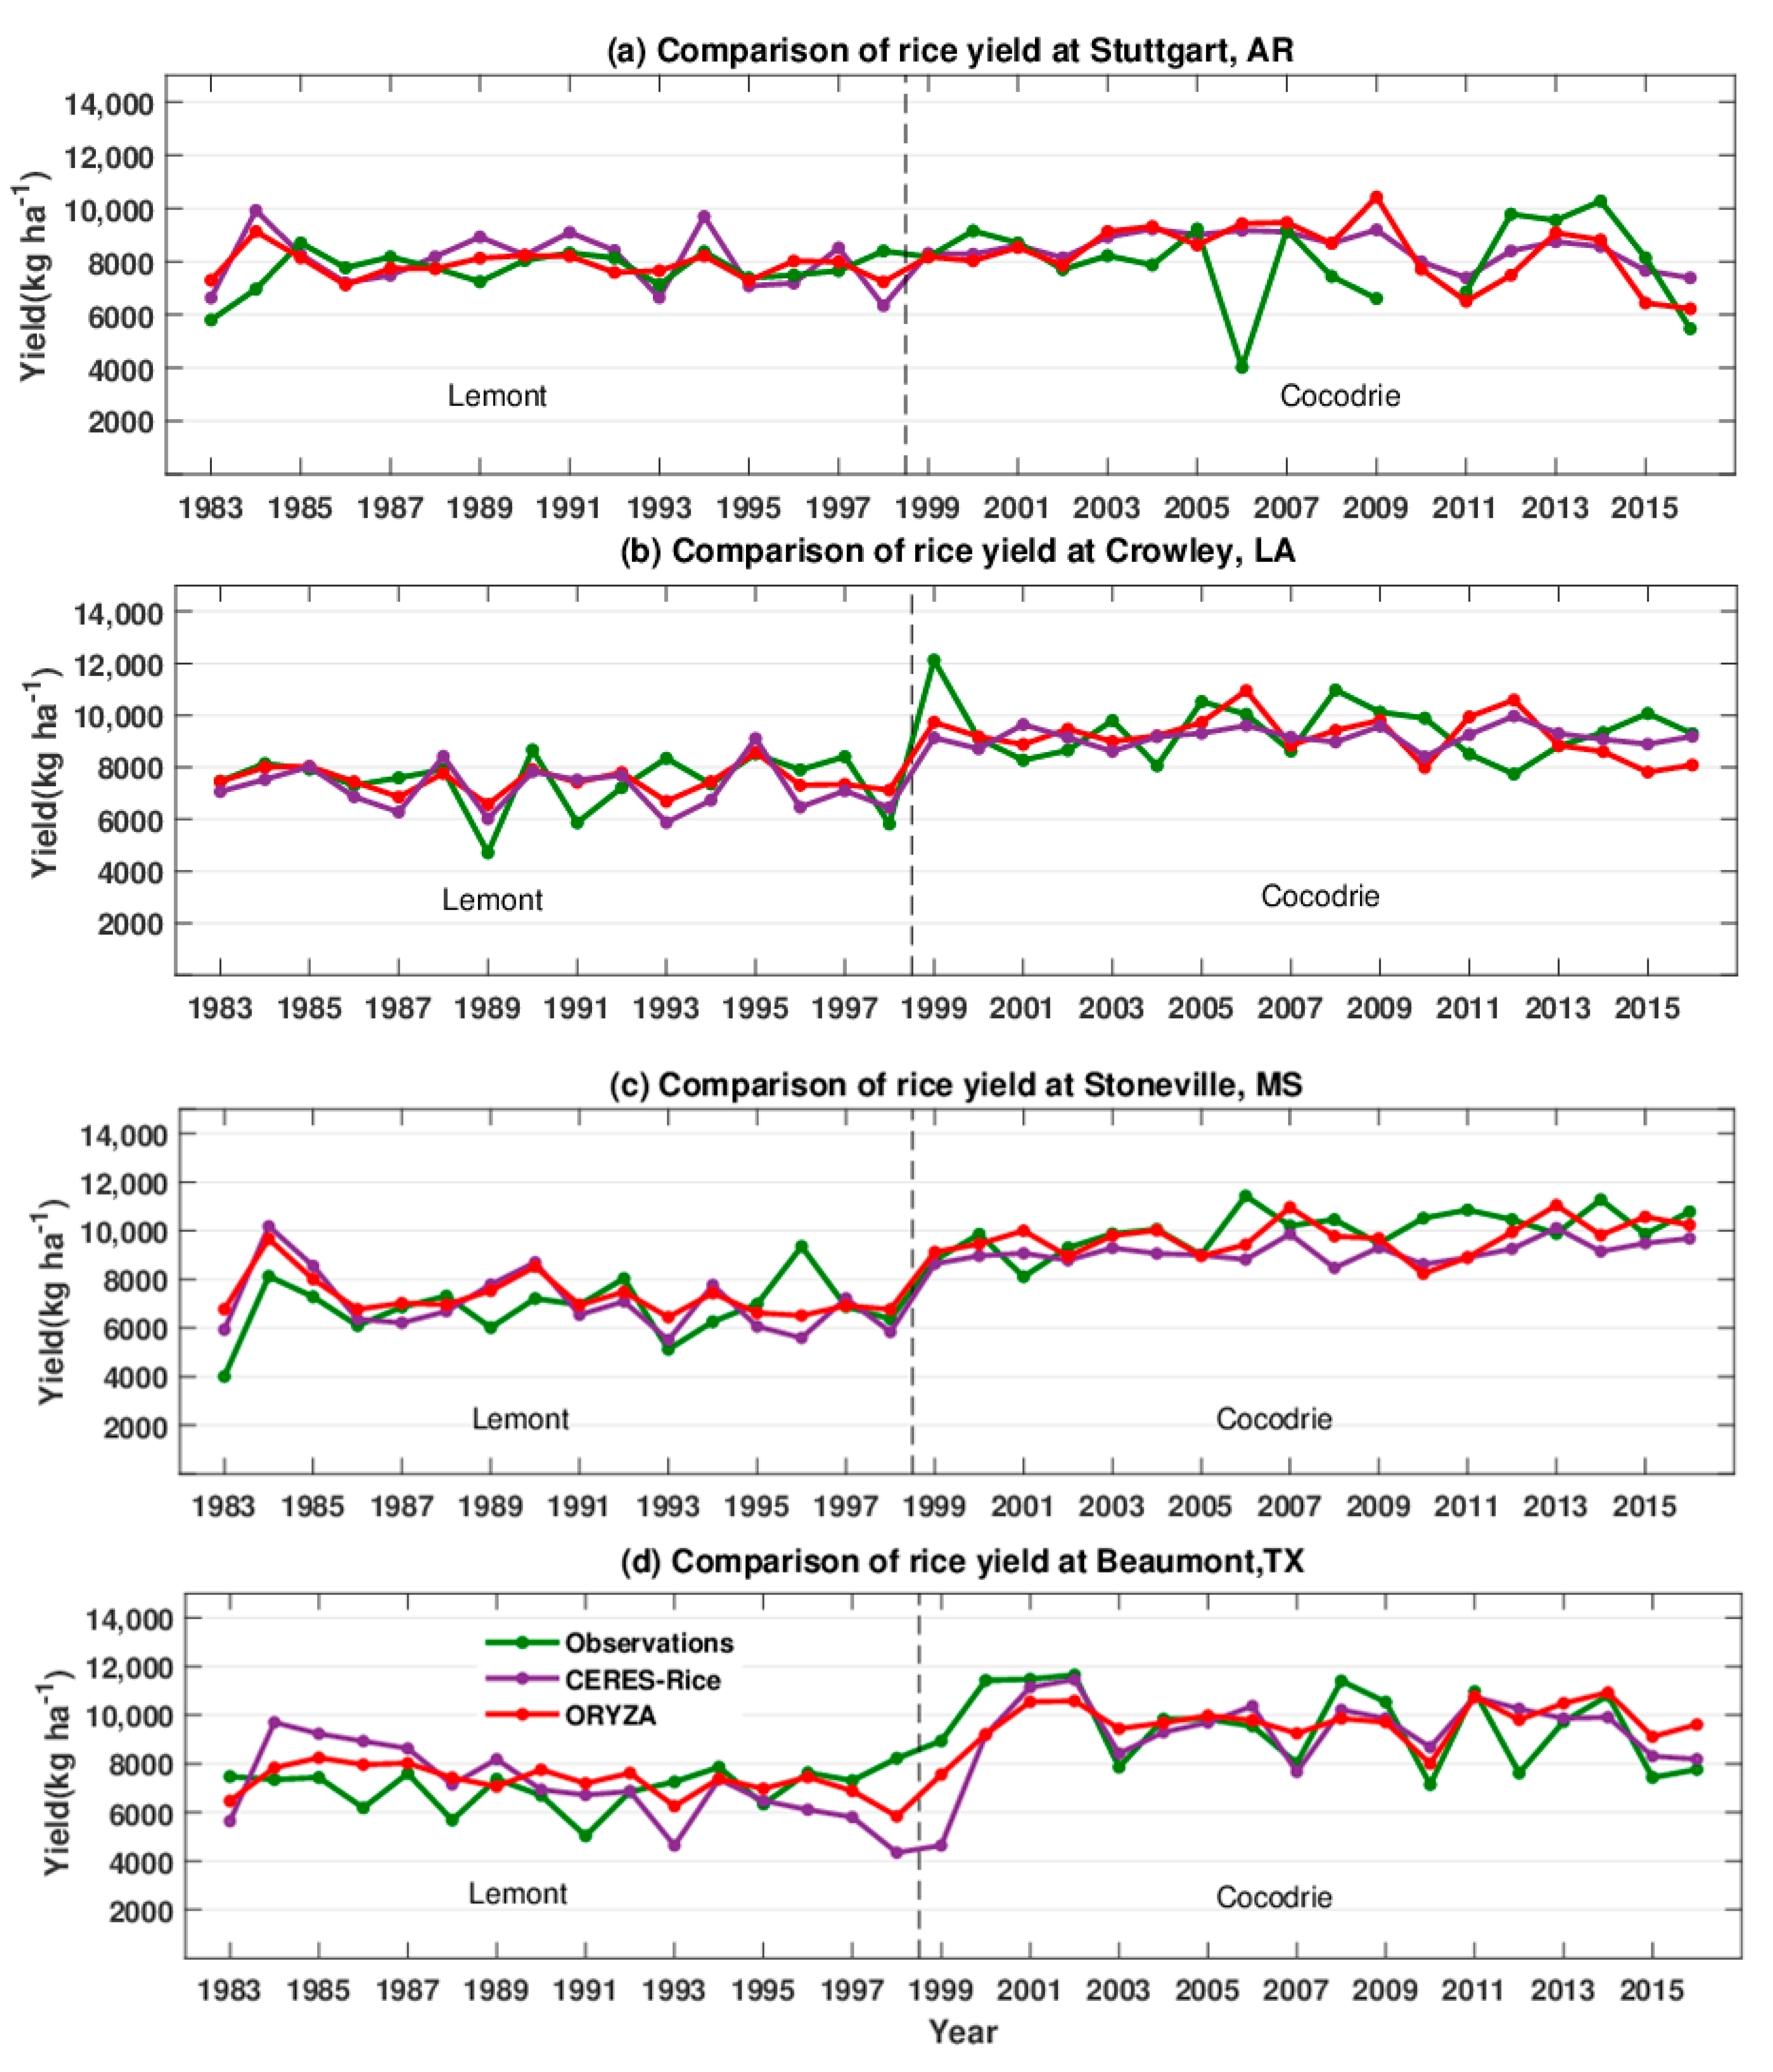
Model predicted yields were evaluated over two periods (1983–1998 and 1999–2016) for the two cultivars at four locations. At Stuttgart, AR, there was a large discrepancy between observed and modelled yields for years 1989 for Lemont and 2006, 2008, and 2009 for Cocodrie for both models (Figure 4a). These outlying years contributed to the low correlation coefficients for either model (between 0.07 and 0.24, Table 4). In other years, simulated yields for Lemont from re-parameterized ORYZA were generally closer to observations than CERES-Rice, especially in 1994 (Figure 4a). Seasonal mean maximum and minimum daily temperatures were 1.1 and 1.3 °C lower in this year compared to the average 34-year value (Figure S1), and simulated yields in CERES-Rice were more than 15% higher than observed values, as compared with a less than 2% increase for re-parameterized ORYZA. Across all years for Stuttgart, AR, the slope of predicted grain yield versus seasonal temperature was negative for both models, but nearly three times lower for CERES-Rice (–863 versus –290 kg °C−1, Table 5). This implied a higher yield estimation at cooler temperature years as compared to ORYZA. The observed standard deviation for Cocodrie (±1607 kg ha−1) was nearly three times greater than simulated from CERES-Rice (±594 kg ha−1) and 1.5 times that of ORYZA (±1098 kg ha−1) (Table 4 and Figure 4a). The higher variation in the observed yield can likely be explained by the difference in field management, the impact of biotic factors, and climate variability not duplicated in either model. For example, yields were affected by diseases and pests in 2006 [64] and this may have been responsible for yield fluctuations in other years as well.
At Crowley, LA, better agreement (r = 0.52) between simulated yield from re-parameterized-ORYZA and observed yields for Lemont was found for 1983–1998 (Figure 4b), but a somewhat lower correlation (r = 0.41) was observed for CERES-Rice (Table 4). Compared to other locations, there were more years with high rainfall amounts that coincided with reduced solar radiation and lower temperatures that likely constrained the rice yield (Figure S6). For example, a large yield reduction occurred in 2012 that neither model was able to replicate, and this year was associated with lower radiation, higher rainfall, and lower seasonal temperatures (Figure S2) compared to other years. This suggested both models may have difficulties simulating yields under a combination of lower radiation and temperatures.
At Stoneville, MS, both models simulated most of the annual variability for Lemont from 1983 to 1998, excluding 1996 when the observed yield was higher (Figure 4c). Similar performance metrics for mean yield and variability of yield were obtained (Table 4). For Cocodrie, simulated yield from re-parameterized-ORYZA was close to observations from 1999 to 2005, but observed yield was slightly underestimated by CERES-Rice during this period (Figure 4c, Table 4). After 2005, there were larger discrepancies in simulated and observed yields for both models, particularly for 2006, 2009, and 2011. As climate conditions did not appear unusual for these years, and models under-predicted observed values, we are not sure why this relatively poor performance occurred.
At Beaumont, LA, correlations from both models were poor for Lemont from 1983 to 1998 (Table 4). In particular, the large yield reductions in 1986, 1988, and 1991 were not captured by models (Figure 4d). After 1992, simulated yields from CERES-Rice were lower than observed yield and re-parameterized-ORYZA, which is a result likely associated with lower solar radiation values measured for those years (Figure S4). Following this point, in CERES-Rice, yield was more responsive to solar radiation (m = 706 kg MJ−1 m−2 day−1, Table 5) from 1983 to 1998, as compared with re-parameterized-ORYZA (m = 284 kg MJ−1 m−2 day−1, Table 5). From 1999 to 2016, observed and simulated yield for Cocodrie was significantly correlated in re-parameterized-ORYZA (r = 0.58) and CERES-Rice (r = 0.56) (Table 4), and the models captured the variability of observed yield for most years except 2010 and 2012 (Figure 4d) in which simulated yields were higher than observations. For 2010, the night temperature (22.7 °C) was higher than average for other years (21.4 °C) (Figure S4), but no other reasons for the decline in yield were identified, suggesting a non-climatic factor may also be responsible.

3.3. Model Skill in Simulating 50% Percentile Yield of 101 Varieties

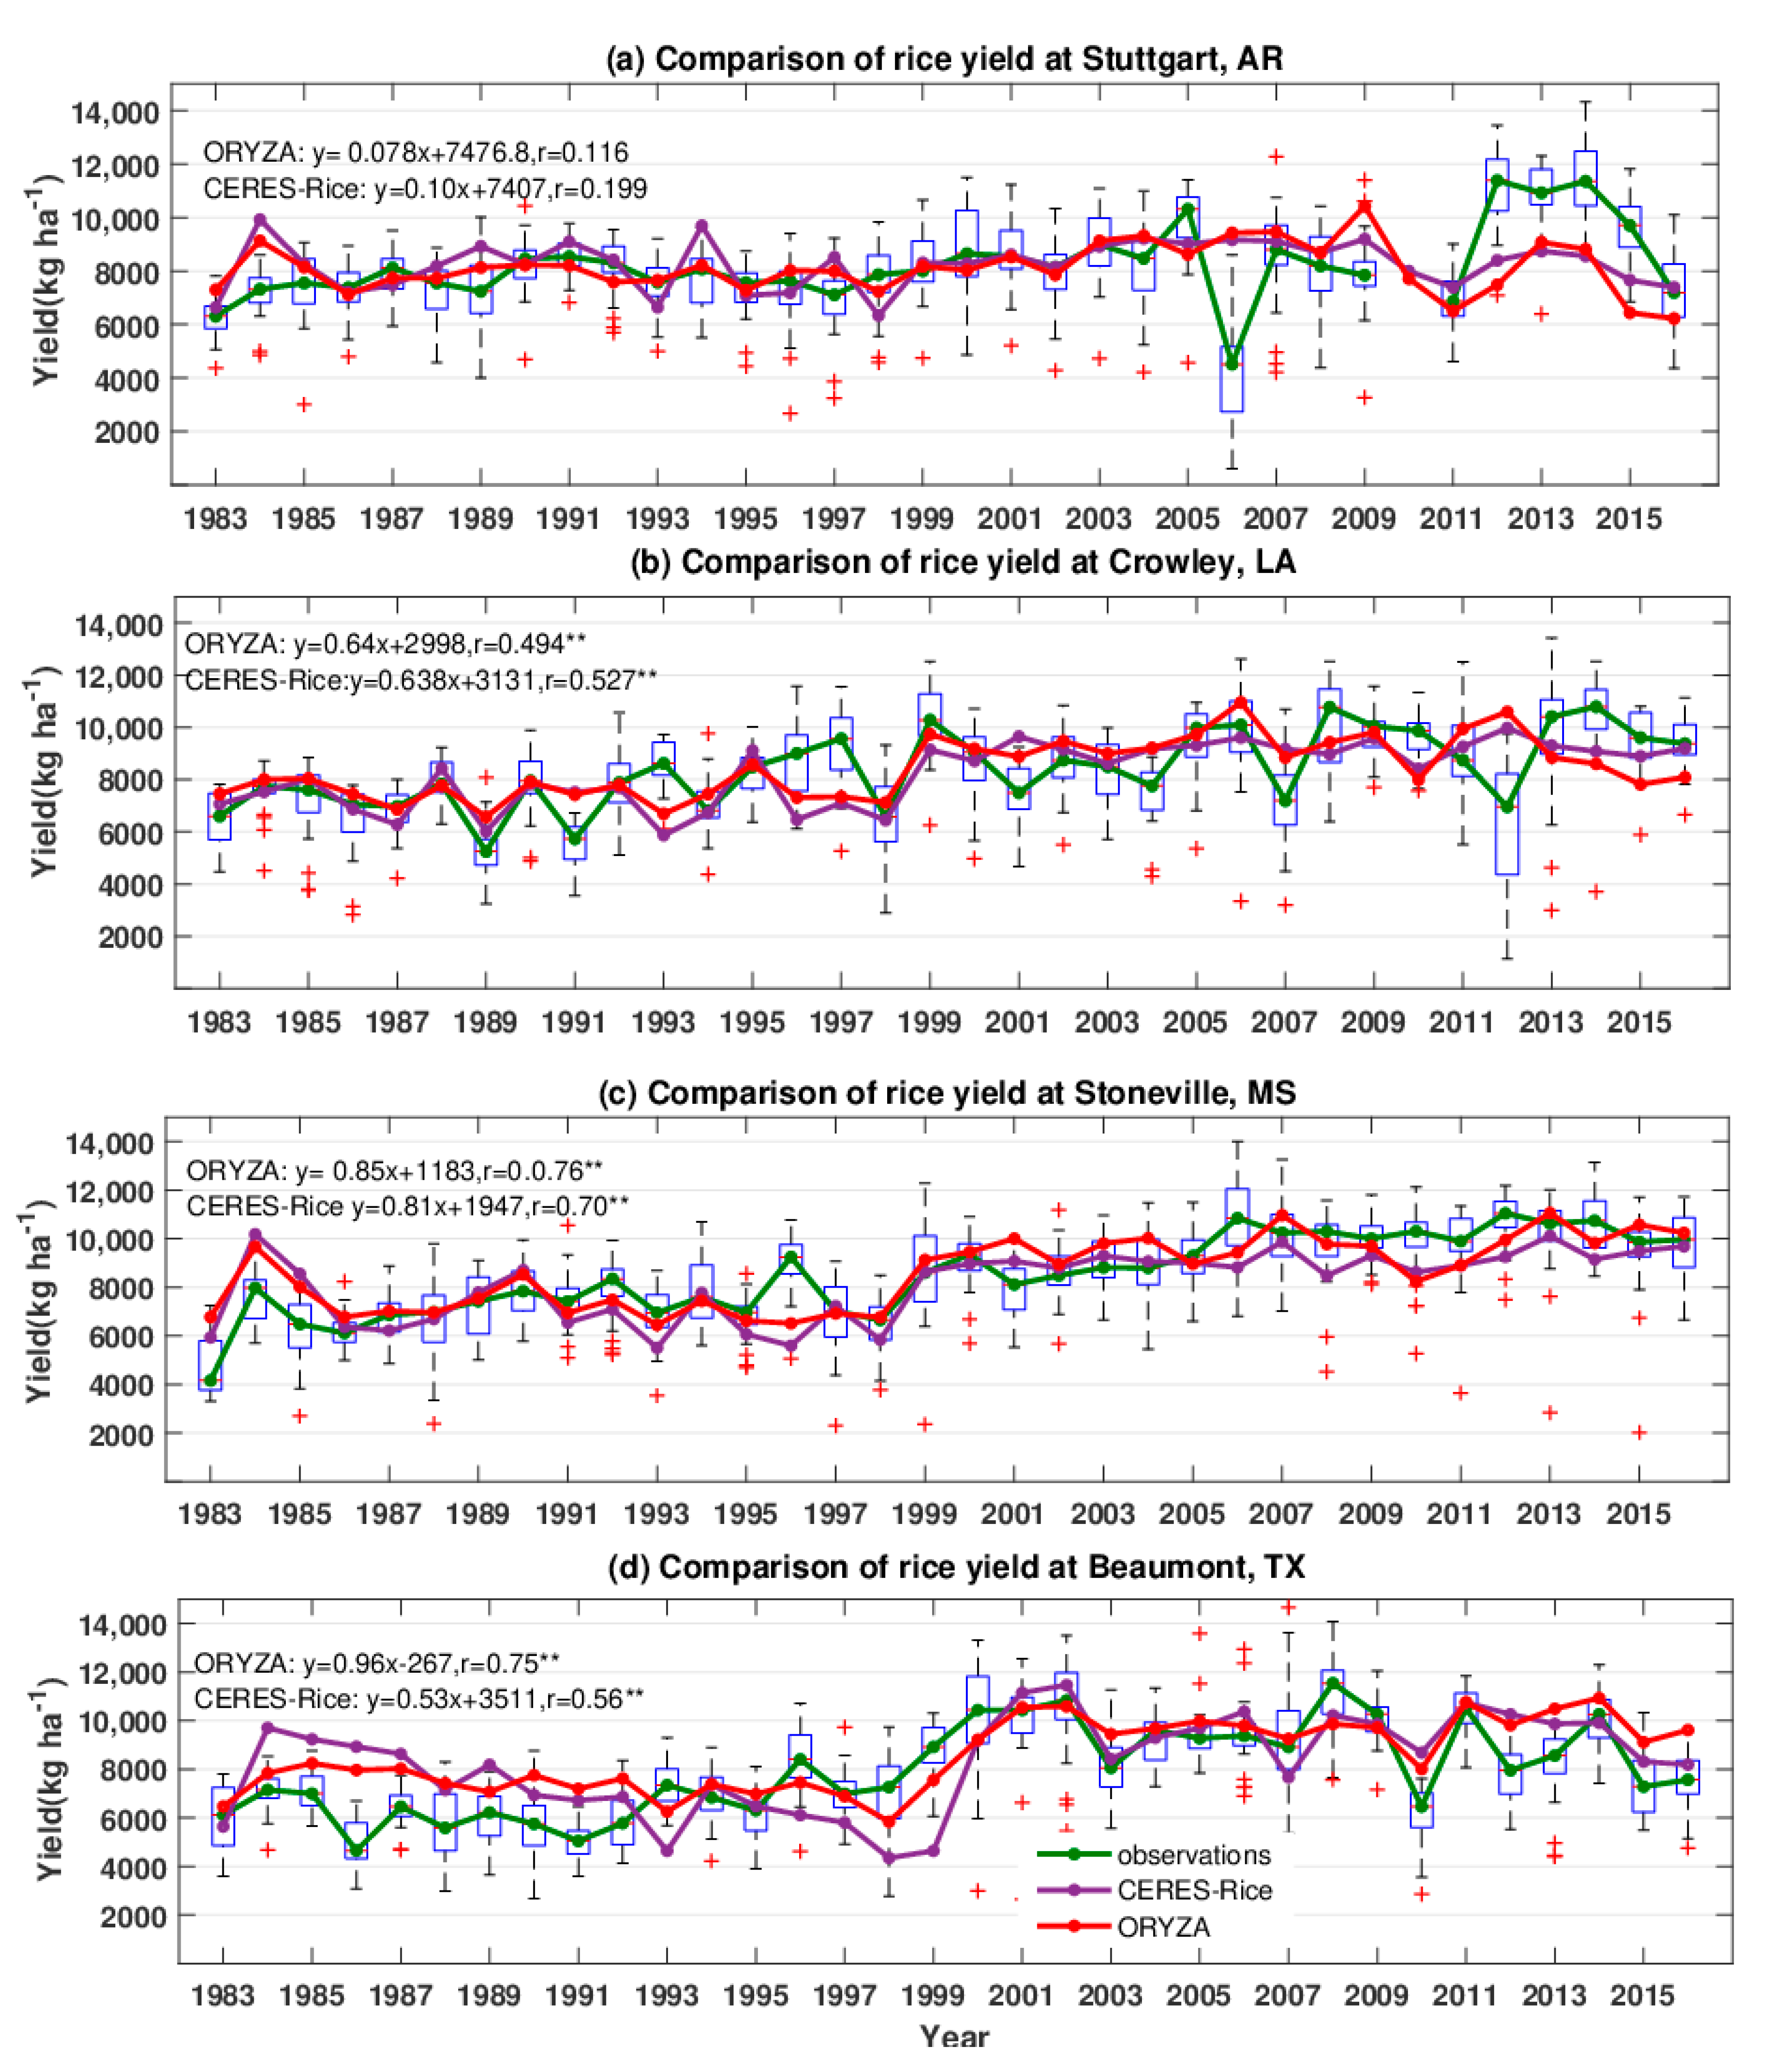
The ability of the models to capture the observed annual yield trends of the full set of 101 cultivars in the URRN database using only this calibration for these two varieties was assessed. Significant correlations were found between simulations and the 50% percentile yield (median) of observations at three out of four locations (Figure 5). Both models showed a similar performance in this respect and captured most of the annual variability of observations except for some extreme years (Table 4).
At Stuttgart, AR, there was a relatively small increase trend (63 kg year−1) in median yield response versus time (Table 1) with a sharper increase from 2011 through 2016 (Figure 5a). Model predictions using calibration of Lemont and Cocodrie were able to replicate the mean of these observed yields and trends from 1983 to 2005 (ORYZA: r = 0.48, CERES-Rice: r = 0.40), but the larger observed variability in rice yield after 2006 was not well replicated, leading to the relatively poor correlations shown in Figure 5a. Simulated yield from CERES-Rice and re-parameterized-ORYZA differed for the observed median yield for 2010 through 2016 by an average of −16.2% and −22.4% for either model, respectively (Figure 5a). For these years, solar radiation declined (Figure S4), and may reveal an over-sensitivity of both models to lower solar radiation. Despite models being calibrated for a single variety in those years, the predictions were within the 25% to 75% distribution of 101 cultivars for most years except 2006 and after 2012.
A trend of increasing median yield for 101 cultivars was also observed for Crowley, LA (Figure 5b, Table 1), which both models replicated. Exceptions were 1996 and 1997, in which yields were under-predicted, and 2007 and 2012, in which yields were over-predicted. These latter two years were associated with more cloudy days with higher rainfall and cooler temperatures, and presumably higher relative humidity, suggesting the models were unable to replicate the combined negative impact on yield (Figure S2). Observed yields in 2012 for 101 cultivars ranged broadly from 1133 to 9756 kg ha−1, indicating a wide range of cultivar responses to these wetter, cooler conditions. In this year, rice was also planted 8to 23 days earlier than the average sowing date [60]. Further evaluation of in-season climate data showed an increase of 6.7 days in which mean daily temperature was below 23 °C during reproductive development, as compared with the average of 1.3 days between 1999 and 2016, which can negatively impact yields [60].
Median yields also increased with time (Figure 5c, Table 1) for Stoneville, MS, and variability among observed cultivar yields was relatively larger than simulated (Table 4). As with results for Lemont and Cocodrie (Figure 4c), the mean yields were simulated well for most years—correlation coefficients were 0.7 or higher for both models (Figure 5c). However, both models under-estimated yields for outlying years 1996, 2006, and 2007–2011 for reasons that were not clear from the available climate data.
From 1985 through 1991, URRN yields were over-estimated by both models at Beaumont, TX (Figure 5d), with similar trends as reported in the prior section. Re-parameterized ORYZA appeared to more closely replicate yields prior to 2007, while CERES-Rice yields were closer to those observed from 2007 through 2016. Correlations were relatively high for both models (0.56 and higher) despite over-predictions. Median yields in this location appeared to have plateaued after 2002, with considerably more variability than the other three locations (Figure 5d, Table 1), which is a trend that both models captured.

4. Discussion

4.1. Simulated Rice Responses

Simulations of growth duration for CERES-Rice were more accurate as compared with default-ORYZA. This result was expected given that ORYZA was initially developed for indica rice sub-populations in tropical climates with a smaller range of climatic variation than the U.S. [43]. The default base and optimal temperatures for ORYZA were 1 and 3 °C lower than those in CERES-Rice. After re-parameterizing the cardinal temperatures in ORYZA, these values were quite similar between models, even though the model source code and implementation of these values in terms of phenology vary. These changes improved ORYZA accuracy and reduced systematic error (correlation coefficeint increased by 0.03–0.27 and RMSE decreased by 0.3–1.9 days across all locations), and exhibited similar metrics as obtained with CERES-Rice (Figure 1a,b). We applied the same set of cardinal temperatures to the re-parameterized ORYZA across both cultivars and locations, but future studies need to consider the extent to which temperature responses vary within the tropical japonica subpopulation. This is a question requiring more data than is currently available to test for phenotype differences. In years with normal climate conditions, CERES-Rice and re-parameterized-ORYZA showed similar performance in a simulating yield. Standard RMSEs across both models, cultivars, and locations ranged from 0.11 to 0.26 (Table 4), which were lower than those reported in other types of modeling studies [65], and, thus, indicated good model performance. Studies by Espe et al. (2016) [20] and Tsvetsinskaya et al. (2003) [46] observed similar accuracy for both models in the U.S. as well. Espe et al. (2016) [20] reported that ORYZA simulated rice yields for the hybrid variety CXL745 well in the Southern U.S., with 77% of simulated yields falling within ±15% of the observed means. Similarly, in the present study, 74%–75% of simulated yields for Cocodrie and Lemont were within ±15% of observance. Although RMSEs were relatively low and Willmott’s index of agreement was above 0.5 for most location-cultivar combinations, low correlation coefficients (Table 4) were observed for both models. This was primarily the result of the limited ability of either model to capture observed standard deviations across all years (Table 4) and was associated with several outlying years skewing the comparisons between observed and simulated values. Common climate conditions for these outlying years were associated with (a) colder early seasonal temperatures where the frequency of night-time temperatures below 14 °C was relatively high, such as at Stuttgart, AR, (b) higher seasonal rainfall amounts associated with cooler temperatures and lower solar radiation as at Crowley, LA, (c) higher night-time temperatures as at Beaumont, TX in 2010 (Figure S4C), and (d) years with lower solar radiation, with other factors being equal. Performance between models was similar, except re-parameterized ORYZA that provide better yield responses during lower temperature episodes (e.g., Stuttgart, AR 1994, 2006, 2008, 2009) and years with lower solar radiation (e.g., Beaumont, TX 1993–1998, Figure 4d). When comparing the simulated results for the two cultivars to the range of the 101 varieties in the URRN database, the correlations between the 50% percentile yield of observations and simulations were significant at the 5% level at three out of four sites for both models (Figure 5, Table 4). Correlations between predicted and observed values were higher for both models for these median yields as compared with results for the two individual cultivars, even though RMSE values were not necessarily lower in comparison (Table 4). This was because an individual cultivar response involves different sensitivities to climate variables and field management that can be challenging to capture over such a broad range of data. However, at a larger scale, such as the case when yield responses are grouped across multiple varieties at each location, such differences are offset by each other, and the median yield is mainly determined by climate variability rather than phenotypic difference. These results suggest that either model, once calibrated with a subset of relevant cultivars, is suitable for exploring the general or relative response of multiple rice cultivars in the Mississippi Delta region for decision support studies relevant to the rice production industry.

4.2. Model Knowledge Gaps

A higher frequency of temperatures less than 14 °C was observed at Stuttgart and Beaumont (16 and 17 days, respectively), and rice yields at both locations for some cultivars were negatively associated with cold temperatures (Figure S5). Minimum daily air temperatures below 12–15 °C can impact yield [66,67], and several years at Stuttgart were associated with more cold events in which the models were unable to replicate yields accurately despite including procedures that simulated the effect of cold on rice yield [25,68,69]. Rice sterility is more sensitive to daily minimum, as opposed to mean temperature between panicle initiation and 50% heading stages [70]. This phenomenon likely needs to be incorporated into the two rice models as well as the impacts of low temperatures on seedling vigor [71]. Espe et al. (2016) [20] also indicated that cold-induced sterility posed a challenge to ORYZA’s accuracy in a similar study in the U.S. Alternatively, cool temperatures could have limited stand establishment, development of yield components, or grain filling if they occurred during seedling, vegetative, or post flowering stages respectively.
Exposure to high temperatures near or during flowering (above 33.7 °C or higher for short periods of time) can also reduce yield due to reduced pollination [72,73,74] and spikelet sterility [72]. An improved heat sterility model including the hour at which flowering occurs during the day and transpirational cooling was introduced in the version of ORYZA [75]. However, a recent study of Mohammed et al. (2018) [76] showed that Southern U.S. cultivars had earlier flower opening times (normally open at about 8:00–9:00 a.m. or at about 10:00–11:00 on rainy days) as compared to conditions where this sterility model was developed. High night temperatures (32 °C) were also associated with reduced pollen germination and spikelet fertility in Beaumont, TX [77,78]. Thus, the feasibility of this heat sterility model needs to be further tested in Southern U.S. conditions given warming temperature trends (Table 1).
Other limitations in model performance may be associated with predictions of photosynthesis and its relationship to solar radiation and heat stress. CERES-Rice uses a radiation use efficiency approach (Equation (4)) with simple multipliers to adjust for the impact of high heat on a 24-h basis. This model was observed to be more sensitive to lower solar radiation, and yield was greatly underestimated during these conditions (Figure 4d). ORYZA uses a more mechanistic representation of a leaf photosynthetic rate, which is scaled to canopy at selected hours during the day (Equations (9)–(11)). However, both approaches involve empirical and/or temperature independent relationships applied in calculating CO2 assimilation, which may underestimate biomass growth in years with excessively high heat. For example, shorter growth duration and lower observed yield were simulated by both models in 1998 at Stuttgart, AR (Figure 4a) in response to a higher temperature (about 2 °C higher than average from 1983–1998, Figure S1a). The rising temperature may increase plant maintenance respiration [79,80], leading to a reduction in the amount of assimilates for growth and yield [81]. Since it is likely that temperature extremes are likely to be more common under future climates, the depiction of the sensitivity of rice CO2 assimilation rates and yield formation processes to heat need to be re-evaluated. More mechanistic approaches, such as those that integrate coupled biochemical models for photosynthesis and stomatal conductance within an energy balance at the leaf level, are one promising method that can directly simulate the interaction of solar radiation, air temperature, and CO2 on canopy and leaf temperature and, thus, effects on crop photosynthesis, transpiration, and other factors [23]. The sensitivity of rice growth and development to extreme climate events and warmer night temperature will need to be further developed and tested to improve the skill of ORYZA and CERES-Rice models for application in the Mississippi Delta and evaluation of climate change response. The present results, however, confirm that these two models can provide reasonably accurate responses in comparison with the historical yield record at representative sites across this region.

5. Conclusions

An increase in base and optimal temperatures improved ORYZA accuracy and reduced systematic error for applications in the U.S. Mississippi Delta region. Both CERES-Rice and Re-parameterized ORYZA rice models showed acceptable skill in reproducing the growing season duration, and exhibited higher accuracy at sites with lower interannual variability in temperature. Both models had similar performance for predicting rice yield for most varieties, locations, and years, but CERES-Rice was more sensitive to years with lower solar radiation. Negative impacts of very warm or cold temperatures were challenging for both models to replicate, which suggests that improving algorithms associated in reproducing the cold injury and high temperature stress are needed for rice model improvement. Similarly, the current representations of photosynthesis need to be improved to better capture interactions of solar radiation, temperature, and CO2 concentration on the plant growth rate and yield. Integrating a coupled biochemical model of photosynthesis and stomatal conductance within an energy balance approach is one such methodology, which has been successfully implemented for other crops. Broad variation among annual cultivar yields also indicates the need to improve model performance in considering different cultivar sensitivities to temperature stress. However, the present results suggest that these calibrated crop models can be used to simulate the relative response of multiple rice cultivars to historical and current climate conditions in the Mississippi Delta region for decision support studies.

Supplementary Materials

The following are available online at https://www.mdpi.com/2073-4395/10/12/1905/s1, Figures S1–S4: Boxplots of daily distribution of solar radiation, rainfall, minimum temperature (TN) and maximum temperature (TX) per year during the rice growing season from 1983 to 2016 at (S1) Stuttgart, AR, (S2) Crowley, AR, (S3) Stoneville, MS and (S4) Beaumont, TX; Figure S5: Pearson correlation coefficients (p < 0.05) between rice yield for 32 cultivars and seasonal average values of minimum temperature (TN), maximum temperature (TX), rainfall and the total days when minimum temperature is below 14 °C or maximum temperature is above 33 °C. Annual yield records for different varieties range from 11 to 22 years between 1983 and 2016 at each location, so the critical value (dotted line) was different for each cultivar; Figure S6: Seasonal average daily solar radiation (blue) and maximum average daily temperature (red) versus seasonal total rainfall from 1983 to 2016 (p < 0.01) for the Crowley, LA location.

Author Contributions

Conceptualization, S.L. and D.F.; Data curation, D.F. and A.M.; Formal analysis, S.L. and D.F.; Funding acquisition, D.F., D.T. and V.R.R., Methodology, S.L., D.F., D.T., V.R.R., Z.W. and A.M.; Resources, D.F. and A.M.; Software, D.F., D.T., and V.R.R.; Supervision, D.F., D.T., and V.R.R.; Writing—original draft, S.L.; Writing—review & editing, S.L. and D.F. All authors have read and agreed to the published version of the manuscript.

Funding

This work was supported by USDA-ARS, CRIS Project Number: 8042-11660-001-00D.

Conflicts of Interest

The authors declare no conflict of interest.

Disclosure Statement

Mention of a trademark or proprietary product does not constitute a guarantee or warranty of the product by the U.S. Department of Agriculture and does not imply its approval to the exclusion of other products that also can be suitable. USDA is an equal opportunity provider and employer. All experiments complied with the current laws of the United States, the country in which they were performed.

References

  1. Sandhu, N.; Kumar, A. Bridging the rice yield gaps under drought: QTLs, genes, and their use in breeding programs. Agronomy 2017, 7, 27. [Google Scholar] [CrossRef]
  2. Godfray, H.C.J.; Beddington, J.R.; Crute, I.R.; Haddad, L.; Lawrence, D.; Muir, J.F.; Pretty, J.; Robinson, S.; Thomas, S.M.; Toulmin, C. Food Security: The Challenge of Feeding 9 Billion People. Science 2010, 327, 812–818. [Google Scholar] [CrossRef] [Green Version]
  3. Foley, A.; Ramankutty, N.; Brauman, K.A.; Cassidy, E.S.; Gerber, J.S.; Johnston, M.; Mueller, N.D.; O’Connell, C.; Ray, D.K.; West, P.C.; et al. Solutions for a cultivated planet. Solut. Cultiv. Planet Nat. 2011, 478, 337–342. [Google Scholar]
  4. Reba, M.L.; Daniels, M.; Chen, Y.; Sharpley, A.; Bouldin, J.; Teague, T.G.; Daniel, P.; Henry, C.G. A statewide network for monitoring agricultural water quality and water quantity in Arkansas. J. Soil Water Conserv. 2013, 68, 45A–49A. [Google Scholar] [CrossRef] [Green Version]
  5. McClung, A.M.; Rohila, J.S.; Henry, C.G.; Lorence, A. Response of U.S. rice cultivars grown under non-flooded irrigation management. Agronomy 2020, 10, 55. [Google Scholar]
  6. Baker, J.T. Yield responses of southern US rice cultivars to CO2 and temperature. Agric. For. Meteorol. 2004, 122, 129–137. [Google Scholar] [CrossRef]
  7. Morita, S.; Wada, H.; Matsue, Y. Countermeasures for heat damage in rice grain quality under climate change. Plant. Prod. Sci. 2016, 19, 1–11. [Google Scholar]
  8. Shi, W.; Yin, X.; Struik, P.C.; Solis, C.; Xie, F.; Schmidt, R.C.; Huang, M.; Zou, Y.; Ye, C.; Jagadish, S.V.K. High day- and night-time temperatures affect grain growth dynamics in contrasting rice genotypes. J. Exp. Bot. 2017, 68, 5233–5245. [Google Scholar] [CrossRef] [Green Version]
  9. Food & Agriculture Organization (FAO). FAO Trade Yearbook; FAO: Rome, Italy, 2010. [Google Scholar]
  10. FAOSTAT. Production Quantities by Country. Available online: http://faostat3.fao.org/ (accessed on 1 March 2016).
  11. Cogato, A.; Meggio, F.; De Antoni Migliorati, M.; Marinello, F. Extreme Weather Events in Agriculture: A Systematic Review. Sustainability 2019, 11, 2547. [Google Scholar]
  12. Panagopoulos, Y.; Gassman, P.W.; Arritt, R.W.; Herzmann, D.E.; Campbell, T.D.; Jha, M.K.; Kling, C.L.; Srinivasan, R.; White, M.; Arnold, J.G. Surface water quality and cropping systems sustainability under a changing climate in the Upper Mississippi River Basin. J. Soil Water Conserv. 2014, 69, 483–494. [Google Scholar]
  13. Panagopoulos, Y.; Gassman, P.W.; Arritt, R.W.; Herzmann, D.E.; Campbell, T.D.; Valcu, A.; Jha, M.K.; Kling, C.L.; Srinivasan, R.; White, M.; et al. Impacts of climate change on hydrology, water quality and crop productivity in the Ohio-Tennessee River Basin. Int. J. Agric. Biol. Eng. 2015, 8, 36–53. [Google Scholar]
  14. Jones, J.W.; Antle, J.M.; Basso, B.; Boote, K.J.; Conant, R.T.; Foster, I.; Godfray, H.C.J.; Herrero, M.; Howitt, R.E.; Janssen, S.; et al. Brief history of agricultural systems modeling. Agric. Syst. 2017, 155, 240–254. [Google Scholar] [CrossRef]
  15. Loomis, R.S.; Ragginage, R.; Ng, E. Explanatory models in crop physiology. Ann. Rev. Plant. Physiol. 1979, 30, 339–367. [Google Scholar] [CrossRef]
  16. Gupta, R.; Mishra, A. Climate change induced impact and uncertainty of rice yield of agro-ecological zones of India. Agric. Syst. 2019, 173, 1–11. [Google Scholar] [CrossRef]
  17. Chen, X.; Wang, L.; Niu, Z.; Zhang, M.; Li, C.; Li, J. The effects of projected climate change and extreme climate on maize and rice in the Yangtze River Basin, China. Agric. For. Meteorol. 2020, 282–283, 107867. [Google Scholar] [CrossRef]
  18. Boonwichai, S.; Shrestha, S.; Babel, M.S.; Weesakul, S.; Datta, A. Climate change impacts on irrigation water requirement, crop water productivity and rice yield in the Songkhram River Basin, Thailand. J. Clean. Prod. 2018, 198, 1157–1164. [Google Scholar] [CrossRef]
  19. Ziska, L.H.; Fleisher, D.H.; Linscombe, S. Ratooning as an adaptive management tool for climatic change in rice systems along a north-south transect in the southern Mississippi valley. Agric. For. Meteorol. 2018, 263, 409–416. [Google Scholar] [CrossRef]
  20. Espe, M.B.; Yang, H.; Cassman, K.G.; Guilpart, N.; Sharifi, H.; Linquist, B.A. Estimating yield potential in temperate high-yielding, direct-seeded US rice production systems. Field Crops Res. 2016, 193, 123–132. [Google Scholar] [CrossRef] [Green Version]
  21. Li, T.; Hasegawa, T.; Yin, X.; Zhu, Y.; Boote, K.; Adam, M.; Bregaglio, S.; Buis, S.; Confalonieri, R.; Fumoto, T.; et al. Uncertainties in predicting rice yield by current crop models under a wide range of climatic conditions. Glob. Chang. Biol. 2015, 21, 1328–1341. [Google Scholar] [CrossRef]
  22. Fleisher, D.H.; Condori, B.; Quiroz, R.; Alva, A.; Asseng, S.; Barreda, C.; Bindi, M.; Boote, K.J.; Ferrise, R.; Franke, A.C.; et al. A potato model inter-comparison across varying climates and productivity levels. Glob. Chang. Biol. 2017, 23, 1258–1281. [Google Scholar] [CrossRef]
  23. Boote, K.J.; Jones, J.W.; White, J.W.; Asseng, S.; Lizaso, J.I. Putting mechanisms into crop production models. Plant. Cell Environ. 2013, 36, 1658–1672. [Google Scholar] [CrossRef]
  24. Kanter, D.G.; Theodore, C.M.; Joe, E.S. Mississippi Rice Variety Trials; Mississippi Agricultural and Forestry Experiment Station: Bost North, MS, USA, 1998–2016. [Google Scholar]
  25. Bouman, B.A.M.; Kropff, M.J.; Tuong, T.P.; Wopereis, M.C.S.; ten Berge, H.F.M.; van Laar, H.H. ORYZA2000: Modeling Lowland Rice; IRRI: Los Banos, Philippines, 2001. [Google Scholar]
  26. Li, T.; Angeles, O.; Marcaida, M.; Manalo, E.; Manalili, M.P.; Radanielson, A.; Mohanty, S. From ORYZA2000 to ORYZA(v3): An improved simulation model for rice in drought and nitrogen deficient environments. Agric. For. Meteorol. 2017, 237, 246–256. [Google Scholar] [CrossRef]
  27. Jones, J.; Hoogenboom, G.; Porter, C.; Boote, K.; Batchelor, W.; Hunt, L.; Wilkens, P.; Singh, U.; Gijsman, A.; Ritchie, J. The DSSAT cropping system model. Eur. J. Agron. 2003, 18, 235–265. [Google Scholar] [CrossRef]
  28. Ahmad, S.; Ahmad, A.; Tojo Soler, C.M.; Ali, H.; Zia-Ul-Haq, M.; Anothai, J.; Hussain, A.; Hoogenboom, G.; Hasanuzzaman, M. Application of the CSM-CERES-Rice model for evaluation of plant density and nitrogen management of fine transplanted rice for an irrigated semiarid environment. Precis. Agric. 2012, 13, 200–218. [Google Scholar] [CrossRef]
  29. Asadi, M.E.; Clement, R.S. Evaluation of CERES-Maize of DSSAT model to simulate nitrate leaching, yield and soil moisture content under tropical conditions. J. Food Agri. Eng. Res. 2003, 1, 270–276. [Google Scholar]
  30. Timsina, J.; Humphreys, E. Performance of CERES- Rice and CERES-Wheat models in rice-wheat systems: A review. Agric. Syst. 2006, 90, 5–31. [Google Scholar] [CrossRef]
  31. Timsina, J.; Humphreys, E. Performance and Application of CERES and SWAGMAN Destiny Models for Rice Wheat Cropping Systems of Asia and Australia—A Review; Technical Report 16/03; CSIRO Land and Water: Griffith, NSW, Australia, 2003. [Google Scholar]
  32. Kerdsuk, V. Application of Crop. Modeling and GIS for Agroclimatic of KDML105 in Tung Samrit; Suranaree University of Technology: Nakhon Rachasima, Thailand, 2002. [Google Scholar]
  33. Cheyglinted, S.; Ranamukhaarachchi, S.L.; Singh, G. Assessment of the CERES-Rice model for rice production in the Central Plain of Thailand. J. Agric. Sci. 2001, 137, 289–298. [Google Scholar] [CrossRef]
  34. Bouman, B.A.M.; van Laar, H.H. Description and evaluation of the rice growth model ORYZA2000 under nitrogen-limited conditions. Agric. Syst. 2006, 87, 249–273. [Google Scholar] [CrossRef]
  35. Amiri, E.; Rezaee, M.E. Valuation of water-nitrogen schemes for rice in Iran, using ORYZA2000 model. Commun. Soil Sci. Plant. Anal. 2013, 41, 2459–2477. [Google Scholar] [CrossRef]
  36. Jing, Q.; Bouman, B.A.M.; Hengsdijk, H.; Keulen, H.; Cao, W. Exploring options to combine high yields with high nitrogen use efficiencies in irrigated rice in China. Eur. J. Agron. 2007, 26, 166–177. [Google Scholar] [CrossRef]
  37. Feng, L.; Bouman, B.A.M.; Tuong, T.P.; Cabangon, R.J.; Li, Y.; Lu, G.; Feng, Y. Exploring options to grow rice using less water in northern China using a modelling approach. I: Field experiments and model evaluation. Agric. Water Manag. 2007, 88, 1–13. [Google Scholar] [CrossRef]
  38. Aggarwal, P.K.; Mall, R.K. Climate change and rice yields in diverse agroenvironments of India. ii. effects of uncertainties in scenarios and crop models on impact assessment. Clim. Chang. 2002, 52, 331–343. [Google Scholar]
  39. Sudhir-Yadav; Li, T.; Humphreys, E.; Gill, G.; Kukal, S.S. Evaluation and application of ORYZA2000 for irrigation scheduling of puddled transplanted rice in northwest India. Field Crops Res. 2011, 122, 104–117. [Google Scholar]
  40. Horie, T.; Nakagawa, M.; Ohnishi, M.; Nakno, J. Rice Production in Japan under 8 Current and Future Climates. In Modeling the Impact of Climate Change on Rice Production in Asia; Matthews, R.B., Kropff, M.J., Bachelet, D., Laar, H.H., Eds.; IRRI/CAB International: Wallingford, UK, 1995; pp. 143–164. [Google Scholar]
  41. Meinke, H. Agricultural impacts: Europe’s diminishing bread basket. Nat. Clim. Chang. 2014, 3, 541–542. [Google Scholar] [CrossRef]
  42. Zhang, T.; Zhu, J.; Yang, X. Non-stationary thermal time accumulation reduces the predictability of climate change effects on agriculture. Agric. For. Meteorol. 2008, 148, 1412–1418. [Google Scholar] [CrossRef]
  43. Kropff, M.J.; Van Laar, H.H.; Matthews, R.B. ORYZA1: An Ecophysiological Model for Irrigated Rice Production (SARP Research Proceedings); International Rice Research Institute: Manila, Philippines, 1994; p. 110. [Google Scholar]
  44. Ten Berge, H.F.M.; Kropff, M.J. Founding a systems research network for rice. In Eco-Regional Approaches for Sustainable Land Use and Food Production; Bouma, J., Kuyvenhoven, A., Bouman, B.A.M., Luyten, J.C., Zandstra, H.G., Eds.; Kluwer Academic Publishers: Dordrecht, The Netherlands, 1995; pp. 263–282. [Google Scholar]
  45. Van Oort, P.A.J.; Zhang, T.; de Vries, M.E.; Heinemann, A.B.; Meinke, H. Correlation between temperature and phenology prediction error in rice (Oryza sativa L.). Agric. For. Meteorol. 2011, 151, 1545–1555. [Google Scholar] [CrossRef]
  46. Tsvetsinskaya, E.A.; Mearns, L.O.; Mavromatis, T.; Gao, W.; McDaniel, L.; Downton, M.W. The effect of spatial scale of climatic change scenarios on simulated maize, winter wheat, and rice production in the southeastern United States. Clim. Chang. 2003, 60, 37–71. [Google Scholar] [CrossRef]
  47. Kottek, M.; Grieser, J.; Beck, C.; Rudolf, B.; Rubel, F. 2006: World Map of the Köppen-Geiger climate classification updated. Meteorol. Z. 2006, 15, 259–263. [Google Scholar] [CrossRef]
  48. FAO-UNESCO. FAO-UNESCO Soil Map of the World; UNESCO: Paris, France, 1974; Volume 1. [Google Scholar]
  49. Pachepsky, Y.; Park, Y. Saturated hydraulic conductivity of US soils grouped according to textural class and bulk density. Soil Sci. Soc. Am. J. 2015, 79, 1094–1100. [Google Scholar] [CrossRef]
  50. Ritchie, J.T.; Singh, U.; Godwin, D.; Bowen, W.T. Cereal Growth Development and Yield. In Understanding Options for Agricultural Production; Tsuji, G.Y., Hoogenboom, G., Thornton, P.K., Eds.; Kluwer Academic Publishers: Dordrecht, The Netherlands, 1998; pp. 79–97. [Google Scholar]
  51. Daniel, W.; Sarath, P.N.; Asha, S.K.; Weerakoon, W.M.W.; Peter, J.T.; Kenneth, J.B.; James, W.J. Accounting for both parameter and model structure uncertainty in crop model predictions of phenology: A case study on rice. Eur. J. Agron. 2017, 88, 53–62. [Google Scholar]
  52. Gao, L.; Jin, Z.; Huang, Y.; Zhang, L. Rice clock model—A computer model to simulate rice development. Agric. For. Meteorol. 1992, 60, 1–16. [Google Scholar] [CrossRef]
  53. Spitters, C.J.T.; Toussaint, H.A.J.M.; Goudriaan, J. Separating the diffuse and direct component of global radiation and its implications for modeling canopy photosynthesis. I. Components of incoming radiation. Agric. For. Meteorol. 1986, 38, 217–229. [Google Scholar] [CrossRef]
  54. Goudriaan, J.; van Laar, H.H. Simulation of Crop Growth Processes; Kluwer Academic Publishers: Dordrecht, The Netherlands, 1994; p. 238. [Google Scholar]
  55. Goudriaan, J. A simple and fast numerical method for the computation of daily totals of canopy photosynthesis. Agric. For. Meteorol. 1986, 43, 251–255. [Google Scholar]
  56. Batjes, N.H.A. World dataset of derived soil properties by FAO-UNESCO soil unit for global modelling. Soil Use Manag. 1997, 13, 9–16. [Google Scholar] [CrossRef]
  57. Sacks, W.J.; Deryng, D.; Foley, J.; Ramankutty, N. Crop planting dates: An analysis of global patterns. Glob. Ecol. Biogeogr. 2010, 19, 607–620. [Google Scholar] [CrossRef]
  58. Karen, M.; Paul, C.; Jarrod, H. Chapter 2 Rice Growth and Development. In Arkansas Rice Production Handbook-MP192; Division of Agriculture Cooperative Extension Service, University of Arkansas: Little Rock, AR, USA, 2018. [Google Scholar]
  59. Wilson, L.T.; Yang, Y.; Wang, J.; Arthur, F.H. Web-Based Information Delivery. In 2012 Texas Rice Production Guidelines; Way, M.O., Ed.; Texas AgriLife Research and Extension Center: Beaumon, TX, USA, 2012; pp. 64–73. [Google Scholar]
  60. Linscombe, S.D.; Sha, X.Y.; Bearb, K.F.; Conner, C.A.; Howard, A.M.; Theunissen, B.W.; Henry, B.J.; Hoffpauir, H.L. Rice Breeding. In 94th–108th Annual Research Report; Rice Research Station: Crowley, LA, USA, 2002–2016. [Google Scholar]
  61. University of Arkansas Cooperative Extension Service (CES). Arkansas Rice Performance Trials; University of Arkansas Division of Agriculture: Marion, AR, USA; U.S. Department of Agriculture and County Governments Cooperating: Little Rock, AR, USA, 2007–2015.
  62. Hoogenboom, G.; Porter, C.H.; Boote, K.J.; Shelia, V.; Wilkens, P.W.; Singh, U.; White, J.W.; Asseng, S.; Lizaso, J.; Moreno, L.P.; et al. The DSSAT crop modeling ecosystem. In Advances in Crop Modeling for Sustainable Agriculture; Boote, K.J., Ed.; Burleigh Dodds Science Publishing: Cambridge, UK, 2019; pp. 173–216. [Google Scholar]
  63. Willmott, C.J. Some comments on the evaluation of model performance. Bull. Am. Meteor. 1982, 63, 1309–1313. [Google Scholar] [CrossRef] [Green Version]
  64. Boza, E.J.; Correll, J.C.; Lee, F.N.; Moldenhauer, K.A.K.; Gibbons, J.W. Screening of the Rice Breeder Germplasm (URRN’s, ARTP’s, and PRELIMS) to Seven Races of the Rice Blast Pathogen, Pyricularia grisea. In Rice Research Studies 2006; Norman, R.J., Meullenet, J.F., Moldenhauer, K.A.K., Eds.; Arkansas Agricultural Experiment Station, Division of Agriculture, University of Arkansas System: Fayetteville, AR, USA, 2006; Series 550. [Google Scholar]
  65. Heidmann, T.; Tofteng, C.; Abrahamsen, P.; Plauborg, F.; Hansen, S.; Battilani, A.; Coutinho, J.; Doležal, F.; Mazurczyk, W.; Ruiz, J.D.R.; et al. Calibration procedure for a potato crop growth model using information from across Europe. Ecol. Model. 2008, 211, 209–223. [Google Scholar] [CrossRef]
  66. Board, J.E.; Peterson, M.L.; Ng, E. Floret sterility in rice in a cool environment. Argon. J. 1980, 72, 483–487. [Google Scholar] [CrossRef]
  67. Board, J.E.; Peterson, M.L. Rice sterility varies with variety and area. Calif. Agric. 1982, January–February, 6–7. [Google Scholar]
  68. Uchijima, T. Some aspects of relation between low air temperature and sterile spikelets in rice plants. J. Agric. Meteorol. 1976, 31, 199–202. [Google Scholar] [CrossRef] [Green Version]
  69. Timsina, J.; Singh, U.; Godwin, D.; Humphreys, E. Modelling Chilling Injury in Rice Using CSM-Ceres-Rice; CRC for Sustainable Rice Production: Canberra, Australia, 2004. [Google Scholar]
  70. Farrell, T.C.; Fox, K.M.; Williams, R.L.; Fukai, S. Genotypic variation for cold tolerance during reproductive development in rice: Screening with cold air and cold water. Field Crops Res. 2006, 98, 178–194. [Google Scholar] [CrossRef]
  71. Yang, P.; Chen, C.L.; Zou, G.X.; Peng, Z.Q.; Wu, Y.S.; Huang, Y.P.; Xiong, Y.H.; Yin, J.H. Research progress in relevant theories of increasing breeding level of direct-seeding rice. Acta Agric. Jiangxi 2015, 27, 33–35. [Google Scholar]
  72. Satake, T.; Yoshida, S. High temperature-induced sterility in Indica rice at flowering. Jpn. J. Crop. Sci. 1978, 47, 6–17. [Google Scholar] [CrossRef] [Green Version]
  73. Matsui, T.; Horie, T. Effect of elevated CO2 and high temperature on growth and yield of rice. 2. Sensitive period and pollen germination rate in high temperature sterility of rice spikelets at flowering. Jpn. J. Crop. Sci. 1992, 61, 148–149. [Google Scholar]
  74. Jagadish, S.V.K.; Craufurd, P.; Wheeler, T.R. High temperature stress and spikelet fertility in rice (Oryza sativa L.). J. Exp. Bot. 2007, 58, 1627–1635. [Google Scholar] [CrossRef] [Green Version]
  75. van Oort, P.A.J.; de Vries, M.E.; Yoshida, H.; Saito, K. Improved climate risk simulations for Rice in arid environments. PLoS ONE 2015, 10, e0118114. [Google Scholar] [CrossRef] [Green Version]
  76. Mohammed, A.R.; Kobayasi, K.; Yoshimoto, M. Rice Flower Opening Time in Southern U.S. Cultivars. In Proceedings of the ASA and CSSA Meeting, Baltimore, MD, USA, 4–7 November 2018. [Google Scholar]
  77. Mohammed, A.R.; Tarpley, L. Impact of high nighttime temperature on respiration, membrane stability, antioxidant capacity, and yield of rice plants. Crop. Sci. 2009, 49, 313–322. [Google Scholar] [CrossRef] [Green Version]
  78. Mohammed, A.R.; Tarpley, L. High nighttime temperatures affect rice productivity through altered pollen germination and spikelet fertility. Agric. For. Meteorol. 2009, 14, 999–1008. [Google Scholar] [CrossRef]
  79. Long, S.P. Modification of the response of photosynthetic 841 productivity to rising temperature by atmospheric CO2 concentrations: Has its importance been underestimated? Plant. Cell Environ. 1991, 14, 729–739. [Google Scholar] [CrossRef]
  80. Amthor, J.S. The McCree-de Wit -Penning De Vrie -Thornley respiration paradigms: 3 years later. Ann. Bot. 2000, 86, 1–20. [Google Scholar] [CrossRef] [Green Version]
  81. Monteith, J.L. Climatic variation and the growth of crops. Q. J. R. Meteorol. Soc. 1981, 107, 749–774. [Google Scholar] [CrossRef]
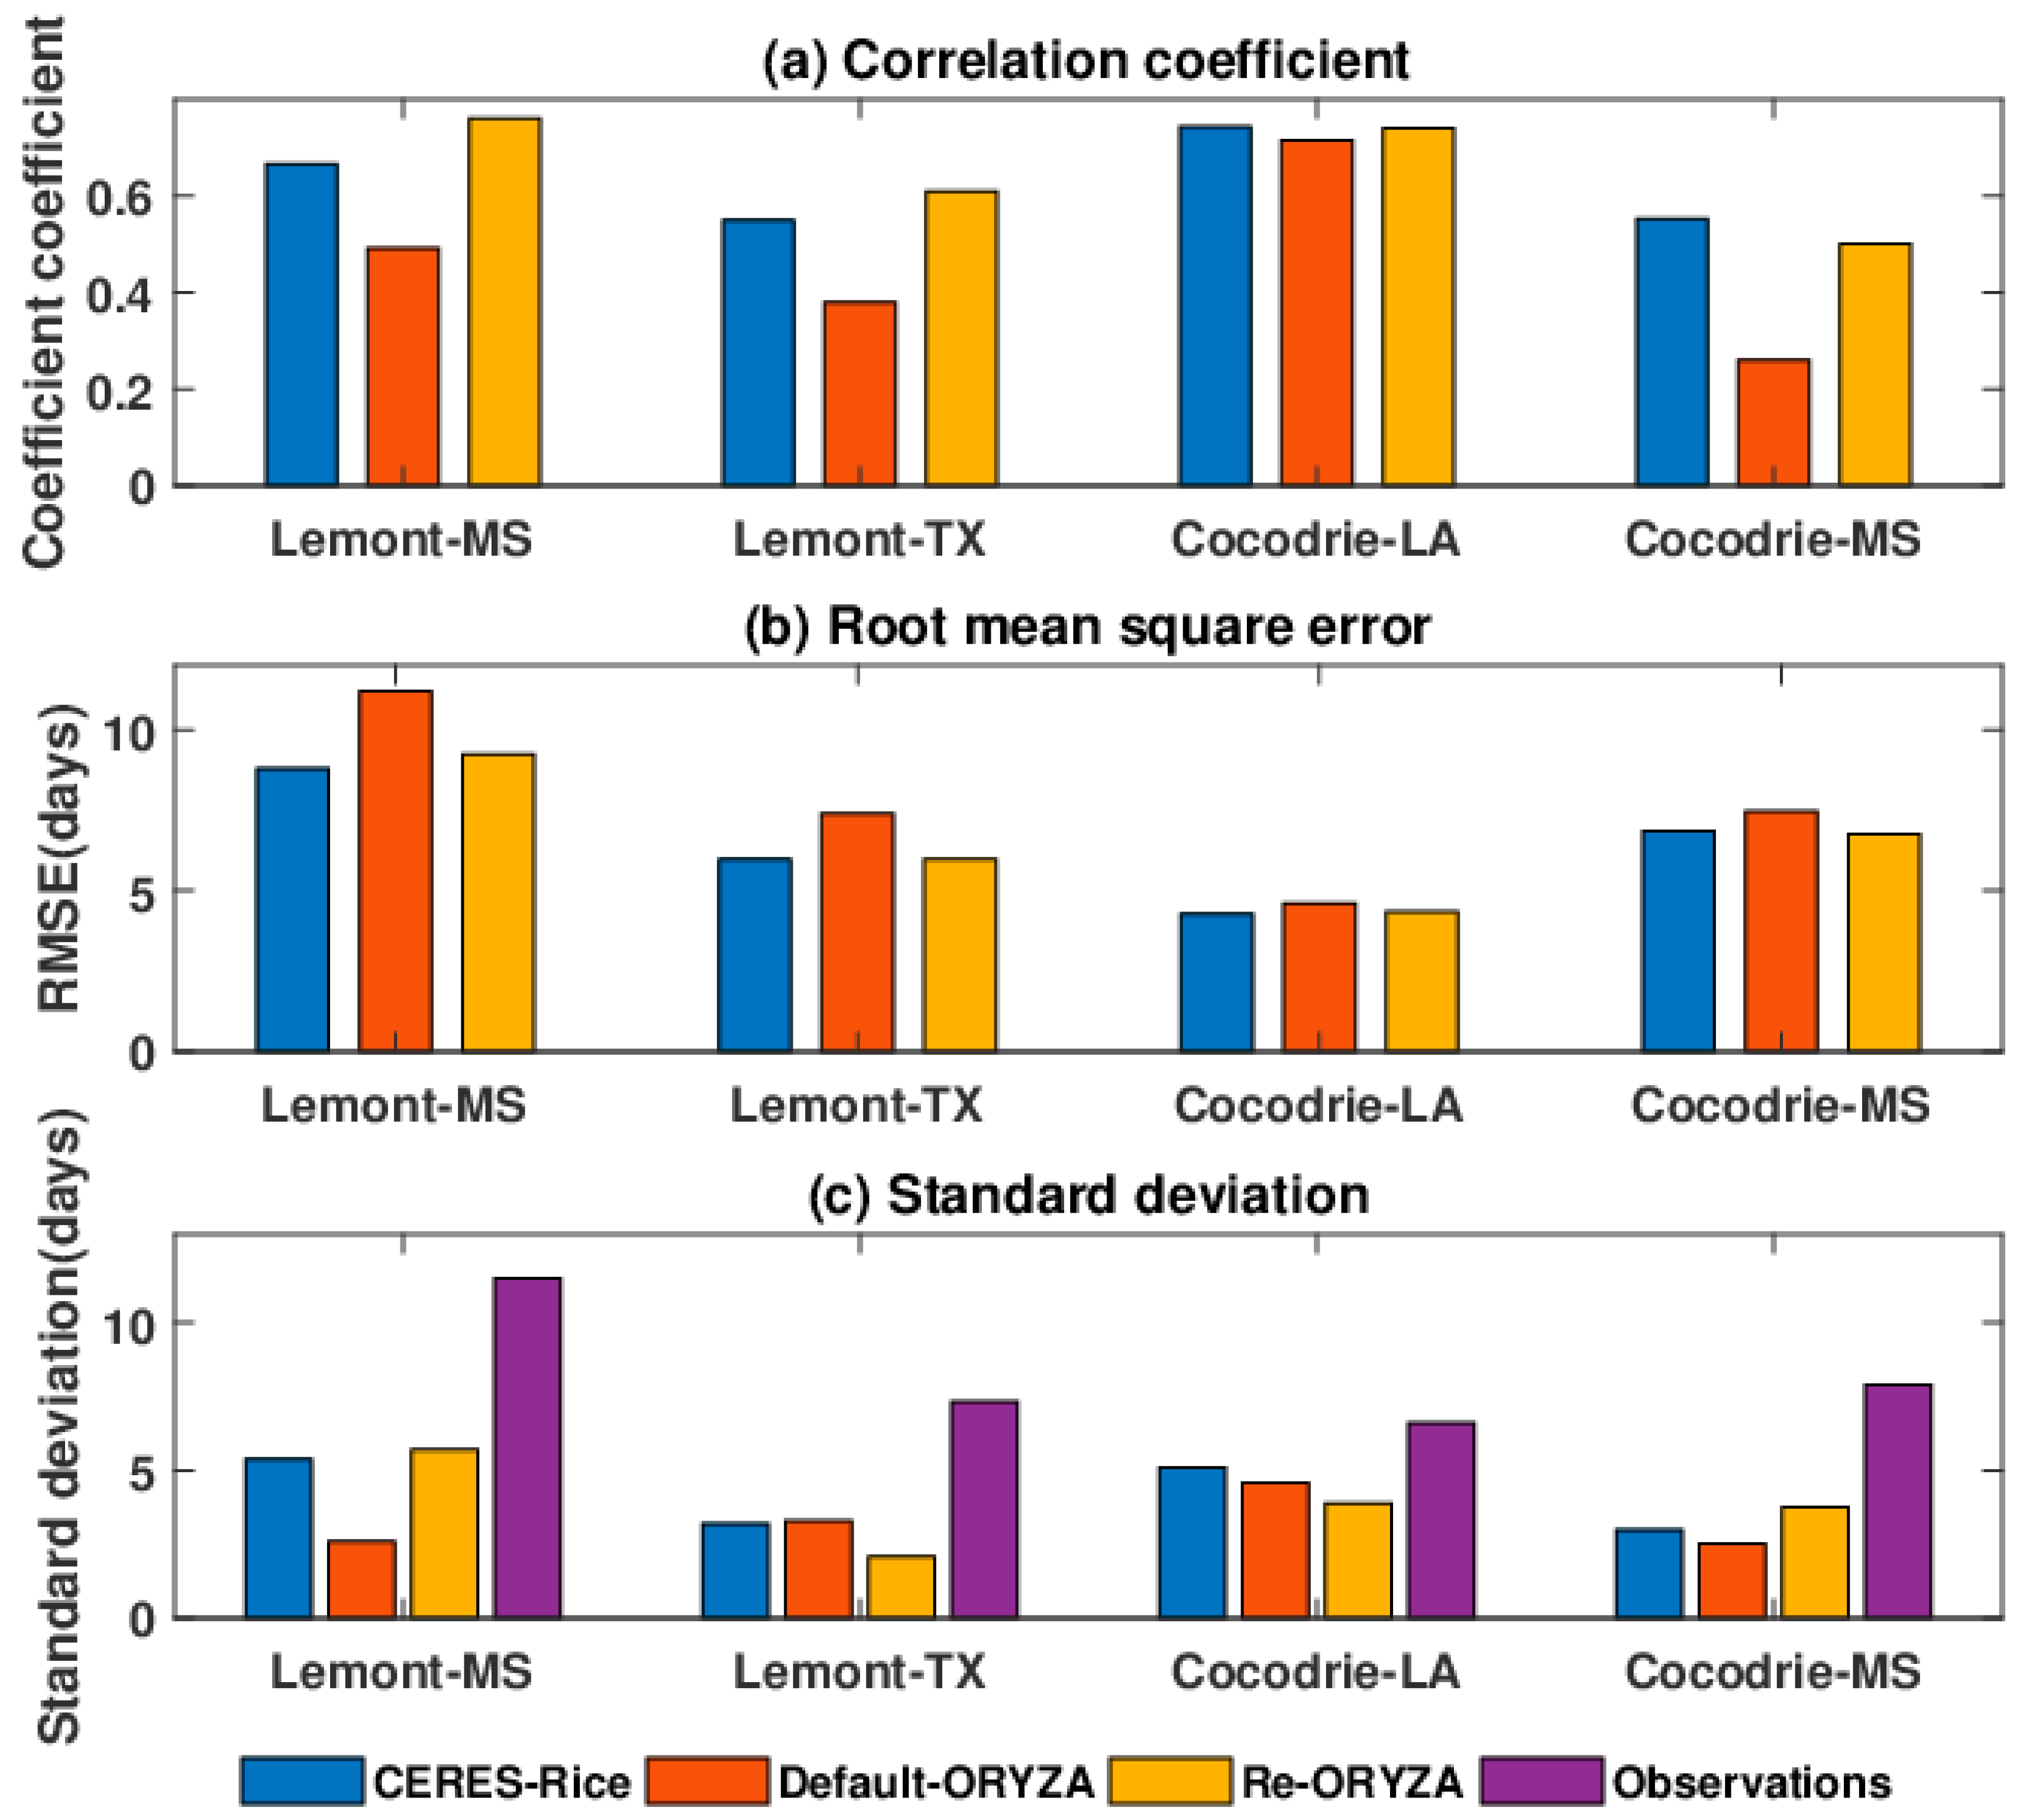
Figure 1. Comparison of (a) correlation coefficient, (b) root mean square error (RMSE), and (c) standard deviation for CERES-Rice and the two ORYZA versions (default and re-parameterized). Correlation coefficient and RMSE were obtained from the difference between observed and simulated values, and standard deviations reflect the annual yield variation for Lemont at Beaumont, TX (1983–1998) and Stoneville, MS (1983–1998), and for Cocodrie at Crowley, LA (2003–2016) and Stoneville, MS (1998–2016).
Agronomy 10 01905 g001
Figure 2. Correlation coefficients and Root Mean Square Error (RMSE) between observed and simulated growth durations from ORYZA with varying cardinal temperatures. Scenarios included cultivar Lemont at Stoneville, MS and Beaumont, TX for 1983–1998 (ad) and Cocodrie (CCDR) grown at Crowley, LA and Stoneville, MS for 1999–2016 (eh). Default values were 8, 30, and 42 °C for base, optimal, and maximum, respectively (e.g., B8 O30 X42 on the y-axis). Results for variations in base (B8, B9, or B12 °C), optimal (O30 or O33 °C), and maximum (X42 and X999 °C) values were evaluated.
Agronomy 10 01905 g002aAgronomy 10 01905 g002b
Figure 3. Comparison of observed and simulated rice growing season duration obtained from re-parametrized ORYZA and CERES-Rice for cultivar Lemont at (a) Stoneville, MS and (b) Beaumont, TX from 1983 to 1998 and for Cocodrie (CCDR) at (c) Crowley, LA (2003–2016) and (d) Stoneville, MS (1999–2016).
Agronomy 10 01905 g003
Figure 4. Comparison of observed and simulated rice yield obtained from CERES-Rice and re-parameterized ORYZA for Lemont from 1983 to 1998 and for Cocodrie (CCDR) from 1999 to 2016 at (a) Stuttgart, AR, (b) Crowley, LA, (c) Stoneville, MS, and (d) Beaumont, TX.
Agronomy 10 01905 g004
Figure 5. Comparison of simulated yield for cultivar Lemont (simulated for 1983–1998) and Cocodrie (simulated for 1999–2016) to observed a 50% percentile yield (green line) from the full cultivar set (n = 101 or less) that were grown during the particular year at (a) Stuttgart, AR, (b) Crowley, LA, (c) Stoneville, MS, and (d) Beaumont, TX. The box plot shows the variation of these observed rice yields. Top, middle, and bottom lines of each ‘box’ are the 25th, 50th, and 75th percentiles, and ends of the whiskers (lines extending from the boxes) mark the highest and lowest values of the data set that are within 1.5 times the interquartile range. Outliers were shown by the red plus (+) sign.
Agronomy 10 01905 g005
Table 1. Observed climate and rice yield from four representative locations in the Uniform Regional Rice Nursery (URRN) database from 1983 to 2016. Seasonal averages for daily mean temperature (Tmean), rainfall, and yield averaged across 101 varieties were shown. Trends indicating the increase in maximum (Tmax) or minimum temperature (Tmin), and the 50% percentile yield of 101 varieties (Yield) versus time were computed as the slope of the linear regression of the response variable versus year.
SiteBeaumont, TXCrowley, LAStuttgart, ARStoneville, MS
Latitude, Longitude30.07, −94.2930.24, −92.3834.5, −91.5533.43, −94.28
Tmean (°C)25.7 ± 0.6425.5 ± 0.625.1 ± 0.7625.7 ± 0.79
Rainfall (mm)1033 ± 288744 ± 372424 ± 132467 ± 134
Mean yield (kg ha-1)7919 ± 18498388 ± 14638195 ± 13878509 ± 1646
Trend in Tmax (°C decade−1)0.010.010.10.44 (**)
Trend in Tmin (°C decade−1)0.60 (**)0.43 (**)0.41 (**)0.33 (**)
Trend in Yield (kg year−1)116 (**)93 (**)63 (**)144 (**)
** Correlation is significant with p < 0.01.
Table 2. Input requirements and data sources used to calibrate and run CERES-Rice and ORYZA for cultivars Lemont (1983–1998) and Cocodrie (1999–2016) for each location.
ModelInput TypeVariablesData Source
CERES-Rice Weather *Tmin, Tmax, SRAD, rainfalliAIMS Climate data (1)
Soilsoil characterization data such as physical, chemical, and morphological properties (2)[56]
Cropcultivar coefficients for Lemont and CocodrieCalibrated by Genetic Coefficient Estimator
Managementplanting date, row, and plant spacing[24,57]
Calibration inputs yield, grain weight, flowering, and harvest dates[24]
ORYZAWeatherTmin, Tmax, SRAD, rainfall, VP, WDiAIMS Climate data (1)
Soilsoil texture and hydrological properties (2)[48,49]
Cropphenology development rate
fraction of total dry matter partitioned to organs over growth stages
specific leaf area index
Calibrated by DRATES
Standard crop file from
ORYZA v3
Management dates of emergence[24]
Calibration inputsdates of emergence, panicle initiation, flowering, and maturity[24,58]
Both modelsPlanting dates TX: April 1–27[59]
MS: April 23–May 19[24]
LA: March 5–28[60]
AR: April 12–May 13[61]
(1)https://beaumont.tamu.edu/climaticdata/StationInventory.aspx?index=Inventory. (2) Two different soil data sources were used for CERES and ORYZA in order to provide values needed for the type of soil input data for each model. * Abbreviations: Tmin: minimum temperature (°C). Tmax: maximum temperature (°C). SRAD: solar radiation (MJ m−2 d−1 for CERES-Rice, KJ m−2 d−1 for ORYZA). iAIMS: Integrated Agricultural Information and management System.VP: vapor pressure (kPa). WD: mean wind speed (m s−1). DRATES: main model to calculate development rate parameters for ORYZA.
Table 3. Calibrated genetic coefficient values for rice cultivars Lemont and Cocodrie in CERES-Rice and ORYZA models.
Model Parameter 1Value
LemontCocodrie
CERES-Rice P1604.3366.9
P2O10.3648.41
P2R49.6075.62
P5517.4730.1
G145.2610.54
G20.02500.0250
G31.001.00
G41.001.00
ORYZADVRJ0.0009030.000784
DVRI0.0007580.000758
DVRP0.0008390.001247
DVRR0.0018320.001538
1 P1: Time from seed emergence to the end of juvenile phase (expressed as growing degree days (GDD) in °C). P2O: Critical photoperiod or the longest day length (in hours). P2R: extent to which phasic development leading to panicle initiation is delayed (GDD in °C). P5: time period from grain filling to physical maturity (GDD in °C). G1: Maximum spikelet number coefficient. G2: Maximum possible single grain weight (g) under ideal growing conditions. G3: Scalar vegetative growth coefficient for tillering relative to the IR64 tillering coefficient. G4: Temperature tolerance is the scalar coefficient. DVRJ: Development rate in a juvenile phase (°C d−1). DVRI: Development rate in a photoperiod-sensitive phase (°C d−1). DVRP: Development rate in panicle development (°C d−1). DVRR: Development rate in a reproductive phase (°C d−1).
Table 4. Correlation coefficient (r), root mean square error (RMSE), standard root mean square error (SRMSE = RMSE/average yield) between observed (Ob) and simulated (S) yields, ratio of simulated average yield to observed average yield (S/ob), the mean absolute percentage error (MAPE), and standard deviation of observed (Ob Std) and simulated (S Std) rice yield for varieties Lemont (1983–1998), Cocodrie (1999–2016), and comparison of 50% percentile yield of 101 varieties for 1983–2016 to simulated yield for cultivar Lemont (1983–1998) and Cocodrie (1999–2016). Models were CERES-Rice and a re-parameterized version of ORYZA.
ModelVarietiesSitesrdRMSE
(kg ha−1)
SRMSES/obMAPEOb
Std
(kg ha−1)
S
Std
(kg ha−1)
CERES-RiceLemontStuttgart 0.240.5411530.151.044%7161098
Crowley 0.410.6510940.150.964%1103899
Stoneville 0.300.5713070.221.033%12321273
Beaumont –0.130.2515750.261.000%8421575
CocodrieStuttgart 0.120.4216070.211.066%1607594
Crowley –0.320.1812820.140.973%1115383
Stoneville 0.040.4512720.130.919%860438
Beaumont 0.56 *0.7514560.150.982%15841572
50% percentile yieldStuttgart 0.200.4614760.181.000%1387903
Crowley 0.53 **0.7313260.160.982%14631209
Stoneville 0.70 **0.8113150.160.964%16461430
Beaumont 0.56 **0.7417860.211.044%18491934
Re-ORYZALemontStuttgart 0.080.448310.111.022%716511
Crowley 0.52 *0.629140.121.000%1103527
Stoneville 0.320.5012990.191.077%1232848
Beaumont –0.230.2611790.171.044%842670
CocodrieStuttgart 0.070.4618960.231.044%16071145
Crowley 0.010.3513670.140.982%1115861
Stoneville 0.030.3911220.110.973%860732
Beaumont 0.58 *0.6912570.131.011%1584881
50% percentile yieldStuttgart 0.120.4415580.190.991%1387923
Crowley 0.49 **0.7113150.161.000%14631127
Stoneville 0.76 **0.8710770.121.011%16461461
Beaumont 0.75 **0.8113650.171.088%18491448
* Correlation was significant with p < 0.05. ** Correlation was significant with p < 0.01.
Table 5. Correlation coefficient (r) and slope (m) from the linear regression of simulated yield versus mean seasonal temperature T (kg °C−1), average daily solar radiation SRAD (kg (MJ.m−2 d−1)−1, or seasonal total rainfall P (kg mm−1) for CERES-Rice and re-parameterized ORYZA for cultivars Lemont (LMNT) for 1983–1998 and Cocodrie (CCDR) for 1999–2016.
SitesVariablesCERES-RiceORYZA
LMNTCCDRLMNTCCDR
rSloperSloperSloperSlope
Stuttgart T −0.70 **−863−0.59 *−478−0.50 *−290−0.61 **−958
SRAD −0.25−5140.61 **413−0.23−2220.54 *706
P0.59 **4.80.150.040.55 *2.110.312.48
Crowley T 0.2385−0.38−2710.16158−0.25−381
SRAD0.61 *9450.443340.78 **6190.64 **1074
P−0.280.700.170.42−0.33−0.88−0.43−2.3
Stoneville T −0.66 **−1010−0.36−223−0.62 *−614−0.54 *−553
SRAD0.173810.76 **4110.233290.49 *448
P−0.07−0.690.150.50−0.14−0.940.50 *2.7
Beaumont T −0.34−1012−0.28−1086−0.28−357−0.48 *−1082
SRAD0.81 **7060.93 **8520.76 **2840.68 **348
P0.080.430.171.20.0060.010.100.40
* Correlation was significant with p < 0.05. ** Correlation was significant with p < 0.01.
Publisher’s Note: MDPI stays neutral with regard to jurisdictional claims in published maps and institutional affiliations.