Article

Genetic Diversity among Cowpea (Vigna unguiculata (L.) Walp.) Landraces Suggests Central Mozambique as an Important Hotspot of Variation

by
Ana Maria Figueira Gomes
1,2,3,
David Draper
4,5,
Pedro Talhinhas
6,
Paula Batista Santos
6,
Fernanda Simões
7,
Nascimento Nhantumbo
2,
Rafael Massinga
2,
José C. Ramalho
1,8,*,
Isabel Marques
1,* and
Ana I. Ribeiro-Barros
1,8,*
1
Plant Stress and Biodiversity Lab, Forest Research Center, Instituto Superior de Agronomia, Universidade de Lisboa, 1349-017 Lisbon, Portugal
2
Divisão de Agricultura, Instituto Superior Politécnico de Manica (DivAG-ISPM), Chimoio 2202, Mozambique
3
TropiKMan Doctorate Programme, Nova School of Business and Economics, Universidade NOVA de Lisboa, 2775-405 Carcavelos, Portugal
4
National Museum of Natural History and Science and Centre for Ecology, Evolution and Environmental Change, Universidade de Lisboa, 1250-102 Lisboa, Portugal
5
UBC Botanical Garden & Centre for Plant Research, Department of Botany, University of British Columbia, Vancouver, BC V6T 1Z4, Canada
6
Linking Landscape Environment, Agriculture and Food, Instituto Superior de Agronomia, Universidade de Lisboa, 1349-017 Lisbon, Portugal
7
Unidade de Investigação em Biotecnologia e Recursos Genéticos (UIBRG), Instituto Nacional de Investigação Agrária e Veterinária, I.P. (INIAV), 2784-505 Oeiras, Portugal
8
GeoBioSciences, GeoTechnologies and GeoEngineering (GeoBioTec), Faculdade de Ciências e Tecnologia, Universidade NOVA de Lisboa, 2829-516 Caparica, Portugal
*
Authors to whom correspondence should be addressed.
Agronomy 2020, 10(12), 1893; https://doi.org/10.3390/agronomy10121893
Submission received: 8 November 2020 / Revised: 24 November 2020 / Accepted: 25 November 2020 / Published: 30 November 2020
(This article belongs to the Special Issue Analysis of Crop Genetic and Germplasm Diversity)

Abstract

:
Cowpea is a multiple-purpose drought-tolerant leguminous pulse crop grown in several dry tropical areas. Its domestication center is thought to be East or West Africa, where a high level of genetic diversity is apparently still found. However, detailed genetic information is lacking in many African countries, limiting the success of breeding programs. In this work, we assessed the genetic variation and gene flow in 59 Vigna unguiculata (cowpea) accessions from 10 landraces spanning across six agro-ecological zones of Mozambique, based on nuclear microsatellite markers. The results revealed the existence of high genetic diversity between the landraces, even in comparison to other world regions. Four genetic groups were found, with no specific geographic pattern, suggesting the presence of gene flow between landraces. In comparison, the two commercial varieties had lower values of genetic diversity, although still close to the ones found in local landraces. The high genetic diversity found in Mozambique sustains the importance of local genetic resources and farm protection to enhance genetic diversity in modern varieties of cowpea worldwide.

1. Introduction

Cowpea (Vigna unguiculata (L.) Walp.), also known as black eye pea, is a major annual pulse crop mostly grown in dry tropical areas of Latin America, South Asia, and Africa [1]. It is cultivated mainly for its seeds, which have a high dry matter content of proteins (20–32%) and carbohydrates (50–60%). Both the grains and leaves are also rich in the amino acid lysine and tryptophan, vitamin C, iron, and zinc [2]. Cowpea therefore has an essential role in the human diet in many developing countries, being referred to as the “poor man’s meat” [3]. As a legume, it is also an important component of traditional cropping systems since rhizobium facilitation fixes atmospheric nitrogen and contributes to soil fertility improvement, particularly in smallholder farming systems where little or no fertilizer is used [4]. The bulk of cowpea production and consumption occurs in sub-Saharan Africa, namely West and Central Africa [1], where its nutritional value and tolerance to drought place this crop in a unique position in the continent’s efforts to establish nutrition-sensitive food systems. That is especially important to help curb malnutrition, particularly among the most vulnerable—pregnant or lactating women and children under five [5]. Although cowpea is known to be drought tolerant when compared to other crops, the productivity of cowpea varieties is hampered by erratic rainfall, and many are sensible to high temperatures [1,5]. Thus, appropriate agronomic practices could improve the performance of new varieties within different agro-ecological zones described by the Food and Agriculture Organizatio as a land resource mapping unit, defined in terms of climate, landform and soils, and/or land cover, and having a specific range of potentials and constraints for land use [6]. Indeed, physiological, and metabolic studies show a progressive acclimation of cowpea plants to stress [7] and differential drought responses of landraces with contrasting abiotic tolerance levels [8].
Despite being native to Africa [9,10], the domestication center of cowpea is unclear but thought to be in either East or West Africa, where high morphological and genetic diversity is found, followed by a sub-domestication region in India resulting in the selection/domestication of two additional subspecies, the yard-long bean (Vigna unguiculata subsp. sesquipedalis (L.) Verdc.) and the catiang (V. unguiculata subsp. cylindrica (L.) Verdc.) [9,10,11]. European accessions usually cluster together with those from West Africa and were likely imported from this region [11]. Breeding lines in America also show a high genetic similarity with African accessions, although local American landraces show a high genetic divergence with those of other regions such as East Asia and Oceania [11,12].
Because of this domestication history linked to a center of origin in Africa, cowpea research has been underway in several African countries for many years. Breeding activities in sub-Saharan Africa involving germplasm collection, evaluation, and screening for the identification of lines with high yield potential resulted in a diverse cowpea germplasm collection constituting more than 15,000 cultivated cowpeas from 89 different countries [1,11,12]. Additionally, a core collection of more than 2000 accessions based on geographical, agronomical, and botanical descriptors has been established in The International Institute for Tropical Agriculture (IITA) genebank with the aim of discovering new traits related with stress tolerance for the development of new breeding lines [13,14]. The United States Department of Agriculture—Genetic Resources Information Network (USDA-GRIN) at Griffin USA [10] and University of California, Riverside, USA [12] also hold cowpea collections with 7737 and 6000 germplasm accessions, respectively. Cowpea has several features of a classical model plant for genomic studies, such as a relatively small diploid (2n = 2x = 22 chromosomes) genome of ∼613 Mbp, a short annual life cycle, and a highly selfing nature [15].
The limited number of cowpea breeding programs in Mozambique has contributed to the country’s ineffectiveness in taking advantage of the continent’s high genetic potential. A significant pool of cowpea landraces is thought to be available, but the limited detailed information available about their diversity and agronomic potential makes it difficult for breeding programs to thrive. Thus, the characterization of cowpea genetic resources available in Mozambique is of extreme importance for conservation and breeding, since it is the second most cultivated legume crop in the country, occupying an extension of ca. 380,000 ha, with an average yield of 0.275 t ha−1 [1]. Unlike commercial varieties, landraces maintained by farmers usually have high levels of genetic variability as they have evolved from years of uncontrolled cross-regional and infield genetic exchange, even between previously released and discontinued open pollinated varieties [16], not being subjected to selection over a long period of time [17,18,19]. However, knowledge about their variability is usually limited [20]. Therefore, the aim of this study was to assess the genetic diversity of 59 cowpea accessions from 10 landraces across six agro-ecological zones of Mozambique, using single sequence repeat (SSR) markers.

2. Materials and Methods

2.1. Plant Material

Fifty-nine cowpea accessions corresponding to 10 landraces were sampled in six agro-ecological zones (AEZs) in the provinces of Manica, Sofala, and Zambezia, where cowpea is grown as an integral component of local cereal–legume cropping systems (Figure 1): R3 (North and Central Gaza and Western Inhambane), R4 (medium-altitude areas of Central Mozambique), R5 (low-altitude areas of Sofala and Zambezia), R6 (dry areas of Zambezia and Southern Tete), R7 (mid-altitude areas of Zambezia, Nampula, Tete, Niassa, and Cabo Delgado), and R10 (high-altitude areas of Zambezia, Niassa, Angonia-Maravia, and Manica [21]). Additionally, two widely used commercial cultivars (IT16 and IT18) released by the Mozambican Institute of Agricultural Research (IIAM) and bred through a partnership with the International Institute of Tropical Agriculture (IITA) in Nigeria were also used in this study.

2.2. DNA Extraction and nSSR Amplification

The 61 samples used in this study were genotyped based on nine polymorphic nuclear single sequence repeats (nSSRs) previously developed by [22]: VuUGM05, VuUGM22, VuUGM31, VuUGM33, VuUGM39, VuUGM40, VuUGM68, VuUGM71, and VuUGM74. Based on an initial survey, we selected these nSSR markers since they produced robust, highly polymorphic amplified bands among the entire collection of cowpea samples. Total genomic DNA was extracted from 50 mg of ground leaves using the InnuSPEED Plant DNA Kit (Analytik Jena Innuscreen GmbH, Germany) according to the manufacturer’s protocol. The average yield and purity were assessed spectrophotometrically by OD230, OD260, and OD280 readings (Nanodrop 2000, Thermo Fisher Scientific, Waltham, MA, USA) and visualized by electrophoresis in 1% agarose gels under UV light. Amplifications were performed in 15 μL reactions containing 1.25U TaKaRa Hot startTaq polymerase, 1X Buffer I, 0.15 mM dNTPs, 0.2 μM Primer F-ROX and R, and 100 ng DNA under the following PCR conditions: an initial denaturation at 95 °C for 5 min, followed by 35 cycles of denaturation at 65 °C (20 s),annealing at 56 °C (30 s), and a final extension at 60 °C for 30 min. Allele sizes were determined using GeneMapper 3.2 (Applied Biosystems; UK).

2.3. Genetic Diversity and Population Structure

For each nSSR locus and landrace, genetic diversity was assessed by calculating the total number of alleles (Na), mean expected heterozygosity (He), mean observed heterozygosity (Ho), allelic richness (AR), and inbreeding coefficient (FIS) using FSTAT 2.9.3.2 [23]). GenAlEx 6 software was used to estimate the mean expected heterozygosity (He) and mean observed heterozygosity (Ho) for each population, as well as the number of private alleles [24]. The selfing rate (s) was estimated as s   =   2 F I S / 1   +   F I S [25]. Hardy Weinberg Exact (HWE) Tests and linkage disequilibrium among SSR markers were determined using the software program GENEPOP 4.7 [26,27] with dememorization numbers at 10,000 and performing 100,000 iterations for all permutation tests. Significant values were corrected for multiple comparisons by Bonferroni correction [28]. An analysis of variance was used to detect significant differences between sites for the measured genetic values. Grids for all significant genetic parameters were generated in R and were based on a grid with a cell size of 30 s (which corresponds to approximately 1 km in the study area), applying a 1.5-degree circular neighborhood diameter. The circular neighborhood was used to re-sample the genetic composition of a single sample to all surrounding grid cells, with a size of 30 s, within a diameter of 1.5 degrees around its location. In this way, the genetic composition of each sample is representative for the area within the defined buffer zone.

2.4. Population Structure and Differentiation

The Bayesian program STRUCTURE v.2.3.4 [29] was used to test whether any discrete genetic structure existed among the landraces and AEZs sampled. The analysis was performed assuming clusters from K = 1 to K = 8, with 10 repetitions per K. Models were run assuming ancestral admixture and correlated allele frequencies with 50,000 burn-in steps, followed by run lengths of 300,000 interactions for each K. The optimum K was determined using STRUCTURE HARVESTER [30], which identifies the optimal K based on both the posterior probability of the data for a given K and the ∆K [31]. To correctly assess the membership proportions (q values) for clusters identified in STRUCTURE, the results of the replicates at the best-fit K were post-processed using CLUMPP 1.1.2 [32]. POPULATION 1.2 [33] was used to calculate the Nei’s genetic distance [34] among individuals and to construct an unrooted neighbor-joining (NJ) tree with 1000 bootstrap replicates. A principal component analysis (PCoA) was also constructed in GenAlEx6 [24] to detect the genetic relatedness among individuals based on Nei’s genetic distance. We estimated genetic differentiation among locations via an analysis of molecular variance (AMOVA) using ARLEQUIN 3.11 [35]. Molecular variance was quantified among and within landraces, considering AEZs and wild cowpea versus cultivars, via an AMOVA using 10,000 permutations at the 0.95 significance level in ARLEQUIN 3.11 [35].

2.5. Spatial Analysis and Genetic Diversity Rarefaction

Grids for genetic parameters were generated in DIVA-GIS version 7.5 (www.diva-gis.org) based on a grid with a cell size of 2.5 min (which corresponds to approximately 4.5 km in the study area) and applying a circular neighborhood with a diameter buffer of one degree (corresponding to approximate 111 km). The circular neighborhood was used to illustrate the allelic composition of each sampled site representative for the area within the defined buffer zone. Genetic diversity rarefaction considered the spatial average of several population parameters such as the number of alleles (NA), observed heterozygosity (Ho), inbreeding coefficient (FIS), and selfing rate (s).

3. Results

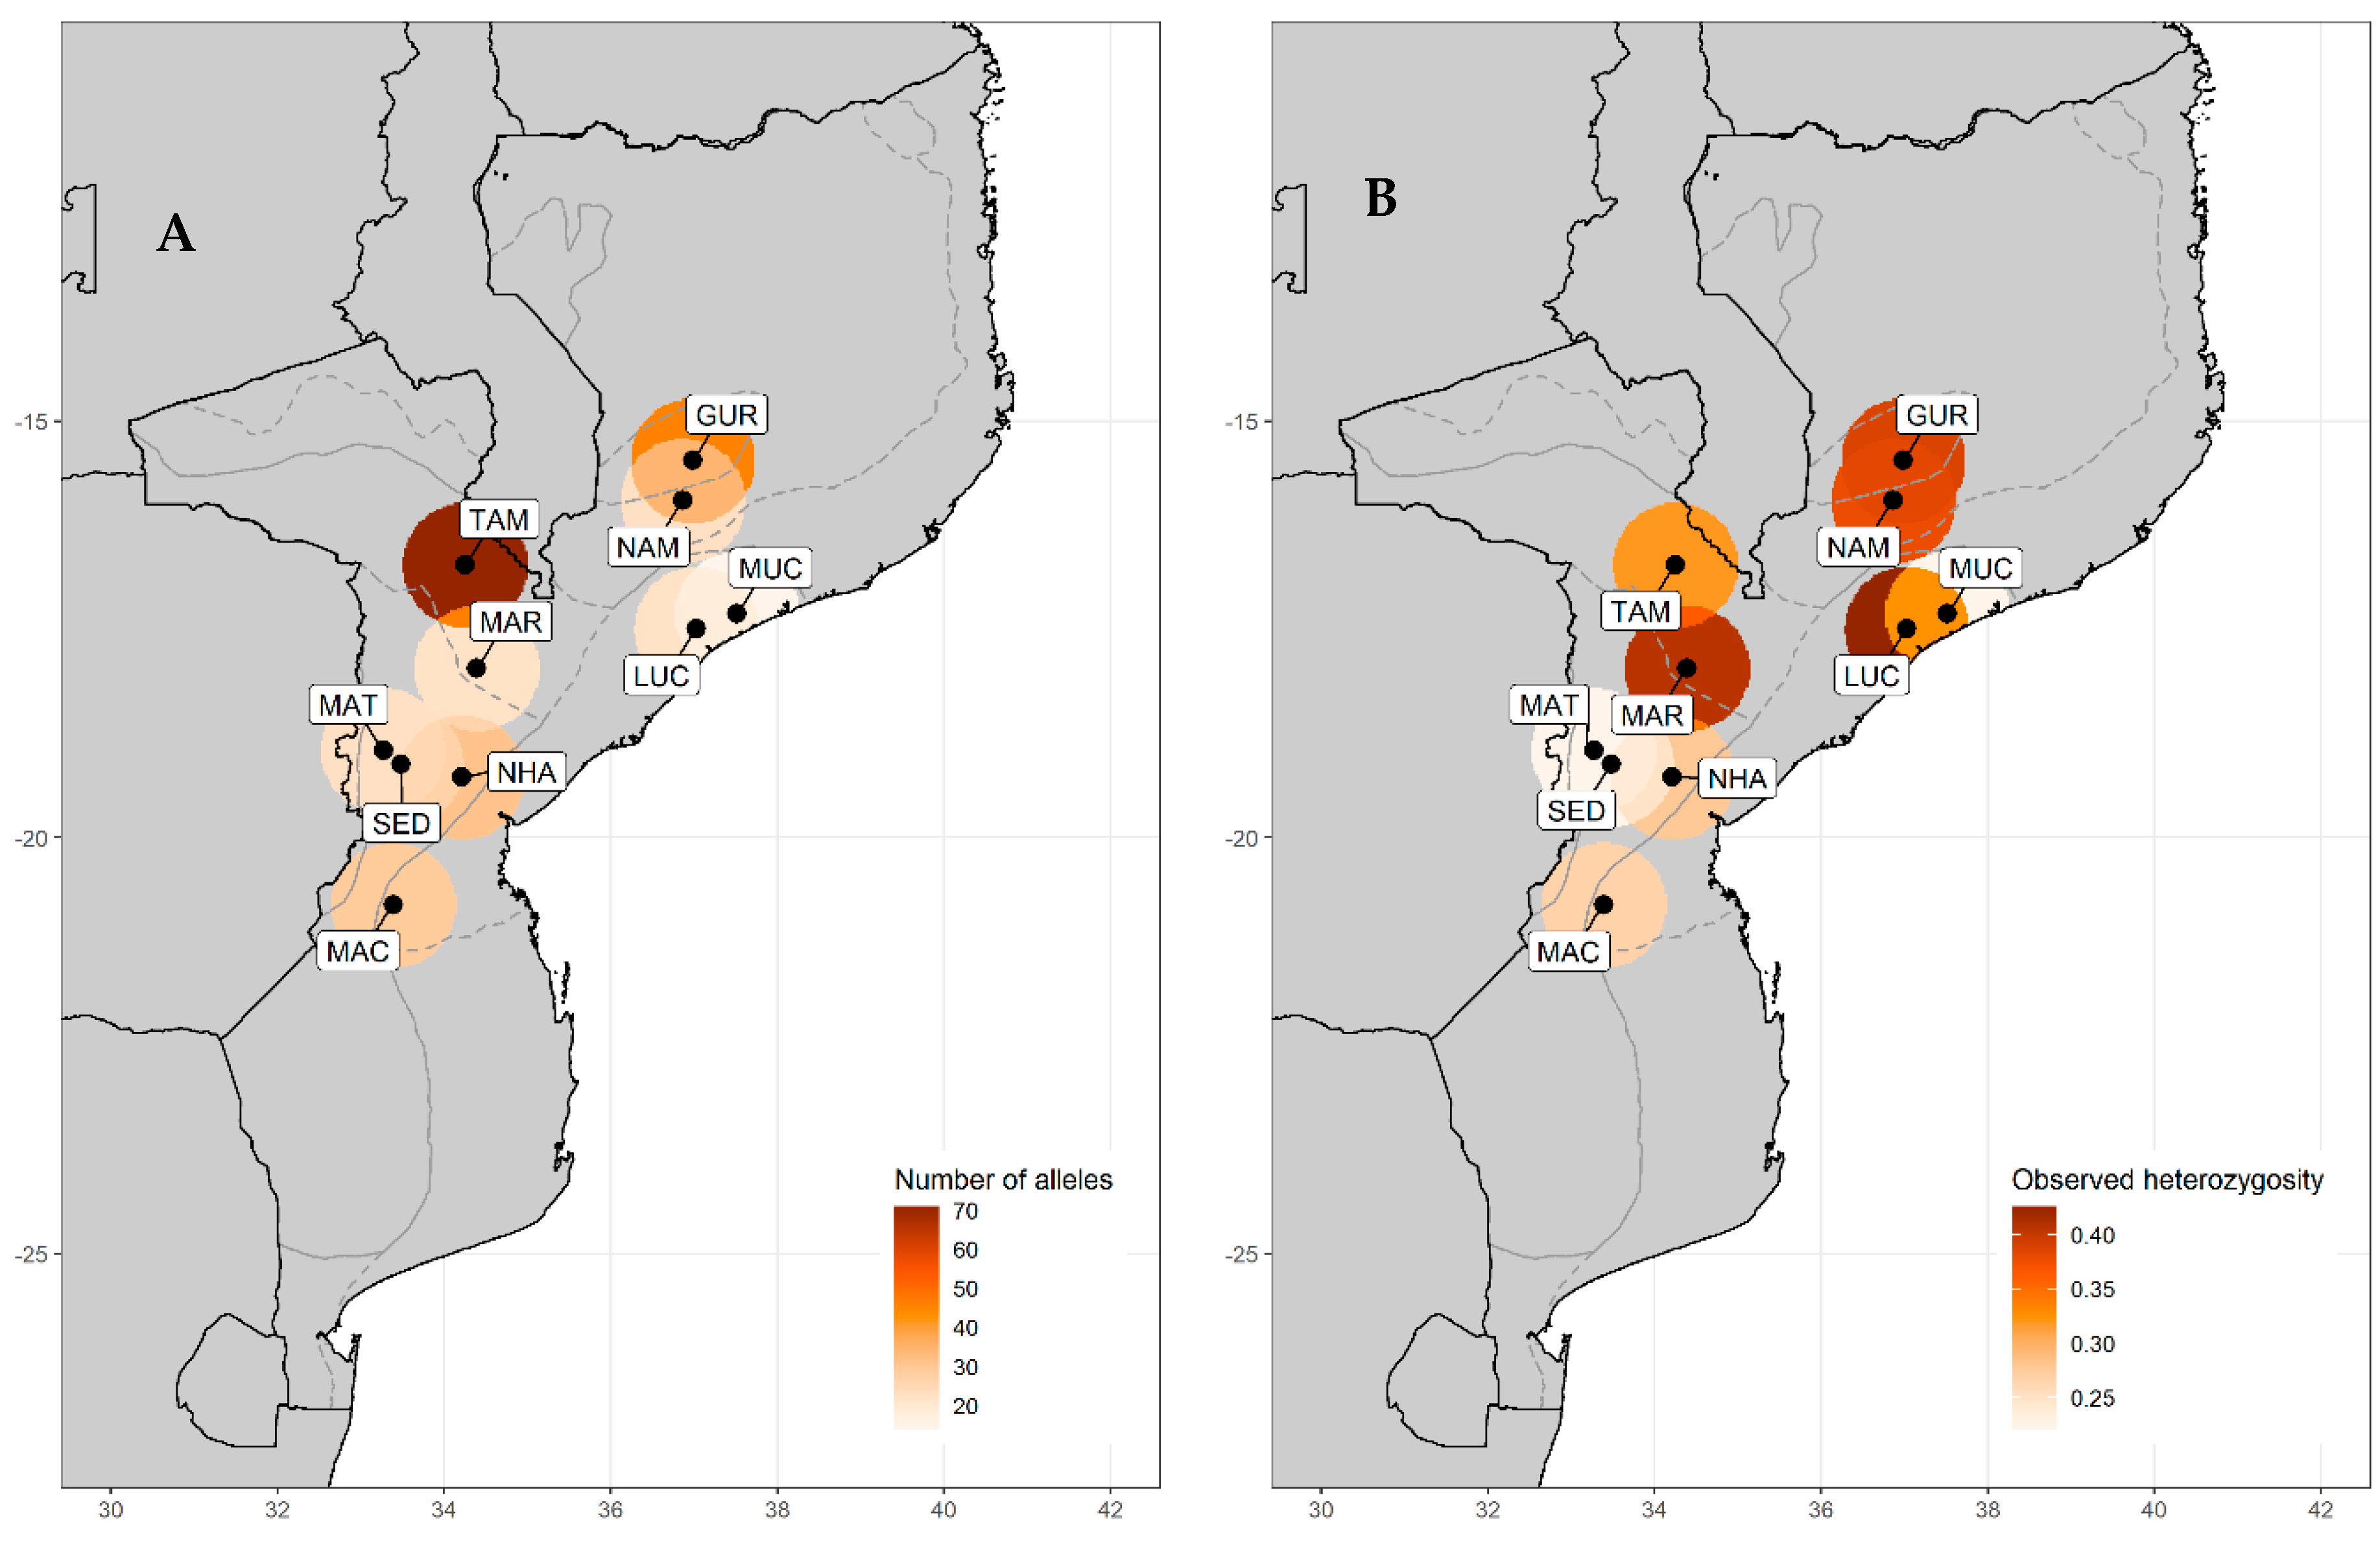
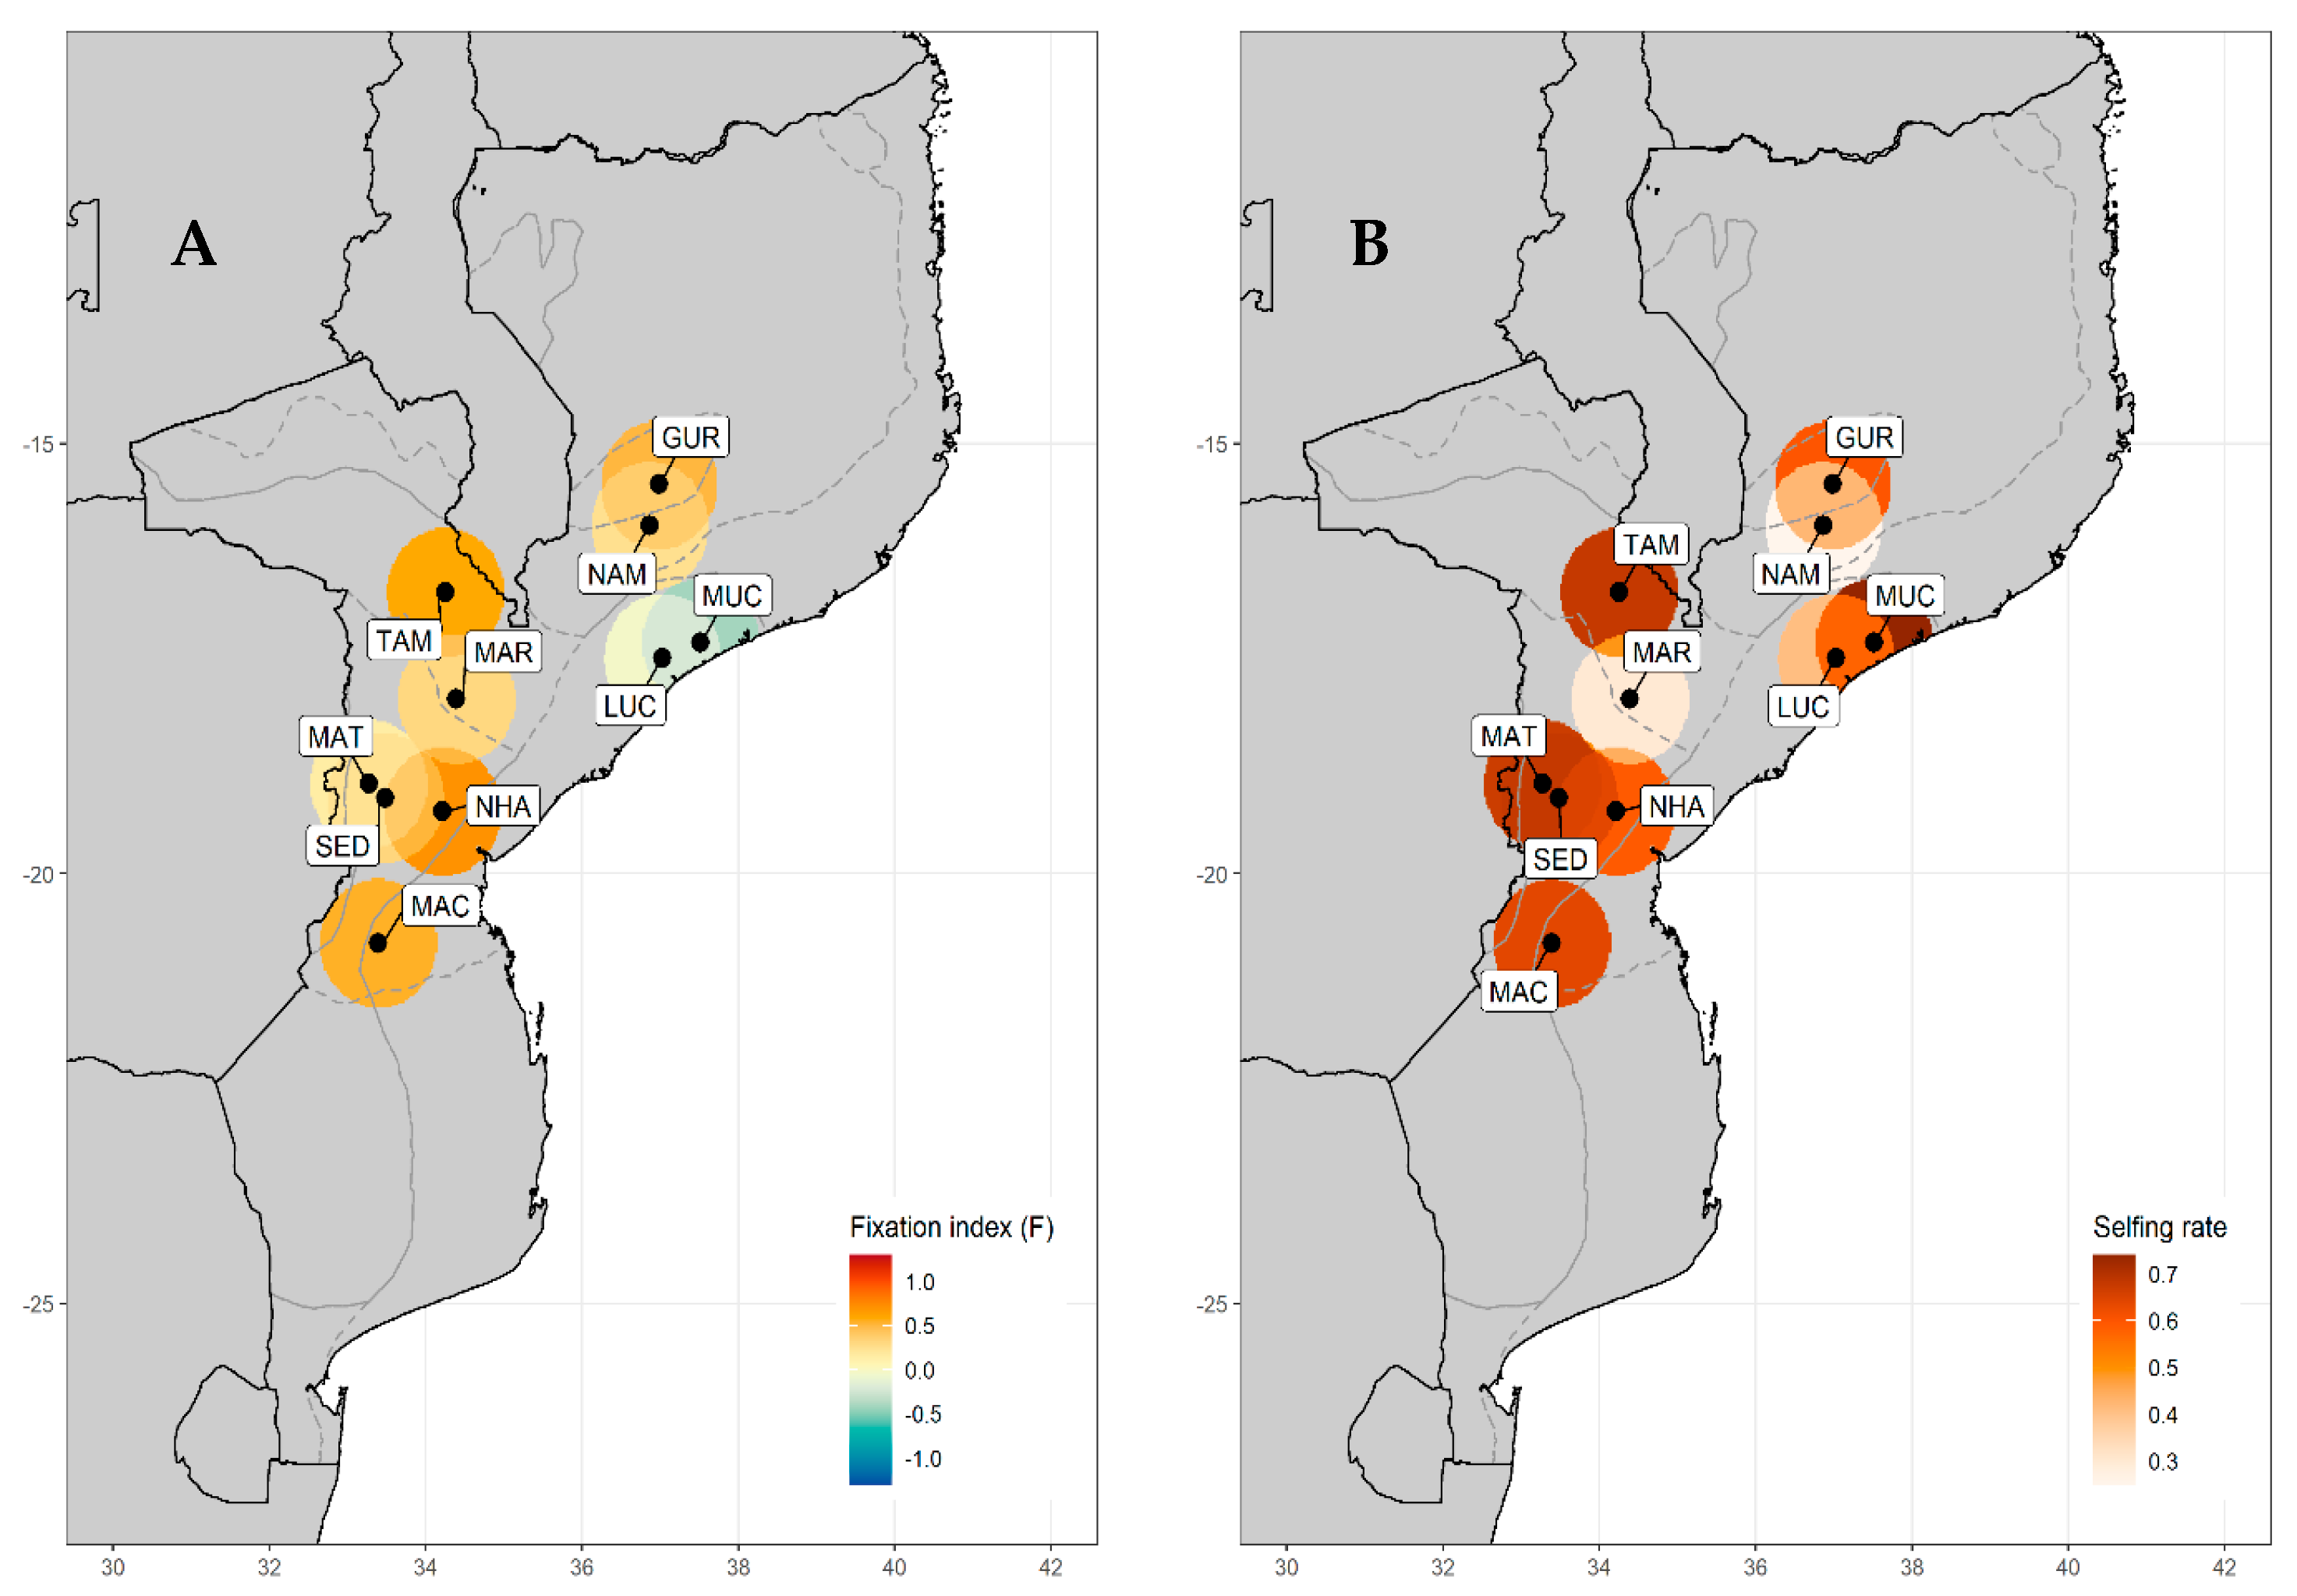
3.1. Genetic Diversity

The total number of alleles varied between 49 in VuUGM74 and 145 in VuUGM40 (Table 1). For each locus, the observed heterozygosity values (Ho) ranged from 0.014 in VuUGM74 to 1 in VuUGM40, and expected heterozygosity (He) varied from 0.016 in VuUGM74 to 0.806 in VuUGM33. FIS values varied between −0.008 and 0.857 (for loci VuUGM68 and VuUGM31, respectively; Table 1) across the loci studied.
A total of 327 alleles were found among the set of V. unguiculata accessions, varying significantly between sites (p < 0.001; Table 2). The number of alleles varied geographically from 14 in the coastal area of Muchela to 71 in the dry western area of Tambara (Figure 2). Allelic richness varied between 1.250 in Muchela and 1.751 in Gurué, with no statistical differences being found between areas (p = 0.452; Table 1). However, the number of private alleles varied significantly across areas (p < 0.001; Table 2), with the highest numbers being found in Gurué, Tambara, and Machaze (Figure 3).
The mean observed heterozygosity varied significantly between 0.222 (Muchela, Sede Nova, and Matsinho) and 0.426 (Lucas Blanco) (p < 0.001; Figure 2), and the mean expected heterozygosity varied between 0.451 (Sede Nova, Matsinho) and 0.688 (Gurué) without statistically significant differences (p = 0.481; Table 2). FIS values varied significantly between sites (p < 0.001; Table 2), ranging from negative values of −0.412 in the central area of Zambezia to positive values of 0.707 in the central area of Nhamatanda (Figure 4). The rate of self-fertilization in V. unguiculata also varied significantly between sites (p < 0.001; Table 2), with the lowest values found in the northern region of Namarroi (25%) and the highest in the coastal area of Muchela (74%) (Figure 4).
The two cultivars had a low number of alleles (IT-16: 11 and IT-18: 2) and low allelic richness (IT-16: 1.333 and IT-18: 1.222) constrained by the small sampling size. However, although the observed heterozygosity (IT-16: 0.333 and IT-18: 0.222) was higher than expected in both cultivars (IT-16: 0.167 and IT-18: 0.111; p < 0.001 in both cases), it was also lower than that found in most local accessions (Table 2; p < 0.001).
From all landraces sampled, only one was not at HWE (GUR) at the 5% level after the sequential Bonferroni correction (Table S1). Pairwise comparisons between loci revealed no significant linkage disequilibrium at p = 5%, suggesting that alleles are assorted independently at different loci.

3.2. Genetic Structure of V. unguiculata

The Bayesian clustering program STRUCTURE found the highest LnP(D) and ΔK values for K = 4 (Figure S1). The results showed a high degree of admixture between landraces without any specific geographic pattern or clustering when considering the different AEZs (Figure 5). One cluster was predominant and grouped all accessions from North Zambezia and most accessions from Sofala and Central Manica; the second cluster characterized Central and South Zambezia accessions; the third clustered accessions from North Manica as well as Central Sofala; and the fourth cluster was exclusively composed of accessions from South Manica (Figure 5). The two cultivars were assigned to the first cluster, although with signs of admixture with other clusters.
In accordance with these results, the NJ tree separated all the groups assigned by STRUCTURE, revealing again no general correlation with the geographical distribution of accessions (Figure 6). All individuals from R3 and R7 were clustered into two different clades, one with 65% and the other with 34% bootstrap support (BS) value (Figure 6). Most individuals from R6 were clustered in the same group (57% BS), while R4, R5, and R10 were clustered into two different groups. The two cultivars were nested within the landraces, although in two different separated groups.
The PCoA spatially separated the accessions analyzed into three main groups (Figure 7). In accordance with the NJ tree, the accessions from R3 and R7 were separated from the main group: the first being on the upper left of axis 2, accumulating 21.14% of variance, with the second on the lower left of axis 2. All remaining accessions were clustered in a heterogeneous group also containing the two cultivars.

3.3. Genetic Differentiation between Landraces

Overall, genetic differentiation was significantly low (AMOVA FST = 0.199, p < 0.001). The analysis performed over the landraces sampled indicated that only 19.92% of the genetic variation could be attributed to among the AEZs (Table 3). The highest molecular variance was found among genotypes within accessions (47.39%), followed by that found within genotypes (32.69%; p < 0.001; Table 3). Remarkably, a very low molecular variance was found between wild cowpea versus the cultivars (0.12%), most of the variance being found among individuals within samples (65.58%; Table 3).

4. Discussion

Landraces harbor a gene pool of unexplored alleles that constitute a unique set of genetic resources for breeding to improve productivity, nutritional value, adaptation, and resilience to climate change [36,37,38,39]. Given their evolutionary history and adaptation to local conditions, they usually harbor higher genetic diversity and environmental resilience than modern varieties [40,41,42,43]. However, such richness tends to be lost because most of the current intensive agricultural systems are based on few high-input and high-yielding cultivars [44]. Thus, a comprehensive characterization of landraces towards the development of conservation and breeding strategies is among the main clues that will allow us to face the major agricultural challenges related to population growth and environmental risks.
Despite the ongoing agricultural changes in Africa, according to our data, the nine microsatellites employed in this study were highly polymorphic and revealed the existence of high genetic diversity between landraces of V. unguiculata from Mozambique (Table 1 and Table 2). A total of 327 alleles were found among the 59 cowpea accessions, which can be attributed to high genetic heterogeneity (Table 2). Indeed, the genetic diversity values found within the studied Mozambique landraces (Ho: 0.222–0.426; He: 0.451–0.654) were much higher than those reported in other cowpea studies. For instance, high-density single-nucleotide polymorphism (SNP) genotyping using the Cowpea iSelect Consortium Array was used to study the population structure and genetic diversity in a set of 96 worldwide cowpea accessions, and average PIC and He values of 0.25 and 0.31, respectively, were found [45]. Similar results were obtained by [10,12] using 422 cowpea landraces and 768 cowpea genotypes, respectively, collected in 56 countries. A genotyping by sequencing (GBS)study of 298 lines from the mini core collection of 360 landraces maintained at The International Institute of Tropical Agriculture revealed a low number of robust SNP markers with an observed genetic distance of between 0.0096 and 0.462 [11]. The studied accessions of the world cowpea collection maintained at IITA were grouped into three main clusters, agreeing with the groups also reported by [10]. Genetic diversity using SSR markers was also assessed in 105 selected cowpea genotypes from the National Genebank of China at the Institute of Crop Science (ICS), with a low level of genetic diversity found among accessions [46]. Genetic diversity was also reported to be low among cowpea populations collected from Benin Republic [47], Ghana [48], and Sudan [49]. In comparison, in our study, the two commercial cultivars (IT-16 and IT-18) had a very low number of alleles and low heterozygosity values. Cluster analyses (PcoA or NJ tree) showed no clear differentiation between these modern varieties and wild accessions. The pairwise genetic distances reported in other studies have also shown that African landraces are close to wild cowpea samples [11,12]. This suggests that the genetic diversity of these two commercial varieties is still close to that of the wild accessions, although more individuals are needed to accurately determine if genetic erosion is occurring.
Population structure analysis using worldwide cowpea samples usually delineates African landraces into two major gene pools separated by the Congo River basin, the East/South, and West Africa [8,9,10], although nothing has been reported in terms of the cowpea genetic structure within these regions. Our study, focused on Mozambican (East Africa) landraces, found four genetic groups with a high degree of admixture (Figure 5). No specific geographic pattern or clustering was found considering the different AEZs in either the NJ tree or the PcoA (Figure 6 and Figure 7), which supports the presence of gene flow between these regions. The rate of self-fertilization in V. unguiculata varied across landraces (25–74%; Table 2; Figure 4), supporting the possibility of gene flow between individuals. In fact, two landraces (Lucas and Muchela) exhibited negative FIS values, indicating that these landraces are less related than expected under random mating, which could imply fewer homozygotes and consequent crossbreeding. Nonetheless, most of the remaining landraces had low FIS values (0.1–0.3), which indicates that inbreeding might not be prevalent.
The analysis of genetic differentiation indicated that most of the genetic variation was explained by differences among genotypes within landraces (Table 3), which also supports the hypothesis of gene flow. This low genetic differentiation and the absence of a geographical pattern associated with AEZs might be due to crossbreeding between individuals but also to seed exchange by farmers. Seed exchange is a common practice between African farmers of neighboring areas [50] and could explain the specific genetic cluster found in the isolated accessions of South Manica that show no admixture with the remaining ones. It is economical unfeasible for seed companies to distribute small amounts of seeds over long rural distances in Africa, and therefore, certified, commercial seeds do not reach the farmers [51]. In addition, certified seeds are generally expensive, and farmers are unwilling to buy them at a cost twice (or more) that of grain [51]. Nonetheless, continuous recycling of seeds results in poor grain yields [50], highlighting the importance of conserving wild accessions and their seed stock.
The high genetic diversity found in Mozambique in comparison to other world regions reinforces the importance of local landraces to widen the genetic base of modern varieties of cowpea. The results of this study underline the hidden genetic diversity in local landraces, which should be conserved as sublines in genebanks to avoid the expected reduction of genetic diversity with successive regeneration of bulk samples. The high levels of genetic differentiation found within landraces (but not among AEZs) could imply the presence of different phenotypes, which might exhibit desired traits for exploitation in future breeding programs. In fact, according to [5], accessions A55 from R3, A80 from R7, and A116 from R10, which were clustered into different genetic groups (Figure 6), revealed contrasting responses, respectively leading to high sensitivity, mild sensitivity, and high tolerance to drought stress related to the regulation of photosynthesis, C/N metabolism, and antioxidative status [5]. Compared to close relatives and other crops, cowpea is well adapted to semi-arid and arid regions because of its ability to fix nitrogen, but local genotypes still display significantly different levels of tolerance [52,53]. The same plasticity has been observed in response to virus and fungal diseases, with impact in terms of yield losses ranging from 20 to 100% [54]. Such a diverse genetic pool could be used to investigate the genetic basis of tolerance to abiotic and biotic stress.
A priority for in situ, on-farm conservation should be given to the landraces of Gurué, Tambara, and Machaze, which showed a high number of private alleles (Figure 3) and belong to different genetic groups according to STRUCTURE analysis (Figure 5). On-farm conservation allows the concomitant evolution and retention of potentially useful genetic variation needed to maintain crop ability to adapt to changes [55]. However, genetic diversity conserved on the farm is complementary to that found in the genebank, and both systems are required for efficient conservation of cowpea. Thus, further to molecular tools, farmers’ knowledge should be employed to optimize the sampling of sublines within landraces for ex situ conservation. A core germplasm collection should include most of the cowpea’s genetic diversity, for which the results outlined in this study can be used. The results of this work encourage a broad network of on-farm activities that should be enrolled in a socio-economic framework to complement genebank collections. This is also the best way to prevent genetic erosion in the genebank while maintaining and expanding the cultivation of cowpea in a wide range of environmental conditions.

Supplementary Materials

The following are available online at https://www.mdpi.com/2073-4395/10/12/1893/s1, Table S1: Results of the Hardy Weinberg exact tests retrieved by GENEPOP for the sample landraces of Vigna unguiculata. p-value (0.05) associated with the null hypothesis of random union of gametes estimated with a Markov chain algorithm. Figure S1: STRUCTURE analysis of Vigna unguiculata. Above: mean log probability of data LnP(D) over 10 runs for each K value as a function of K (error bars represent standard deviation). Below: Evanno’s ad hoc statistic; DK as a function of K.

Author Contributions

Conceptualization, A.M.F.G., N.N., R.M., J.C.R., I.M., A.I.R.-B.; methodology, A.M.F.G., D.D., P.B.S., P.T., F.S.; software, D.D.; I.M.; validation, A.M.F.G., D.D., P.T., F.S. and I.M.; formal analysis, A.M.F.G., D.D., P.T., F.S. and I.M.; investigation, A.M.F.G., D.D., P.B.S., I.M. and A.I.R.-B.; resources, N.N., P.T., F.S., R.M., J.C.R. and A.I.R.-B.; data curation, D.D., P.T., J.C.R., I.M. and A.I.R.-B.; writing—original draft preparation, A.M.F.G., I.M. and A.I.R.-B.; writing—review and editing, all co-authors; visualization, D.D. and I.M.; supervision, R.M., J.C.R., I.M. and A.I.R.-B.; project administration, R.M., J.C.R. and A.I.R.-B.; funding acquisition, N.N., R.M. and A.I.R.-B. All authors have read and agreed to the published version of the manuscript.

Funding

This research received funds from the Mozambican Fundo Nacional de Investigação (Project 201-Inv-FNI), NUFFIC, the Netherlands (Project NICHE-Moz-151), and Fundação para a Ciência e a Tecnologia, I.P., through the Ph.D. fellowship SFRH/BD/113952/2015 (A.M.F.G.) and the post-doctoral fellowship SFRH/BPD/100384/2014 (D.D), the research units UID/04129/2020 (LEAF), UIDP/04035/2020 (GeoBioTec), and UIDB/00239/2020 (CEF), and the APC.

Conflicts of Interest

The authors declare no conflict of interest.

References

  1. Boukar, O.; Belko, N.; Chamarthi, S.; Togola, A.; Batieno, J.; Owusu, E.; Haruna, M.; Diallo, S.; Umar, M.L.; Olufajo, O.; et al. Cowpea (Vigna unguiculata): Genetics, genomics and breeding. Plant Breed. 2019, 138, 415–424. [Google Scholar] [CrossRef] [Green Version]
  2. Goncalves, A.; Goufo, P.; Barros, A.; Dominguez-Perles, R.; Trindade, H.; Rosa, E.A.; Ferreira, L.; Rodrigues, M. Cowpea (Vigna unguiculata L. Walp), a renewed multipurpose crop for a more sustainable agri-food system: Nutritional advantages and constraints. J. Sci. Food Agric. 2016, 96, 2941–2951. [Google Scholar] [CrossRef] [PubMed]
  3. Jayathilake, C.; Visvanathan, R.; Deen, A.; Bangamuwage, R.; Jayawardana, B.C.; Nammi, S.; Liyanage, R. Cowpea: An overview on its nutritional facts and health benefits. J. Sci. Food Agric. 2018, 98, 4793–4806. [Google Scholar] [CrossRef] [PubMed]
  4. Bado, B.; Bationo, A.; Cescas, M. Assessment of cowpea and groundnut contributions to soil fertility and succeeding sorghum yields in the Guinean savannah zone of Burkina Faso (West Africa). Biol. Fertil. Soils 2006, 43, 171–176. [Google Scholar] [CrossRef]
  5. Gomes, A.M.F.; Nhantumbo, N.; Ferreira-Pinto, M.; Massinga, R.; Ramalho, J.C.; Ribeiro-Barros, A. Breeding Elite Cowpea [Vigna unguiculata (L.) Walp] Varieties for Improved Food Security and Income in Africa: Opportunities and Challenges. In Legume Crops; El-Esawi, M.A., Ed.; IntechOpen: London, UK, 2019; p. 636. [Google Scholar]
  6. FAO. Agro-Ecological Zoning. Guidelines. FAO Soils Bulletin Soil Resources, Management and Conservation Service, FAO Land and Water Development Division; Food and Agriculture Organization of the United Nations: Rome, Italy, 1996; pp. 73–78. ISBN 92-5-103890-2. [Google Scholar]
  7. Goufo, P.; Moutinho-Pereira, J.M.; Jorge, T.F.; Correia, C.M.; Oliveira, M.R.; Rosa, E.A.S.; António, C.; Trindade, H. Cowpea (Vigna unguiculata L. Walp.) metabolomics: Osmoprotection as a physiological strategy for drought stress resistance and improved yield. Front. Plant Sci. 2017, 8, 586. [Google Scholar] [CrossRef] [PubMed] [Green Version]
  8. Gomes, A.M.F.; Rodrigues, A.P.; António, C.; Rodrigues, A.M.; Leitão, A.E.; Batista-Santos, P.; Nhantumbo, N.; Massinga, R.; Ribeiro-Barros, A.I.; Ramalho, J.C. Drought response of cowpea (Vigna unguiculata (L.) Walp.) landraces at leaf physiological and metabolite profile levels. Environ. Exp. Bot. 2020, 175, 104060. [Google Scholar] [CrossRef]
  9. Carvalho, M.; Lino-Neto, T.; Rosa, E.; Carnide, V. Cowpea: A legume crop for a challenging environment. J. Sci. Food Agric. 2017, 97, 4273–4284. [Google Scholar] [CrossRef]
  10. Xiong, H.; Shi, A.; Mou, B.; Qin, J.; Motes, D.; Lu, W.; Ma, J.; Weng, Y.; Yang, W.; Wu, D. Genetic diversity and population structure of cowpea (Vigna unguiculata L. Walp). PLoS ONE 2016, 11, e0160941. [Google Scholar] [CrossRef] [Green Version]
  11. Fatokun, C.; Girma, G.; Abberton, M.; Gedil, M.; Unachukwu, N.; Oyatomi, O.; Yusuf, M.; Rabbi, I.; Boukar, O. Genetic diversity and population structure of a mini-core subset from the world cowpea (Vigna unguiculata (L.) Walp.) germplasm collection. Sci. Rep. 2018, 8, 16035. [Google Scholar] [CrossRef] [Green Version]
  12. Huynh, B.; Close, T.J.; Roberts, P.A.; Hu, Z.; Wanamaker, S.; Lucas, M.R.; Chiulele, R.; Cissé, N.; David, A.; Hearne, S.; et al. Gene pools and the genetic architecture of domesticated cowpea. Plant Genome 2013, 6, 1–8. [Google Scholar] [CrossRef] [Green Version]
  13. Fang, J.; Chao, C.T.; Roberts, P.A.; Ehlers, J.D. Genetic diversity of cowpea [Vigna unguiculata (L.) Walp.] in four West African and USA breeding programs as determined by AFLP analysis. Genet. Resour. Crop Evol. 2007, 54, 1197–1209. [Google Scholar] [CrossRef]
  14. Mahalakshmi, V.; Ng, Q.; Lawson, M.; Ortiz, R. Cowpea [Vigna unguiculata (L.) Walp.] core collection defined by geographical, agronomical and botanical descriptors. Plant Genet. Resour. 2007, 5, 113–119. [Google Scholar] [CrossRef] [Green Version]
  15. Ehlers, J.D.; Hall, A.E. Cowpea (Vigna unguiculata (L.) Walp.). Field Crops Res. 1997, 53, 187–204. [Google Scholar] [CrossRef]
  16. Ficiciyan, A.; Loos, J.; Sievers-Glotzbach, S.; Tscharntke, T. More than yield: Ecosystem services of traditional versus modern crop varieties revisited. Sustainability 2018, 10, 2834. [Google Scholar] [CrossRef] [Green Version]
  17. De Luca, D.; Cennamo, P.; Del Guacchio, E.; Di Novella, R.; Caputo, P. Conservation and genetic characterisation of common bean landraces from Cilento region (southern Italy): High differentiation in spite of low genetic diversity. Genetica 2018, 146, 29–44. [Google Scholar] [CrossRef]
  18. Alipour, H.; Bihamta, M.R.; Mohammadi, V.; Peyghambari, S.A.; Bai, G.; Zhang, G. Genotyping-by-sequencing (GBS) revealed molecular genetic diversity of Iranian wheat landraces and cultivars. Front. Plant Sci. 2017, 8, 1293. [Google Scholar] [CrossRef]
  19. Ram, S.G.; Thiruvengadam, V.; Vinod, K.K. Genetic diversity among cultivars, landraces and wild relatives of rice as revealed by microsatellite markers. J. Appl. Genet. 2007, 48, 337–345. [Google Scholar] [CrossRef]
  20. Hagenblad, J.; Zie, J.; Leino, M.W. Exploring the population genetics of genebank and historical landrace varieties. Genet. Resour. Crop Evol. 2012, 59, 1185–1199. [Google Scholar] [CrossRef]
  21. Ministry of Agriculture and Fisheries (MAF). Agroecological zones and production systems. In Working Document 2/B, Program of Investment in Agricultural Extension, Process of the Formulation of Proagri; Ministry of Agriculture and Fisheries: Maputo, Mozambique, 1996; p. 72. [Google Scholar]
  22. Gupta, S.K.; Gopalakrishna, T. Development of unigene-derived SSR markers in cowpea (Vigna unguiculata) and their transferability to other Vigna species. Genome 2010, 53, 508–523. [Google Scholar] [CrossRef]
  23. Goudet, J. FSTAT, a Program to Estimate and Test Gene Diversities and Fixation Indices (Version 2.9.3.2). 2002. Available online: http://www.unil.ch/izea/softwares/fstat (accessed on 3 November 2019).
  24. Peakall, R.; Smouse, P.E. GenAlEx 6 genetic analysis in Excel. Population genetic software for teaching and research. Mol. Ecol. Notes 2006, 6, 288–295. [Google Scholar] [CrossRef]
  25. Ritland, K. Inferences about inbreeding depression based on changes of the inbreeding coefficient. Evolution 1990, 44, 1230–1241. [Google Scholar] [CrossRef] [PubMed]
  26. Raymond, M.; Rousset, F. GENEPOP (version 1.2): Population genetics software for exact tests and ecumenicism. J. Hered. 1995, 86, 248–249. [Google Scholar] [CrossRef]
  27. Rousset, F. Genepop’007: A complete reimplementation of the Genepop software for Windows and Linux. Mol. Ecol. Resour. 2008, 8, 103–106. [Google Scholar] [CrossRef] [PubMed]
  28. Rice, W.R. Analyzing tables of statistical tests. Evolution 1989, 43, 223–225. [Google Scholar] [CrossRef]
  29. Pritchard, J.K.; Stephens, M.; Rosenberg, N.A.; Donnelly, P. Association mapping in structured populations. Am. J. Hum. Genet. 2000, 67, 170–181. [Google Scholar] [CrossRef] [PubMed] [Green Version]
  30. Earl, D.A.; von Holdt, B.M. STRUCTURE HARVESTER: A website and program for visualizing STRUCTURE output and implementing the Evanno method. Conserv. Genet. Resour. 2012, 4, 359–361. [Google Scholar] [CrossRef]
  31. Evanno, G.; Regnaut, S.; Goudet, J. Detecting the number of clusters of individuals using the software structure: A simulation study. Mol. Ecol. 2005, 8, 2611–2620. [Google Scholar] [CrossRef] [Green Version]
  32. Jakobsson, M.; Rosenberg, N.A. CLUMPP: A cluster matching and permutation program for dealing with label switching and multimodality in analysis of population structure. Bioinformatics 2007, 23, 1801–1806. [Google Scholar] [CrossRef] [Green Version]
  33. Langella, O. Populations 1.2.30. Laboratoire Populations. Genetique et Evolution. Centre National de la Recherche Scientifique; CNRS UPR9034: Gif Sur Yvette, France, 2007; Available online: http://bioinformatics.org/populations/ (accessed on 3 November 2019).
  34. Nei, M.; Tajima, F.; Tateno, Y. Accuracy of estimated phylogenetic trees from molecular data. II. Gene frequency data. J. Mol. Evol. 1983, 19, 153–170. [Google Scholar] [CrossRef]
  35. Excoffier, L.; Laval, G.; Schneider, S. ARLEQUIN, Ver 3.0. An integrated software package for population genetic data analysis. Evol. Bionf. Online 1983, 1, 47–50. [Google Scholar]
  36. Lopes, M.S.; El-Basyoni, I.; Baenziger, P.S.; Singh, S.; Royo, C.; Ozbek, K.; Aktas, H.; Ozer, E.; Ozdemir, F.; Manickavelu, A.; et al. Exploiting genetic diversity from landraces in wheat breeding for adaptation to climate change. J. Exp. Bot. 2015, 66, 3477–3486. [Google Scholar] [CrossRef] [PubMed]
  37. Dwivedi, S.L.; Ceccarelli, S.; Blair, M.W.; Upadhyaya, H.D.; Are, A.K.; Ortiz, R. Landrace germplasm for improving yield and abiotic stress adaptation. Trends Plant Sci. 2016, 21, 31–42. [Google Scholar] [CrossRef] [PubMed]
  38. Monteagudo, A.; Casas, A.M.; Cantalapiedra, C.P.; Contreras-Moreira, B.; Gracia, M.P.; Igartua, E. Harnessing novel diversity from landraces to improve an elite barley variety. Front. Plant Sci. 2019, 10, 434. [Google Scholar] [CrossRef] [PubMed]
  39. Hour, A.; Hsieh, W.; Chang, S.; Wu, Y.; Chin, H.; Lin, Y. Genetic diversity of landraces and improved varieties of rice (Oryza sativa L.) in Taiwan. Rice 2020. [Google Scholar] [CrossRef]
  40. Ganeva, G.M.; Korzun, V.; Landjeva, S.; Popova, Z.; Christov, N.K. Genetic diversity assessment of Bulgarian durum wheat (Triticum durum Desf.) landraces and modern cultivars using microsatellite markers. Genet. Resour. Crop Evol. 2010, 57, 273–285. [Google Scholar] [CrossRef]
  41. Kumbhar, S.D.; Kulwal, P.L.; Patil, J.V.; Sarawate, C.D.; Gaikwad, A.P.; Jadhav, A.S. Genetic diversity and population structure in landraces and improved rice varieties from India. Rice Sci. 2015, 22, 99–107. [Google Scholar] [CrossRef] [Green Version]
  42. Soriano, J.M.; Villegas, D.; Aranzana, M.J.; García del Moral, L.F.; Royo, C. Genetic structure of modern durum wheat cultivars and Mediterranean landraces matches with their agronomic performance. PLoS ONE 2016, 11, e0160983. [Google Scholar] [CrossRef] [PubMed] [Green Version]
  43. Pascual, L.; Ruiz, M.; López-Fernández, M.; Pérez-Peña, H.; Benavente, H.; Vázquez, J.F.; Sansaloni, C.; Giraldo, P. Genomic analysis of Spanish wheat landraces reveals their variability and potential for breeding. BMC Genom. 2020, 21, 122. [Google Scholar] [CrossRef] [Green Version]
  44. FAO/IPGRI. Review and Development of Indicators for Genetic Diversity, Genetic Erosion and Genetic Vulnerability (GDEV): Summary Report of a Joint FAO/IPGRI Workshop; FAO/IPGRI: Rome, Italy, 2002. [Google Scholar]
  45. Carvalho, M.; Muñoz-Amatriaín, M.; Castro, I.; Lino-Neto, T.; Matos, M.; Egea-Cortines, M.; Rosa, E.; Close, T.; Carnide, V. Genetic diversity and structure of Iberian Peninsula cowpeas compared to world-wide cowpea accessions using high density SNP markers. BMC Genom. 2017, 18, 891. [Google Scholar] [CrossRef] [Green Version]
  46. Chen, H.; Chen, H.; Hu, L.; Wang, L.; Wang, S.; Wang, M.L.; Cheng, X. Genetic diversity and a population structure analysis of accessions in the Chinese cowpea [Vigna unguiculata (L.) Walp.] germplasm collection. Crop J. 2017, 5, 363–372. [Google Scholar] [CrossRef]
  47. Zannouou, A.; Kossou, D.K.; Ahanchede, A.; Zoundjihékpon, J.; Agbicodo, E.; Struik, P.C.; Sanni, A. Genetic variability of cultivated cowpea in Benin assessed by random amplified polymorphic DNA. Afr. J. Biotechnol. 2008, 7, 24. [Google Scholar]
  48. Egbadzor, K.F.; Danquah, E.Y.; Ofori, K.; Yeboah, M.; Offei, S.K. Diversity in 118 cowpea (Vigna unguiculata (L.) Walp.) accessions assessed with 16 morphological traits. Int. J. Plant Breed. Genet. 2014, 8, 35–43. [Google Scholar] [CrossRef] [Green Version]
  49. Ali, Z.B.; Yao, K.N.; Odeny, D.A.; Kyalo, M.; Skilton, R.; Eltahir, I.M. Assessing the genetic diversity of cowpea (Vigna unguiculata (L.) Walp.) accessions from Sudan using simple sequence repeat (SSR)markers. Afr. J. Plant Sci. 2015, 9, 293–304. [Google Scholar] [CrossRef]
  50. Njonjo, M.W.; Muthomi, J.W.; Mwang’ombe, A.W. Production practices, postharvest handling, and quality of cowpea seed used by farmers in Makueni and Taita Taveta counties in Kenya. Int. J. Agron. 2019. [Google Scholar] [CrossRef] [Green Version]
  51. Kimani, P.; Kamundia, D.K.; Narla, R.D.; Mwang’ombe, A.W. An integrated seed delivery system and seed research in Kenya: Case studies of pigeon pea, onion and dry bean. In Seed Systems, Science, and Policy in East and Central Africa; Francis, J.A., Ed.; CTA: The Hague, The Netherlands, 2014; pp. 73–88. [Google Scholar]
  52. Hall, A. Breeding for adaptation to drought and heat in cowpea. Eur. J. Agron. 2004, 21, 447–454. [Google Scholar] [CrossRef]
  53. Muchero, W.; Ehlers, J.D.; Roberts, P.A. Seedling stage drought-induced phenotypes and drought-responsive genes in diverse cowpea genotypes. Crop Sci. 2008, 48, 541–552. [Google Scholar] [CrossRef]
  54. Mbeyagala, E.K.; Mukasa, B.S.; Tukamuhabwa, P.; Bisikwa, J. Evaluation of cowpea genotypes for virus resistance under natural conditions in Uganda. J. Agric. Sci. 2014, 6, 176–187. [Google Scholar] [CrossRef] [Green Version]
  55. Bellon, M.R.; van Etten, J. Climate change and on-farm conservation of crop landraces in centres of diversity In Plant Genetic Resources and Climate Change; CABI Publishing: Egham, UK, 2014; pp. 137–150. [Google Scholar]
Figure 1. (a): Location of Mozambique in East Africa. (b): Dots indicate the studied landraces of Vigna unguiculata among the different eco-geographical zones (AEZs) existing in the country, based on [21]. Landraces code: Gurué (GUR), Namarroi (NAM), Muchela (MUC), Lucas Branco (LUC), Nhamatanda (NHA), Maringué (MAR), Tambara (TAM), Sede nova (SED), Matsinho (MAT), and Machaze (MAC).
Agronomy 10 01893 g001
Figure 2. Map of the number of alleles (A) and observed heterozygosity (B) in 30 s (1 km) grid cells applying a 1-degree circular neighborhood. Dashed lines indicate the borders of agro-ecological zones [16].
Agronomy 10 01893 g002
Figure 3. Population structure of Vigna unguiculata based on nine SSRs and using the best assignment result retrieved by STRUCTURE (K = 4). Each individual sample is represented by a thin vertical line divided into K colored segments that represent the individual’s estimated membership fractions in the K cluster. Distribution of private alleles among the different landraces of Vigna unguiculata. Landraces code follows Table 2. The two cultivars are also indicated.
Agronomy 10 01893 g003
Figure 4. Map of the fixation index (A) and selfing rate (B) in 30 s (1 km) grid cells applying a 1-degree circular neighborhood. Dashed lines indicate the borders of agro-ecological zones [16].
Agronomy 10 01893 g004
Figure 5. Population structure of Vigna unguiculata based on nine SSRs and using the best assignment result retrieved by STRUCTURE (K = 4). Each individual sample is represented by a thin vertical line divided into K colored segments that represent the individual’s estimated membership fractions in the K clusters. Landraces and provinces are indicated below. AEZs are indicated in individual labels with different colors for better visualization. The two cultivars are also indicated.
Agronomy 10 01893 g005
Figure 6. Unrooted neighbor-joining (NJ) tree of the studied Vigna unguiculata accessions, including the two cultivars, based on Nei’s Da genetic distance. Numbers associated with branches indicate bootstrap values (BS) based on 1000 replications. Only BS values above 30 are shown. The colors of branches indicate the four genetic groups found in STRUCTURE. AEZs are indicated in branch labels with different colors, following Figure 3.
Agronomy 10 01893 g006
Figure 7. Principal Coordinate analysis (PCoA) of the studied Vigna unguiculata landraces using the scored nSSRs markers. Percentage of explained variance of each axis is given in parentheses. Population symbols and colors are shown in the chart. Colors of symbols indicate the four genetic groups found in STRUCTURE.
Agronomy 10 01893 g007
Table 1. Characteristics and genetic diversity statistics of the nuclear single sequence repeat (nSSR) primers used in the genetic study of Vigna unguiculata. For each locus, the total number of alleles (Na), mean expected heterozygosity (He), mean observed heterozygosity (Ho), and fixation index (FIS) obtained from the 61 studied samples are shown.
Primer NamePrimer Sequence 5′-3′NaHoHeFIS
VuUGM33F: AAAGGTGGGGGATTATGAGG830.9070.806−0.091
R: TGTCCAATCCTGATGGATGA
VuUGM71F: TTCACAACCTGTCCACCTCA1250.1430.5480.783
R: GGCGTCCCAACAGATAAGAA
VuUGM05F: GCGGGATTCTATTCCAGTGA820.1740.6170.767
R: TCCATTGGGTTTCTCAACCT
VuUGM39F: CGAAAAAGCATGATCAACCA970.1490.7490.851
R: CCCCTTTCGCTAAAATTTCC
VuUGM22F: CAATCACCATTCACCAAACA1120.1810.6290.749
R: TATTGGGACTCAGGTCTTGG
VuUGM31F: TGGTTCACTTCCCATATTGTC1220.1360.7110.857
R: AGGCAGAGACGAAGGAGTGA
VuUGM40F: TTCTACATGGTTTTGGGGTCA1451.0030.671−0.426
R: GAGCTTGCCCTCAAGAATTG
VuUGM68F: TGATTGATGGTGGTGTAGCC590.4150.397−0.008
R: GCACTTCACTCATCGTTGCT
VuUGM74F: GCCTCCTCTCACAAACTTGC490.0140.0160.018
Table 2. Genetic diversity within the cowpea genotypes studied. The agro-ecological zone (AEZ), number of samples analyzed (N), total number of alleles (NA), mean allelic richness (AR), mean observed heterozygosity (Ho) and expected heterozygosity (He), inbreeding coefficient (FIS), and selfing rate (s) as a percentage are shown for each landrace.
Landrace IdentityProvinceAEZNNAARHoHeFISs
Gurué (GUR)North Zambezia R106461.7510.3890.6880.50660%
Namarroi (NAM)North ZambeziaR74231.5340.3790.4540.25025%
Muchela (MUC)Central ZambeziaR74141.2500.2220.535−0.41274%
Lucas Branco (LUC)South ZambeziaR74221.4320.4260.577−0.03241%
Nhamatanda (NHA)Central SofalaR44311.6820.2780.4790.70759%
Maringué (MAR)Central SofalaR53221.5030.4070.4940.31030%
Tambara (TAM)North ManicaR623711.6120.3200.6540.59268%
Sede nova (SED)North ManicaR63231.5620.2220.4510.32369%
Matsinho (MAT)Central ManicaR43231.5770.2220.4510.15667%
Machaze (MAC)South Manica R35291.5550.2670.5000.54964%
IT-16Commercial cultivarR41121.3330.3330.167-
IT-18Commercial cultivarR61111.2220.2220.111-
Table 3. Analysis of molecular variance (AMOVA) for the sampled landraces of Vigna unguiculata.
Source of VarianceDegrees of FreedomSum of Squares% of Variance
Among landraces
Among AEZs677.61219.92
Among genotypes within landraces54207.10947.39
Within genotypes6160.00132.69
Among cowpea accessions vs. cultivars
Among accessions14.7720.12
Among accessions 58279.94965.58
Within accessions6160.00034.30
Publisher’s Note: MDPI stays neutral with regard to jurisdictional claims in published maps and institutional affiliations.

