Article

Carbon Footprint and Life-Cycle Costs of Maize Production in Conventional and Non-Inversion Tillage Systems

by
Małgorzata Holka
* and
Jerzy Bieńkowski
Institute for Agricultural and Forest Environment, Polish Academy of Sciences, Bukowska 19, 60-809 Poznan, Poland
*
Author to whom correspondence should be addressed.
Agronomy 2020, 10(12), 1877; https://doi.org/10.3390/agronomy10121877
Submission received: 5 November 2020 / Revised: 20 November 2020 / Accepted: 25 November 2020 / Published: 27 November 2020

Abstract

:
Given the problem of climate change and the requirements laid down by the European Union in the field of gradual decarbonization of production, it is necessary to implement solutions of reducing greenhouse gas (GHG) emissions into agricultural practice. This research paper aimed to evaluate the carbon footprint and life-cycle costs of grain maize production in various tillage systems. The material for the analyses was data from 2015–2017 collected on 15 farms located in the Wielkopolska region (Poland) and growing maize for grain in three tillage systems: conventional, reduced, and no-tillage. The life-cycle assessment and life-cycle costing methodologies were applied to assess the GHG emissions and costs associated with the grain maize production in the stages from “cradle-to-farm gate”, i.e., from obtaining raw materials and producing means for agricultural production, through the processes of maize cultivation to grain harvesting. The calculated values of the carbon footprint indicator for maize production in conventional, reduced, and no-tillage systems were 2347.4, 2353.4, and 1868.7 CO2 eq. ha−1, respectively. The largest source of GHG emissions was the use of nitrogen fertilizers. Non-inversion tillage with cover crops and leaving a large amount of crop residues in the field increased the sequestration of organic carbon and contributed to a significant reduction of the carbon footprint in maize production. The conventional tillage system demonstrated the highest overall life-cycle costs per hectare.

1. Introduction

The use of specialized machinery, mineral fertilizers, and plant protection products allows for intensive production and high yields in various tillage systems but can also have a negative impact on the environment. Using industrial means of agricultural production contributes to the consumption of non-renewable resources and the release of harmful substances to water, soil, and air [1,2]. Agriculture’s contribution to greenhouse gas (GHG) emissions, such as release of nitrous oxide (N2O), methane (CH4), and carbon dioxide (CO2), amounts to an average of 9.8% of total GHG emission in countries of the European Union (EU) [3]. In Poland, crop production is a source of approximately 33% of total GHG emission from agriculture [4]. It is assumed that the increase in the Earth’s global mean surface temperature is partly caused by an anthropogenic increase in the concentration of GHG in the atmosphere which leads to enhanced greenhouse effect [5]. The EU has been taking actions designed to reduce GHG emissions. In the European Council conclusions of 2014, it was assumed that by 2030, in the EU sectors not covered by the EU Emissions Trading System (the so-called non-ETS) such as agriculture, GHG emissions are to be reduced by 30% compared to their 2005 level [6]. The reduction target for Poland for 2030 is −7% compared to the emissions from non-ETS sectors in 2005 [7].
Maize (Zea mays L.) is one of the most important crops. It ranks first in the world production of cereals and second, right after wheat, in terms of the cereal crops area [8]. In Poland, the acreage of its cultivation is above 1.2 million ha, of which 645 thousand ha is grain production [9]. Maize has the highest yield per hectare and the highest grain energy value among cereals. It is used in animal nutrition and in the food industry, mainly for the production of flour, porridges and corn starch [10]. Despite the fact that this species has low requirements when it comes to soil and forecrop, it has a relatively high demand for water and nutrients [11]. The cultivation of maize is mainly carried out in the conventional tillage system based on ploughing. However, due to costs, natural conditions, and environmental protection, modern maize production technologies more and more often use non-inversion systems. Usually, it is reduced tillage with the use of various machines for shallow soil cultivation replacing a plough. It is also possible, although less popular, to use the no-tillage system in which the seeds are sown with a specialist seed drill into uncultivated soil [12,13]. For the protection of the soil and the environment, it is particularly important to use the non-inversion tillage technology and leave at least 30% of plant residues on the field, which is known as conservation tillage [14].
GHG emissions are generated in the life cycle of an agricultural product starting from the processes of extracting raw materials and producing means for agricultural production, through agricultural production, to the use of products and waste management [15,16]. Life-cycle emissions can be assessed using the carbon footprint (CF) method [17,18]. In recent years, the CF indicator has become popular due to its applicability to actions aimed at reducing GHG emissions in various areas [19,20,21]. In identifying the most important sources of GHG emissions in the maize production chain, life-cycle assessment (LCA) is a useful tool to work towards solutions aimed at reducing emissions in crop production. The need for research in this area also includes understanding the size and differentiation of emissions between the applied tillage systems. Moreover, an important aspect for developing more sustainable crop production systems are life-cycle and environmental costs ignored in most previous studies on the LCA of maize production.
In Polish agriculture, non-inversion tillage systems have recently been used more widely, mainly due to technological simplification. At the same time, literature studies in Europe and around the world prove that non-inversion tillage may reduce the environmental impacts of crop production processes [22,23]. There is a need to pay attention to the more regional differentiation of LCA of agricultural activities. This approach is important since a low-emission Green Deal policy requires mitigating measures in agriculture and combating climate change [24,25]. One of the important responses to environmental policies is using non-inversion tillage systems. The undertaking of this research in the Wielkopolska region is justified—first, due to the great importance of this region in agricultural production in Poland; second, in terms of the area of grain maize cultivation, Poland ranks 5th in Europe [26]. The Wielkopolska region has a significant share in agricultural production, including the production of grain maize. This region has the largest area of grain maize cultivation among all regions in Poland, which accounts for 21% of the total national area of grain maize sown [27]. From the point of view of sustainable development, measures to reduce GHG emissions are insufficient. The prospect of a wide application of cultivation simplifications requires comparison with the conventional system with regard to the costs and expected environmental benefits. Regional differentiation of production conditions in Europe makes it necessary to refer to the research results obtained in different environmental conditions and the level of intensity of agricultural production. Therefore, the research fills the gap in maize LCA research in Europe. The results must be supported by the second dimension of the analysis which is an economic evaluation. The basic feature of the implementation of sustainable development should be the reduction of the environmental impact accompanied by reducing production costs. A complementary method suitable to the LCA is the life-cycle costing (LCC) method [28]. LCC is considered an important analytical tool for linkage tracking between potential environmental impacts and incurred costs of the given processes. The research aimed to evaluate the carbon footprint and life-cycle costs of grain maize production in conventional, reduced, and no-tillage systems.

2. Materials and Methods

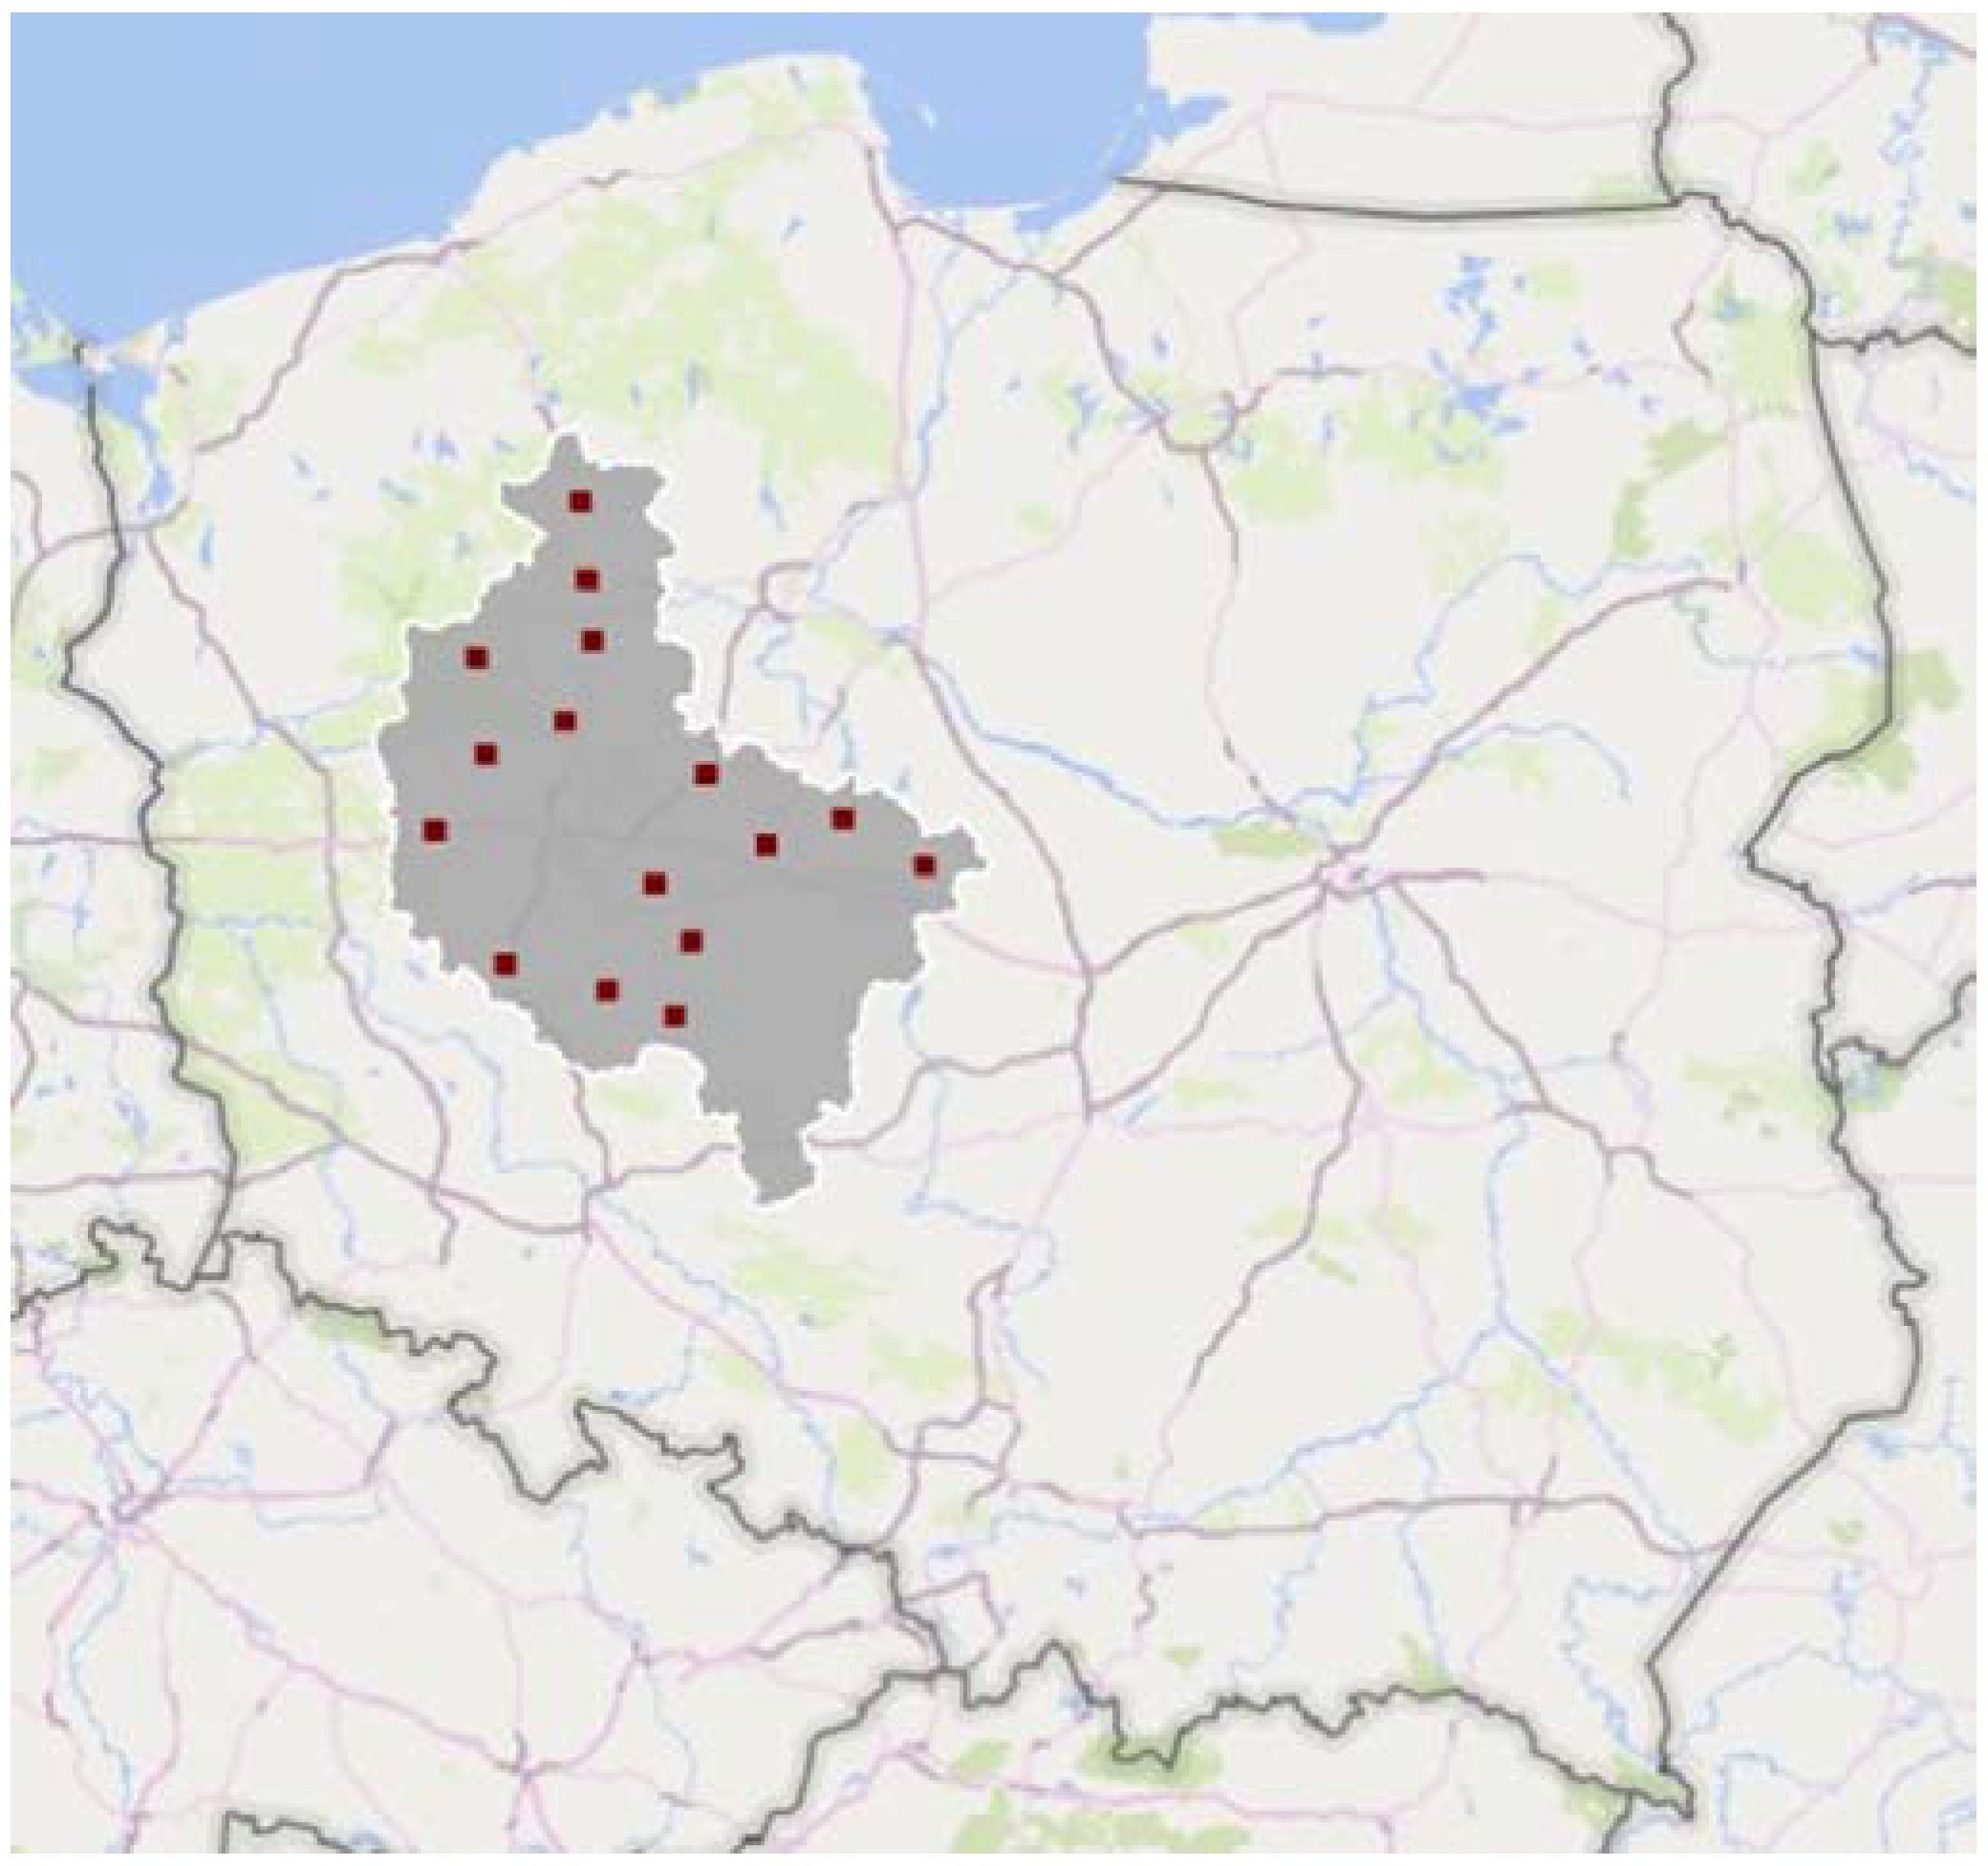
2.1. Data Collection

The material for the analyses was data on grain maize production from 2015–2017 collected using the face-to-face interview method. The interviews were conducted on 15 agricultural farms located at 51°–53°N and 16°–18°W in the Wielkopolska region, Poland (Figure 1). The selected farms produce grain maize and use an appropriate tillage system, i.e., conventional tillage (post-harvest tillage with ploughing to a depth of 25–30 cm, seedbed preparation and sowing), reduced tillage (post-harvest tillage to a depth of 10–20 cm, seedbed preparation and sowing) or no-tillage (sowing directly into the untilled soil) (Figure 2). Each tillage system was represented by five farms. The characteristics of the studied farms are presented in Table 1.
The scope of the data collected from farms regarding the technology of grain maize production included the type of agrotechnical treatments together with their duration, agricultural equipment (type of machine, total machine weight, work time spent for the cultivation of the crop, lifetime of machines and tractors used), human labor inputs, quantity and cost of production means used (i.e., seed material, mineral and organic fertilizers, plant protection products, and fuel).
The analyzed soil tillage systems used in maize production included the growing of cover crops. The share of cover crops area was 1.8% in conventional tillage (CT), 10.2% in reduced tillage RT, and 11.0% in no-tillage (NT) systems. The average grain yields per hectare were 12.7, 12.4 and 10.5 tons in CT, RT and NT, respectively.

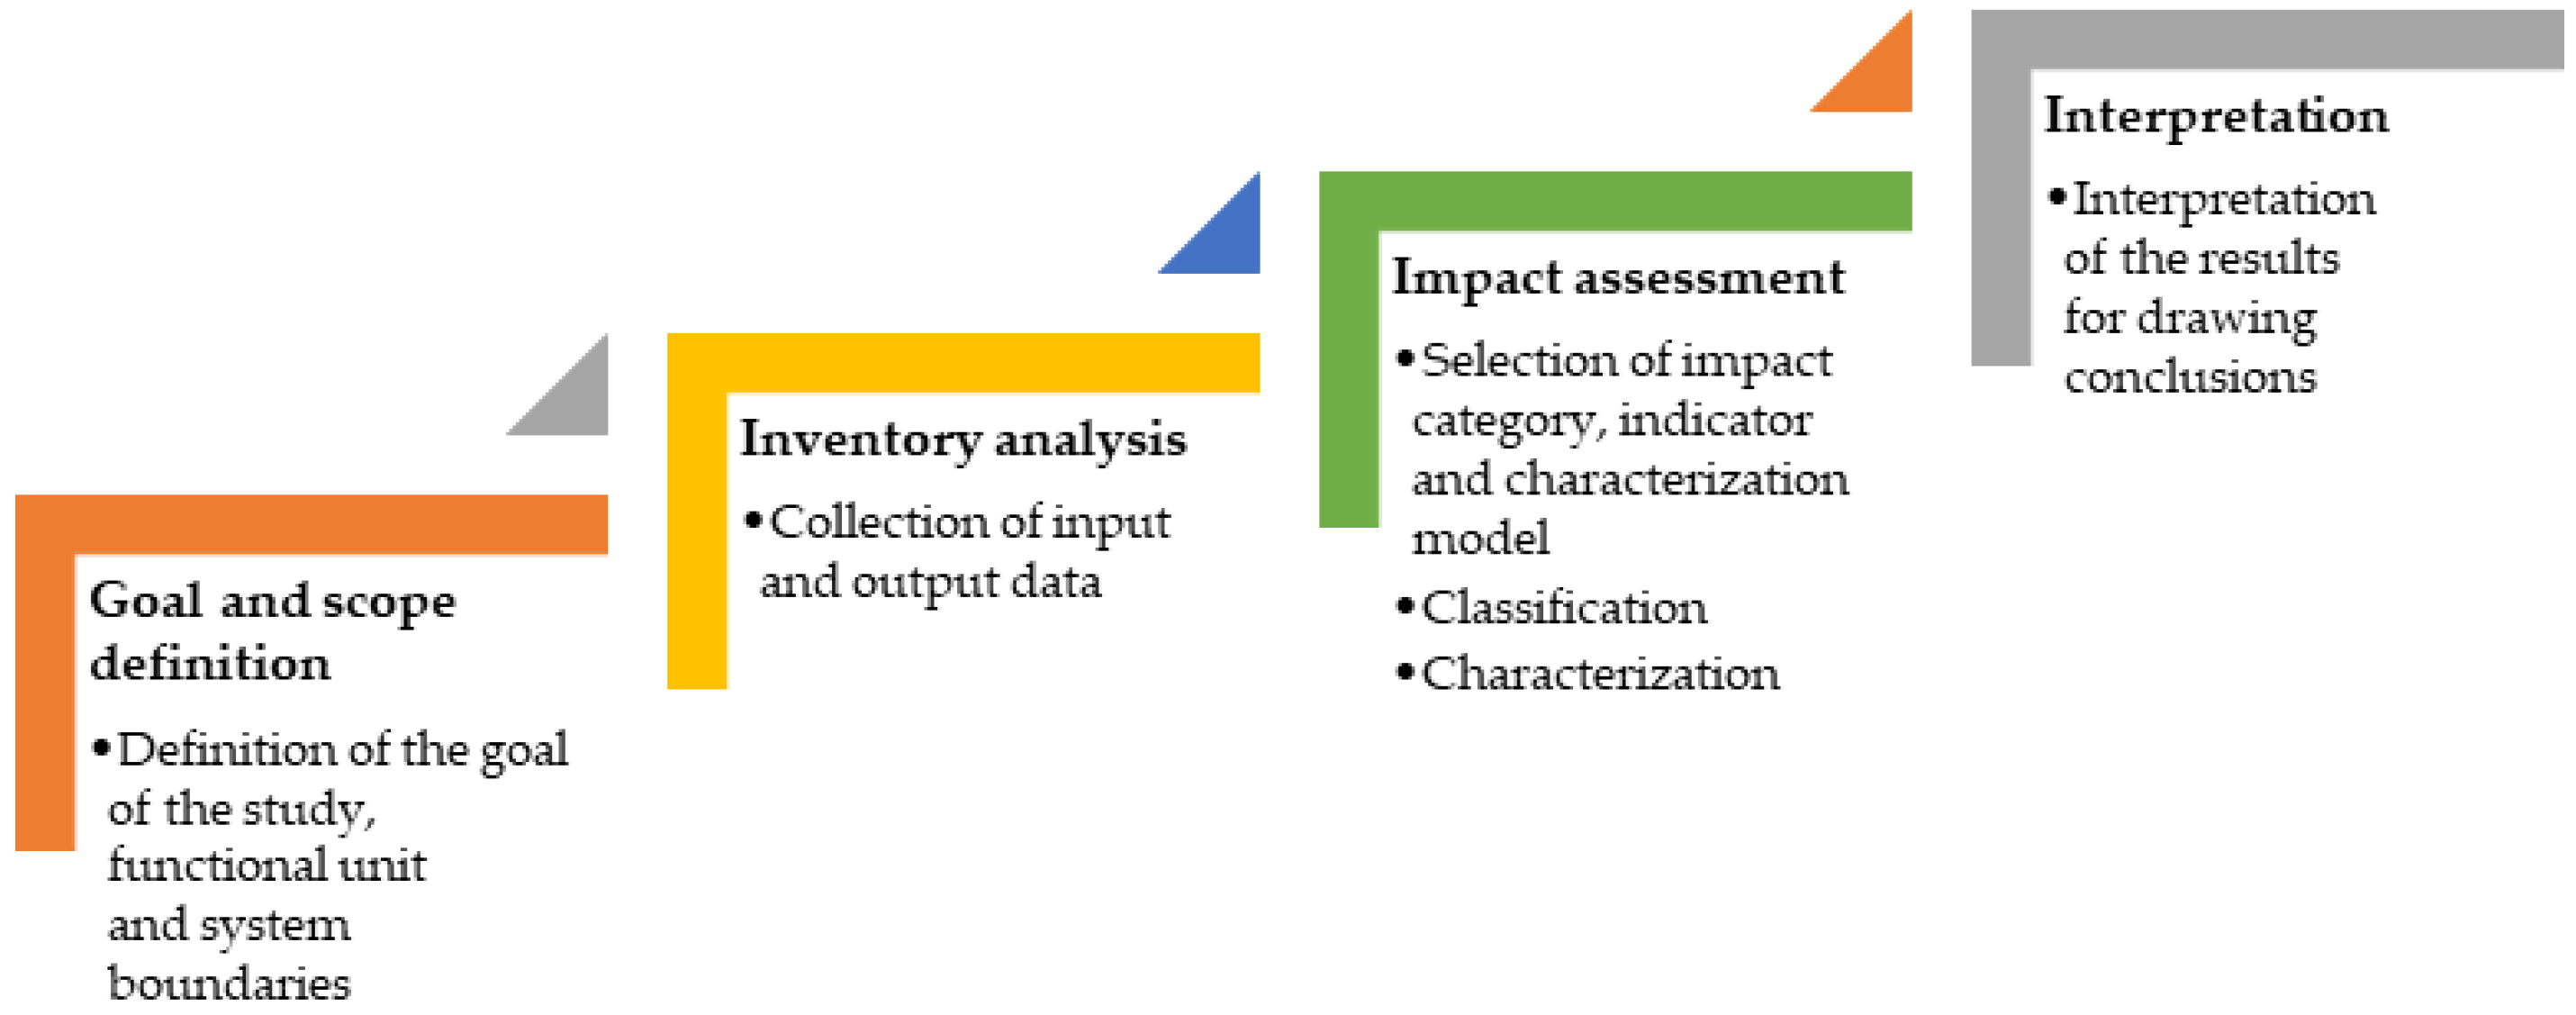
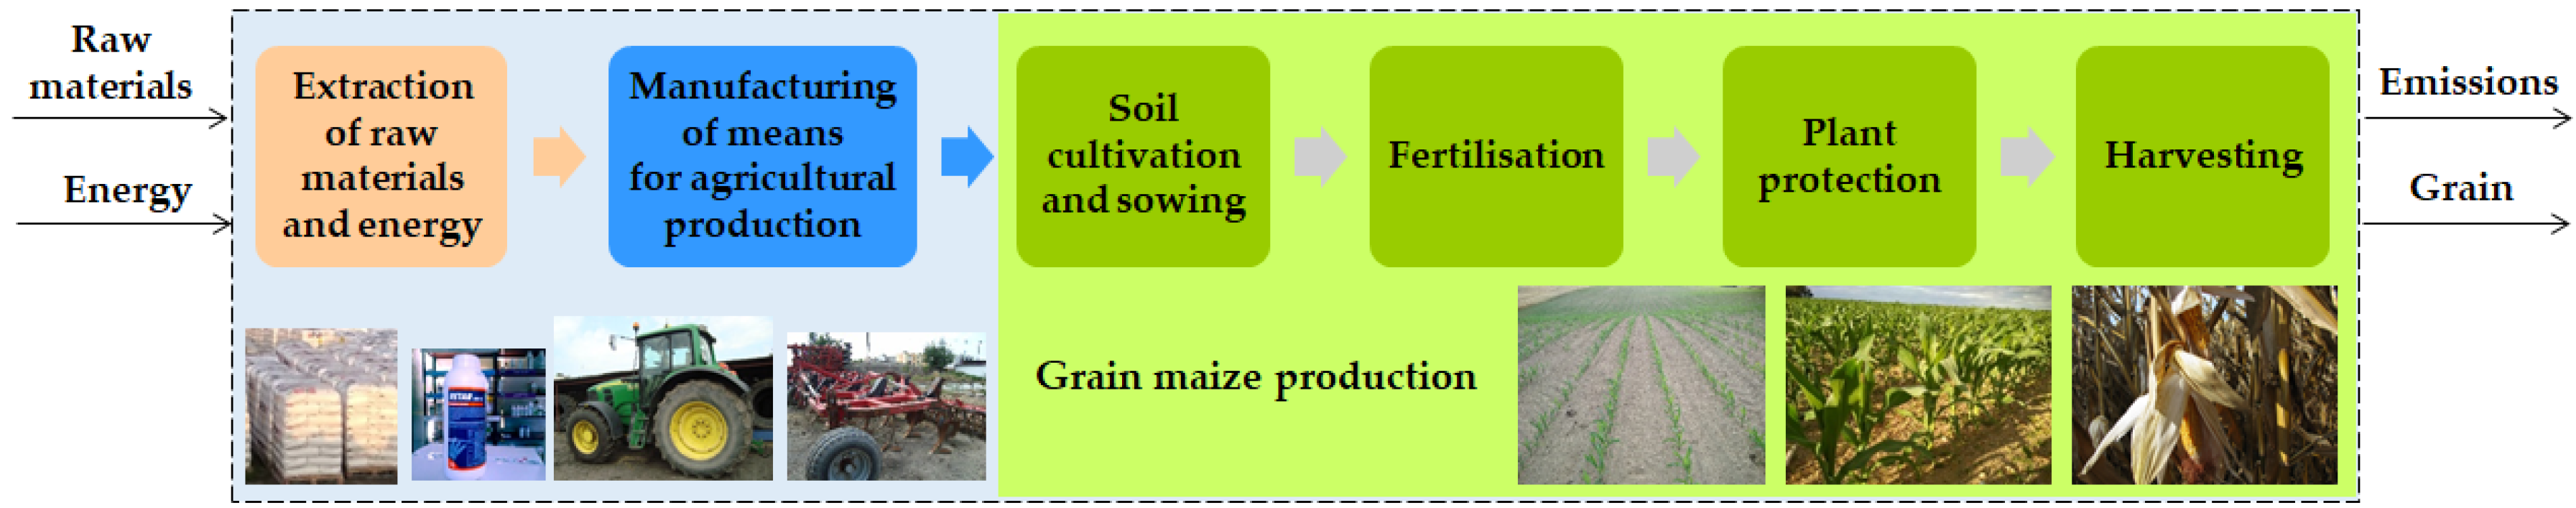
2.2. Carbon Footprint (CF) Assessment

To assess greenhouse gas (GHG) emissions from grain maize production, we used the carbon footprint (CF) methodology, according to the guidelines of the life-cycle assessment (LCA) methodology [29,30]. LCA, in compliance with International Organization for Standardization (ISO) standard [31], was performed in four phases: (1) goal and scope definition, (2) life-cycle inventory (LCI), (3) life-cycle impact assessment (LCIA) and (4) interpretation (Figure 3). In the first phase, the research objective, functional unit, and system boundaries were defined. The LCI phase consisted of collecting input and output data for the system. LCIA was carried out in three steps: selection of impact category, impact indicator and characterization model, assignment of inventory data to the impact category (classification) and calculation of the value of the category indicator (characterization). The last phase consisted of the analysis of the obtained results and drawing conclusions.
The research was carried out from “cradle-to-farm gate” (Figure 4). The boundaries of the analyzed system included the processes of manufacturing means of agricultural production and the cultivation of maize. One hectare of maize cultivation area and one ton of grain were assumed as the functional units. LCI for unit processes under the investigated system used the collected data on the consumption of individual means of production in the maize cultivation on the studied farms. Based on those input data, the emissions of substances to the environment were determined (output data). The assessment of emissions from the production of agrochemicals and agricultural machines was performed using the Ecoinvent 3.0 database [32] and the TEAMTM (Tools for Environmental Analysis and Management, version 5.3) LCA modelling software (PricewaterhouseCoopers—Ecobilan, LCA expertise, Neuilly sur Seine, Paris, France). The emissions from the use of mineral and organic fertilizers were estimated according to the methodologies developed by the Intergovernmental Panel on Climate Change (IPCC) [33] and the European Environment Agency (EEA) [34]. The EEA guideline [35] was used for the assessment of emissions from fuel combustion in agrotechnical procedures. The amount of N2O emission from crop residues was calculated based on the IPCC methodology [33].
In the LCIA phase, we used the method developed by the Institute of Environmental Sciences (CML) of the University of Leiden and consisting of the set of characterization factors rendering the results at the midpoint level [36]. The analyzed impact category was climate change, and the characterization factor was global warming potential [37]. The value of the CF indicator (in CO2 equivalent) per one hectare was calculated according to the following equation:
CF   =   i = 1 n   ( m i   ×   GWP i ) ,
where: mi—emission of substance “i” from cultivation of 1 ha (in kg), GWPi—global warming effect category characterization factor for substance “i” determining the greenhouse effect potential of the substance over a time horizon of 100 years (in kg of CO2 eq. per 1 kg of substance) adapted from the IPCC Report [37], and n—number of substances.
Sensitivity analysis was performed by varying each of the key input parameter one-at-a-time by 5 percent of its original value [36].
The potential for organic carbon (C) sequestration in the perspective of 100 years was estimated as 10% of the excess of the C input in the soil over its reference runoff determined for wheat cultivation, assuming leaving straw in the field [38]. Carbon inputs to the soil included straw ploughing, maize root mass, application of organic fertilizers, and the cultivation of cover crops.

2.3. Life-Cycle Costing

The life-cycle costing (LCC) methodology was used to assess all costs incurred during the whole life cycle of grain maize production [39]. It was carried out within the same boundaries of the studied system as for the LCA (“cradle-to-farm gate”). The LCC included internal costs of maize production. Analysis of internal costs was carried out based on data on input material costs (agricultural machinery, seeds, fertilizers, and plant protection products) and labor costs in grain maize production on the studied farms. The working costs of tractors and machinery included their maintenance costs and operating costs [40]. Maintenance costs consisted of depreciation, insurance, service, and maintenance. The operating costs covered repairs and auxiliary materials. The results of LCC analysis were expressed in monetary values (in euros) and referenced to the functional units of one hectare and one ton. As in the case of LCA, LCC analysis was performed using TEAMTM 5.3 software.

3. Results and Discussion

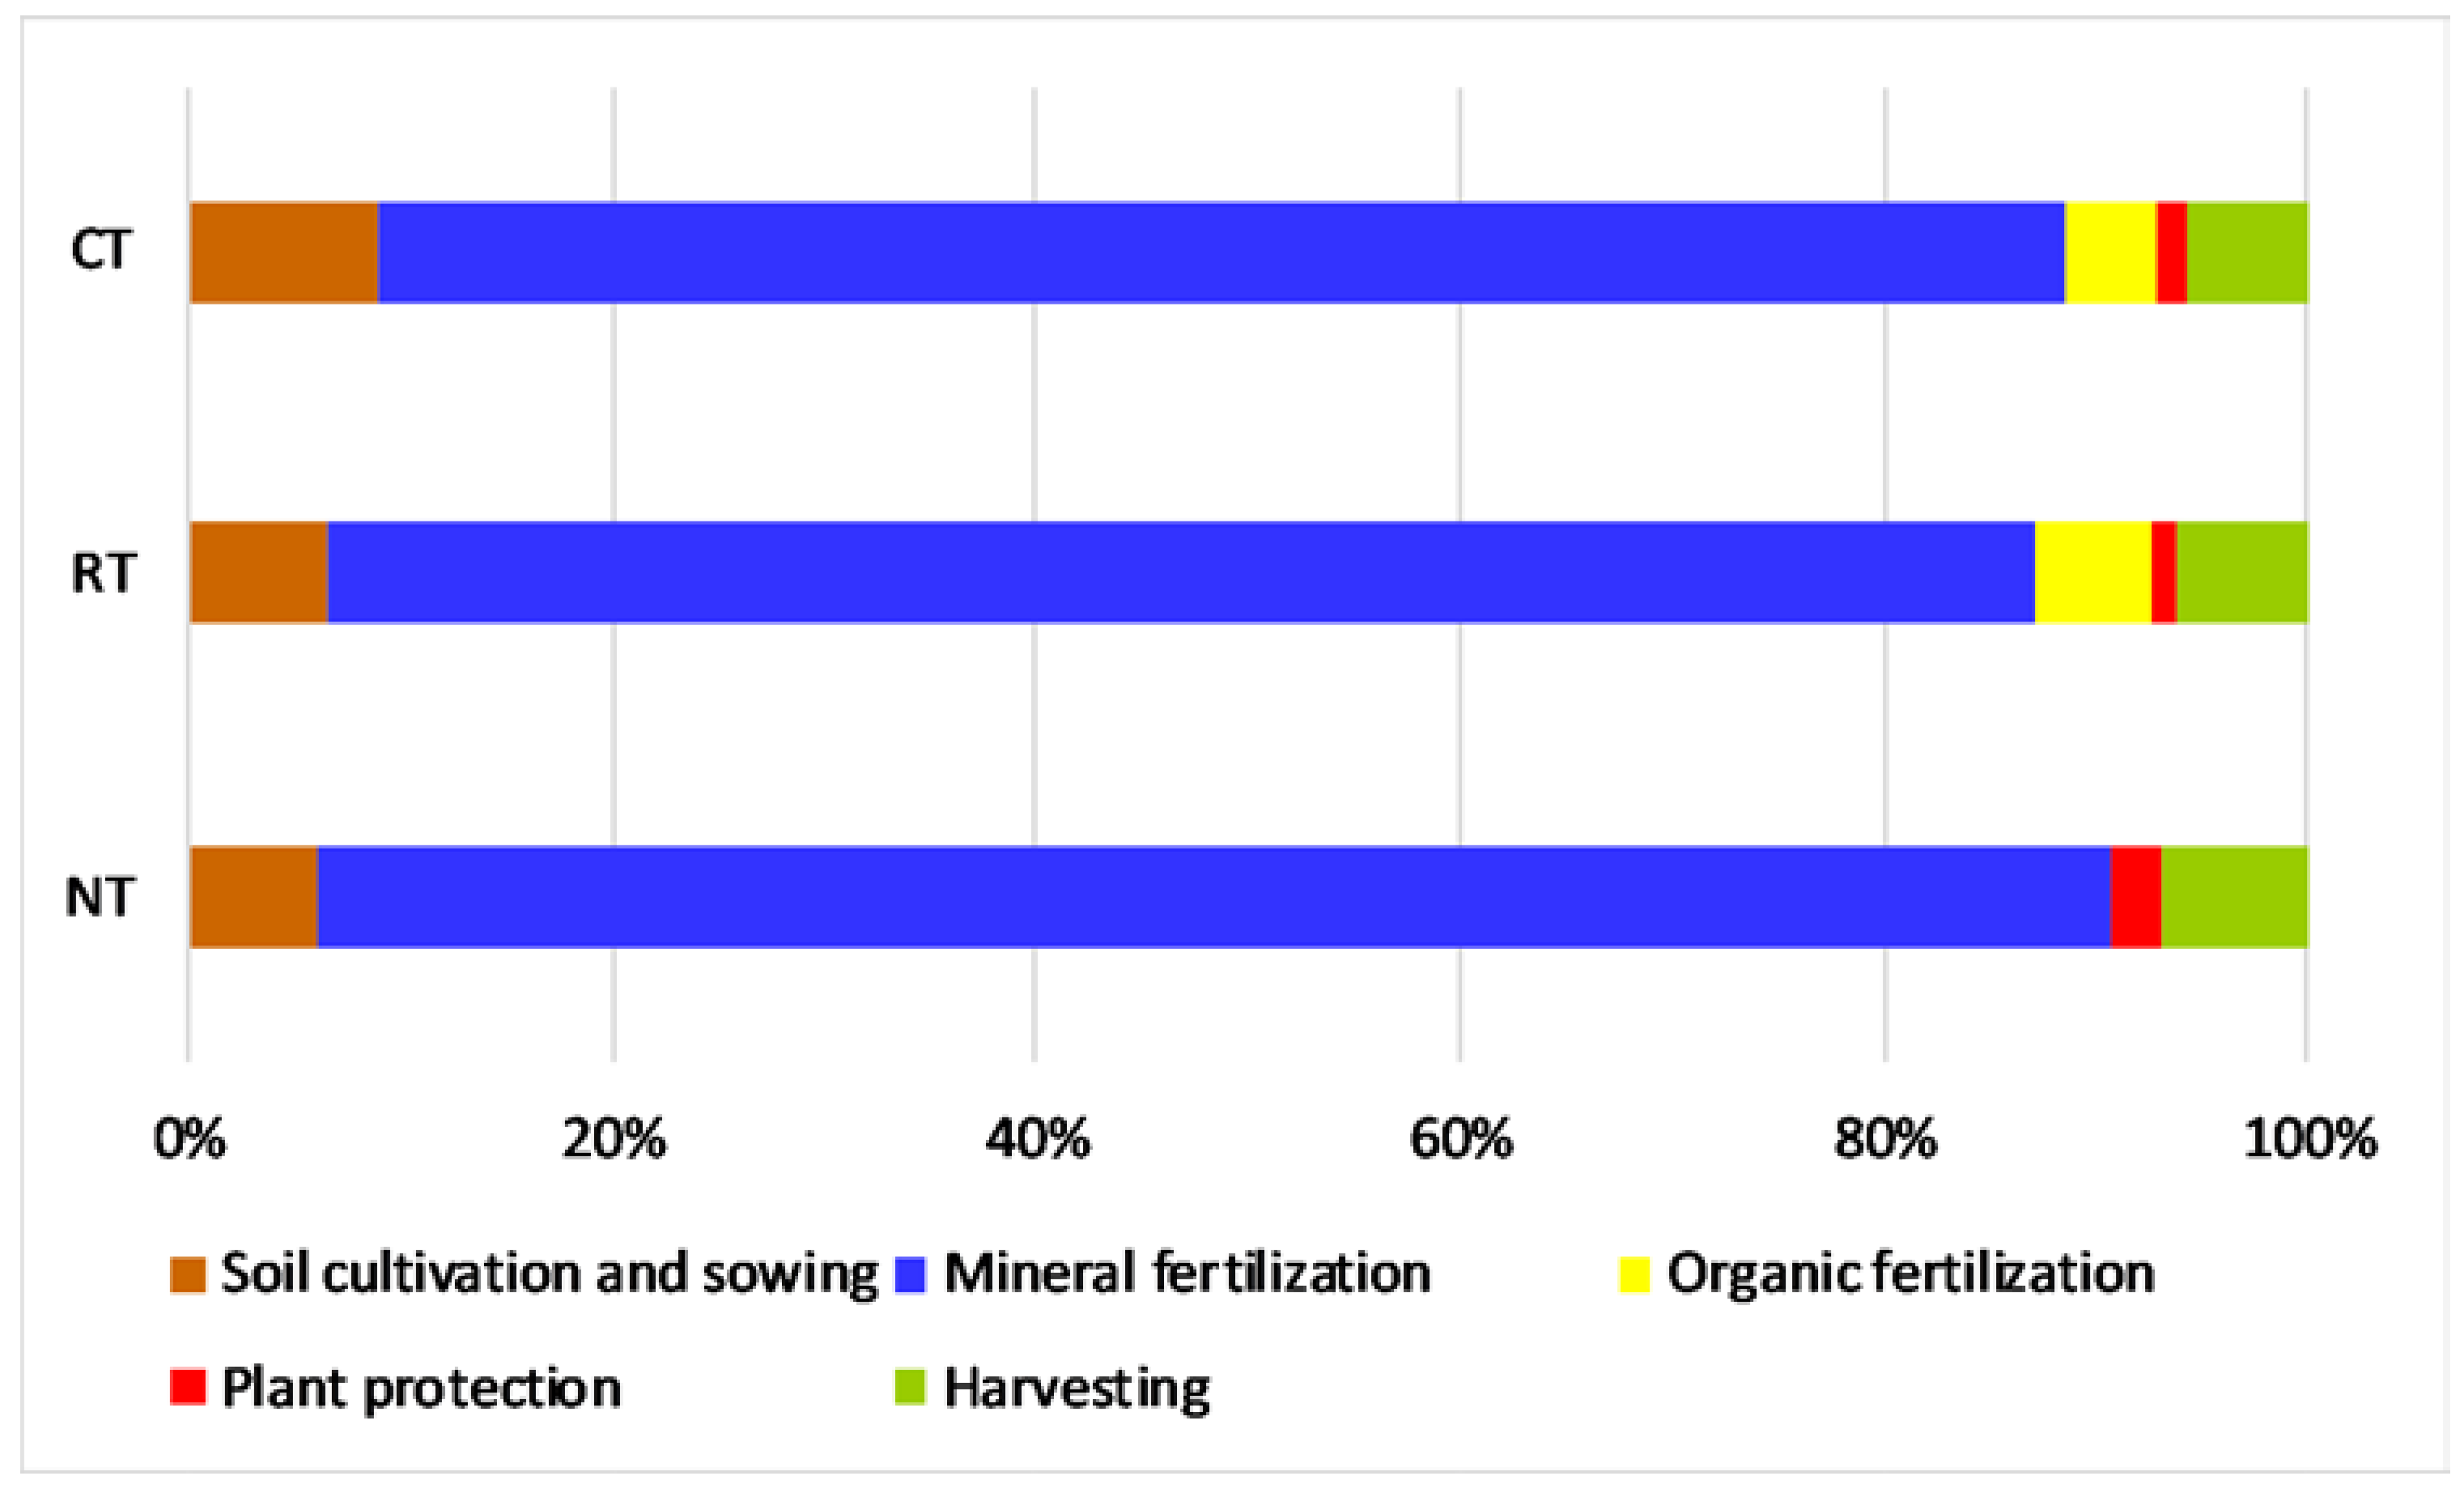
3.1. Inventory Analysis

In the life-cycle inventory (LCI) phase, as part of the life-cycle assessment (LCA) and life-cycle costing (LCC) studies, inventory tables were created for grain maize production for each of the studied tillage systems (Table 2). The input data for the analyzed system in LCA and LCC were the quantities and costs of means of production used.

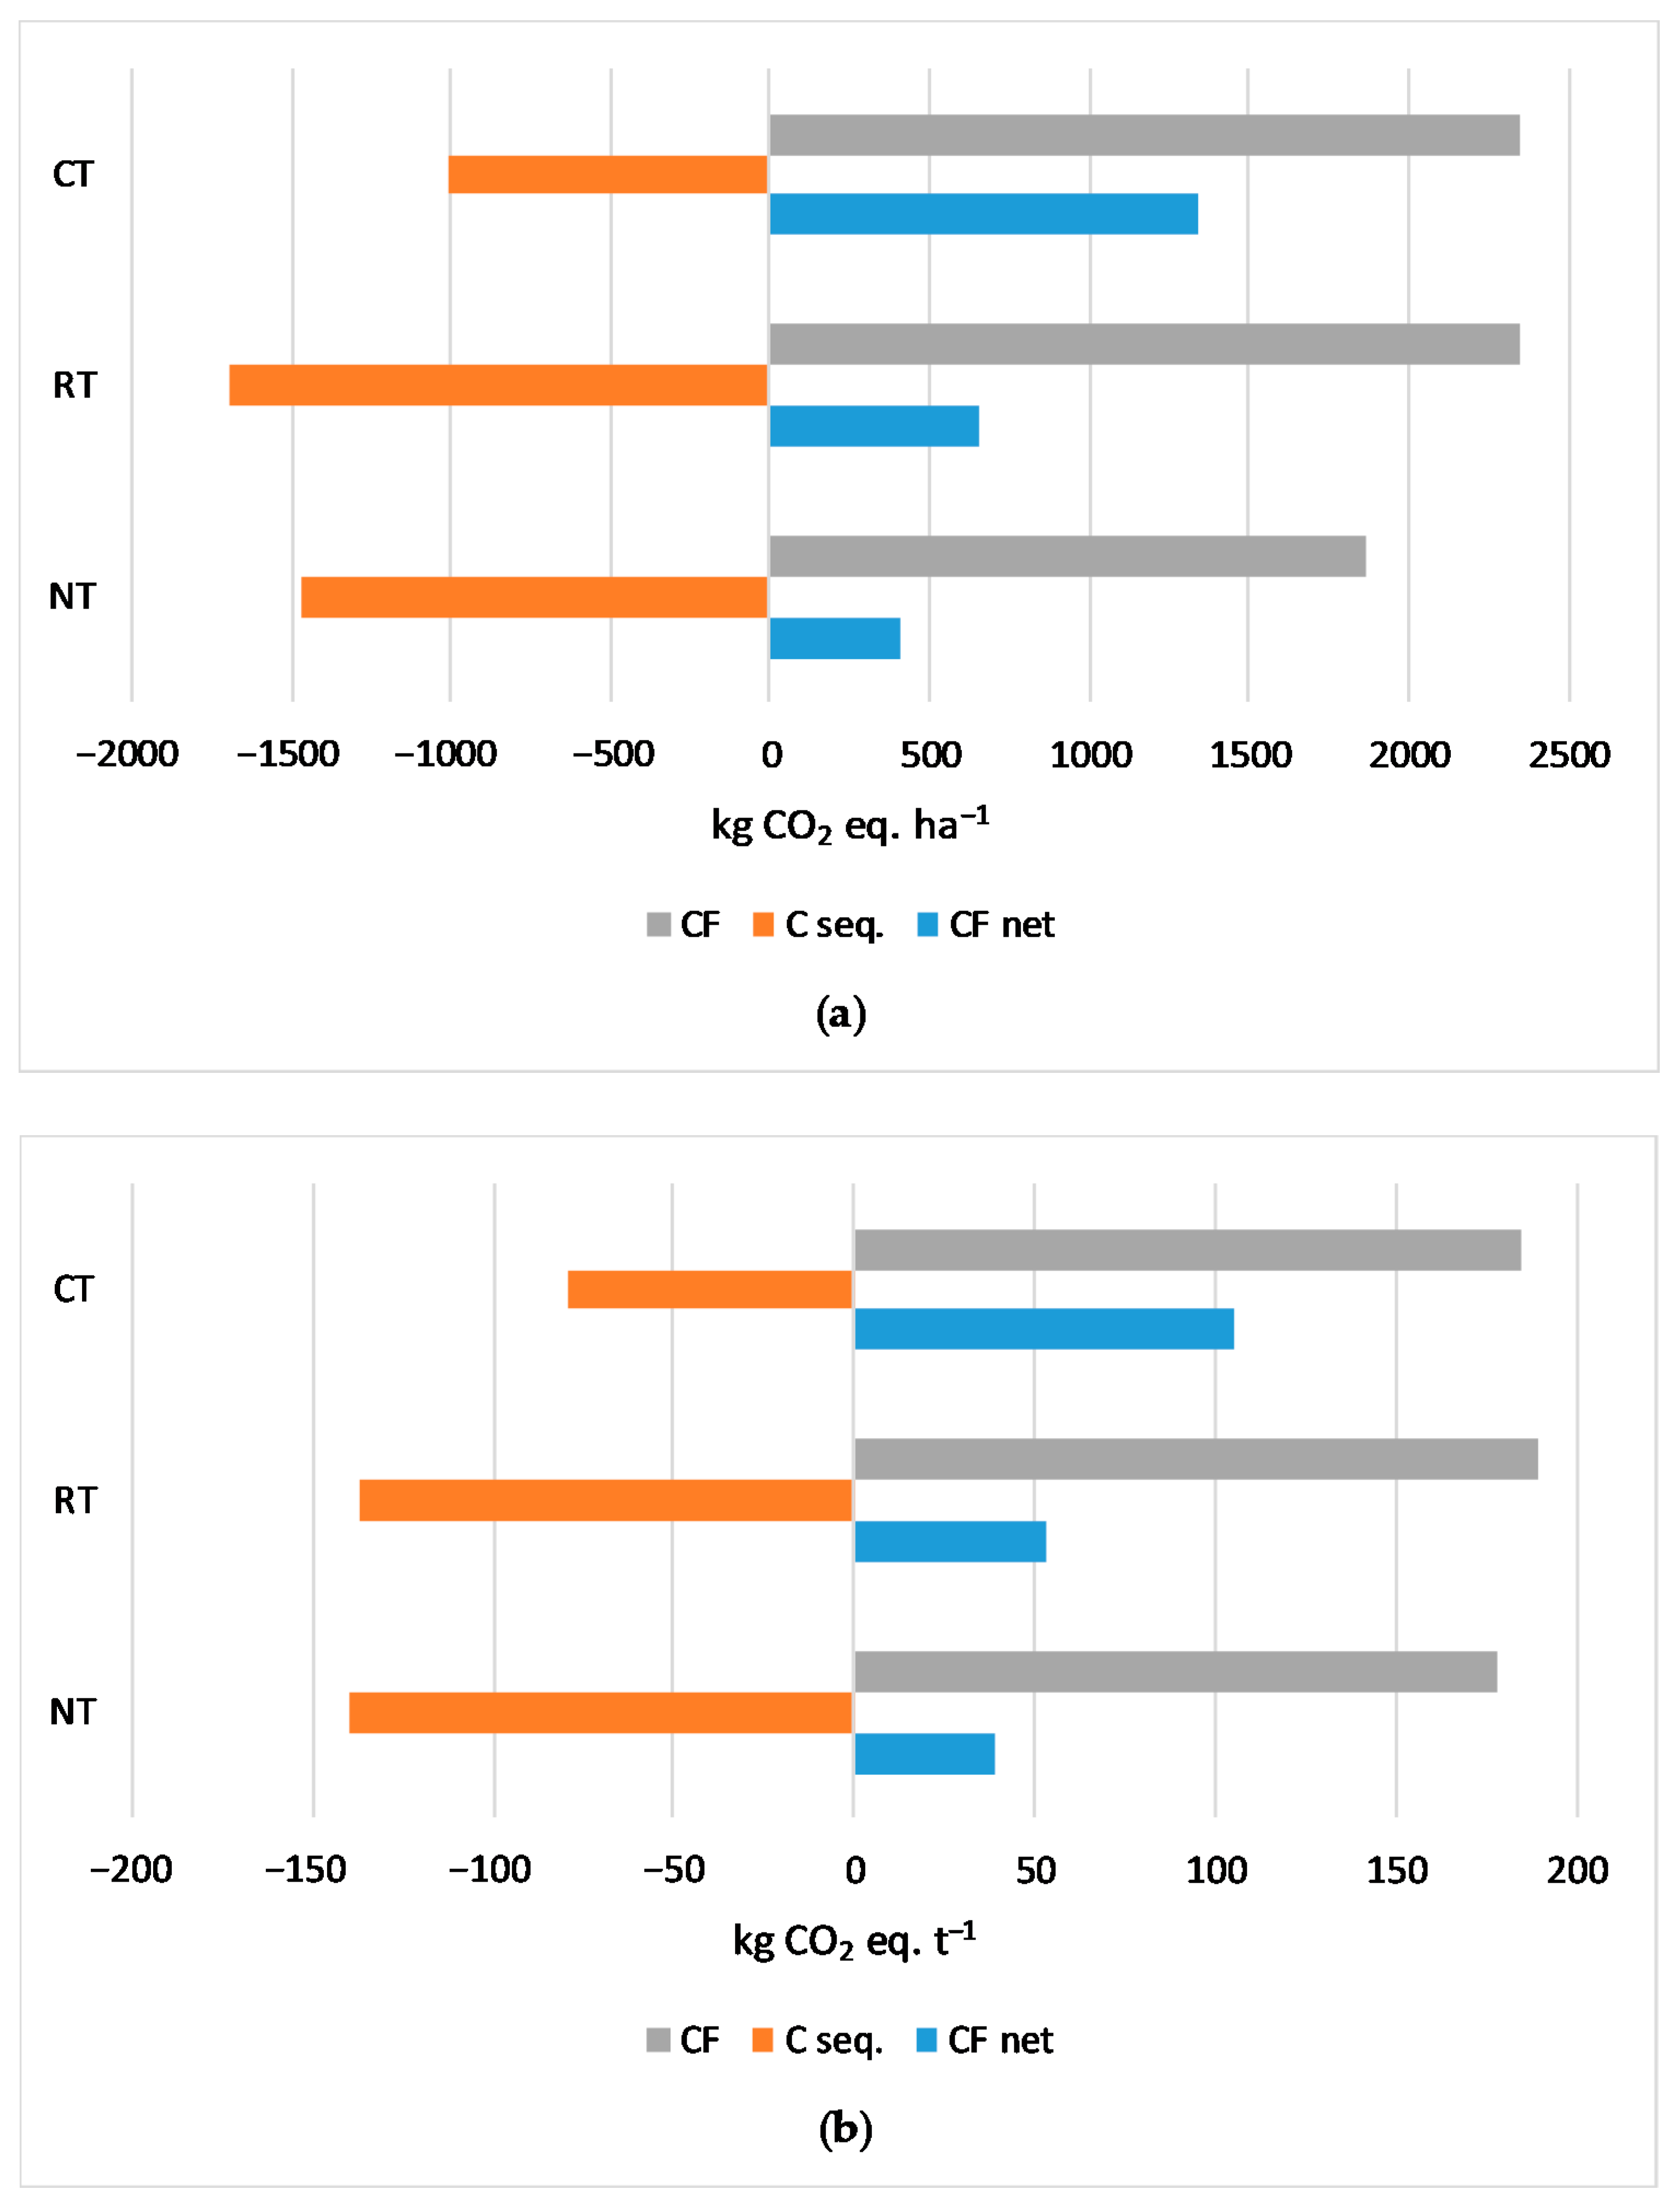
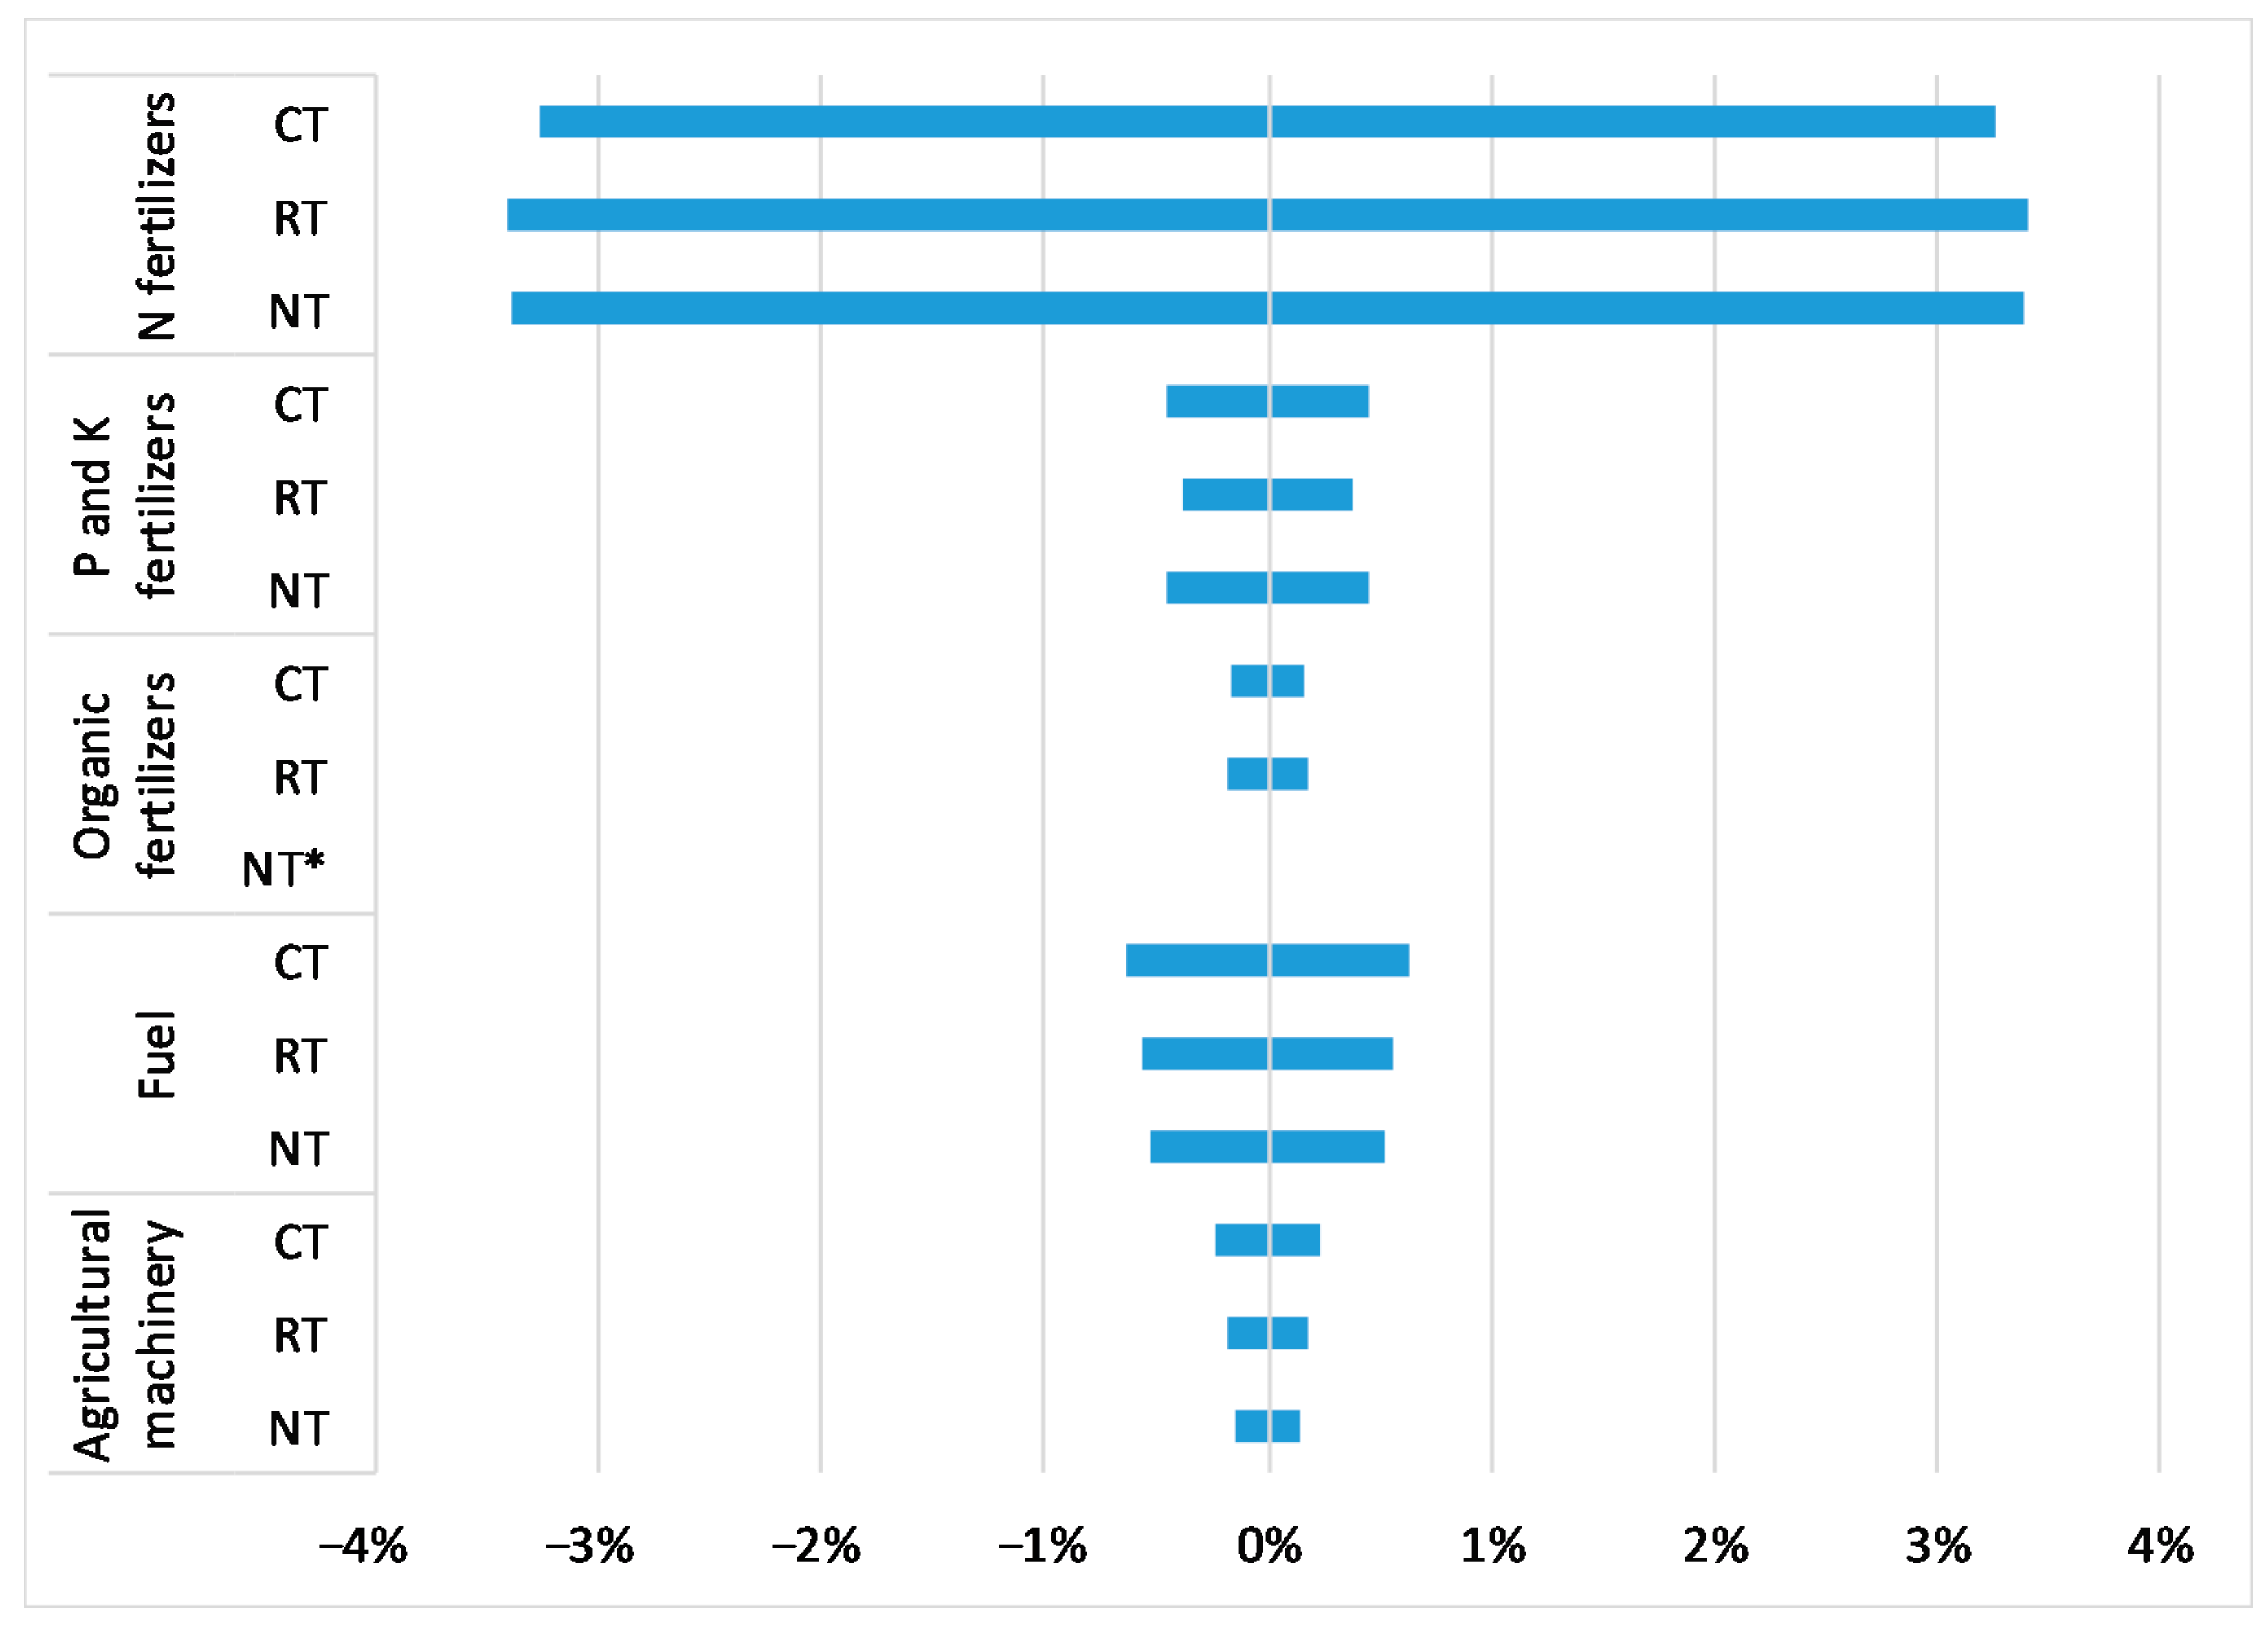
3.2. Carbon Footprint

The calculated average carbon footprint (CF) values for one hectare of maize grain cultivation area in conventional tillage (CT), reduced tillage (RT), and no-tillage (NT) were 2347.4, 2353.4, and 1868.7 kg CO2 eq., respectively (Figure 5a). In the world literature, the CF value for maize ranges from 2440 to 4200 kg CO2 eq. ha−1 [41]. Our studies showed that the CF per functional unit of one ton of grain amounted to 184.8 kg CO2 eq. in CT, 189.8 kg CO2 eq. in RT and 178.0 kg CO2 eq. in NT (Figure 5b). In Canada, GHG emissions from life cycle of maize production ranged from 243 to 353 kg CO2 eq. t−1 [42]. Differences in the CF values of maize production in the analyzed soil tillage systems were related to the intensity of agricultural inputs use. Higher GHG emissions in CT and RT resulted mainly from higher consumption of mineral fertilizers compared to NT, as indicated by the inventory results (Table 2). It has been observed that an increase in the level of nitrogen (N) fertilization results in a large increase in GHG emissions in maize production [43]. In conditions of the United States, maize cultivation in the no-tillage system with mineral fertilization and that with a legume cover crop helped to reduce GHG emissions by 6% and 42%, respectively, compared to conventional tillage with mineral fertilization [41]. Polish studies of maize cultivation for bioethanol production have also shown that non-inversion tillage with leaving crop residues in the field allows reduction of GHG emissions [44]. In Ontario, maize production with higher yields at lower N application rates and reduced tillage had lower GHG emissions per ton of grain [42]. Other Canadian studies showed opportunities for reducing carbon footprint of maize by its cultivation in rotation with legumes [43]. Maize production with nitrogen fertilization of 100 kg N ha−1 in rotation with legumes maintained high productivity while reducing the carbon footprint compared to maize production with 200 kg N ha−1.
Including the sequestration of organic carbon (C) into the total GHG emissions from the life cycle of grain maize production allowed us to obtain the net carbon footprint (CF net) value which was reduced compared to the baseline CF value by 42.9% in CT, 72.1% in RT, and 78.3% in NT (Figure 5a). Relating GHG emissions to the functional unit of one ton confirms that the inclusion of C sequestration contributes most effectively to lowering the total GHG emissions in NT and RT systems (by 78.3% and 72.1%, respectively) (Figure 5b). The possibilities of CF reduction resulted primarily from the management of the maize crop residues (straw) and the cultivation of cover crops. Leaving large amounts of crop residues in the field contributed to the prevention of C losses and its sequestration. Moreover, the application of organic fertilizers also influenced the accumulation of C in the soil of the fields with CT and RT. The importance of the C sequestration process in reducing GHG emissions has been emphasized in the literature [45,46]. The method of calculating C sequestration used in our research was developed in soil and climatic conditions specific for Denmark [38]. Regarding close geographic location and similarity of environmental conditions of our region to Denmark, it was justified to apply such a regionally focused method of calculating C accumulation in the soil. In the study by Petersen [38], it was stated that the results derived from this method are comparable to the results of the approach proposed by the Intergovernmental Panel on Climate Change.
In each of the analyzed systems, the mineral fertilization process played a dominant role in shaping the value of the CF indicator (from 79.4% for CT to 84.6% for NT in the total value of CF) (Figure 6). In the total value of CF, emissions from the production and use of nitrogen fertilizers amounted from 65.4% for CT to 68.1% for RT. At the soil cultivation and sowing stage, the amount of GHG emission was the highest in CT (its share was 9%) and lower in RT (6.6%) and NT (6.1%). This was the result of greater fuel consumption and machinery involvement in CT compared to RT and NT. The share of GHG emissions related to grain harvest ranged from 5.7% in CT to 7% in NT. The other operations were of less importance in generating GHG emissions. As in our study, the cradle-to-farm gate life-cycle analysis of grain maize production in Canada showed that 72% of GHG emissions came from N fertilization [42]. Apart from mineral fertilizers, fuel consumption in field operations also has a relatively large impact on the CF size in the maize production life cycle. The decisive influence of these expenditures on GHG emissions in the plant production life cycle has been confirmed by literature studies [47]. Other authors observed that irrigation is also responsible for a considerable part of GHG emissions from maize production [16,48]. On the other hand, higher crop yields resulting from irrigation can ameliorate overall GHG emissions if prevention of land-use change is taken into account [49]. In this study, irrigation was not considered because the entire area of maize cultivation in Poland is rain-fed.
As shown in Figure 7, CF of grain maize production in three soil tillage systems was the most sensitive to the change in the total amount of nitrogen (N) fertilizers applied. Varying N fertilizer application rate by 5% resulted in a change of total GHG emission from the life cycle of maize by approximately 3.3%, 3.4% and 3.4% for CT, RT, and NT, respectively. Fuel consumption was the second important factor for the carbon footprint. Phosphorus (P) and potassium (K) fertilizers had much less influence. The least sensitivity for the indicator resulted from the changes in the use of organic fertilizers and agricultural machinery.

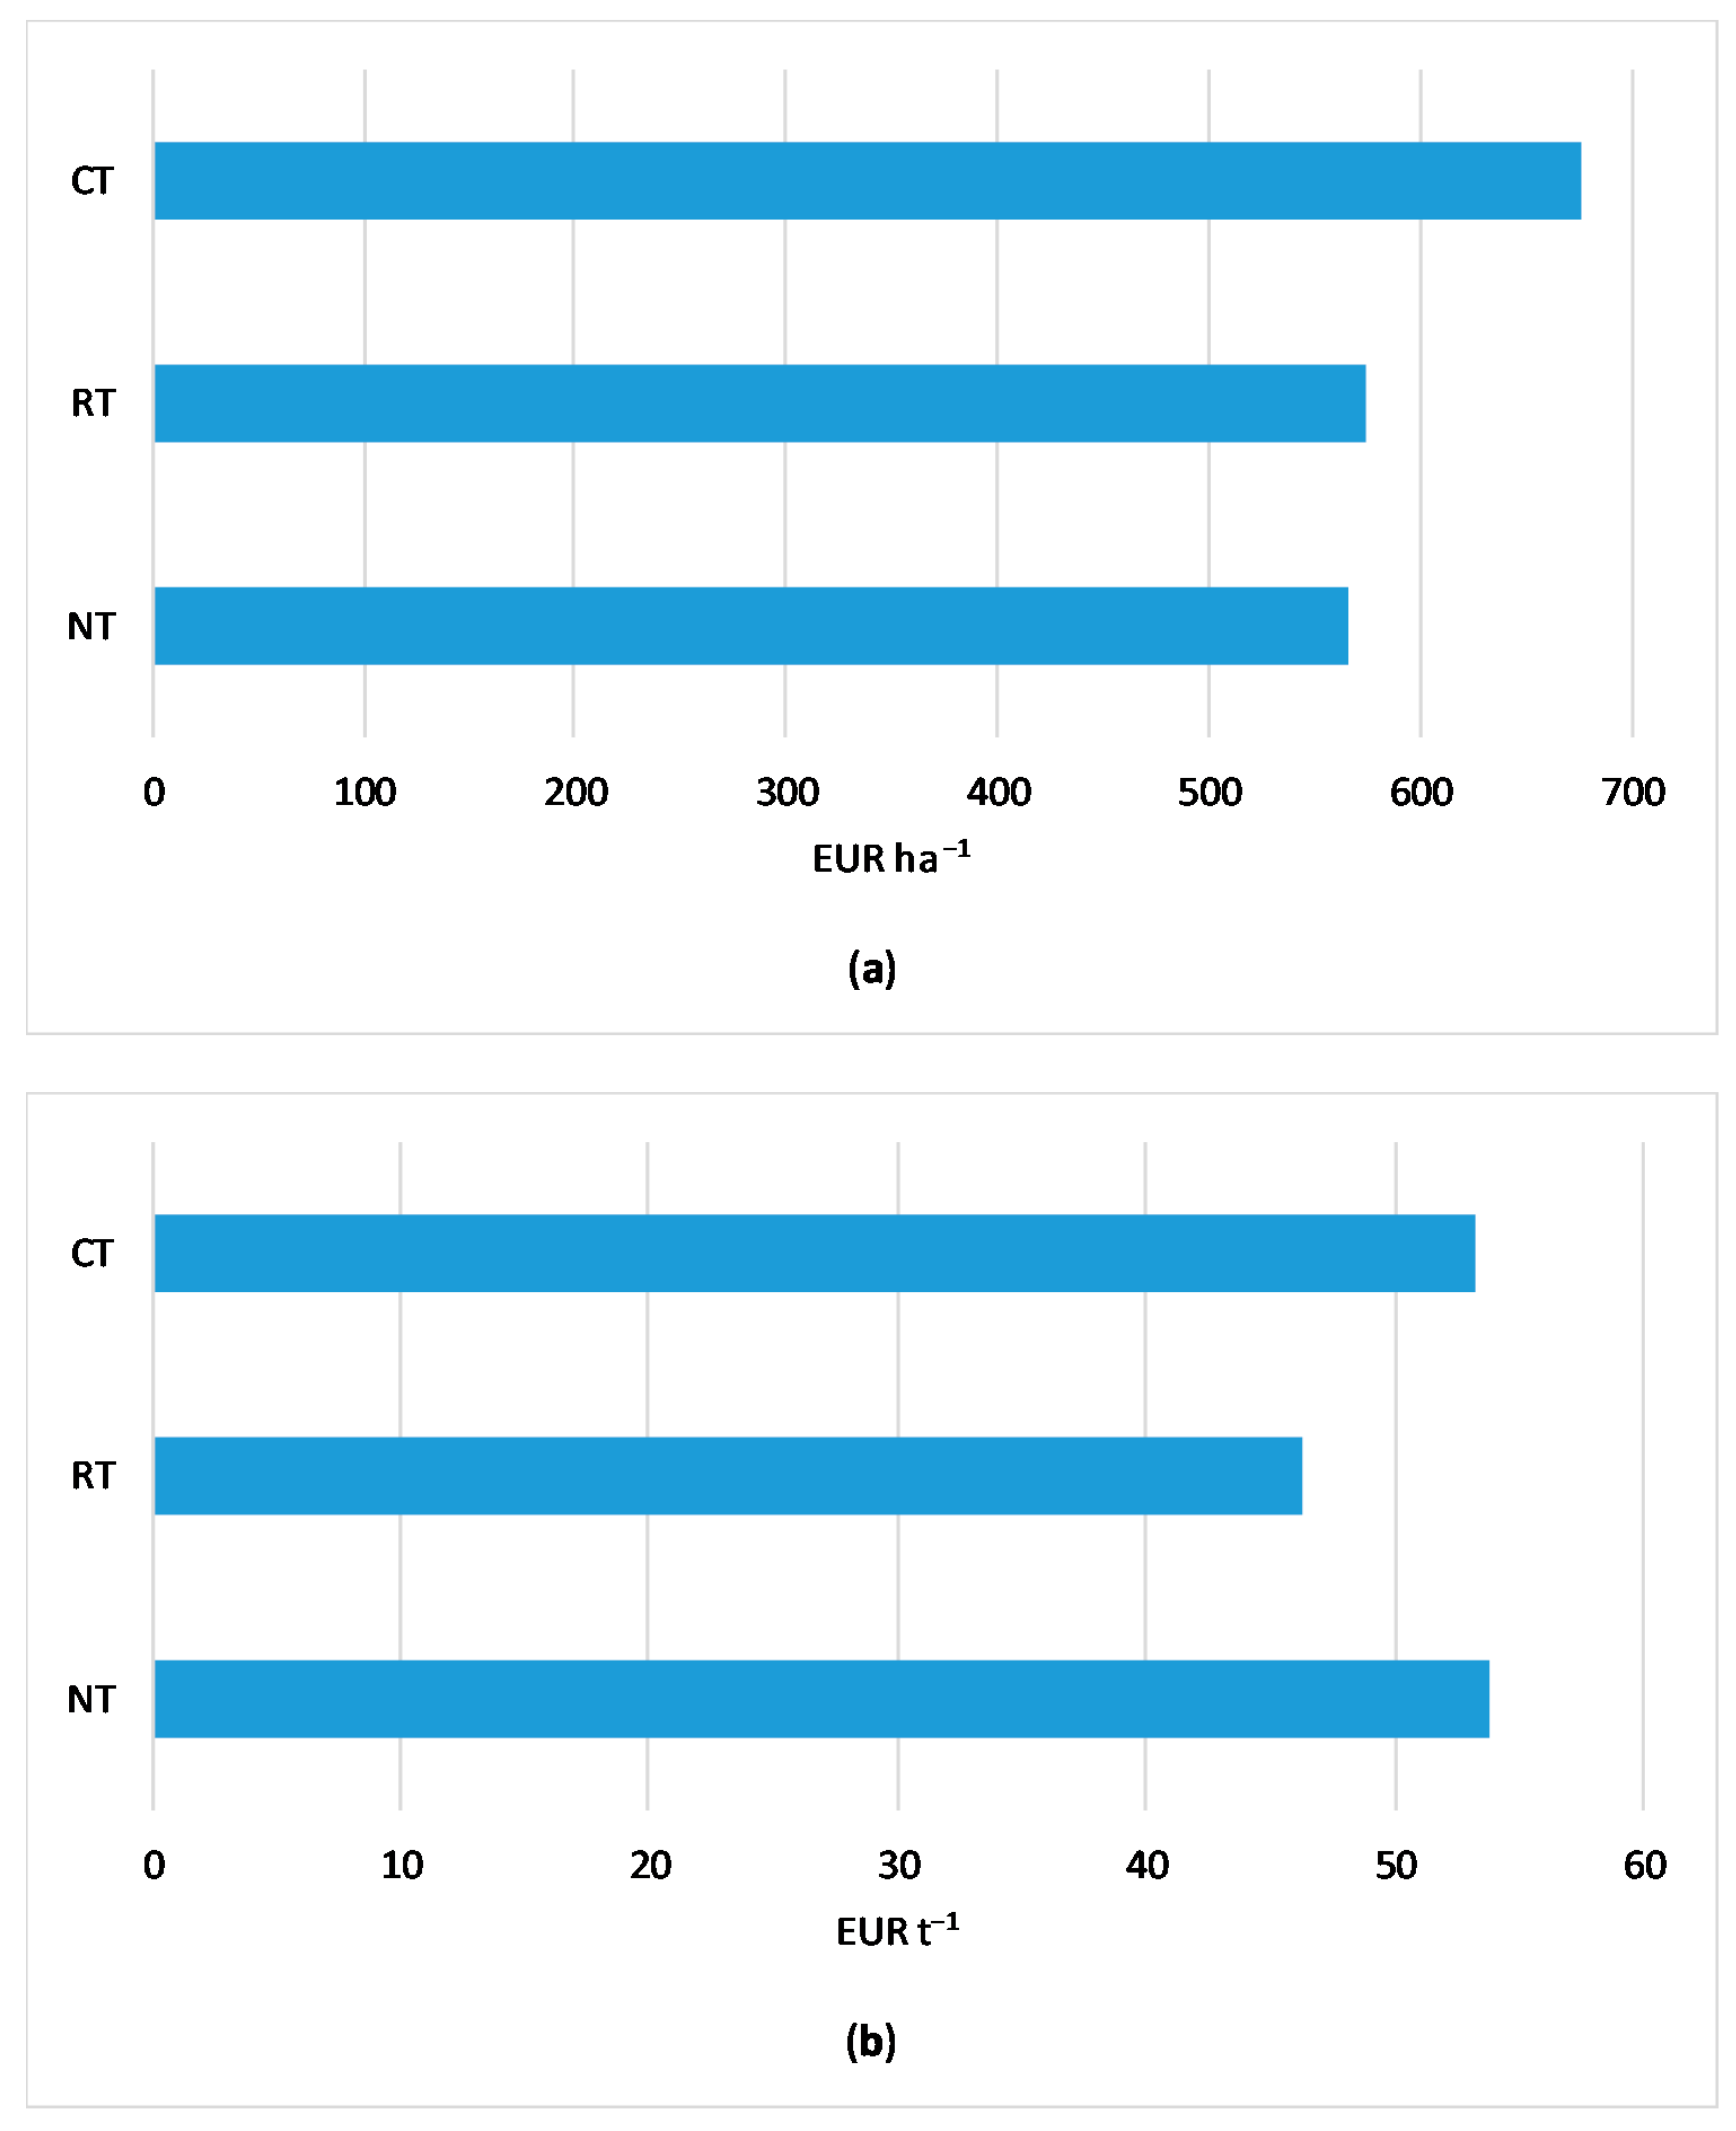
3.3. Costs of Maize Production

Figure 8 shows the results of life-cycle costing for grain maize production in the studied tillage systems in relation to the functional unit of one hectare and one ton of grain. The highest total production cost, which is the sum of internal costs incurred on the studied farms, was noted in the case of using CT (675.6 EUR ha−1), and lower in RT (574.0 EUR ha−1) and NT (565.6 EUR ha−1). When life-cycle costs of different tillage systems were compared based on one ton, it was observed that NT had the highest overall cost. This indicates that higher intensity of production (expressed by input levels: seeds, K fertilizers, and plant protection products) were not sufficiently compensated by the yield increase. This evidently emphasizes the fact that the productivity level was a very important factor, implicating cost comparisons based on production unit.
Among the analyzed technological operations in the grain maize production, the processes of mineral fertilization (from 36.7% in CT to 41.7% in RT), soil cultivation and sowing (from 31.2% in RT to 37.6% in CT) had the most significant share in shaping life-cycle costs (Figure 9). This resulted from the costs of mineral fertilizers, fuel, and machinery. Processes of harvesting and plant protection were of less importance (their shares were not higher than 17% in RT and 14% in CT).

4. Conclusions

The reduction of greenhouse gas emissions (GHG) is a significant challenge for agriculture. There is a need to accurately identify the sources of emissions and to disseminate knowledge on agricultural practices that can contribute to reducing emissions in crop production.
The management of soil cultivation operations to increase the sequestration of organic carbon in the soil plays an important role in balancing GHG emission from agriculture. The conducted research has shown that the use of no-tillage with a large amount of crop residues in the field significantly contributes to the reduction of GHG emissions in maize production. Regardless of the tillage system, the mineral fertilization process had the most potential impact on the GHG emission. Designing low-emission technologies requires considering the threats resulting particularly from the use of nitrogen fertilizers. To reduce emissions from fields and, at the same time, reduce the consumption of raw materials in fertilizer production, it is important to optimize fertilization (taking into account natural constraints, soil conditions) and the level of crop productivity.
Studies on the environmental performance of crop production should consider both the carbon footprint and the life-cycle costs. There is a need for further research on the environmental impact of crop production with different tillage technologies using a life-cycle approach due to diversification of natural conditions across the regions. The inclusion of life-cycle costs is recommended to be employed in future studies on the carbon footprint of crop production to gain a better comparative basis for relating the economic cost to GHG emission in different tillage systems.

Author Contributions

Conceptualization, M.H. and J.B.; methodology, M.H. and J.B.; formal analysis, M.H.; investigation, M.H. and J.B.; writing—original draft preparation, M.H.; writing—review and editing, M.H. and J.B.; visualization, M.H.; supervision, J.B.; project administration, M.H.; funding acquisition, M.H. All authors have read and agreed to the published version of the manuscript.

Funding

This research was funded by the National Science Centre, Poland, project no 2015/19/N/HS4/03031.

Acknowledgments

This study was made possible by a grant from the National Science Centre, Poland, Project: Environmental life cycle assessment and life cycle costing of grain crop production in different soil tillage systems. Project No. 2015/19/N/HS4/03031.

Conflicts of Interest

The authors declare no conflict of interest.

References

  1. Aneja, V.P.; Schlesinger, W.H.; Erisman, J.W. Effects of agriculture upon the air quality and climate: Research, policy, and regulations. Environ. Sci. Technol. 2009, 43, 4234–4240. [Google Scholar] [CrossRef] [Green Version]
  2. Średnicka-Tober, D.; Obiedzińska, A.; Kazimierczak, R.; Rembiałkowska, E. Environmental impact of organic vs. conventional agriculture-a review. J. Res. Appl. Agric. Eng. 2016, 61, 204–211. [Google Scholar]
  3. Pawlak, J. Emisja gazów cieplarnianych w wyniku działalności rolniczej krajów Unii Europejskiej. Woda-Środowisko-Obszary Wiejskie 2018, 18, 39–48. [Google Scholar]
  4. Pawlak, J. Poziom i struktura emisji gazów cieplarnianych w rolnictwie. Probl. Inż. Rol. 2017, 98, 55–63. [Google Scholar]
  5. Kundzewicz, Z.W.; Kozyra, J. Ograniczanie wpływu zagrożeń klimatycznych w odniesieniu do rolnictwa i obszarów wiejskich. Pol. J. Agron. 2011, 7, 68–81. [Google Scholar]
  6. European Council Conclusions 2014. 2030 Climate and Energy Policy Framework. Conclusions. EUCO 169/14. 23–24 October 2014. Available online: https://www.consilium.europa.eu/uedocs/cms_data/docs/pressdata/en/ec/145397.pdf (accessed on 21 July 2020).
  7. Regulation (EU) 2018/842 of the European Parliament and of the Council of 30 May 2018 on Binding Annual Greenhouse Gas Emission Reductions by Member States from 2021 to 2030 Contributing to Climate Action to Meet Commitments under the Paris Agreement and Amending Regulation (EU) No 525/2013 (OJ L 156, 19.6.2018). Available online: https://eur-lex.europa.eu/legal-content/EN/TXT/?uri=celex%3A32018R0842 (accessed on 21 July 2020).
  8. Food and Agriculture Organization of the United Nations (FAO). World Food and Agriculture. Statistical Pocketbook 2019; FAO: Rome, Italy, 2019; ISBN 978-92-5-131849-2. [Google Scholar]
  9. Statistics Poland. Statistical Yearbook of Agriculture 2019; Statistics Poland: Warsaw, Poland, 2020.
  10. Ranum, P.; Pena-Rosas, J.P.; Garcia-Casal, M.N. Global maize production, utilization, and consumption. Ann. N. Y. Acad. Sci. 2014, 1312, 105–112. [Google Scholar] [CrossRef]
  11. Księżak, J.; Bojarszczuk, J.; Staniak, M. Produkcyjność kukurydzy i sorga w zależności od poziomu nawożenia azotem. Pol. J. Agron. 2012, 8, 20–28. [Google Scholar]
  12. Morris, N.; Miller, P.; Orson, J.H.; Froud-Williams, R. The adoption of non-inversion tillage systems in the United Kingdom and the agronomic impact on soil, crops and the environment—A review. Soil Till. Res. 2010, 108, 1–15. [Google Scholar] [CrossRef]
  13. Soane, B.; Ball, B.; Arvidsson, J.; Basch, G.; Moreno, F.; Roger-Estrade, J. No-till in northern, western and south western Europe: A review of problems and opportunities for crop production and the environment. Soil Till. Res. 2012, 118, 66–87. [Google Scholar] [CrossRef] [Green Version]
  14. Holland, J.M. The environmental consequences of adopting conservation tillage in Europe: Reviewing the evidence. Agric. Ecosyst. Environ. 2004, 103, 1–25. [Google Scholar] [CrossRef]
  15. Vermeulen, S.J.; Campbell, B.M.; Ingram, J.S.I. Climate change and food systems. Annu. Rev. Environ. Resour. 2012, 37, 195–222. [Google Scholar] [CrossRef] [Green Version]
  16. Romeiko, X.X. A comparative life cycle assessment of crop systems irrigated with the groundwater and reclaimed water in Northern China. Sustainability 2019, 11, 2743. [Google Scholar] [CrossRef] [Green Version]
  17. Weidema, B.P.; Thrane, M.; Christensen, P.; Schmidt, J.; Løkke, S. Carbon footprint—A catalyst for LCA? J. Ind. Ecol. 2008, 12, 3–6. [Google Scholar] [CrossRef]
  18. Pandey, D.; Agrawal, M.; Pandey, J.S. Carbon footprint: Current methods of estimation. Environ. Monit. Assess. 2011, 178, 135–160. [Google Scholar] [CrossRef] [PubMed]
  19. Nette, A.; Wolf, P.; Schlüter, O.; Meyer-Aurich, A. A comparison of carbon footprint and production cost of different pasta products based on whole egg and pea flour. Foods 2016, 5, 17. [Google Scholar] [CrossRef] [PubMed] [Green Version]
  20. Li, Y.; Wang, Y.; He, Q.; Yang, Y. Calculation and evaluation of carbon footprint in mulberry production: A case of haining in China. Int. J. Environ. Res. Public Health 2020, 17, 1339. [Google Scholar] [CrossRef] [PubMed] [Green Version]
  21. Platis, D.P.; Anagnostopoulos, C.D.; Tsaboula, A.D.; Menexes, G.C.; Kalburtji, K.L.; Mamolos, A.P. Energy analysis, and carbon and water footprint for environmentally friendly farming practices in agroecosystems and agroforestry. Sustainability 2019, 11, 1664. [Google Scholar] [CrossRef] [Green Version]
  22. Busari, M.A.; Kukal, S.S.; Kaur, A.; Bhatt, R.; Dulazi, A.A. Conservation tillage impacts on soil, crop and the environment. Int. Soil Water Conserv. Res. 2015, 3, 119–129. [Google Scholar] [CrossRef] [Green Version]
  23. Debska, B.; Jaskulska, I.; Jaskulski, D. Method of tillage with the factor determining the quality of organic matter. Agronomy 2020, 10, 1250. [Google Scholar] [CrossRef]
  24. European Commission. Communication from the Commission to the European Parliament, the Council, the European Economic and Social Committee and the Committee of the Regions: A Policy Framework for Climate and Energy in the Period from 2020 to 2030, COM/2014/015 Final; European Commission: Brussels, Belgium, 2014. [Google Scholar]
  25. European Commission. Communication from the Commission to the European Parliament, the European Council, the Council, the European Economic and Social Committee and the Committee of the Regions: The European Green Deal, COM/2019/640 Final; European Commission: Brussels, Belgium, 2019. [Google Scholar]
  26. Eurostat. Available online: https://ec.europa.eu/eurostat/tgm/table.do?tab=table&init=1&language=en&pcode=tag00093&plugin=1 (accessed on 28 October 2020).
  27. Statistics Poland. Production of Agricultural and Horticultural Crops in 2019; Statistics Poland: Warsaw, Poland, 2019.
  28. Baum, R.; Bieńkowski, J. Eco-efficiency in measuring the sustainable production of agricultural crops. Sustainability 2020, 12, 1418. [Google Scholar] [CrossRef] [Green Version]
  29. BSI 2011. PAS 2050: Specification for the Assessment of the Life Cycle Greenhouse Gas Emissions of Goods and Services; British Standards Institute: London, UK, 2011; ISBN 978-0-580-71382-8. [Google Scholar]
  30. Cucurachi, S.; Scherer, L.; Guinée, J.; Tukker, A. Life cycle assessment of food systems. One Earth 2019, 1, 292–297. [Google Scholar] [CrossRef] [Green Version]
  31. International Organization for Standardization (ISO). ISO 14040:2006. Environmental Management–Life Cycle Assessment–Principles and Framework; International Organization for Standardization: Geneva, Switzerland, 2006. [Google Scholar]
  32. Ecoinvent Center Ecoinvent Database Website. Available online: http://www.ecoinvent.ch/ (accessed on 20 September 2019).
  33. Intergovernmental Panel on Climate Change (IPCC). 2006 IPCC Guidelines for National Greenhouse Gas Inventories. Volume 4. Agriculture, Forestry and Other Land Use. Available online: https://www.ipcc-nggip.iges.or.jp/public/2006gl/vol4.html (accessed on 20 September 2019).
  34. European Environment Agency (EEA). EMEP/EEA Air Pollutant Emission Inventory Guidebook 2013; Publications Office of the European Union: Luxembourg, 2013; ISBN 978-92-9213-403-7. [Google Scholar]
  35. European Environment Agency (EEA). EMEP/EEA Air Pollutant Emission Inventory Guidebook 2016; Publications Office of the European Union: Luxembourg, 2016; ISBN 978-92-9213-806-6. [Google Scholar]
  36. Guinée, J.B.; Gorrée, M.; Heijungs, R.; Huppes, G.; Kleijn, R.; de Koning, A.; van Oers, L.; Wegener Sleeswijk, A.; Suh, S.; Udo de Haes, H.A.; et al. Handbook on Life Cycle Assessment. Operational Guide to the ISO Standards. I: LCA in Perspective. IIa: Guide. IIb: Operational Annex. III: Scientific Background; Kluwer Academic Publishers: Dordrecht, The Netherlands, 2002; ISBN 978-0-306-48055-3. [Google Scholar]
  37. Intergovernmental Panel on Climate Change (IPCC). Climate Change 2013. In The Physical Science Basis. Contribution of Working Group I to the Fifth Assessment Report of the Intergovernmental Panel on Climate Change; Stocker, T.F., Qin, D., Plattner, G.-K., Tignor, M., Allen, S.K., Boschung, J., Nauels, A., Xia, Y., Bex, V., Midgley, P.M., Eds.; Cambridge University Press: Cambridge, UK; New York, NY, USA, 2013; ISBN 978-1-107-85799-1. [Google Scholar]
  38. Petersen, B.; Knudsen, M.; Hermansen, J.; Halberg, N. An approach to include soil carbon changes in life cycle assessments. J. Clean. Prod. 2013, 52, 217–224. [Google Scholar] [CrossRef]
  39. Rebitzer, G.; Ekvall, T.; Frischknecht, R.; Hunkeler, D.; Norris, G.; Rydberg, T.; Schmidt, W.-P.; Suh, S.; Weidema, B.P.; Pennington, D.W. Life cycle assessment. Part 1: Framework, goal and scope definition, inventory analysis and applications. Environ. Int. 2004, 30, 701–720. [Google Scholar] [CrossRef] [PubMed]
  40. Muzalewski, A. Koszty Eksploatacji Maszyn; ITP: Falenty-Warsaw, Poland, 2010; ISBN 978-83-62416-05-9. [Google Scholar]
  41. Camargo, G.G.T.; Ryan, M.R.; Richard, T.L. Energy use and greenhouse gas emissions from crop production using the farm energy analysis tool. BioScience 2013, 63, 263–273. [Google Scholar] [CrossRef] [Green Version]
  42. Jayasundara, S.; Wagner-Riddle, C.; Dias, G.; Kariyapperuma, K.A. Energy and greenhouse gas intensity of corn (Zea mays L.) production in Ontario: A regional assessment. Can. J. Soil Sci. 2014, 94, 77–95. [Google Scholar] [CrossRef]
  43. Ma, B.L.; Liang, B.C.; Biswas, D.K.; Morrison, M.J.; McLaughlin, N.B. The carbon footprint of maize production as affected by nitrogen fertilizer and maize-legume rotations. Nutr. Cycl. Agroecosyst. 2012, 94, 15–31. [Google Scholar] [CrossRef]
  44. Jarosz, Z.; Księżak, J.; Faber, A. Ocena wielkości emisji gazów cieplarnianych systemów uprawy stosowanych w kukurydzy wykorzystywanej do produkcji bioetanolu. Rocz. Nauk. SERiA 2017, 19, 60–65. [Google Scholar] [CrossRef]
  45. Khorramdel, S.; Koocheki, A.; Nassiri-Mahallati, M.; Khorassani, R.; Ghorbani, R. Evaluation of carbon sequestration potential in corn fields with different management systems. Soil Till. Res. 2013, 133, 25–31. [Google Scholar] [CrossRef]
  46. Liu, C.; Cutforth, H.; Chai, Q.; Gan, Y. Farming tactics to reduce the carbon footprint of crop cultivation in semiarid areas. A review. Agron. Sustain. Dev. 2016, 36, 69. [Google Scholar] [CrossRef] [Green Version]
  47. Parajuli, R.; Kristensen, I.S.; Knudsen, M.T.; Mogensen, L.; Corona, A.; Birkved, M.; Peña, N.; Graversgaard, M.; Dalgaard, T. Environmental life cycle assessments of producing maize, grass-clover, ryegrass and winter wheat straw for biorefinery. J. Clean. Prod. 2017, 142, 3859–3871. [Google Scholar] [CrossRef] [Green Version]
  48. Bacenetti, J.; Fusi, A.; Guidetti, R.; Fiala, M. Life Cycle Assessment of maize cultivation for biogas production. J. Agric. Eng. 2013, 44. [Google Scholar] [CrossRef]
  49. McGill, B.M.; Hamilton, S.K.; Millar, N.; Robertson, G.P. The greenhouse gas cost of agricultural intensification with groundwater irrigation in a Midwest U.S. row cropping system. Glob. Chang. Biol. 2018, 24, 5948–5960. [Google Scholar] [CrossRef] [PubMed] [Green Version]
Figure 1. The location of the studied farms in the Wielkopolska region (Poland).
Agronomy 10 01877 g001
Figure 2. Maize cultivation in three soil tillage systems: (a) conventional tillage; (b) reduced tillage; (c) no-tillage.
Agronomy 10 01877 g002
Figure 3. Four phases of life-cycle assessment in the study.
Agronomy 10 01877 g003
Figure 4. System boundaries of the life cycle of grain maize production from “cradle-to-farm gate”.
Agronomy 10 01877 g004
Figure 5. Results of the carbon footprint (CF) and the net carbon footprint (CF net) after inclusion of soil organic carbon sequestration (C seq.) for the grain maize production in conventional tillage (CT), reduced tillage (RT) and no-tillage (NT): (a) per one hectare of area; (b) per one ton of grain.
Agronomy 10 01877 g005
Figure 6. Contribution of field operations to the carbon footprint of the maize production in conventional tillage (CT), reduced tillage (RT) and no-tillage (NT).
Agronomy 10 01877 g006
Figure 7. The sensitivity analysis of input parameters for the carbon footprint of the grain maize production in conventional tillage (CT), reduced tillage (RT), and no-tillage (NT). * Without application of organic fertilizers.
Agronomy 10 01877 g007
Figure 8. Life-cycle costs of maize production in conventional tillage (CT), reduced tillage (RT) and no-tillage (NT): (a) per one hectare of area; (b) per one ton of grain.
Agronomy 10 01877 g008
Figure 9. Contribution of field operations to the life-cycle costs of the maize production in conventional tillage (CT), reduced tillage (RT) and no-tillage (NT).
Agronomy 10 01877 g009
Table 1. Characteristics of studied farms representing grain maize production in conventional tillage (CT), reduced tillage (RT) and no-tillage (NT) systems (averages from the study years with min–max range in parentheses).
SpecificationCTRTNT
Number of farms555
UAA (ha)59.4 (18.4–100.8)69.5 (29.9–112.7)72.6 (28.8–144.9)
Share of arable lands (%)94.0 (89.4–99.3)93.3 (85.0–100.0)98.2 (95.2–100.0)
Share of permanent grasslands (%)6.0 (0.5–10.6)6.7 (0.0–15.0)1.8 (0.0–4.8)
Livestock density (LSU/ha UAA)0.5 (0.0–1.7)0.4 (0.0–1.4)0.4 (0.0–2.1)
Cropping pattern (%)
Cereals75.1 (28.6–100.0)69.2 (59.6–93.8)79.1 (54.7–100.0)
Root crops4.2 (0.0–13.0)17.7 (6.3–38.4)5.2 (0.0–20.0)
Oilseed plants2.8 (0.0–23.9)4.3 (0.0–16.2)11.6 (0.0–28.1)
Other plants17.9 (0.0–58.4)8.8 (0.0–30.0)4.1 (0.0–20.7)
UAA, utilized agricultural area; LSU, livestock unit.
Table 2. Inventory data of main inputs and internal costs for grain maize production in conventional tillage (CT), reduced tillage (RT) and no-tillage (NT) systems.
Type of InputConsumptionCost (EUR)
per 1 haper 1 tper 1 haper 1 t
CTRTNTCTRTNTCTRTNTCTRTNT
Seeds (kg)21.117.927.21.661.442.59100.585.2129.47.916.8712.3
N fertilizers (kg N)129.2143.8113.710.211.610.891.0102.679.37.178.277.55
P fertilizers (kg P2O5)75.362.047.85.935.004.5562.049.040.14.883.953.82
K fertilizers (kg K2O)97.799.3106.57.698.0010.159.861.562.34.714.965.93
Organic fertilizers (kg N)49.337.40.03.883.020.000.00.00.00.000.000.00
Organic fertilizers (kg P2O5)40.827.90.03.212.250.000.00.00.00.000.000.00
Organic fertilizers (kg K2O)97.265.10.07.655.250.000.00.00.00.000.000.00
Herbicides (kg a.s.)0.20.71.40.020.060.1351.237.656.24.033.035.35
Fungicides (kg a.s.)0.00.00.050.000.000.0050.00.010.10.000.000.96
Insecticides (kg a.s.)0.010.010.010.0010.0010.0012.32.24.00.180.180.38
Agricultural machinery (kg)14.812.56.41.171.010.61111.565.160.38.785.255.74
Spare parts (kg)4.63.92.00.360.320.1948.332.831.53.802.653.00
Diesel oil (kg)87.477.151.86.886.224.9392.581.661.17.286.585.82
N, nitrogen; P, phosphorus, K, potassium; a.s., active substance.
Publisher’s Note: MDPI stays neutral with regard to jurisdictional claims in published maps and institutional affiliations.

