Differential Ozone Responses Identified among Key Rust-Susceptible Wheat Genotypes

 ,
,  ,
, 
 ,
, 

Abstract
1. Introduction
2. Materials and Methods
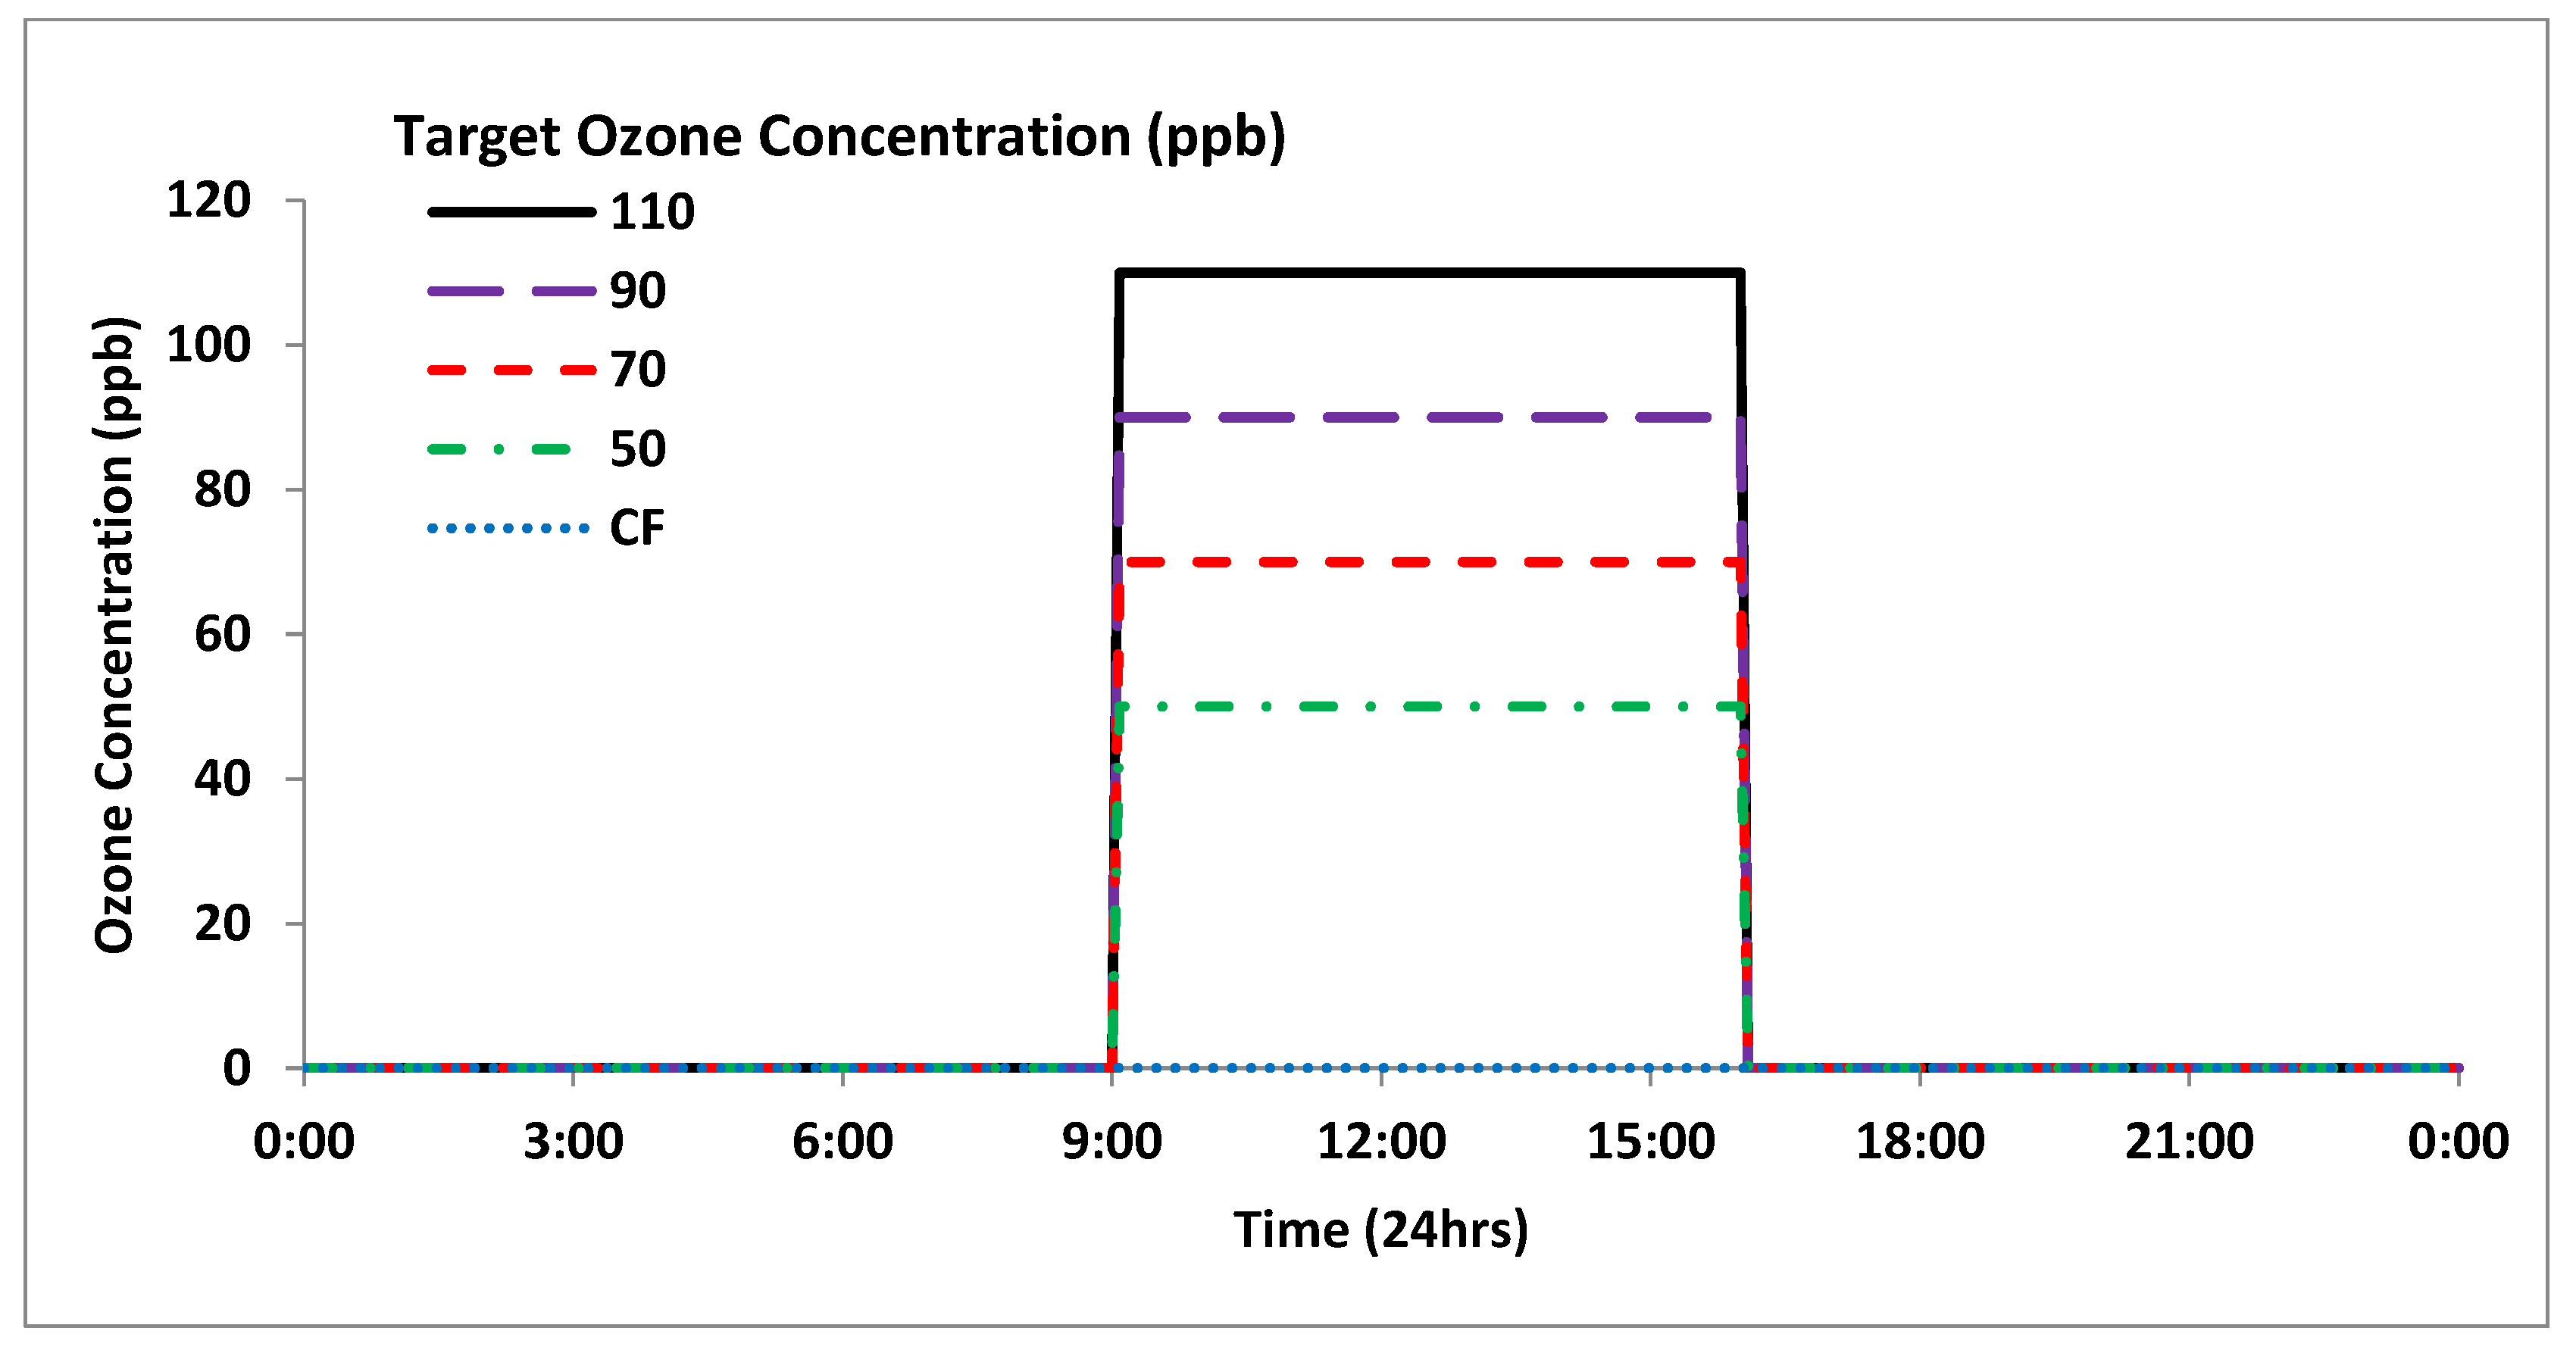
2.1. Exposure Systems
2.1.1. Continuous Stirred Tank Reactors (CSTRs)
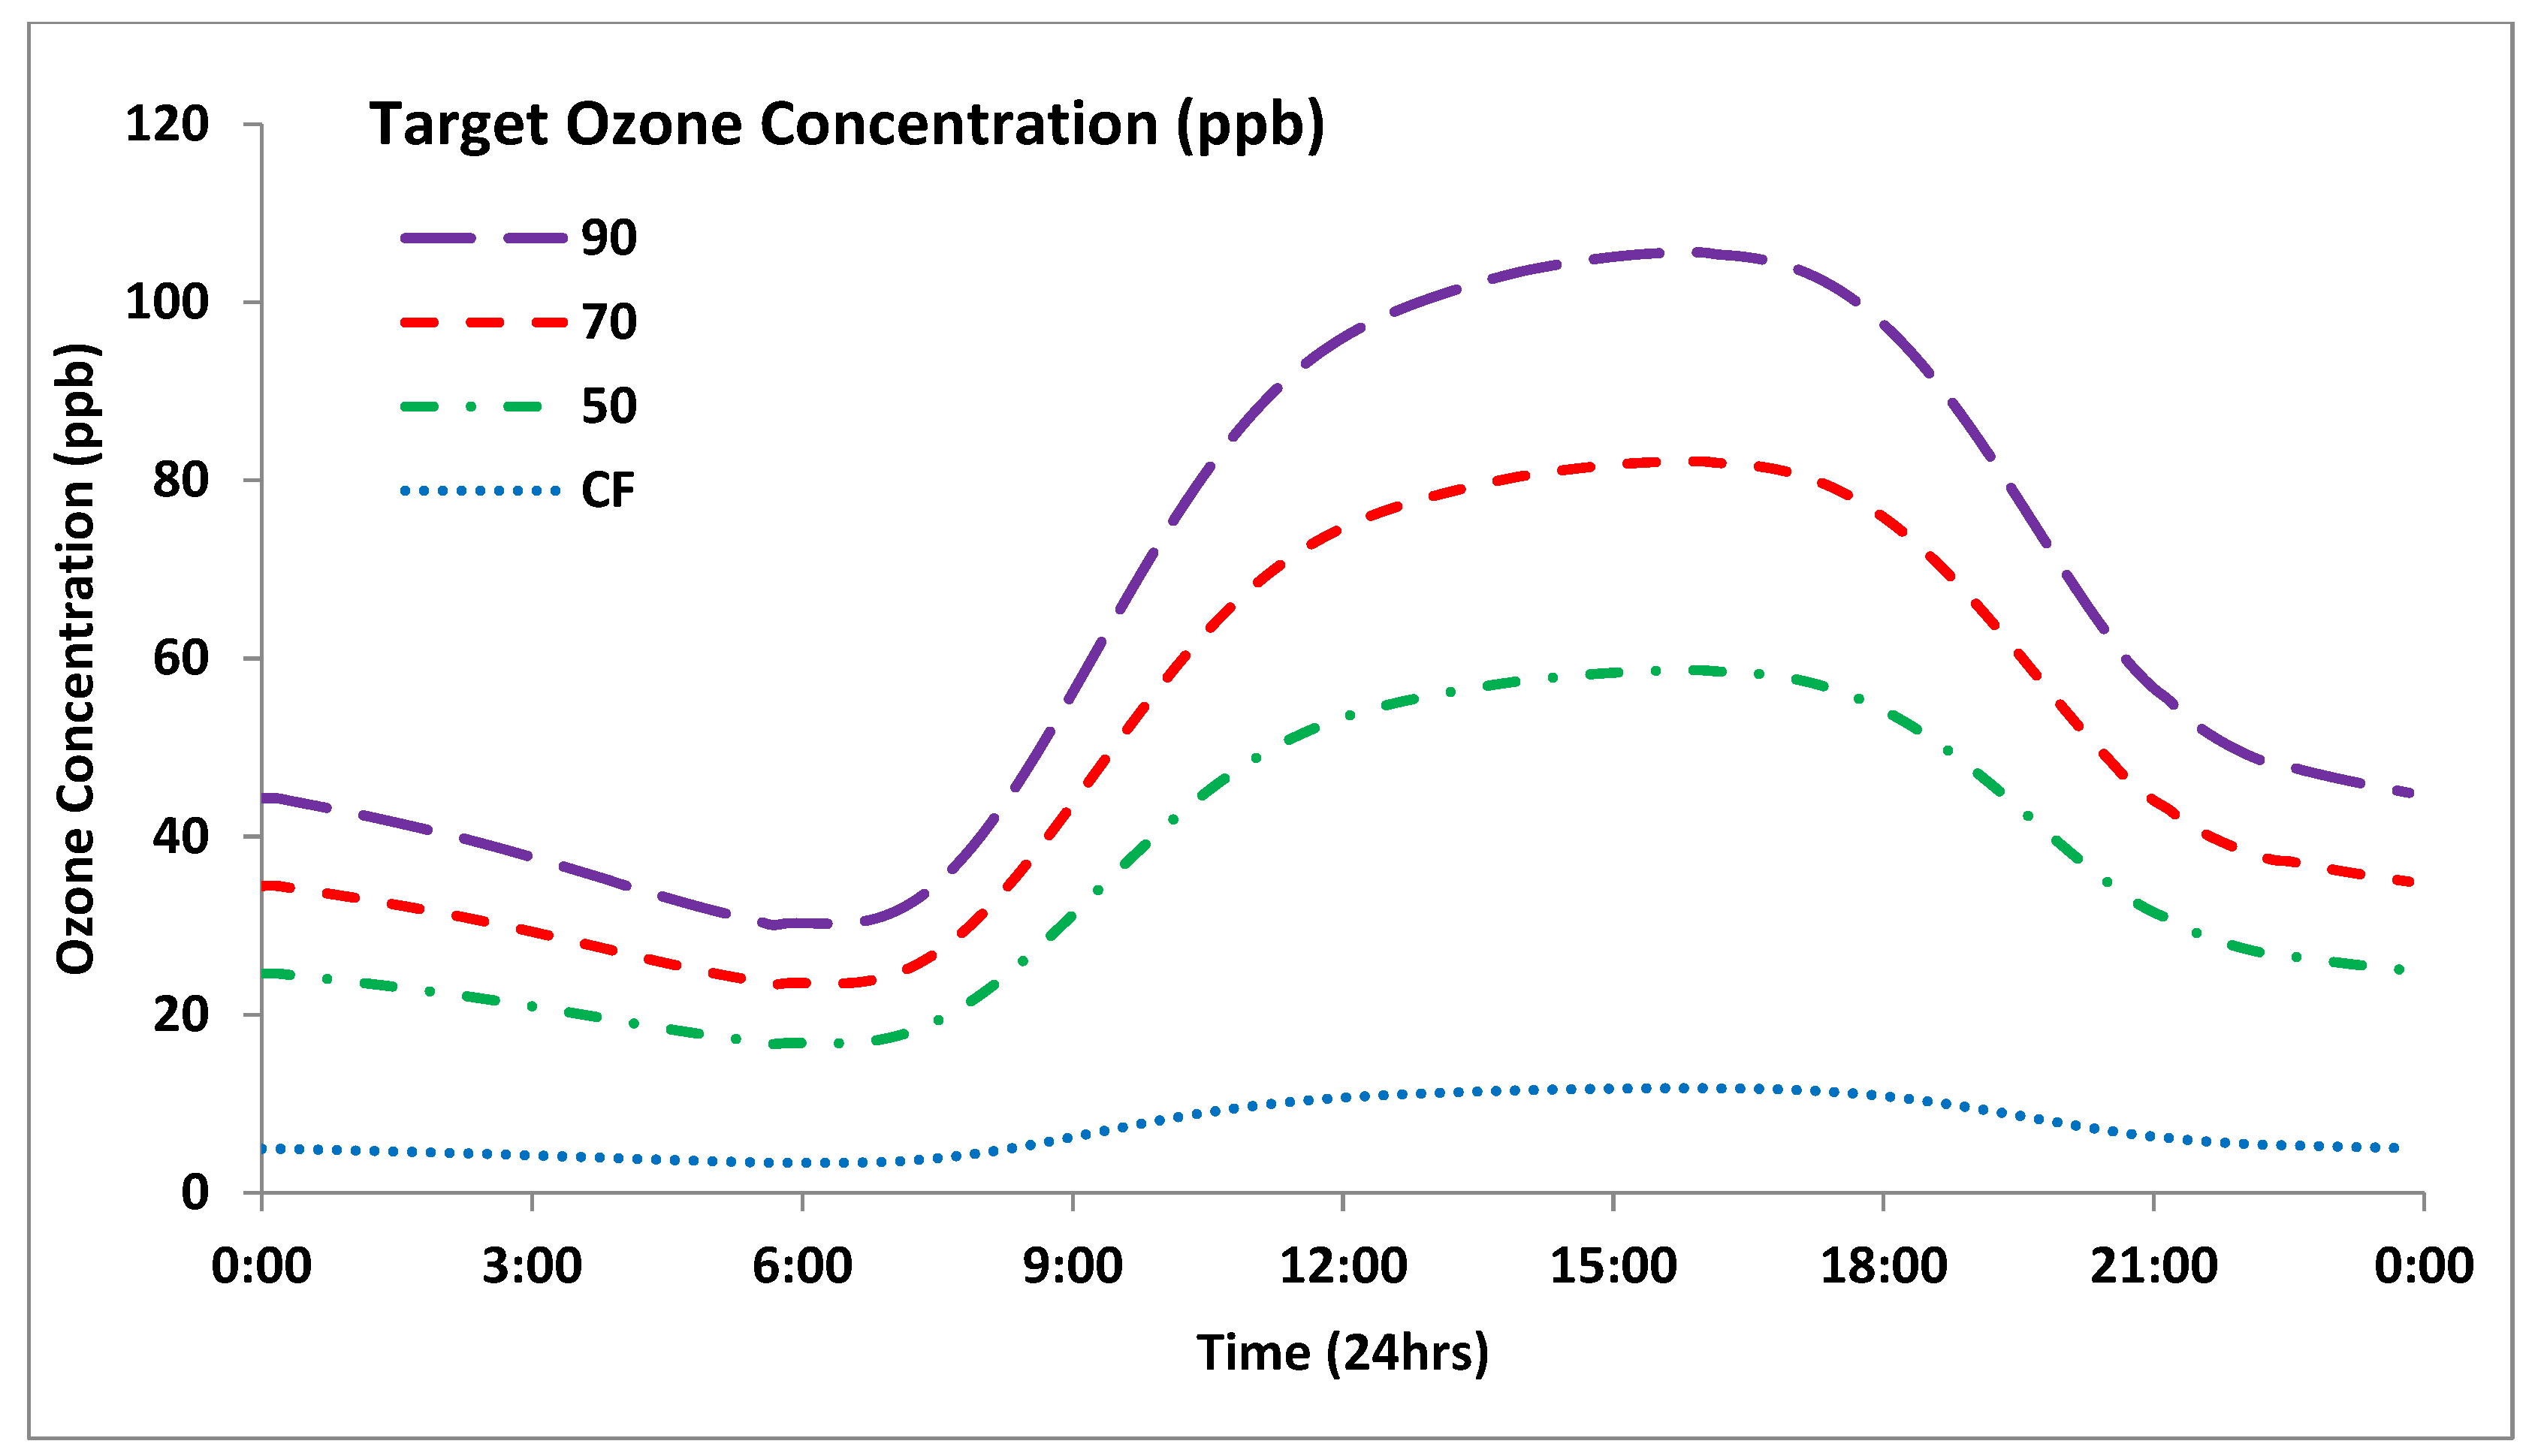
2.1.2. Outdoor-Plant Environment Chambers (OPECs)
2.2. Plant Materials
2.3. Ozone Treatment and Experimental Design
2.4. Effects of O3 on Growth Rate
- Dry Matter Accumulation Rate (DMAR)
- Relative Growth Rate (RGR)
- Percent Relative Growth Rate (PRGR)
2.4.1. Initial Dry Weight Uniformity and Its Impact on DMAR
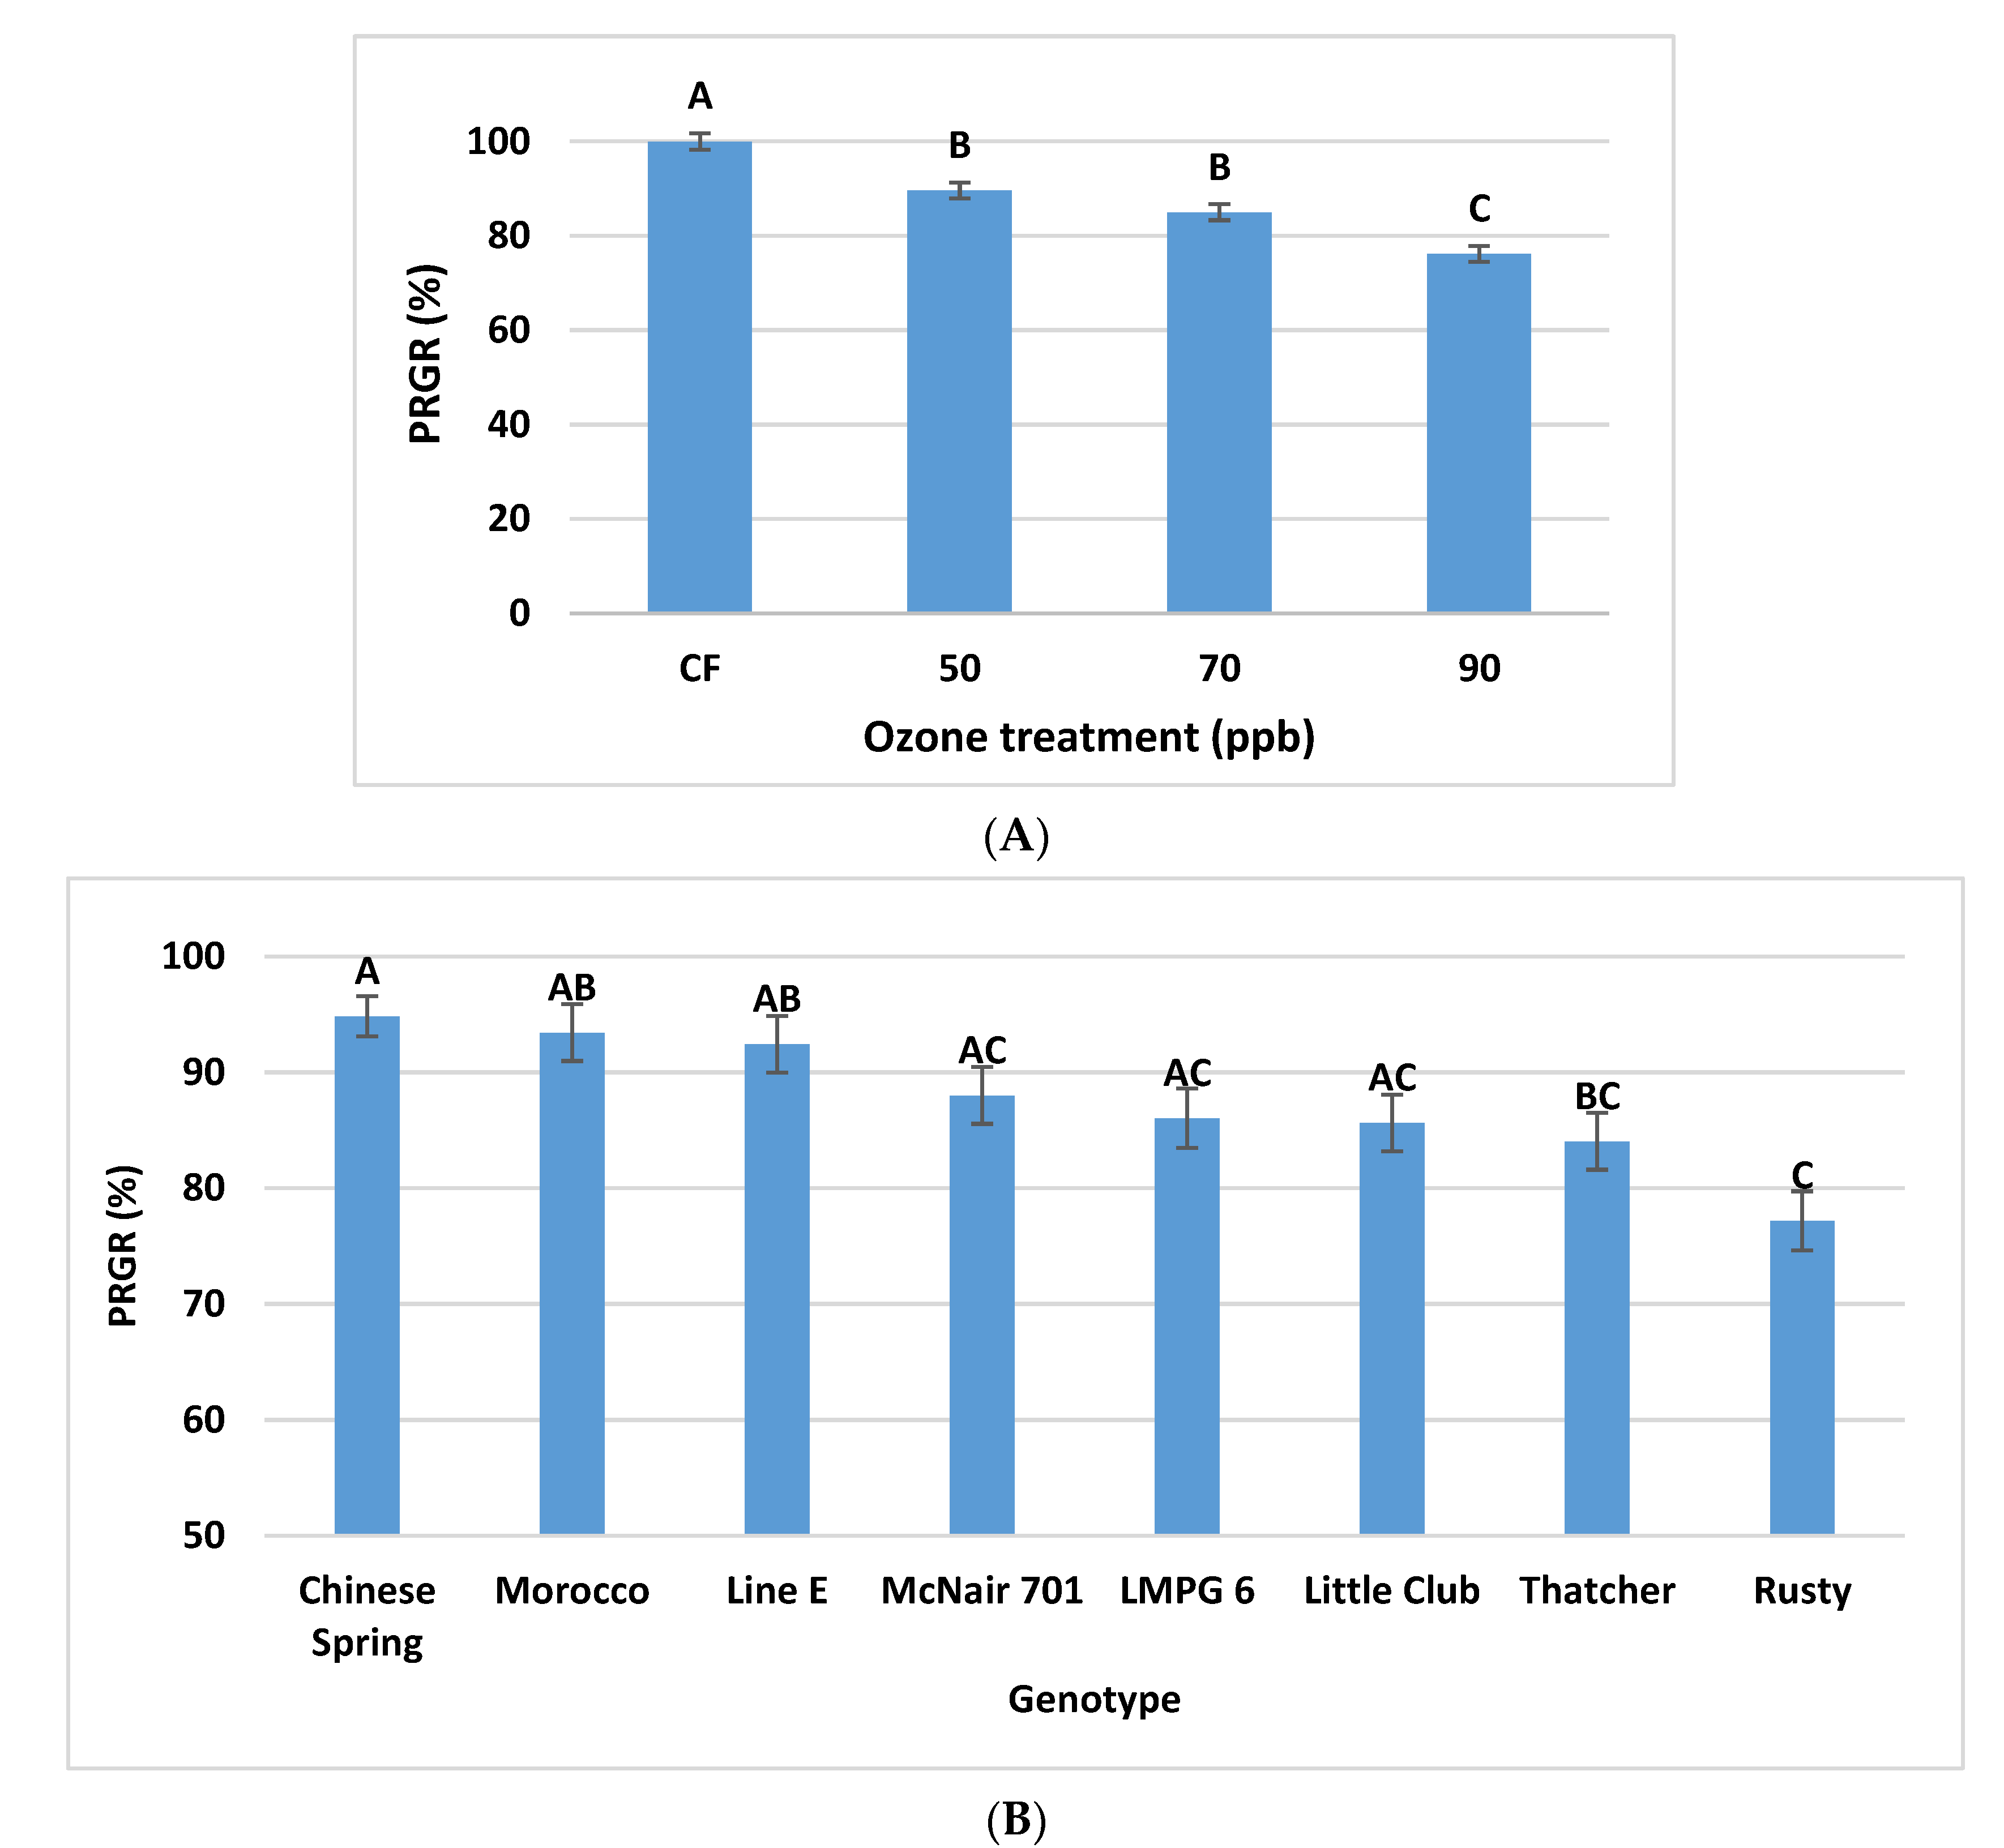
2.4.2. Effects of O3 Stress on PRGR
2.5. Ozone Injury Assessment
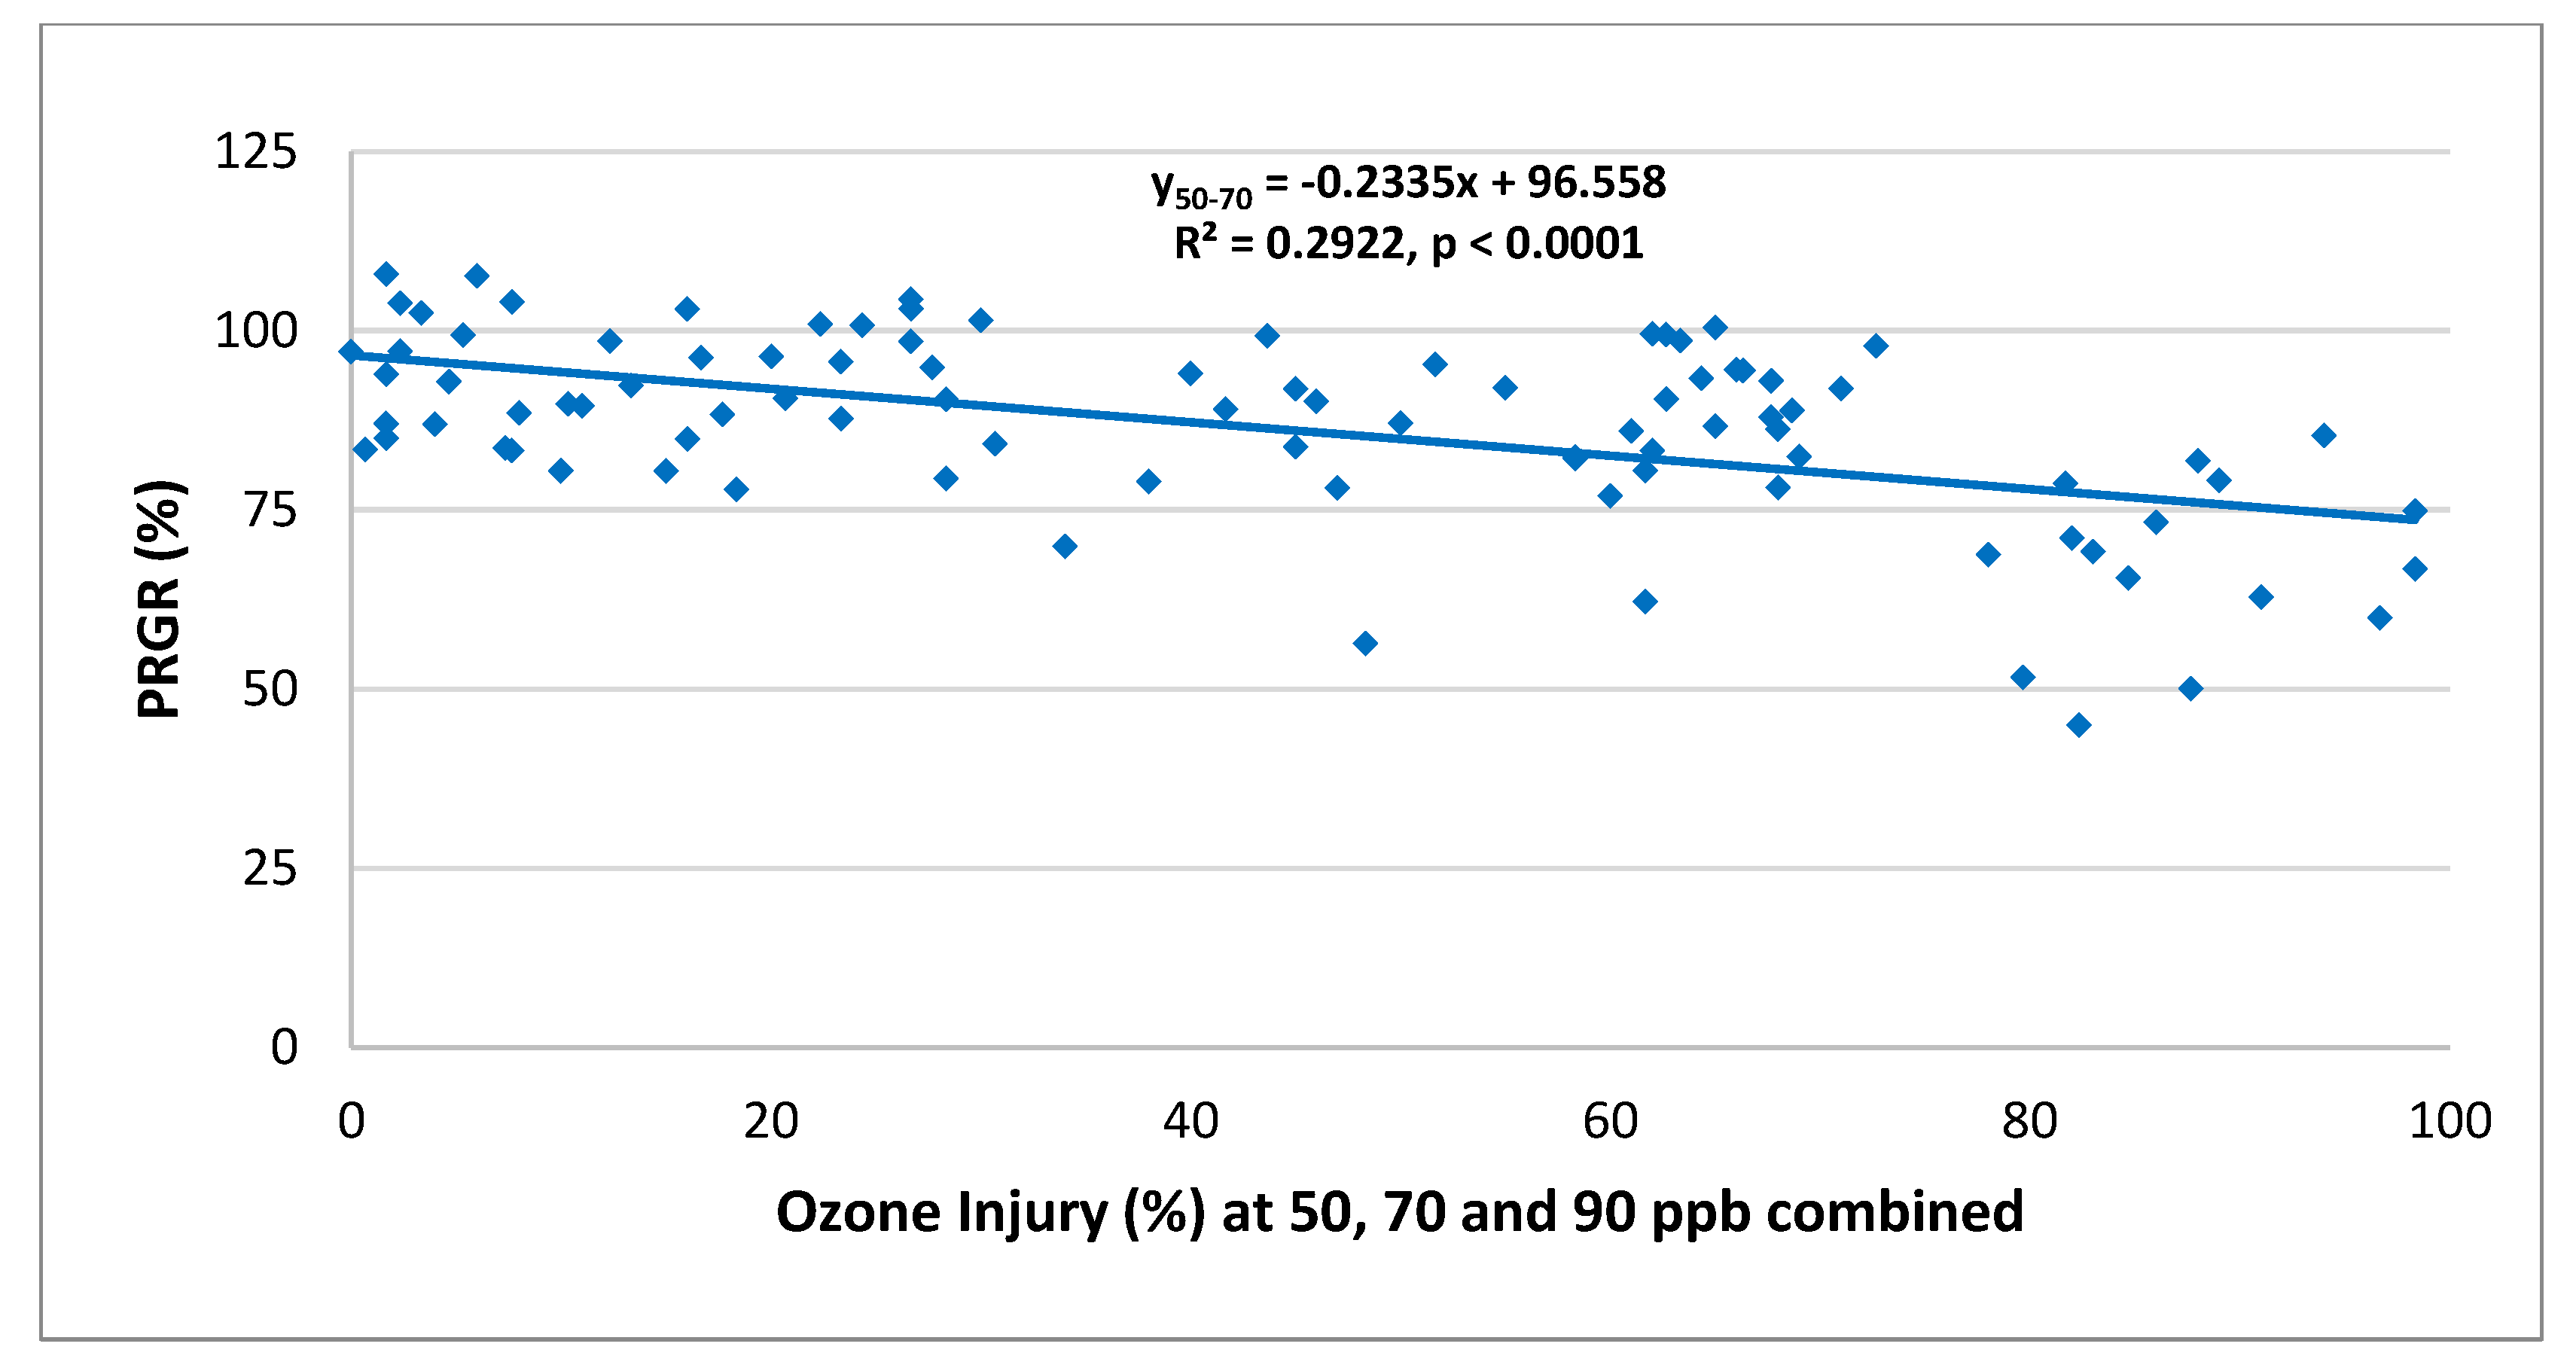
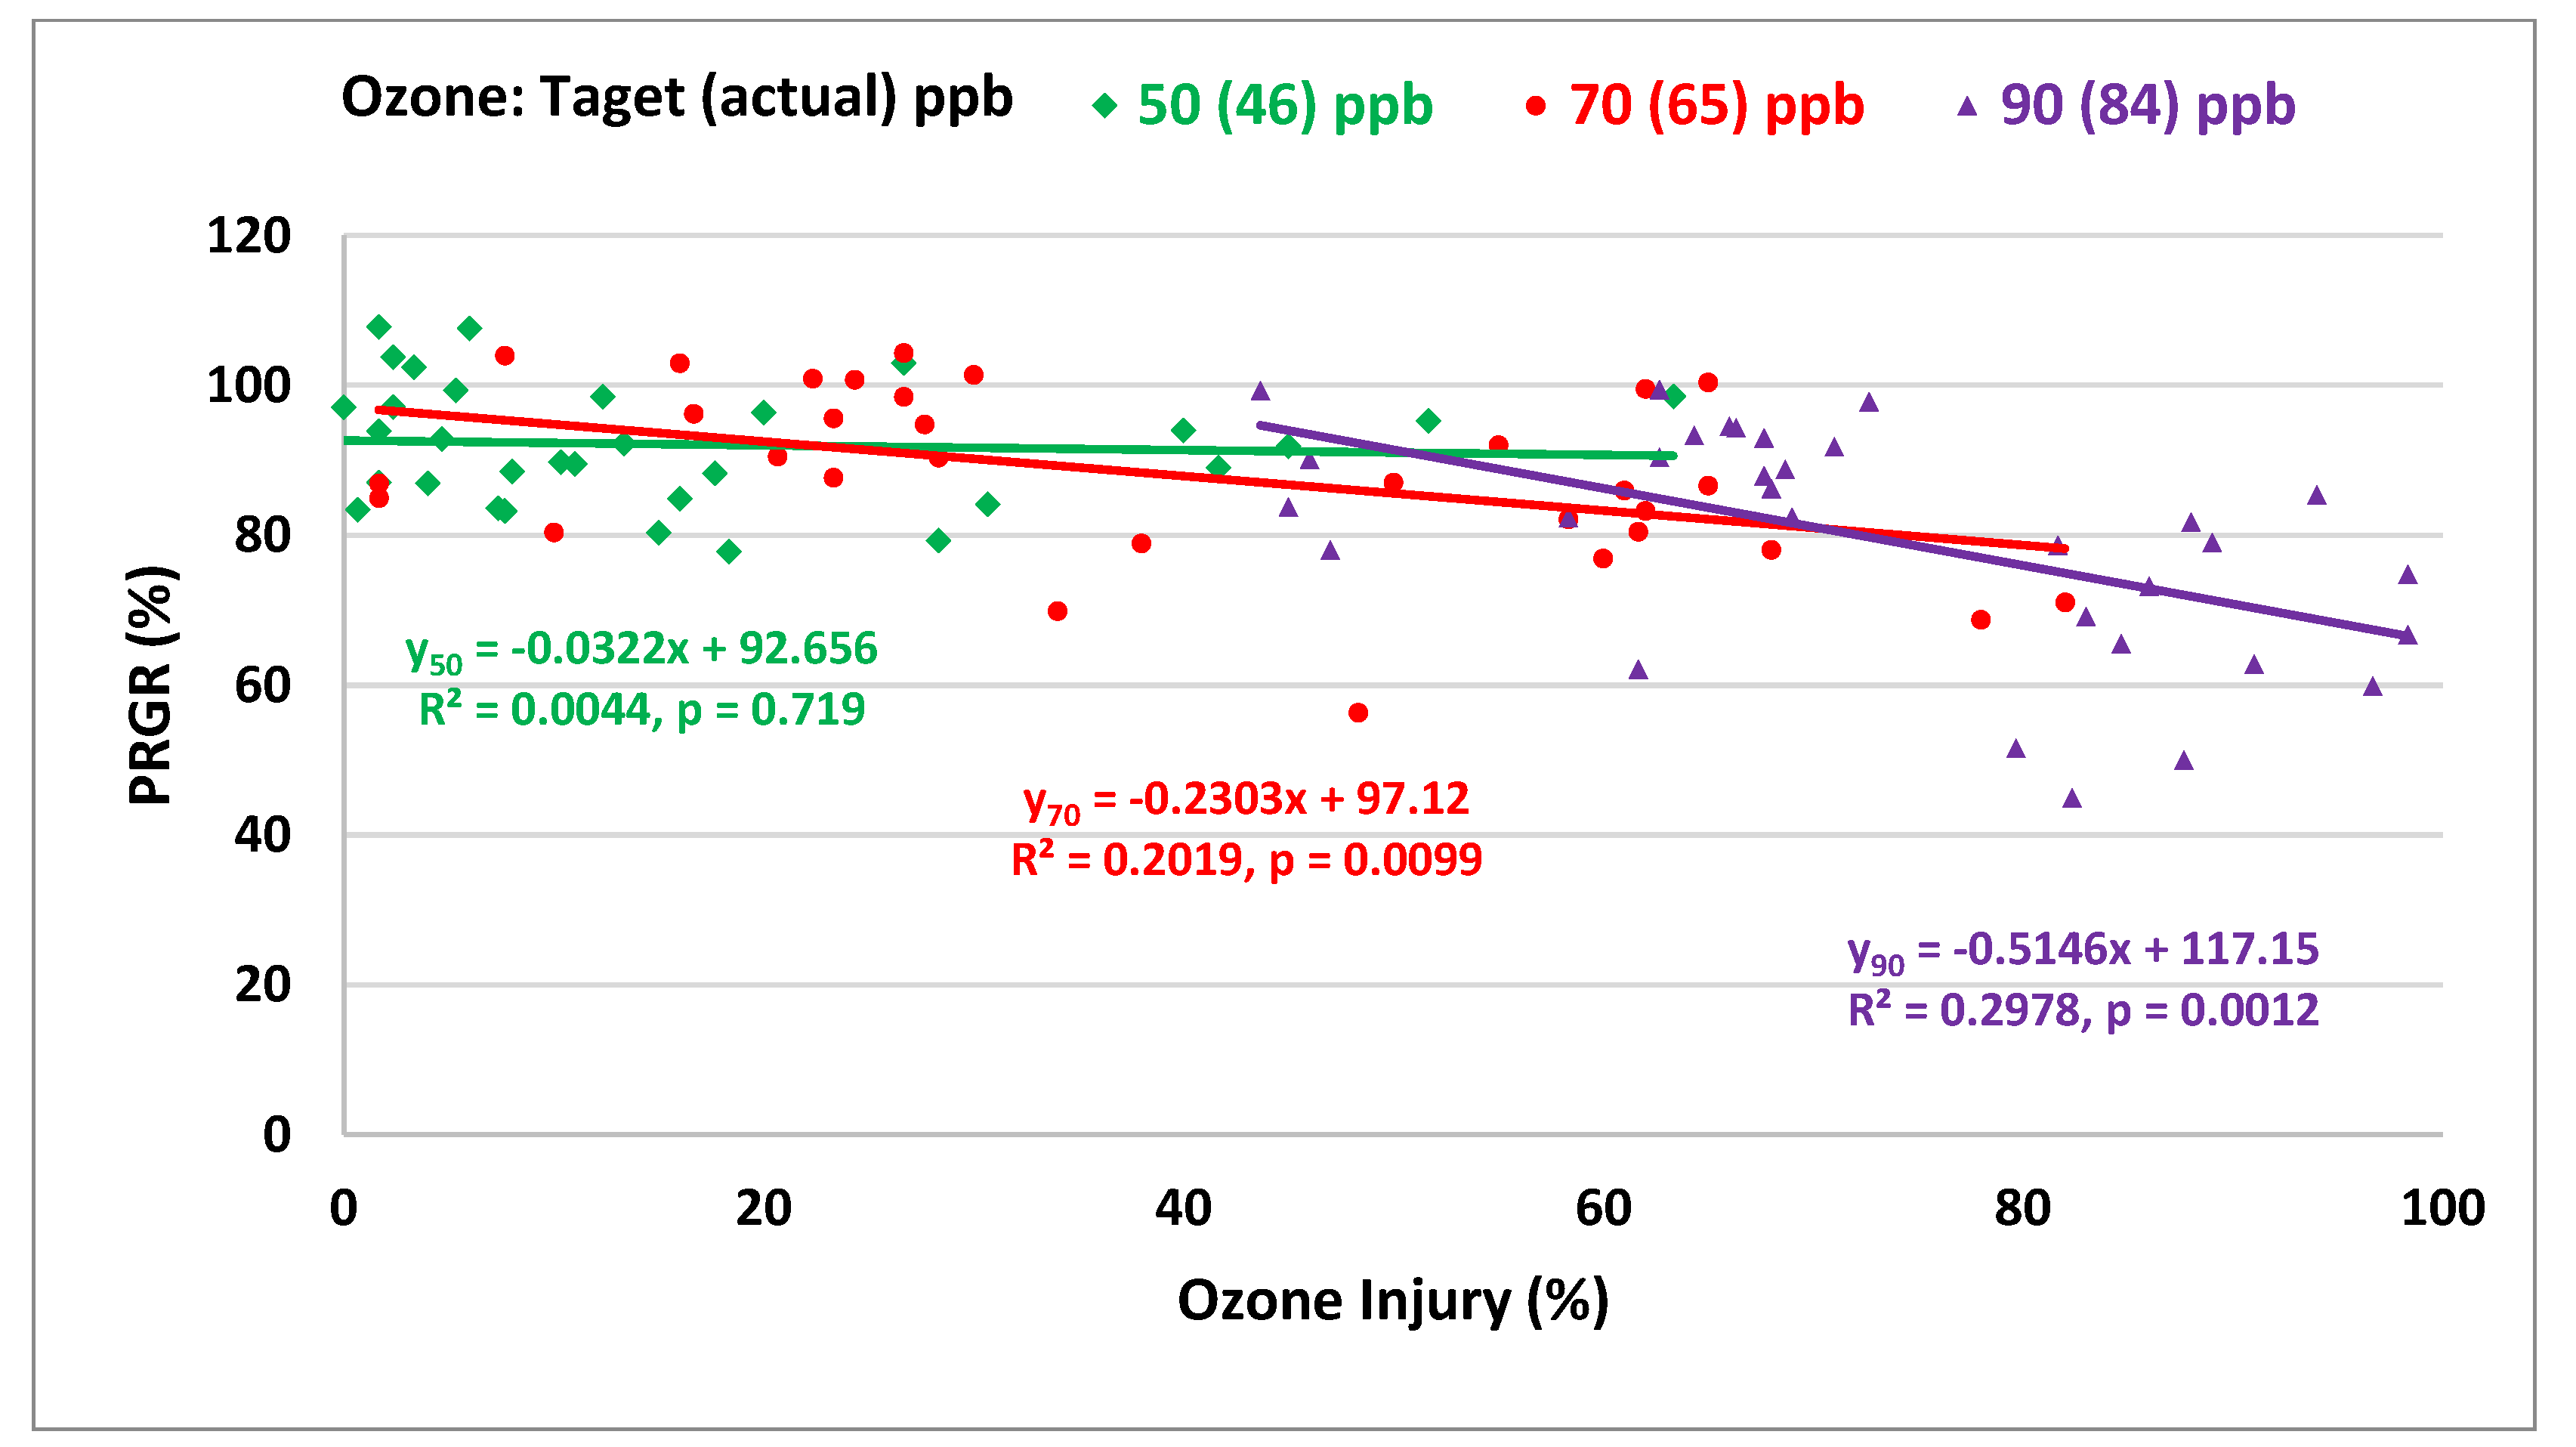
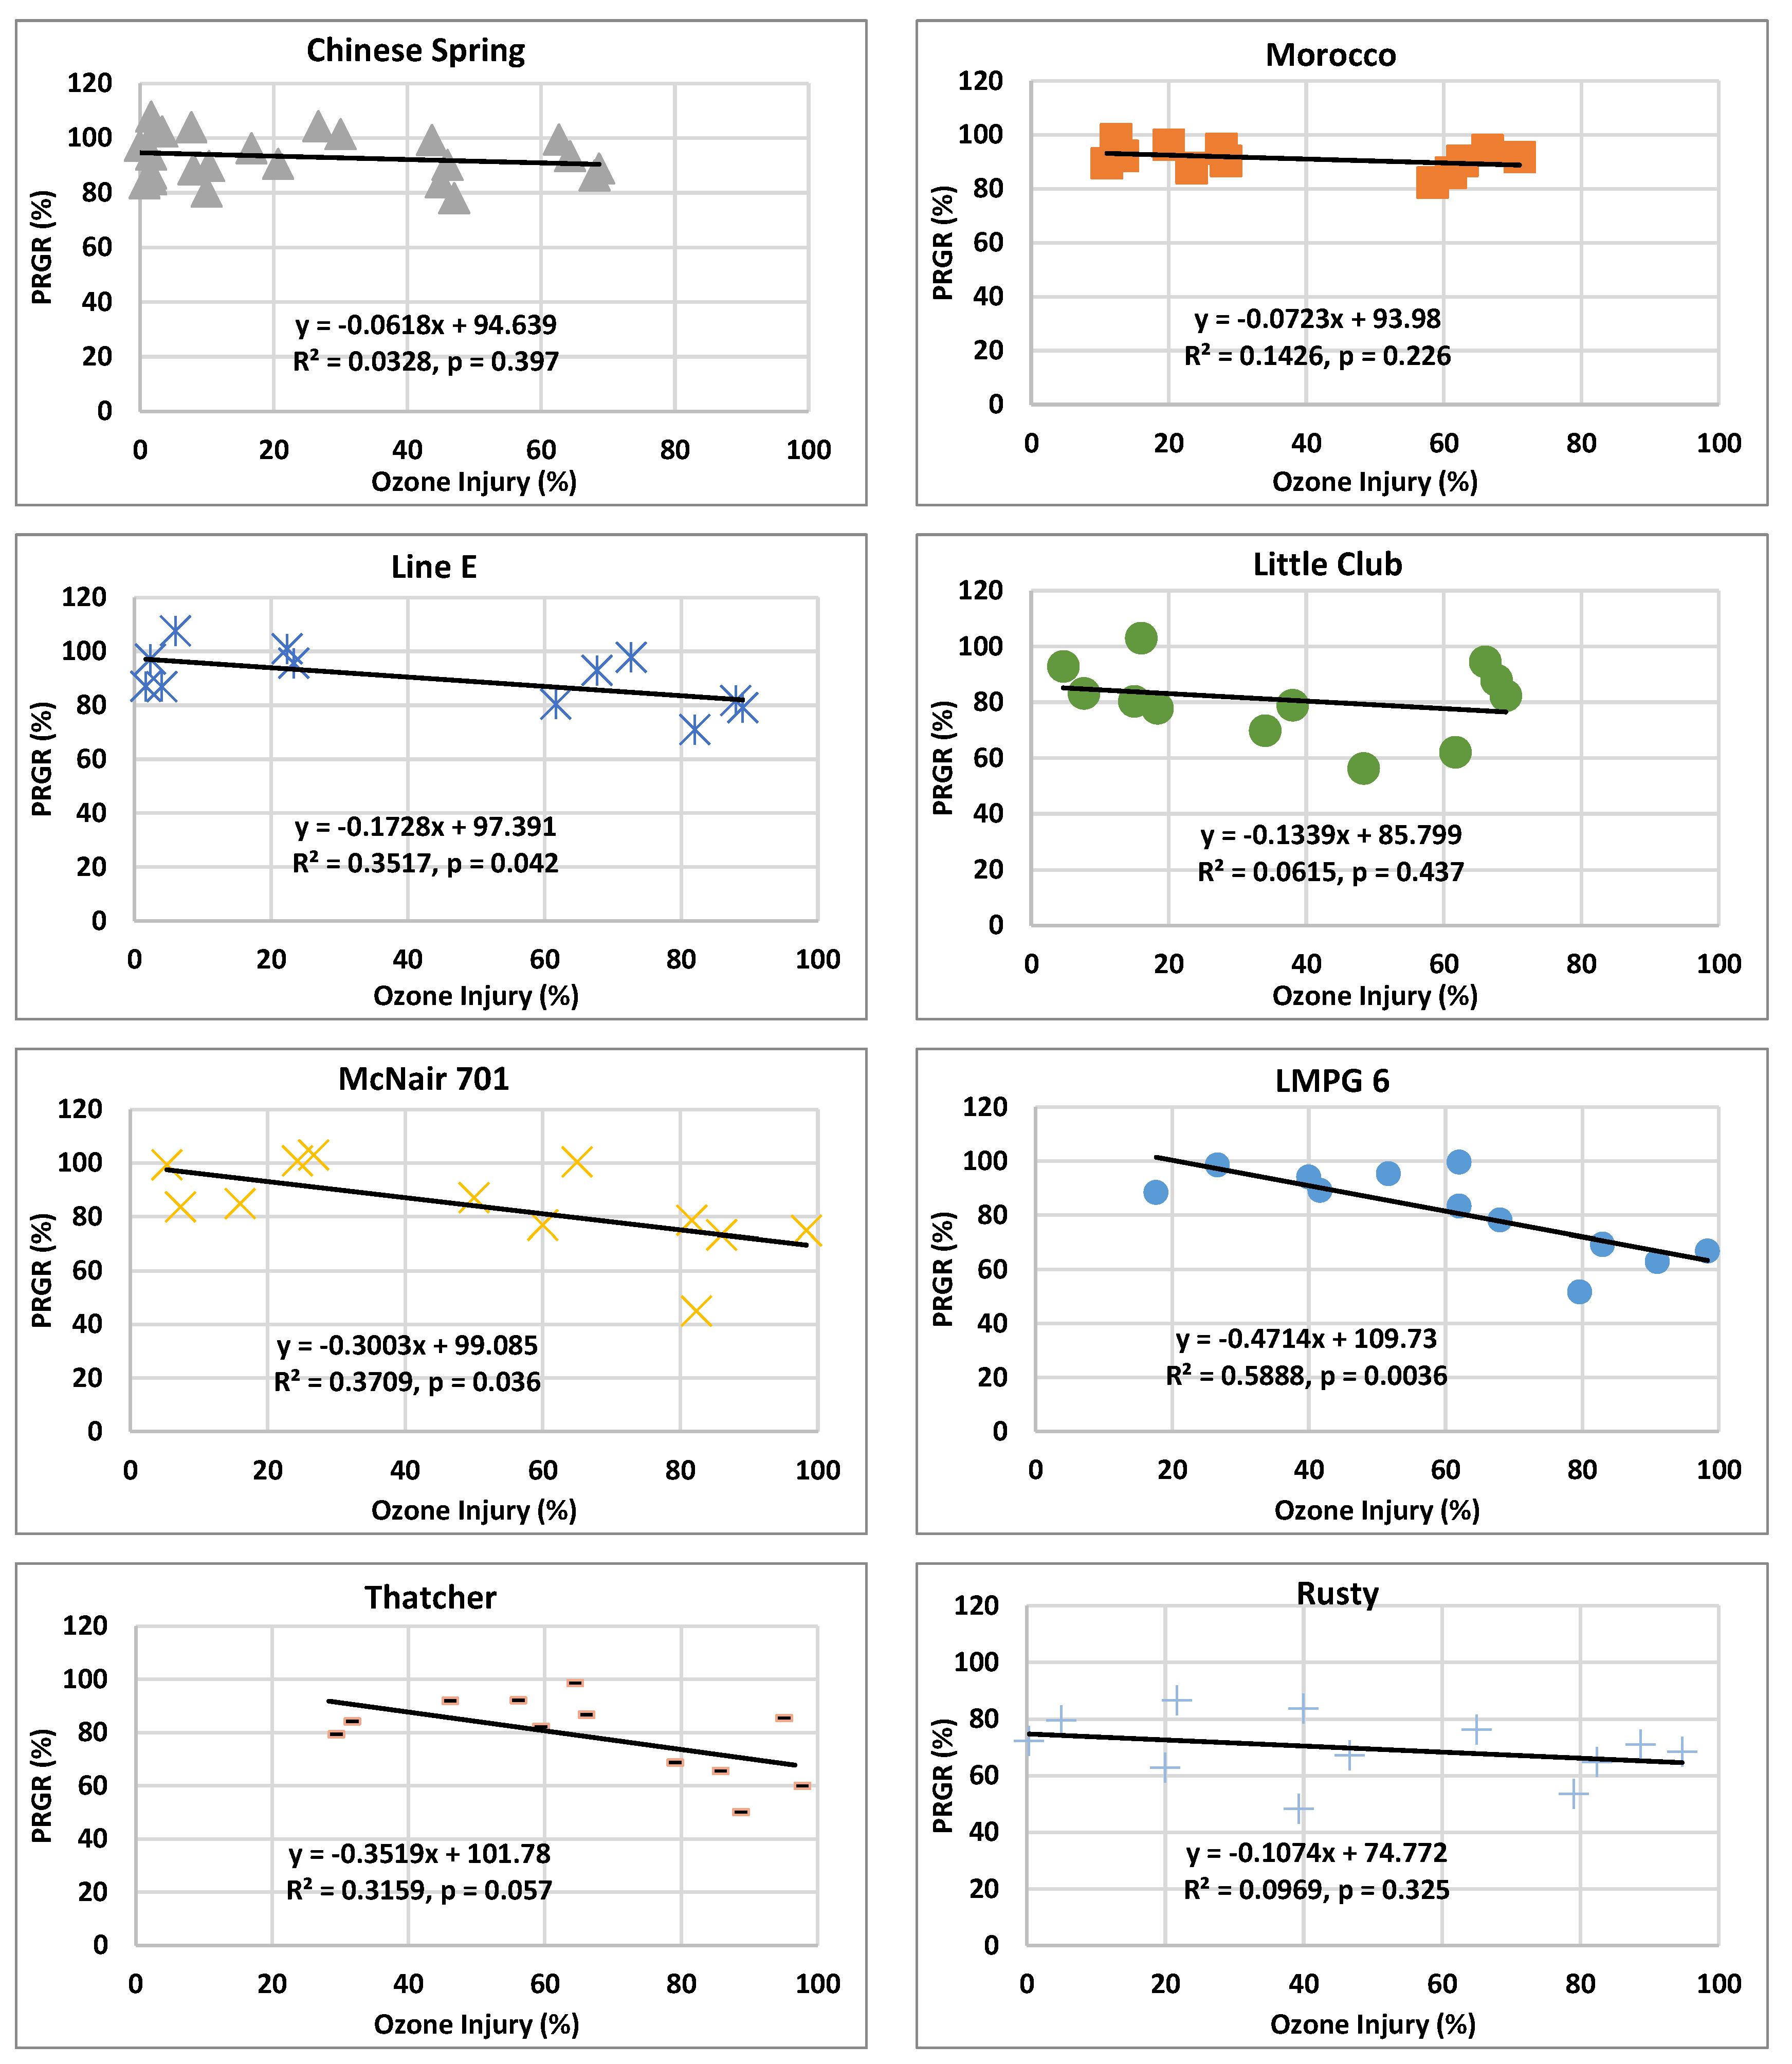
2.6. Relationship between O3 Visible Injury and Relative Growth Rate Responses
2.7. Statistical Analysis
3. Results
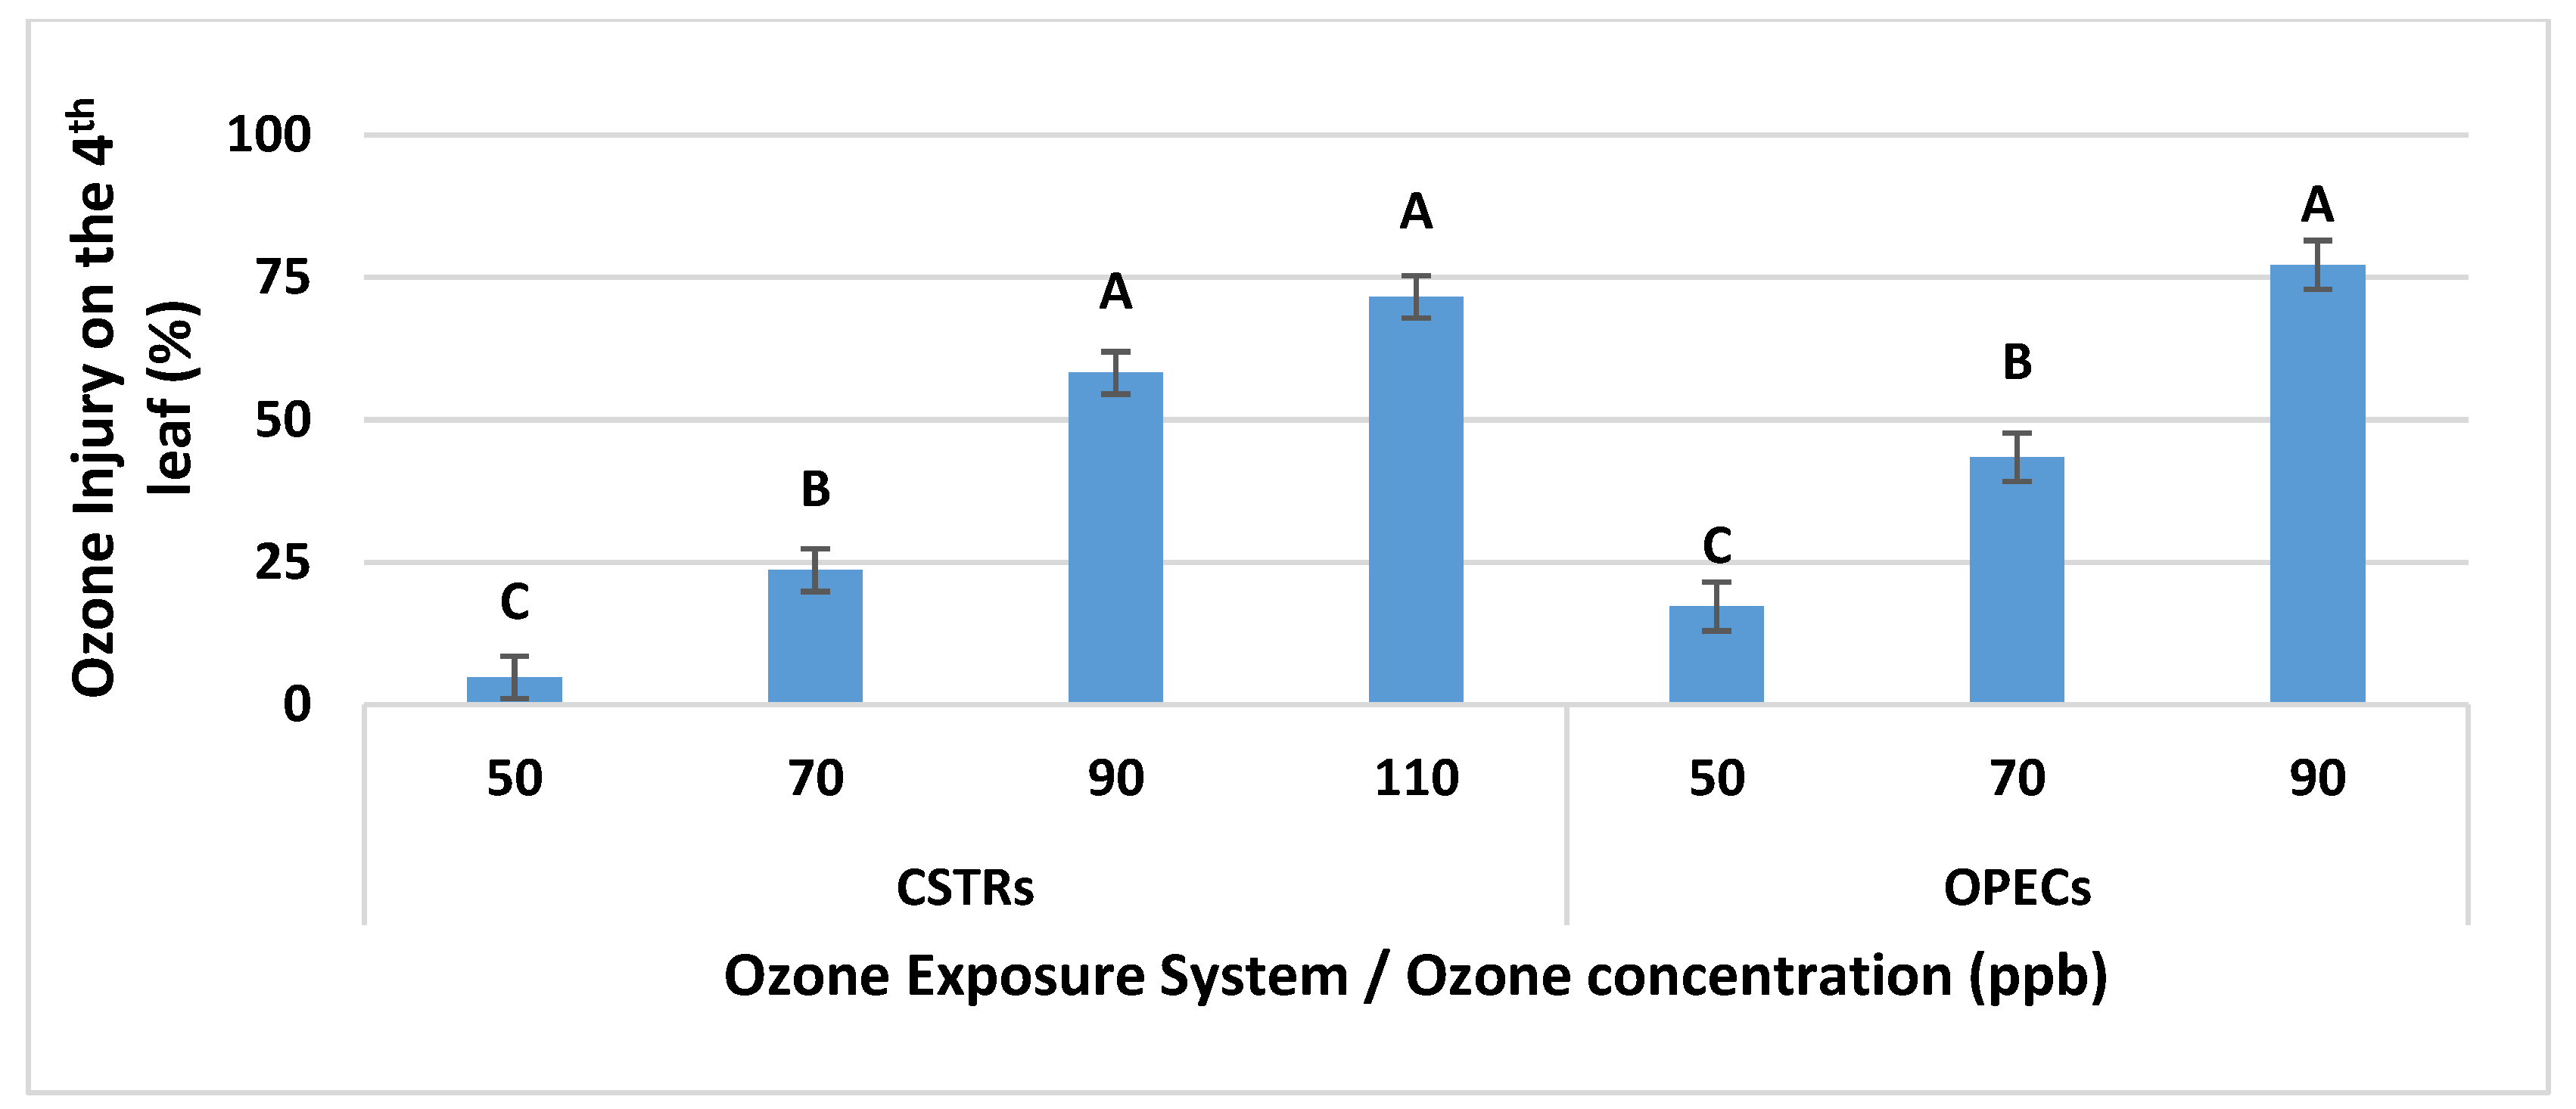
3.1. Ozone Injury
3.1.1. Main Effects of Tested O3 Treatments on O3 Injury
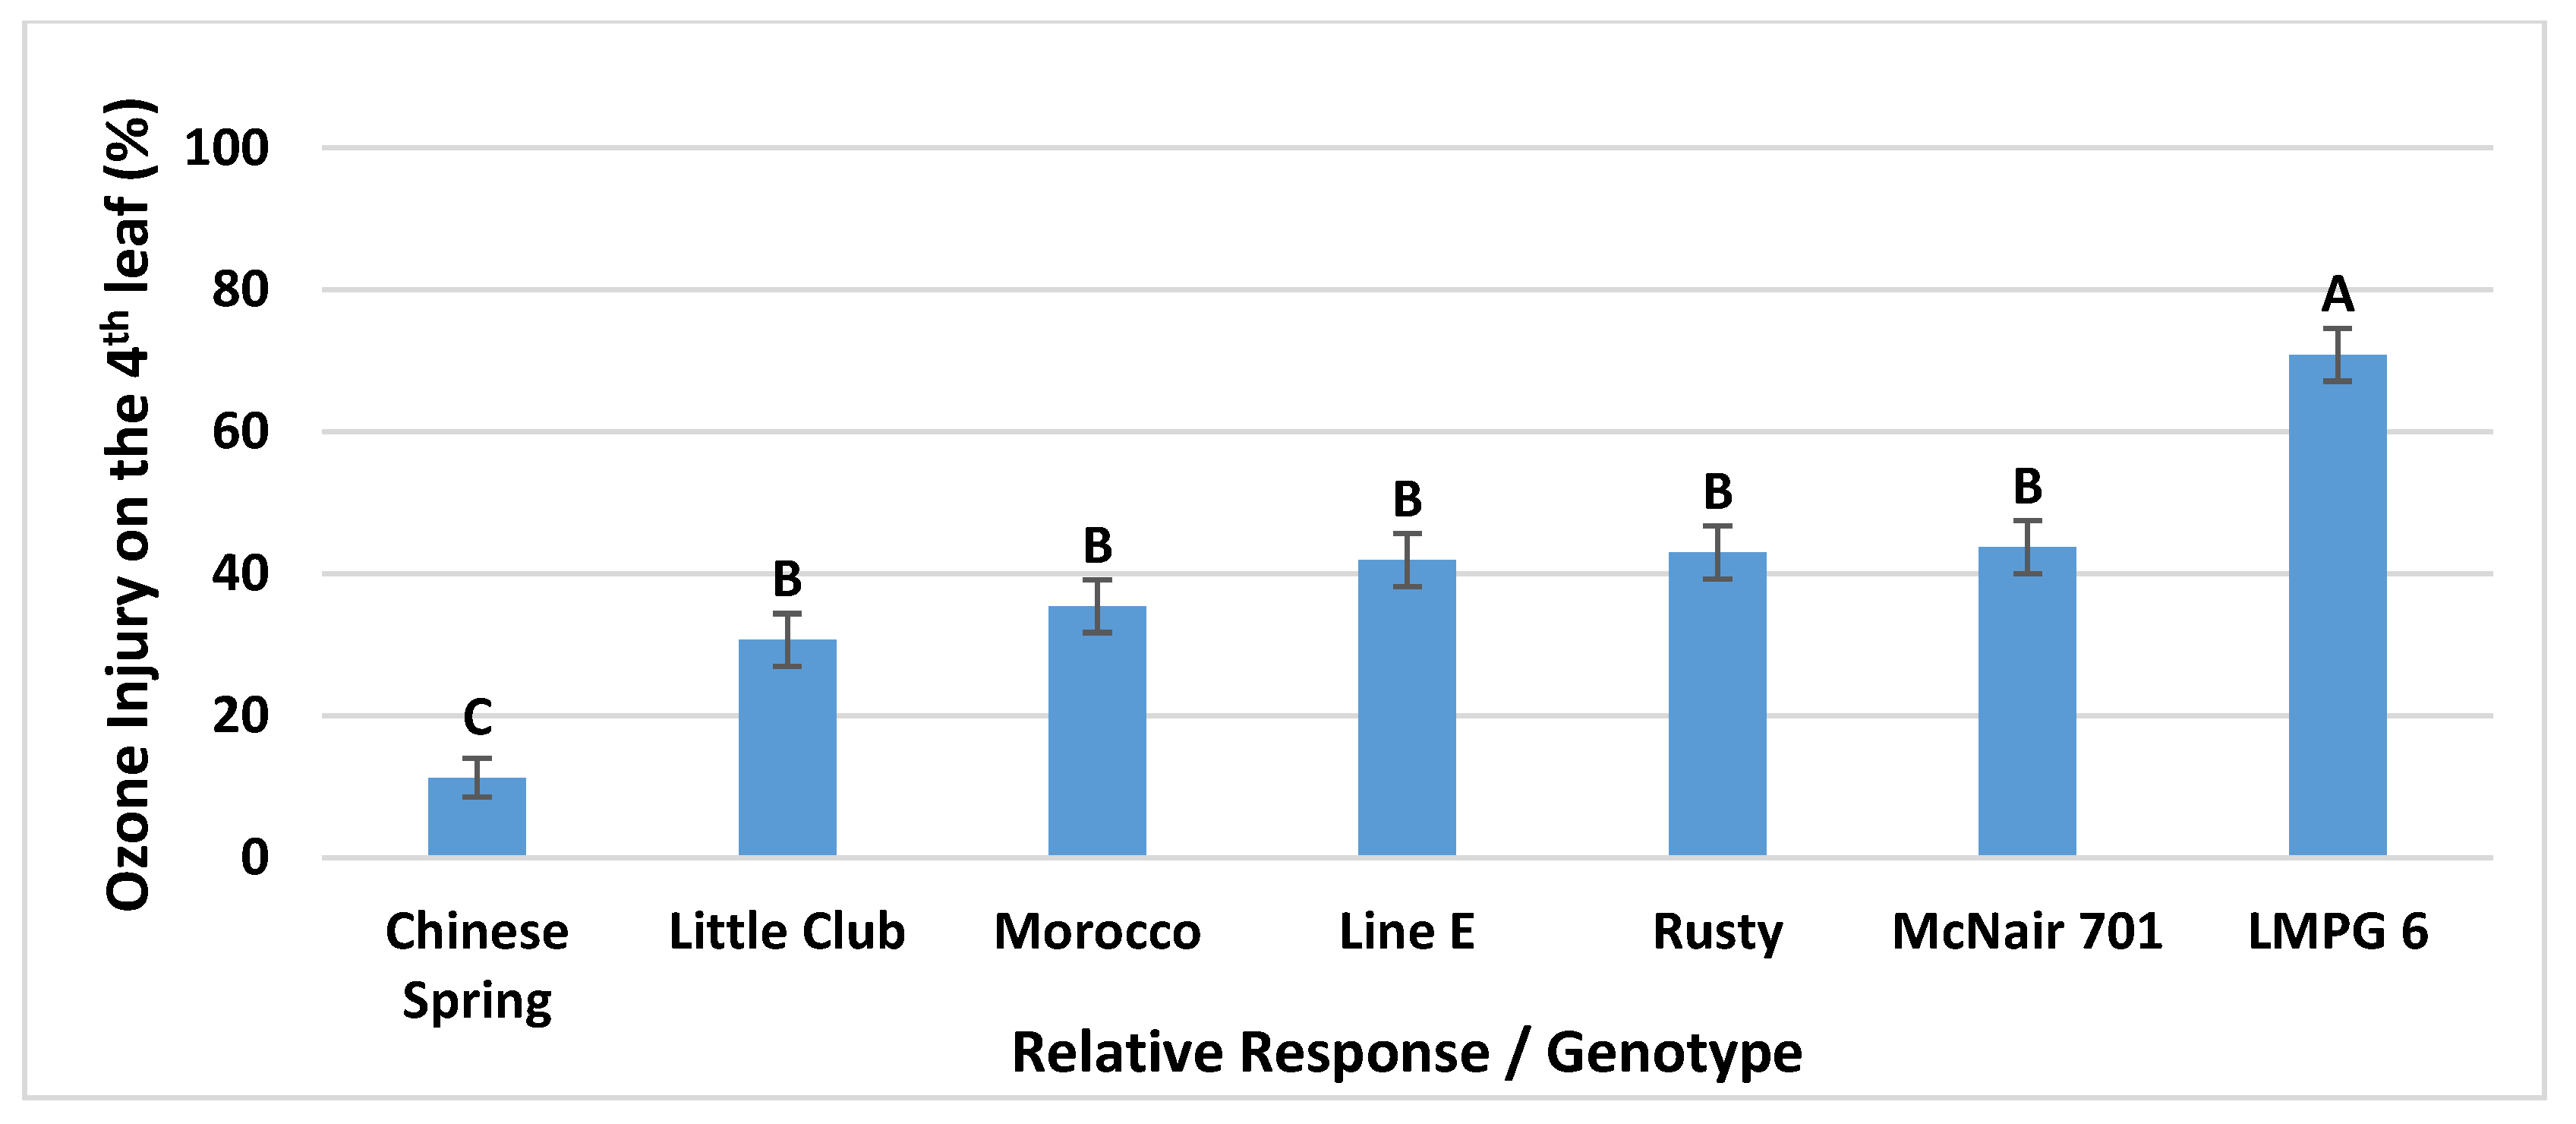
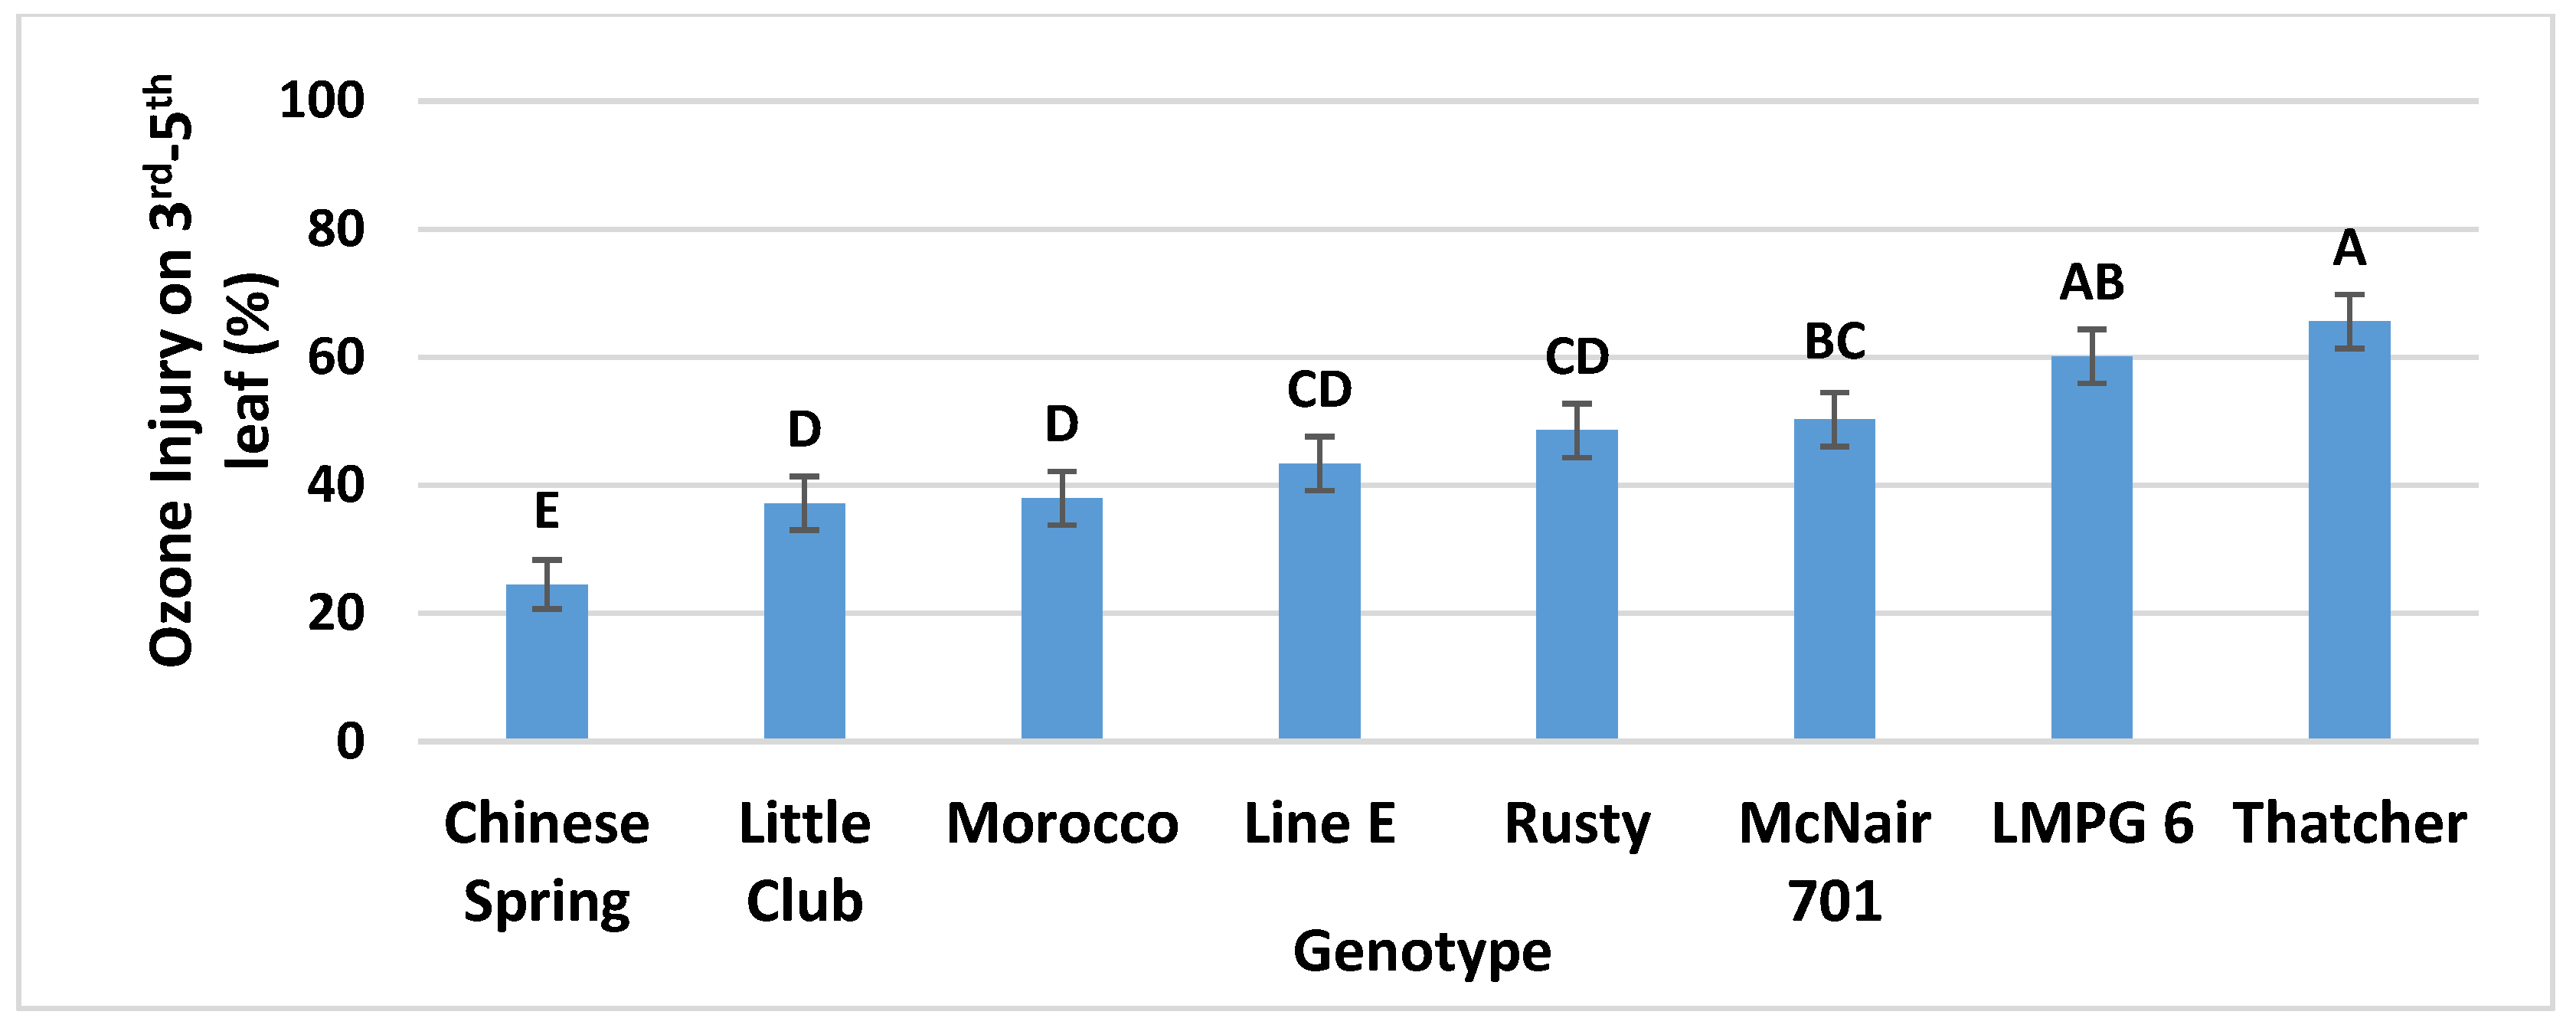
3.1.2. Genotype Main Effects and Overall Ranking of the Genotypes According to Their O3 Injury Responses
3.1.3. Interaction between O3 Level and Genotype
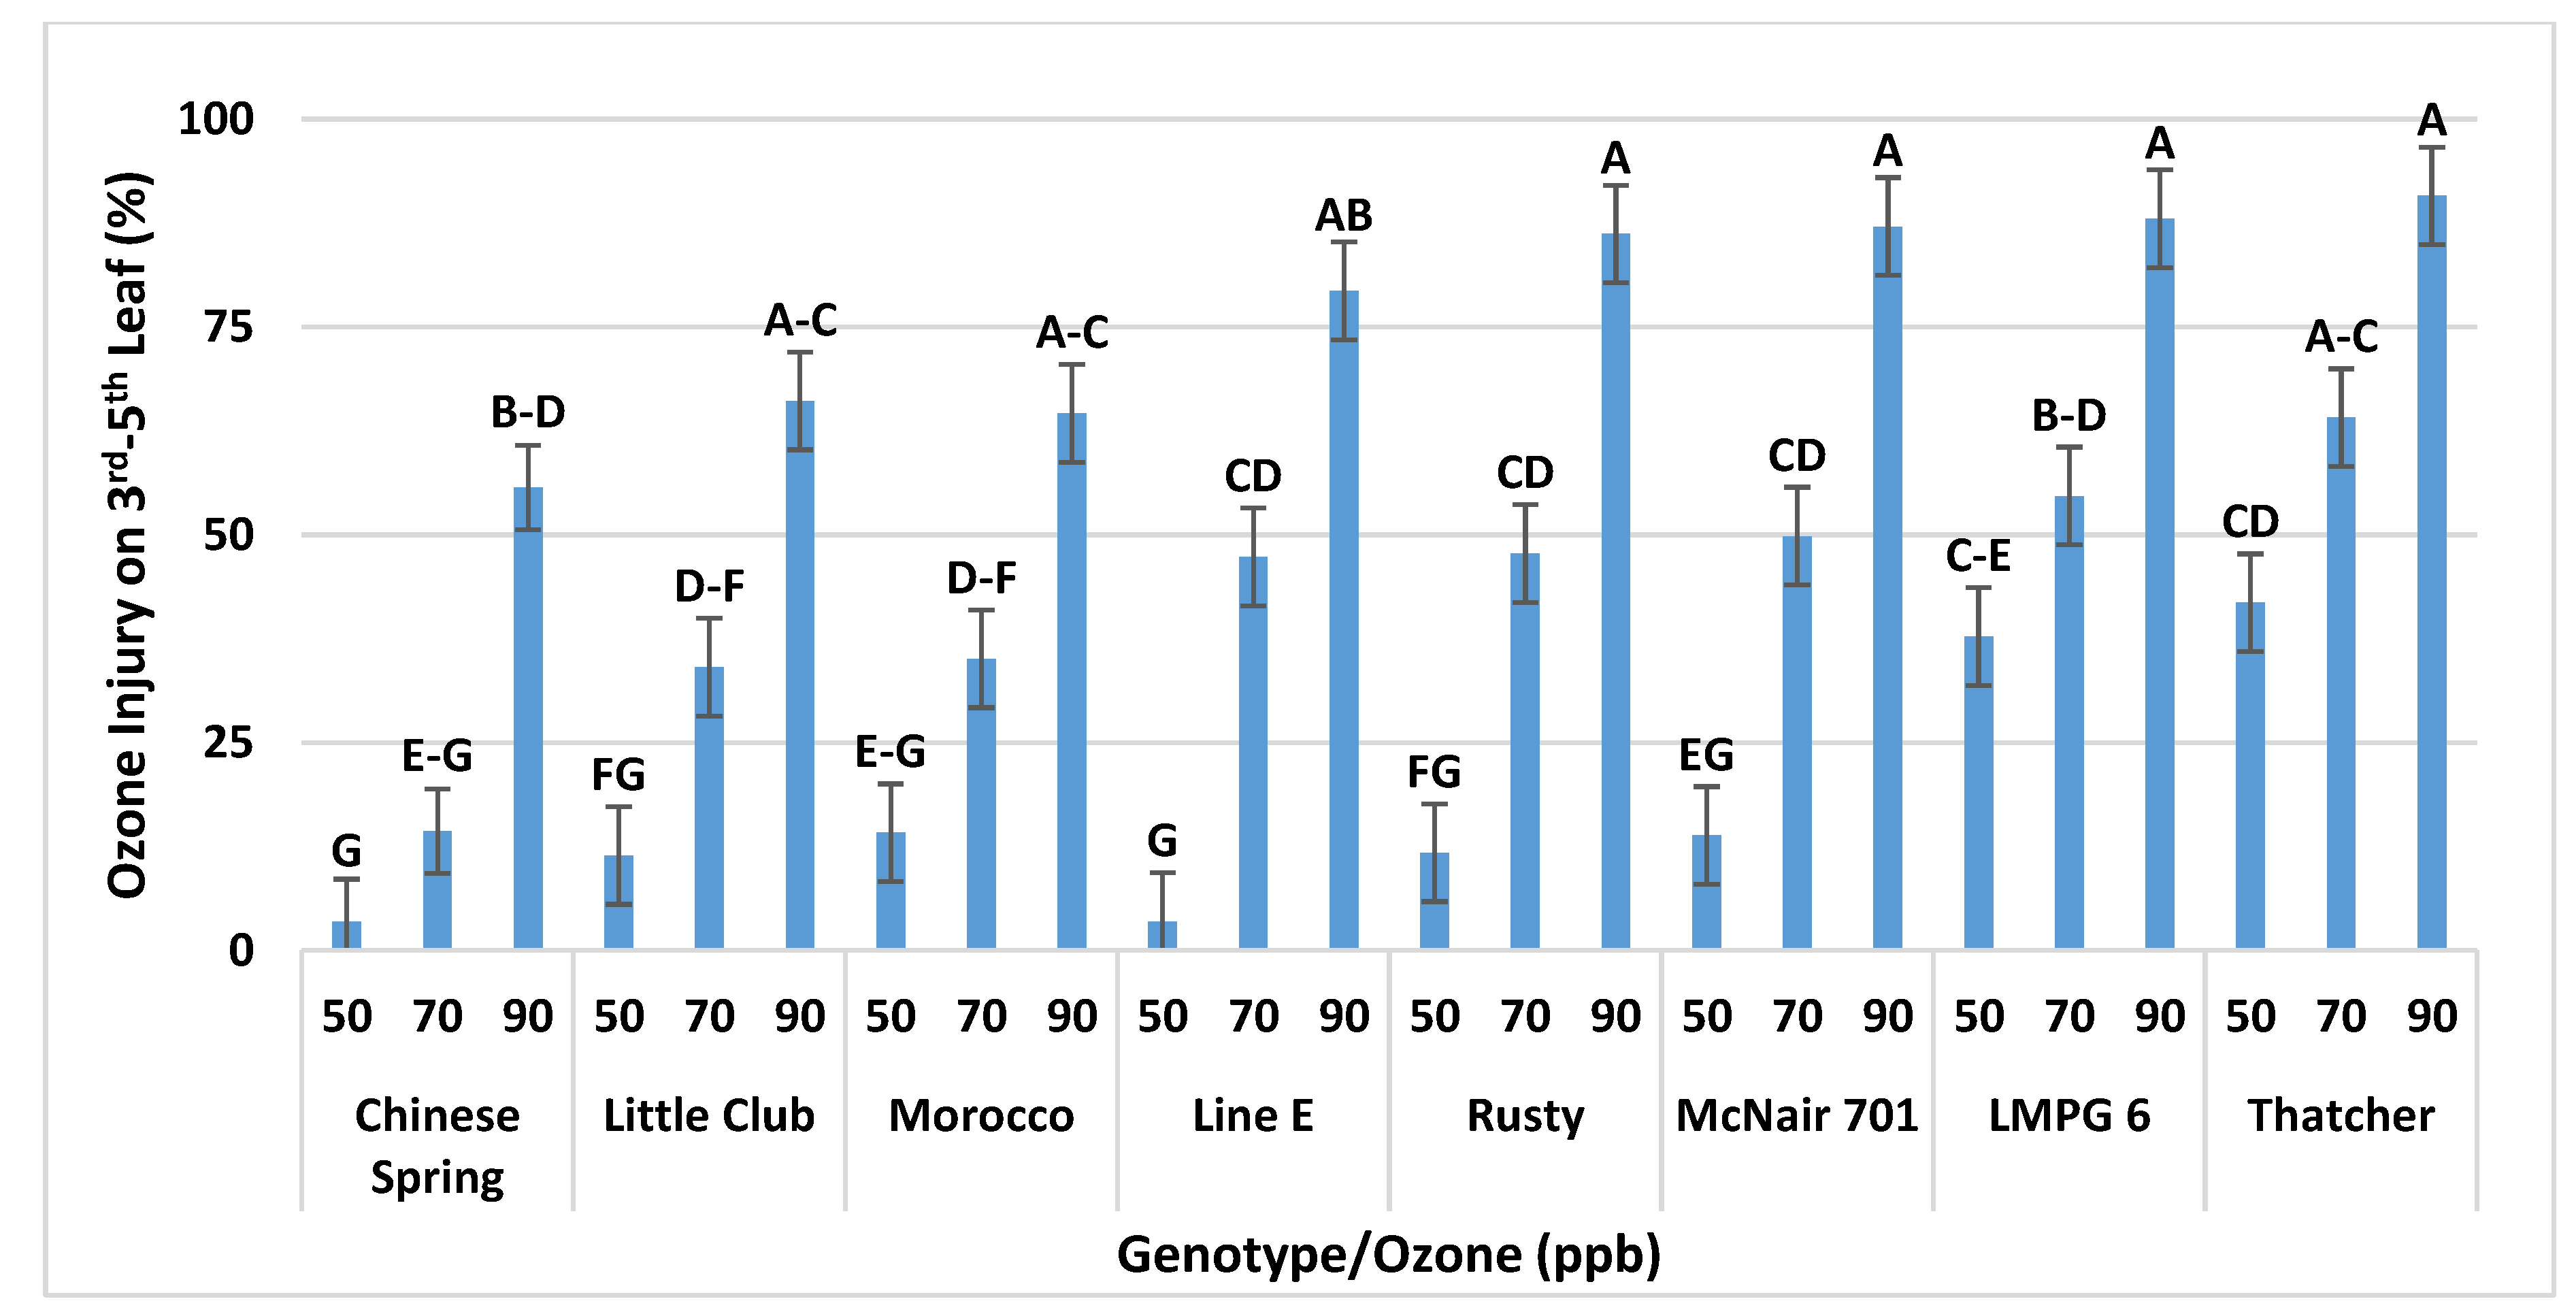
Interaction of O3 Level and Genotype on O3 Injury in CSTRs
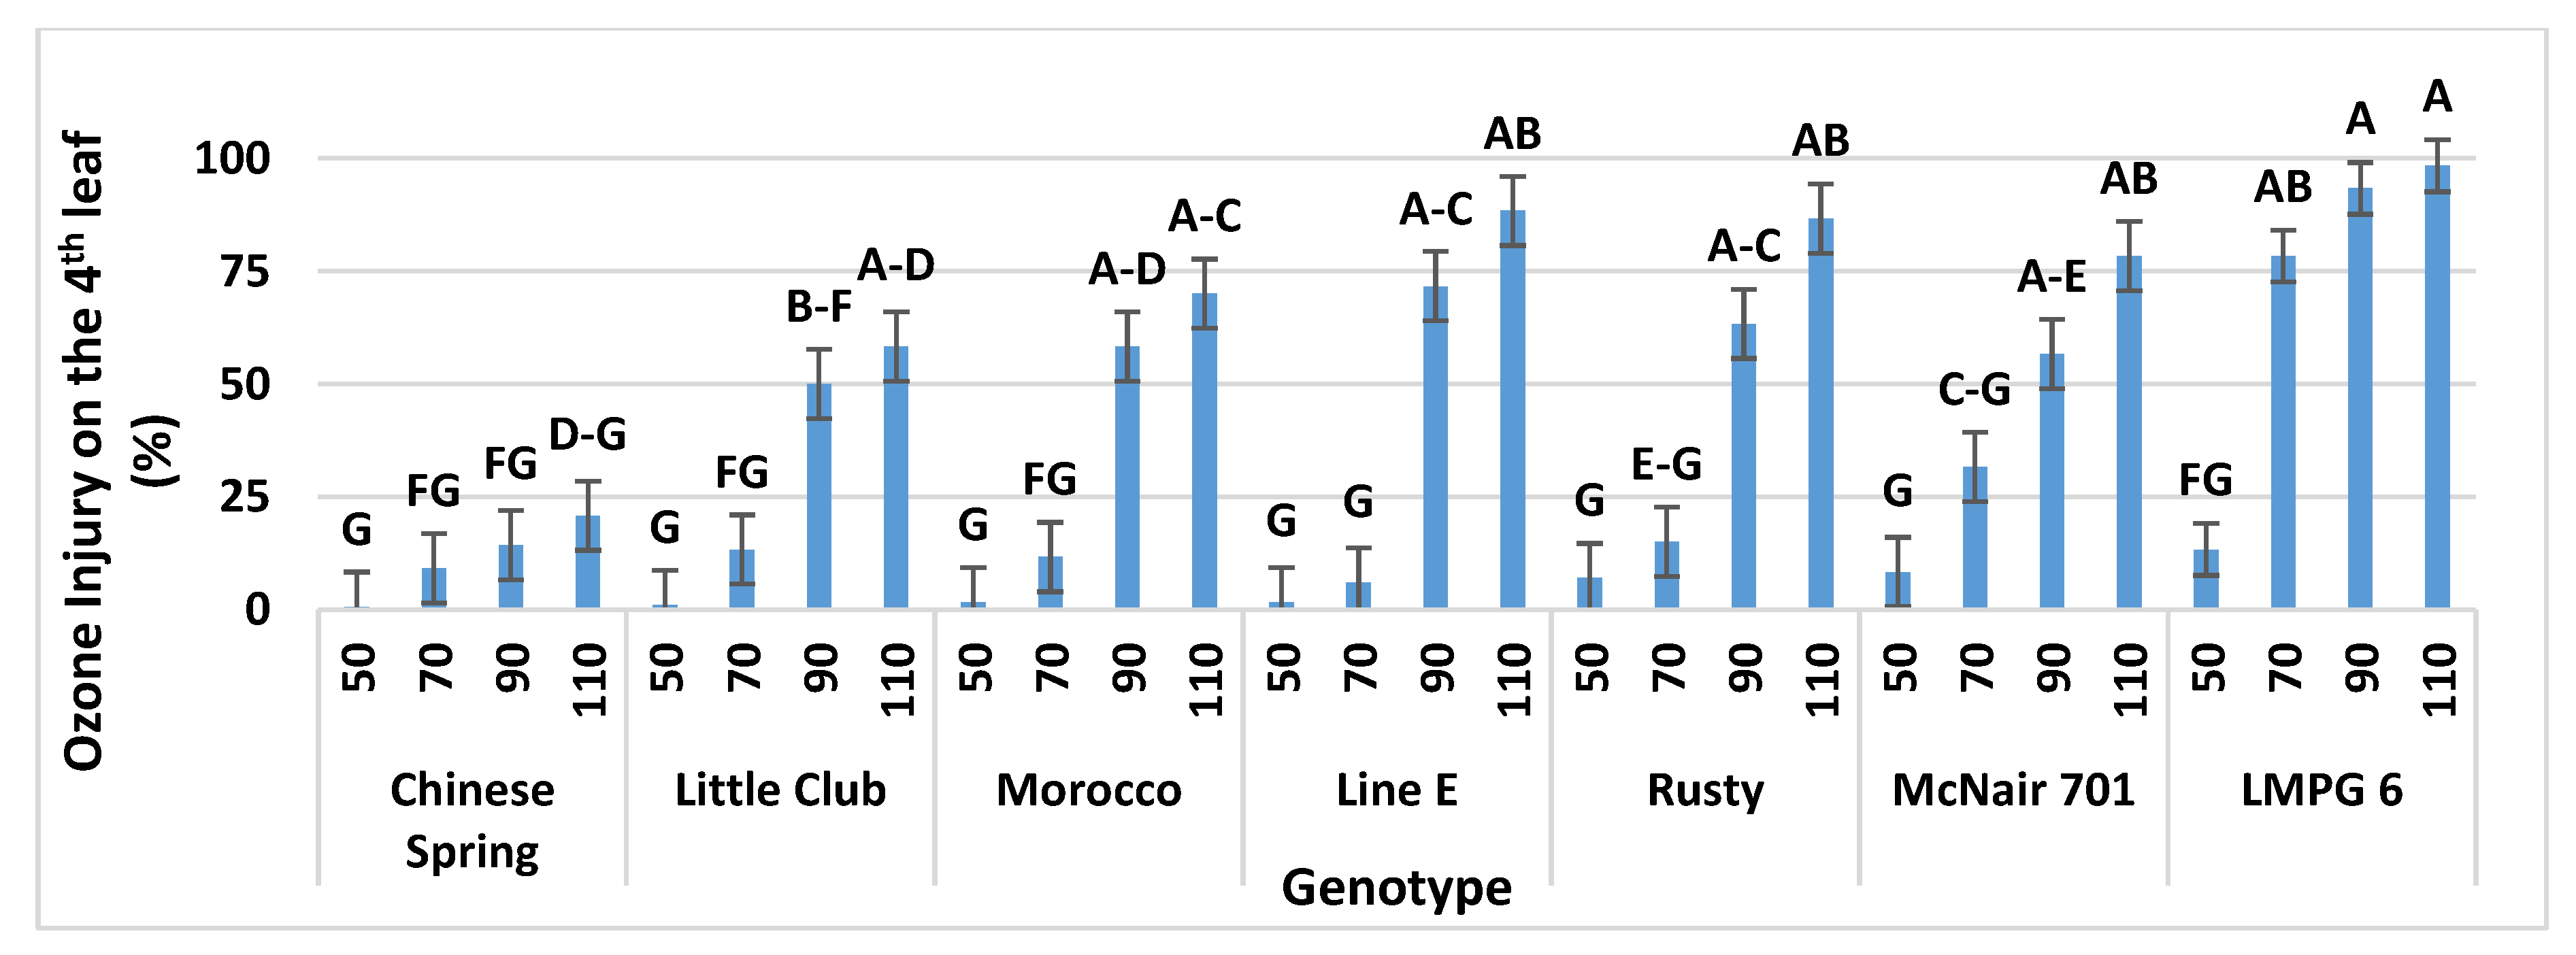
Interaction of O3 Level and Genotype on O3 Injury in OPECs
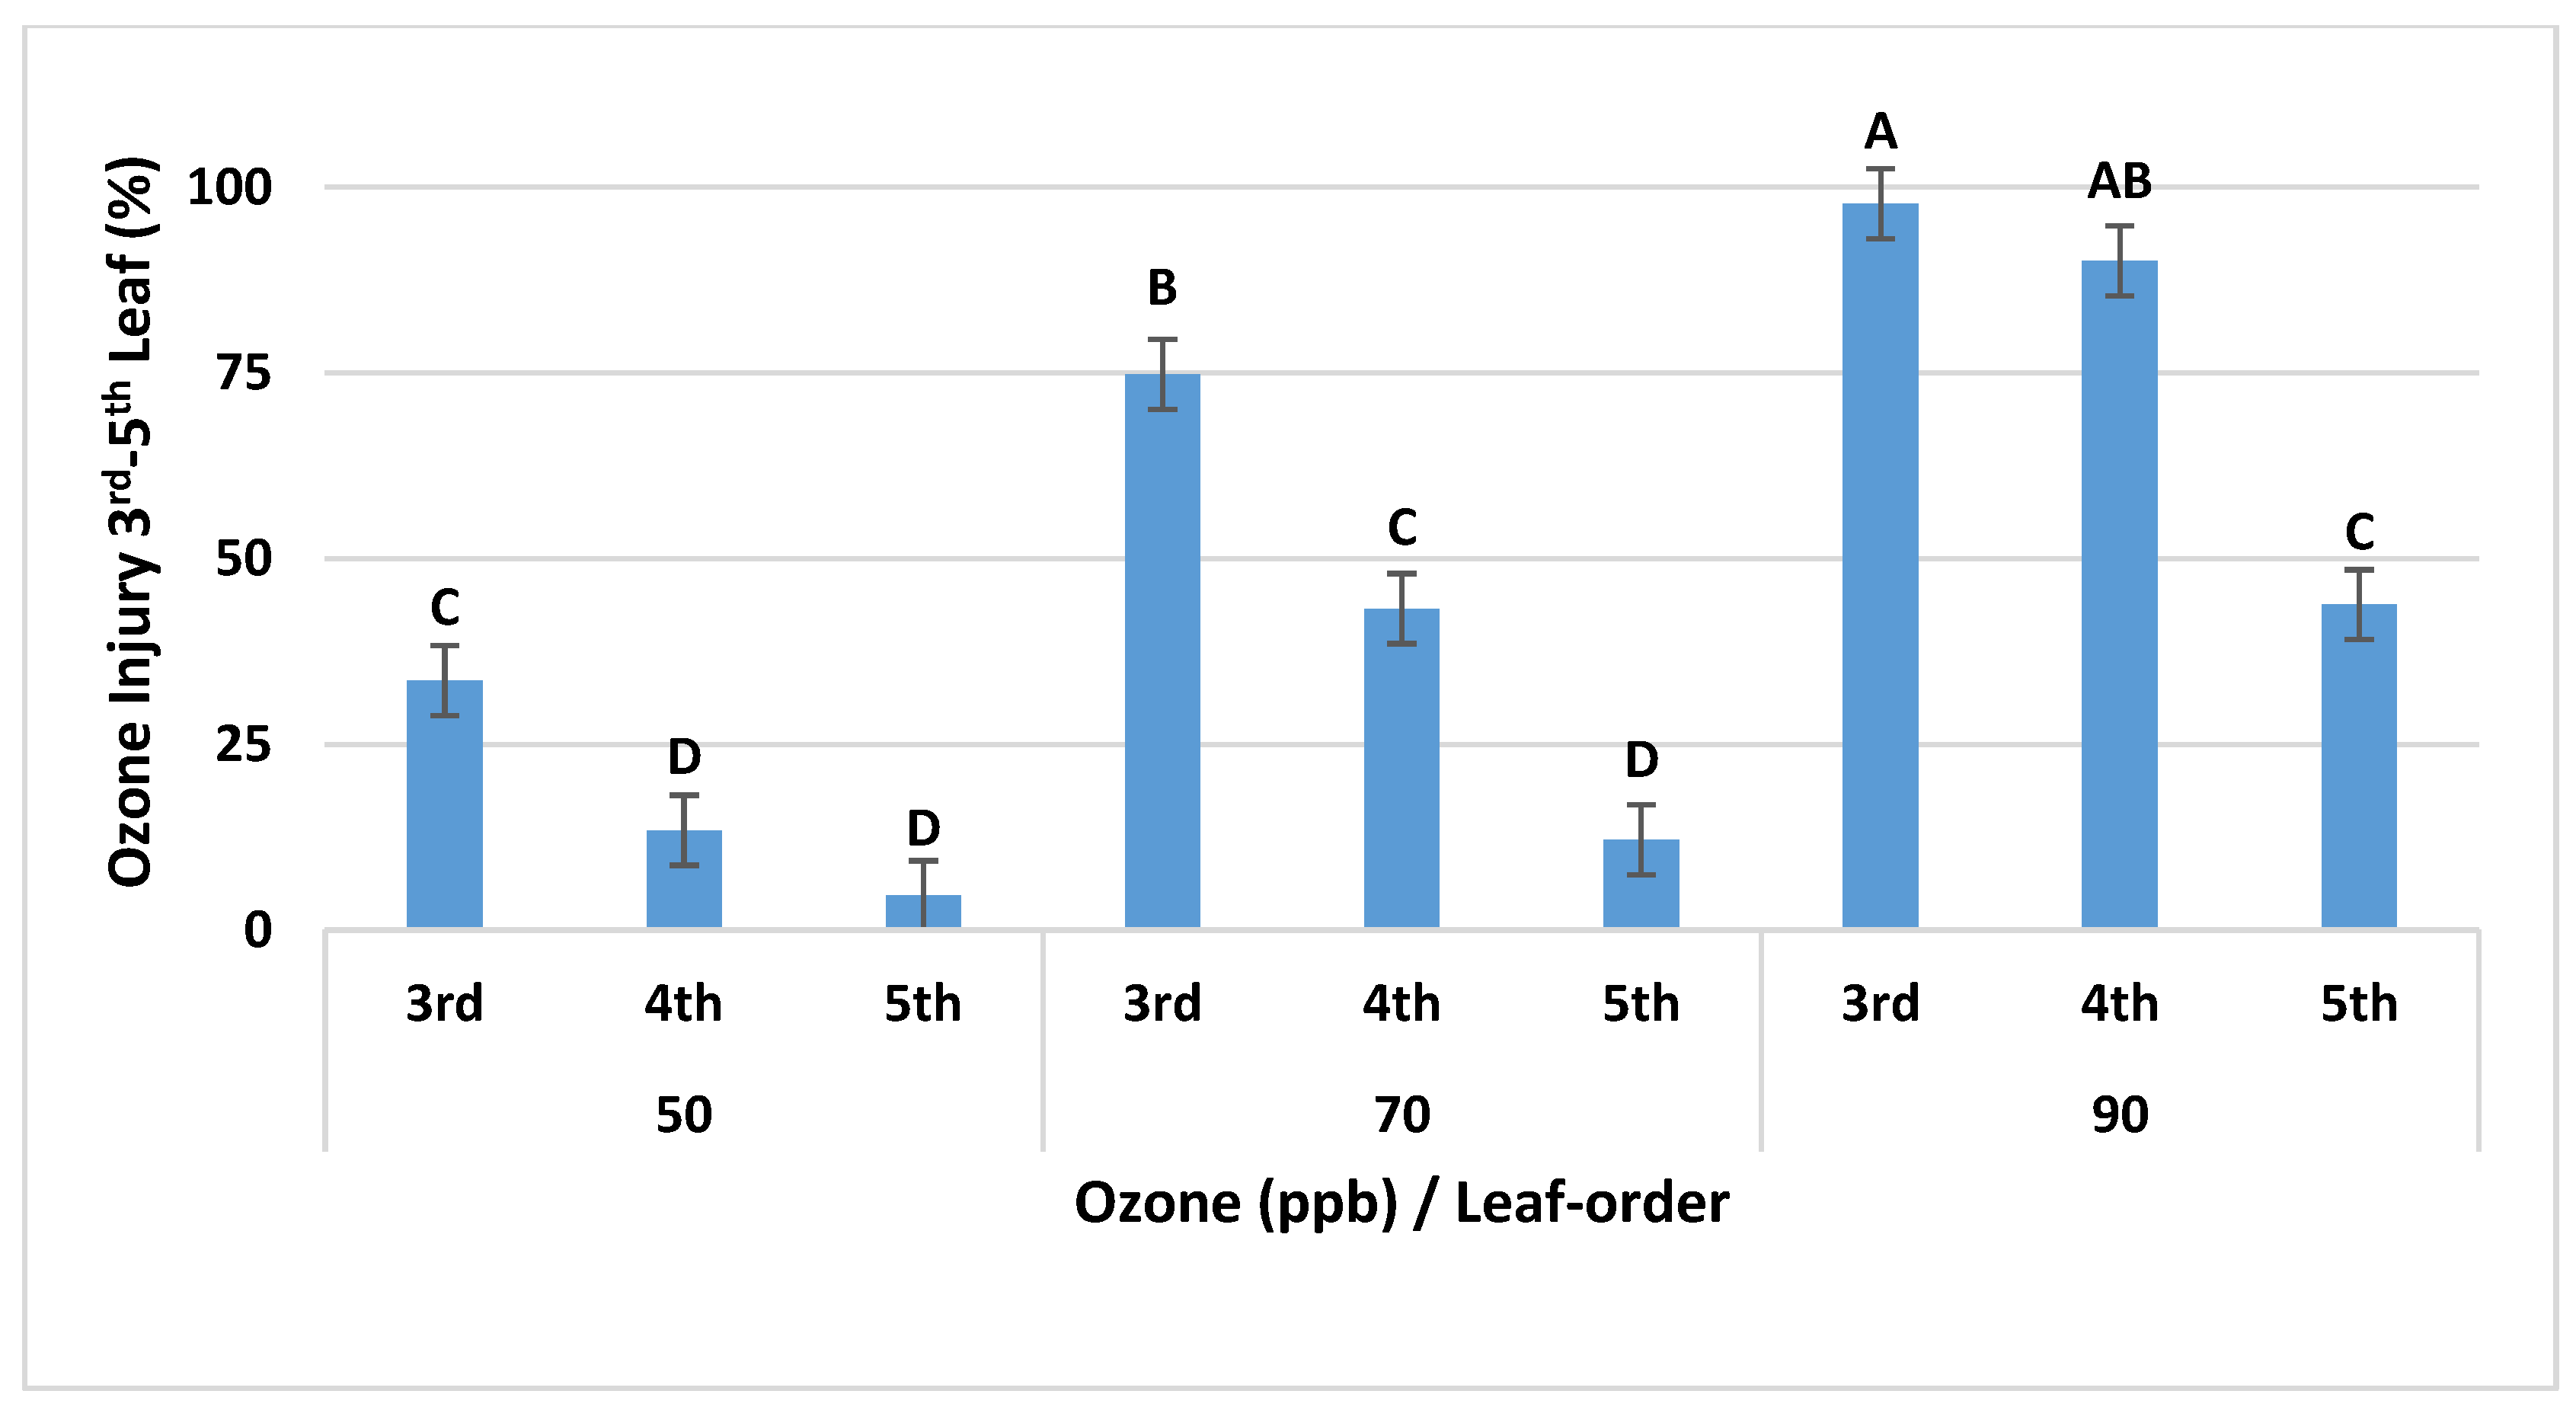
3.1.4. Interaction of Leaf-Order and O3 Level on O3 Injury
Interaction of Leaf-Order and O3 Level on O3 Visible Injury in OPECs
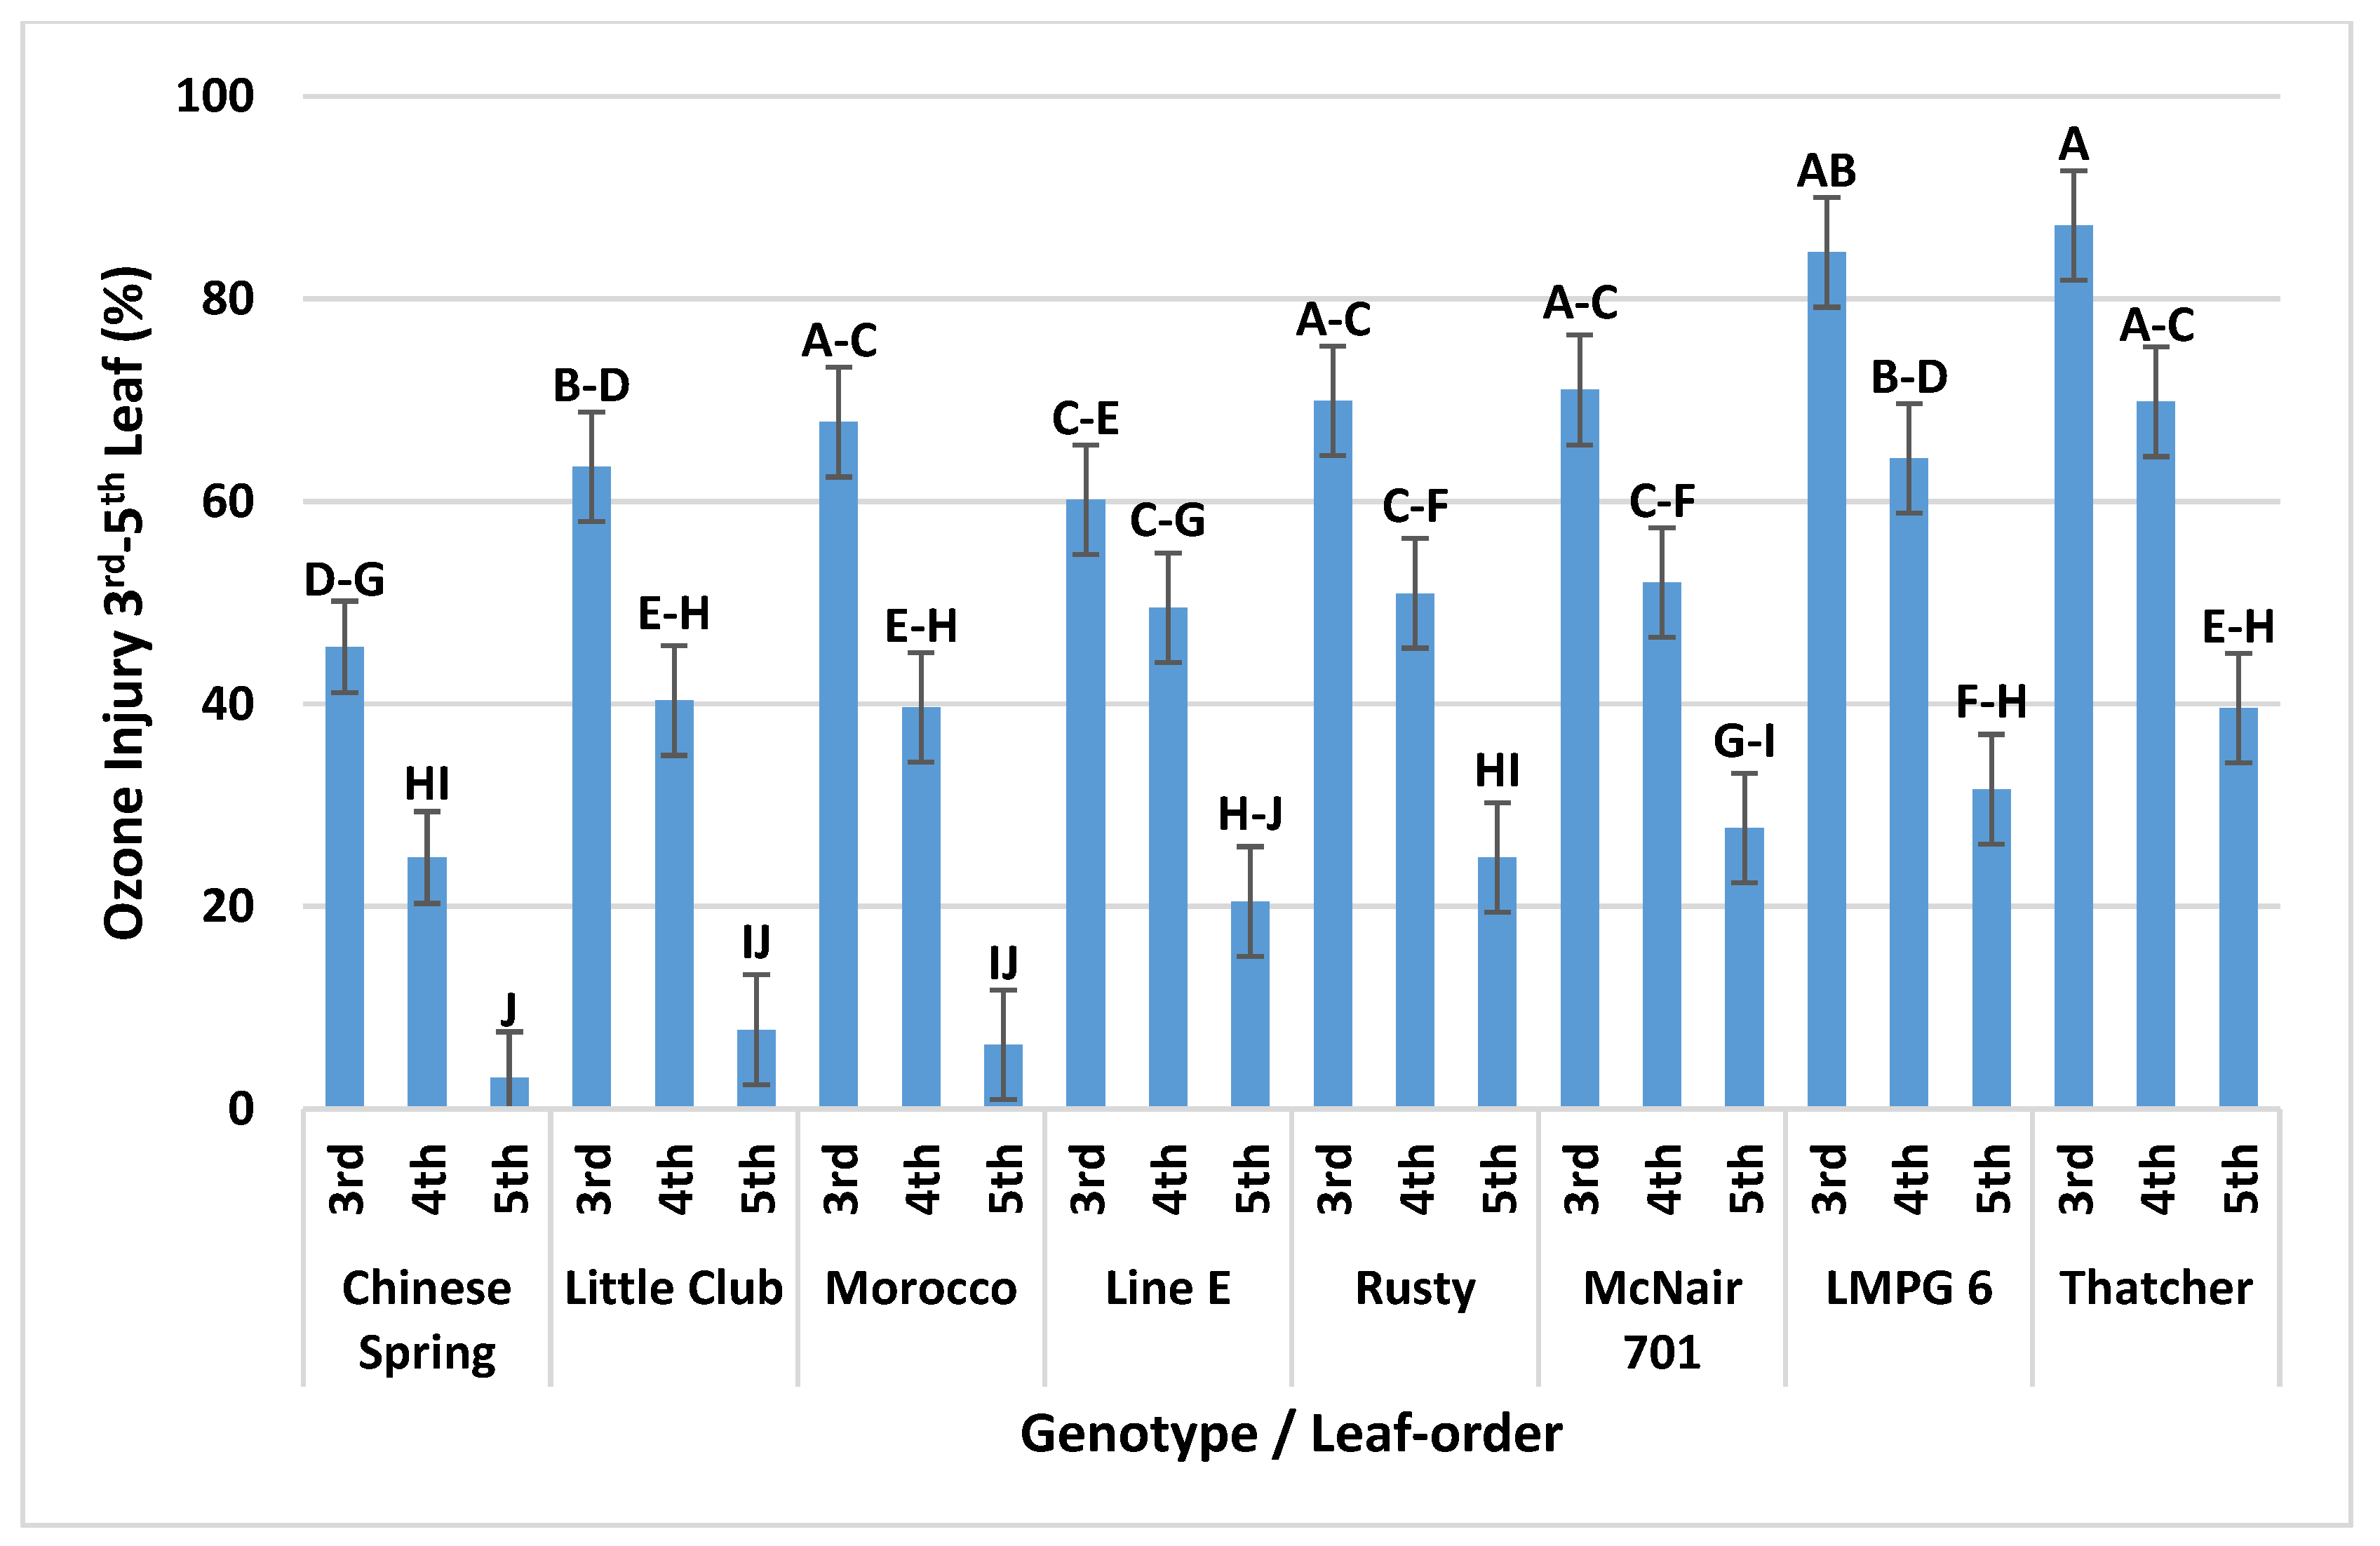
3.1.5. Interaction of Leaf-Order and Genotype on O3 Injury in OPECs
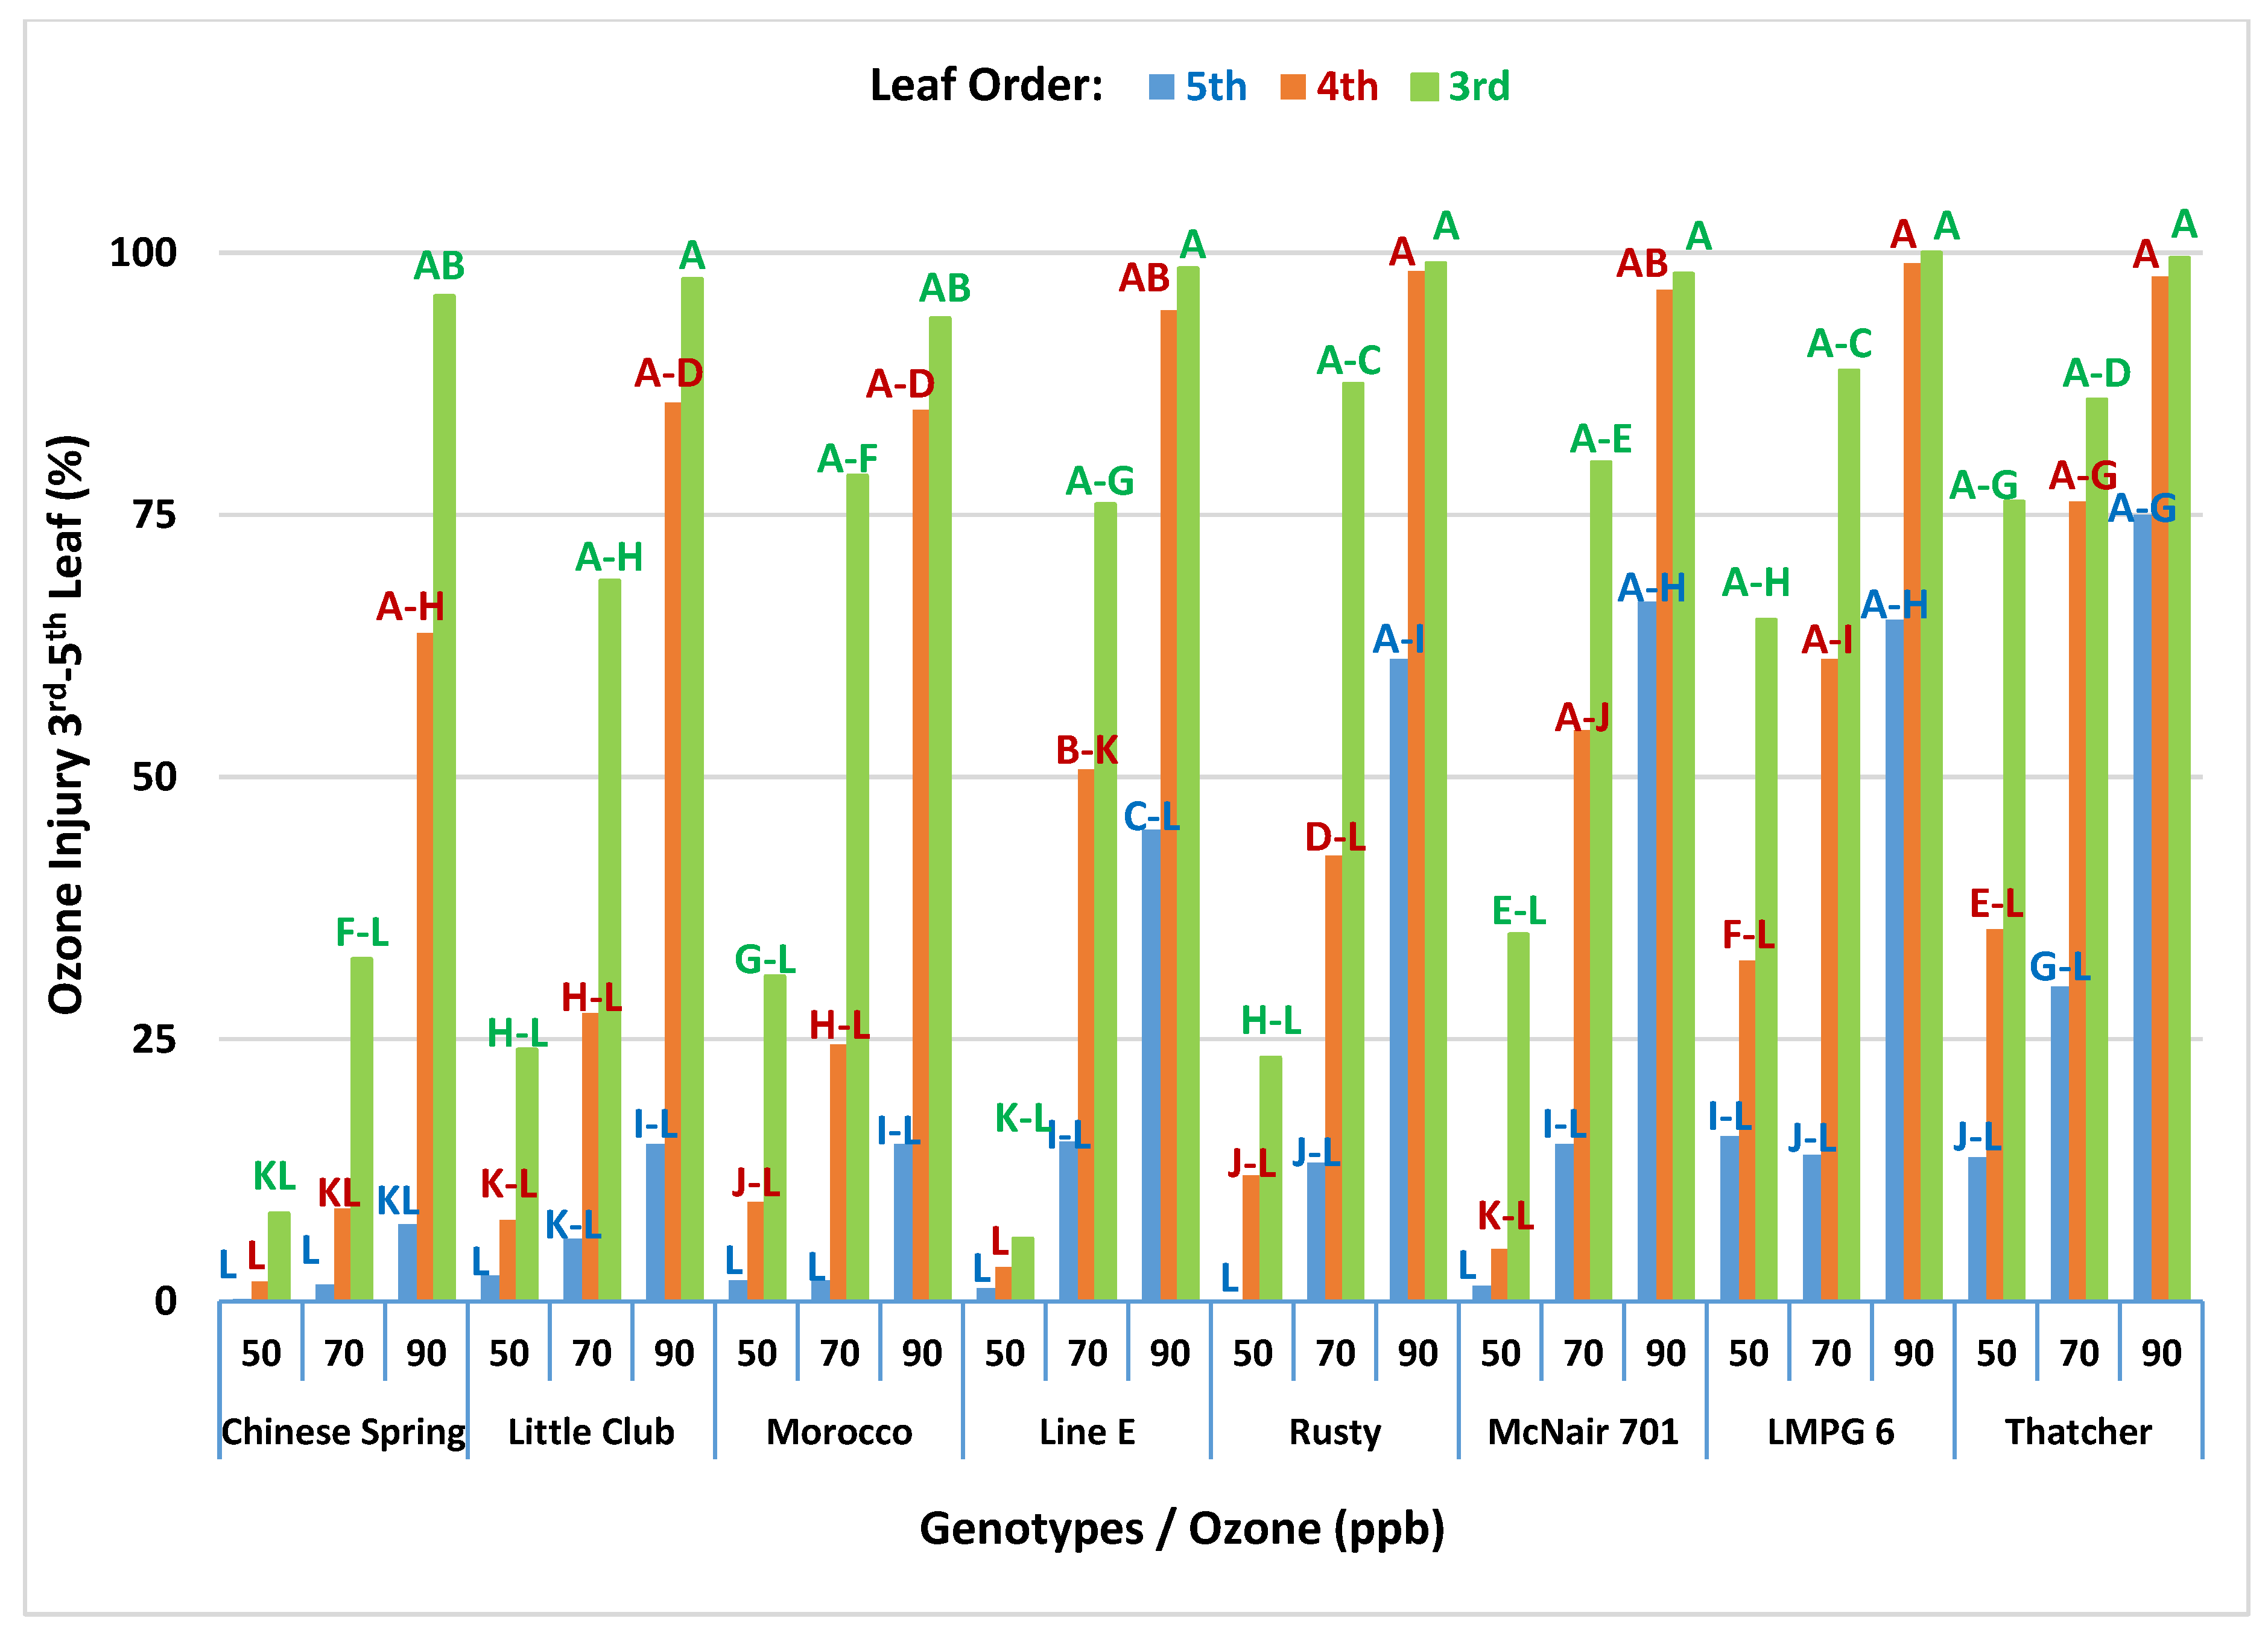
3.1.6. Interaction of Leaf-Order, O3 Levels and Genotype (2nd-Order Interaction) on O3 Injury in OPECs
3.2. Dry Matter Accumulation
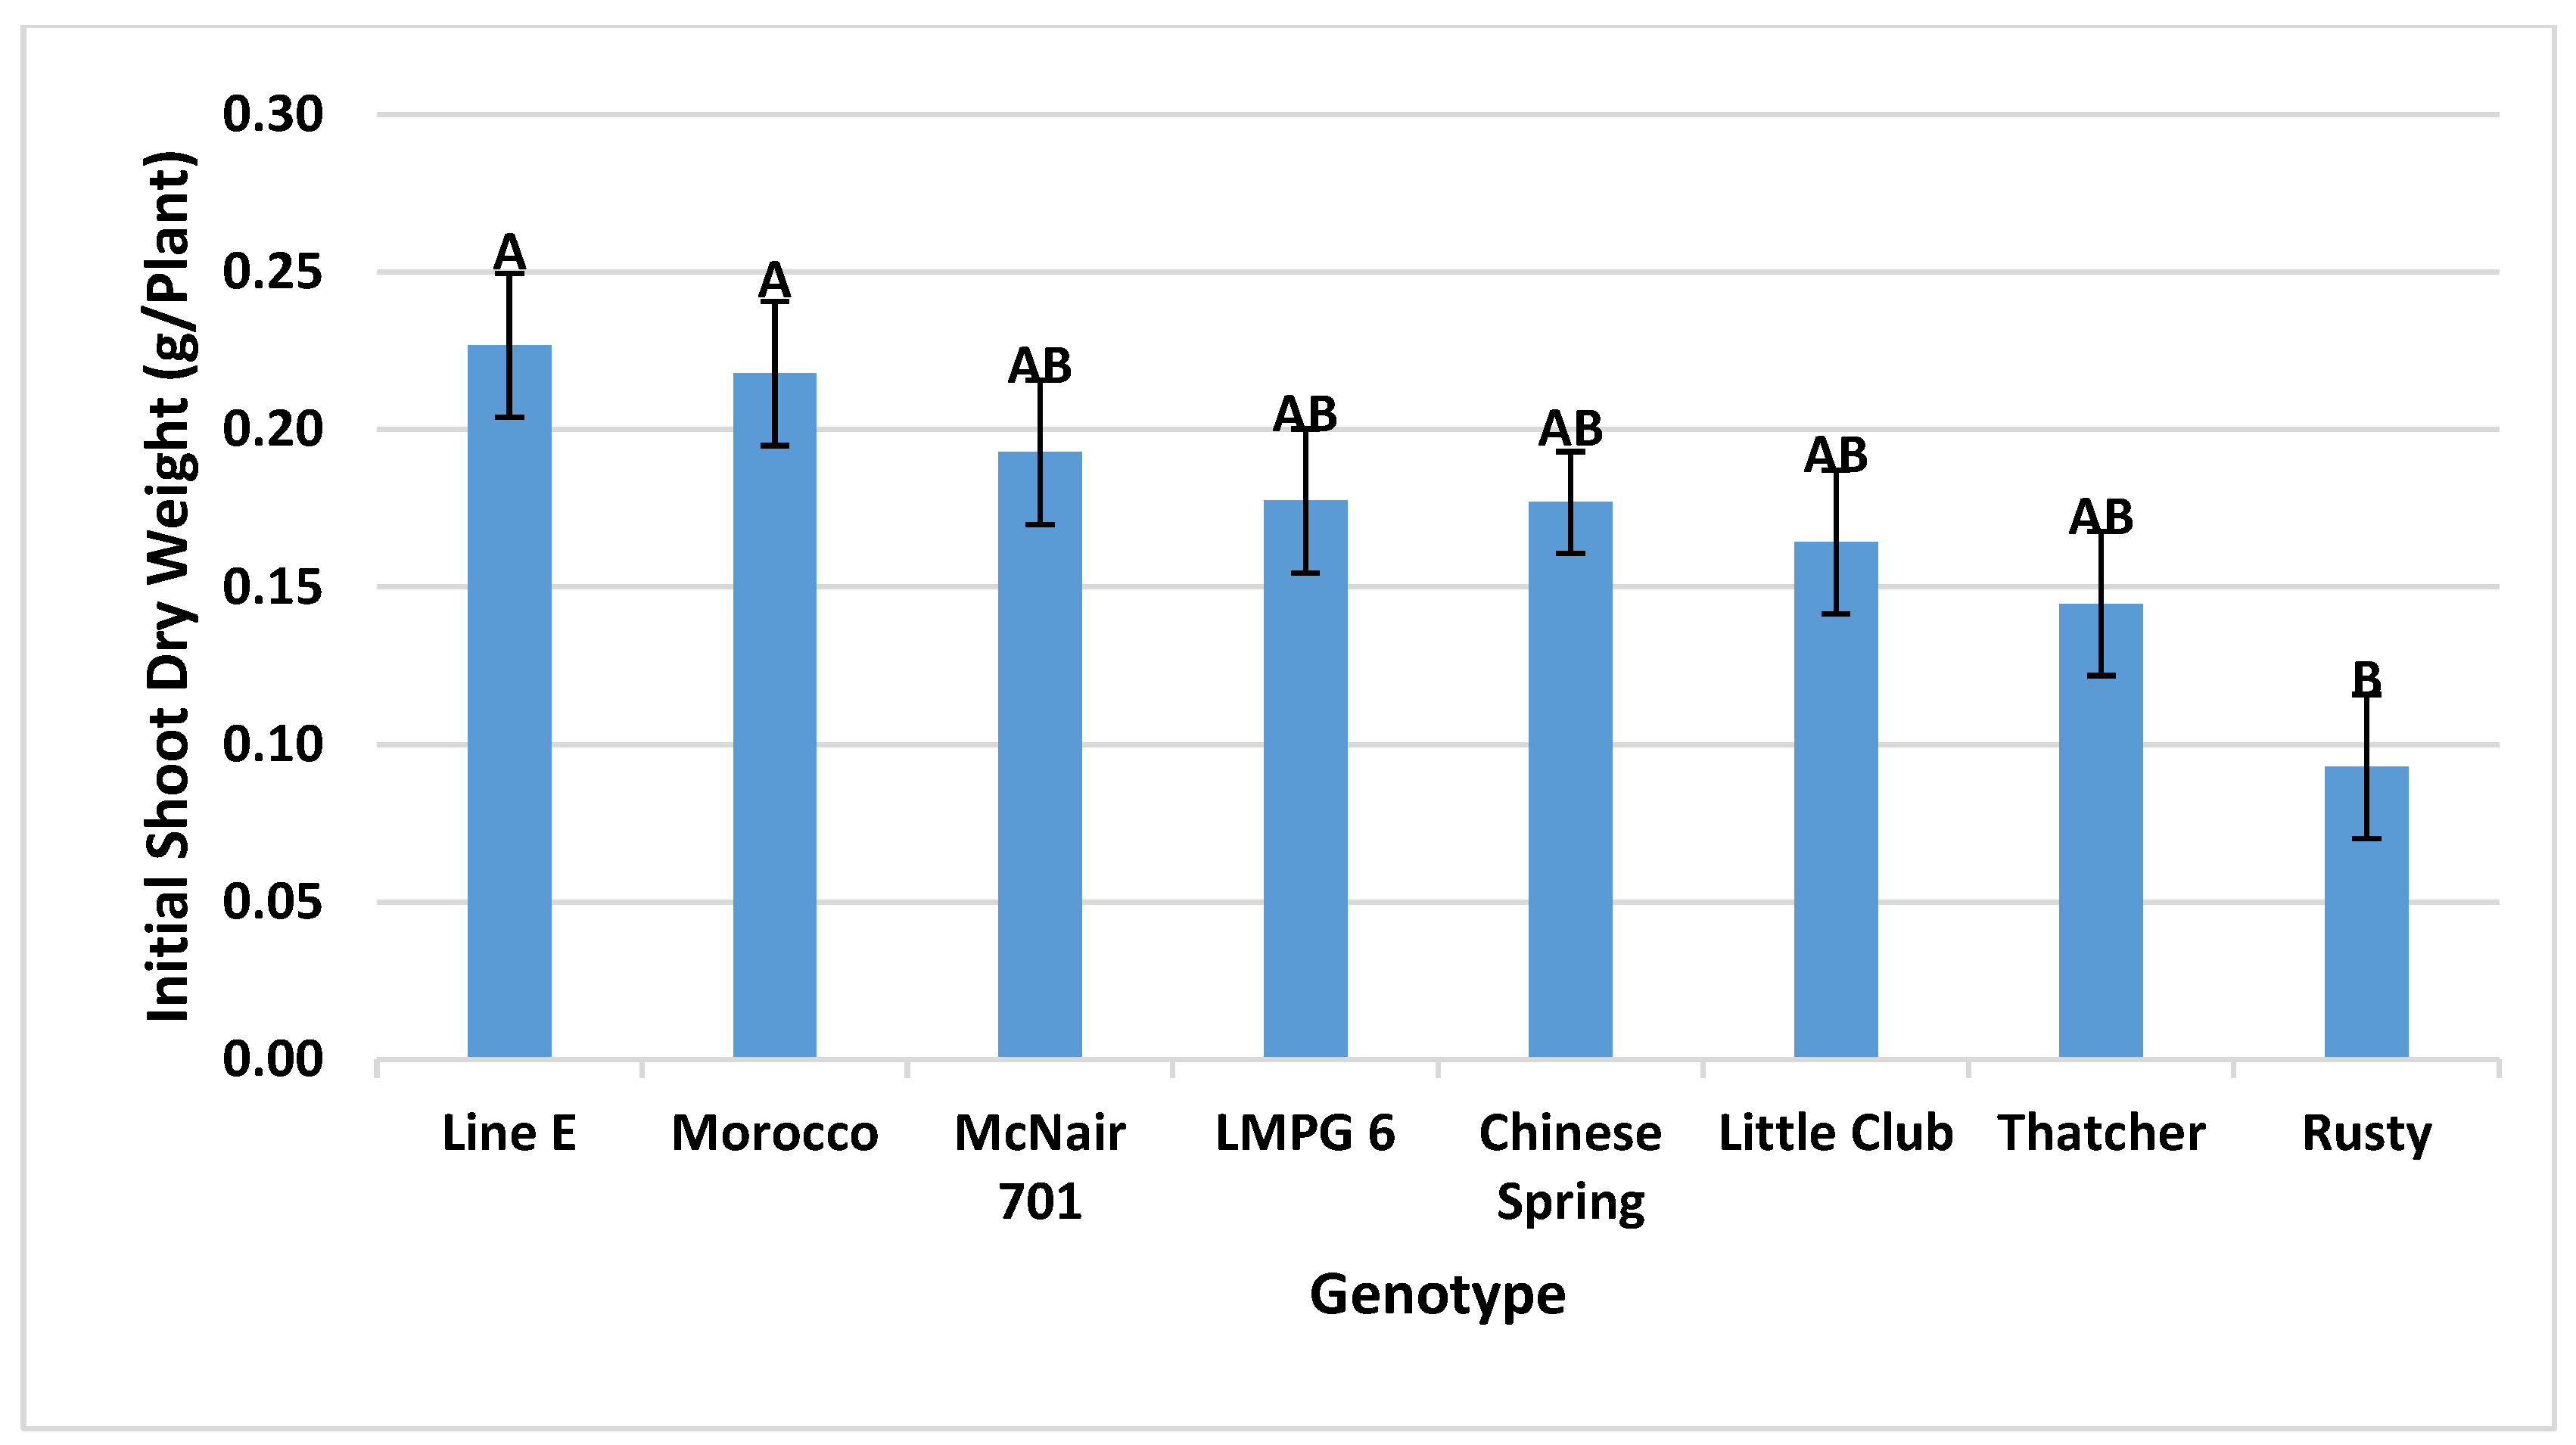
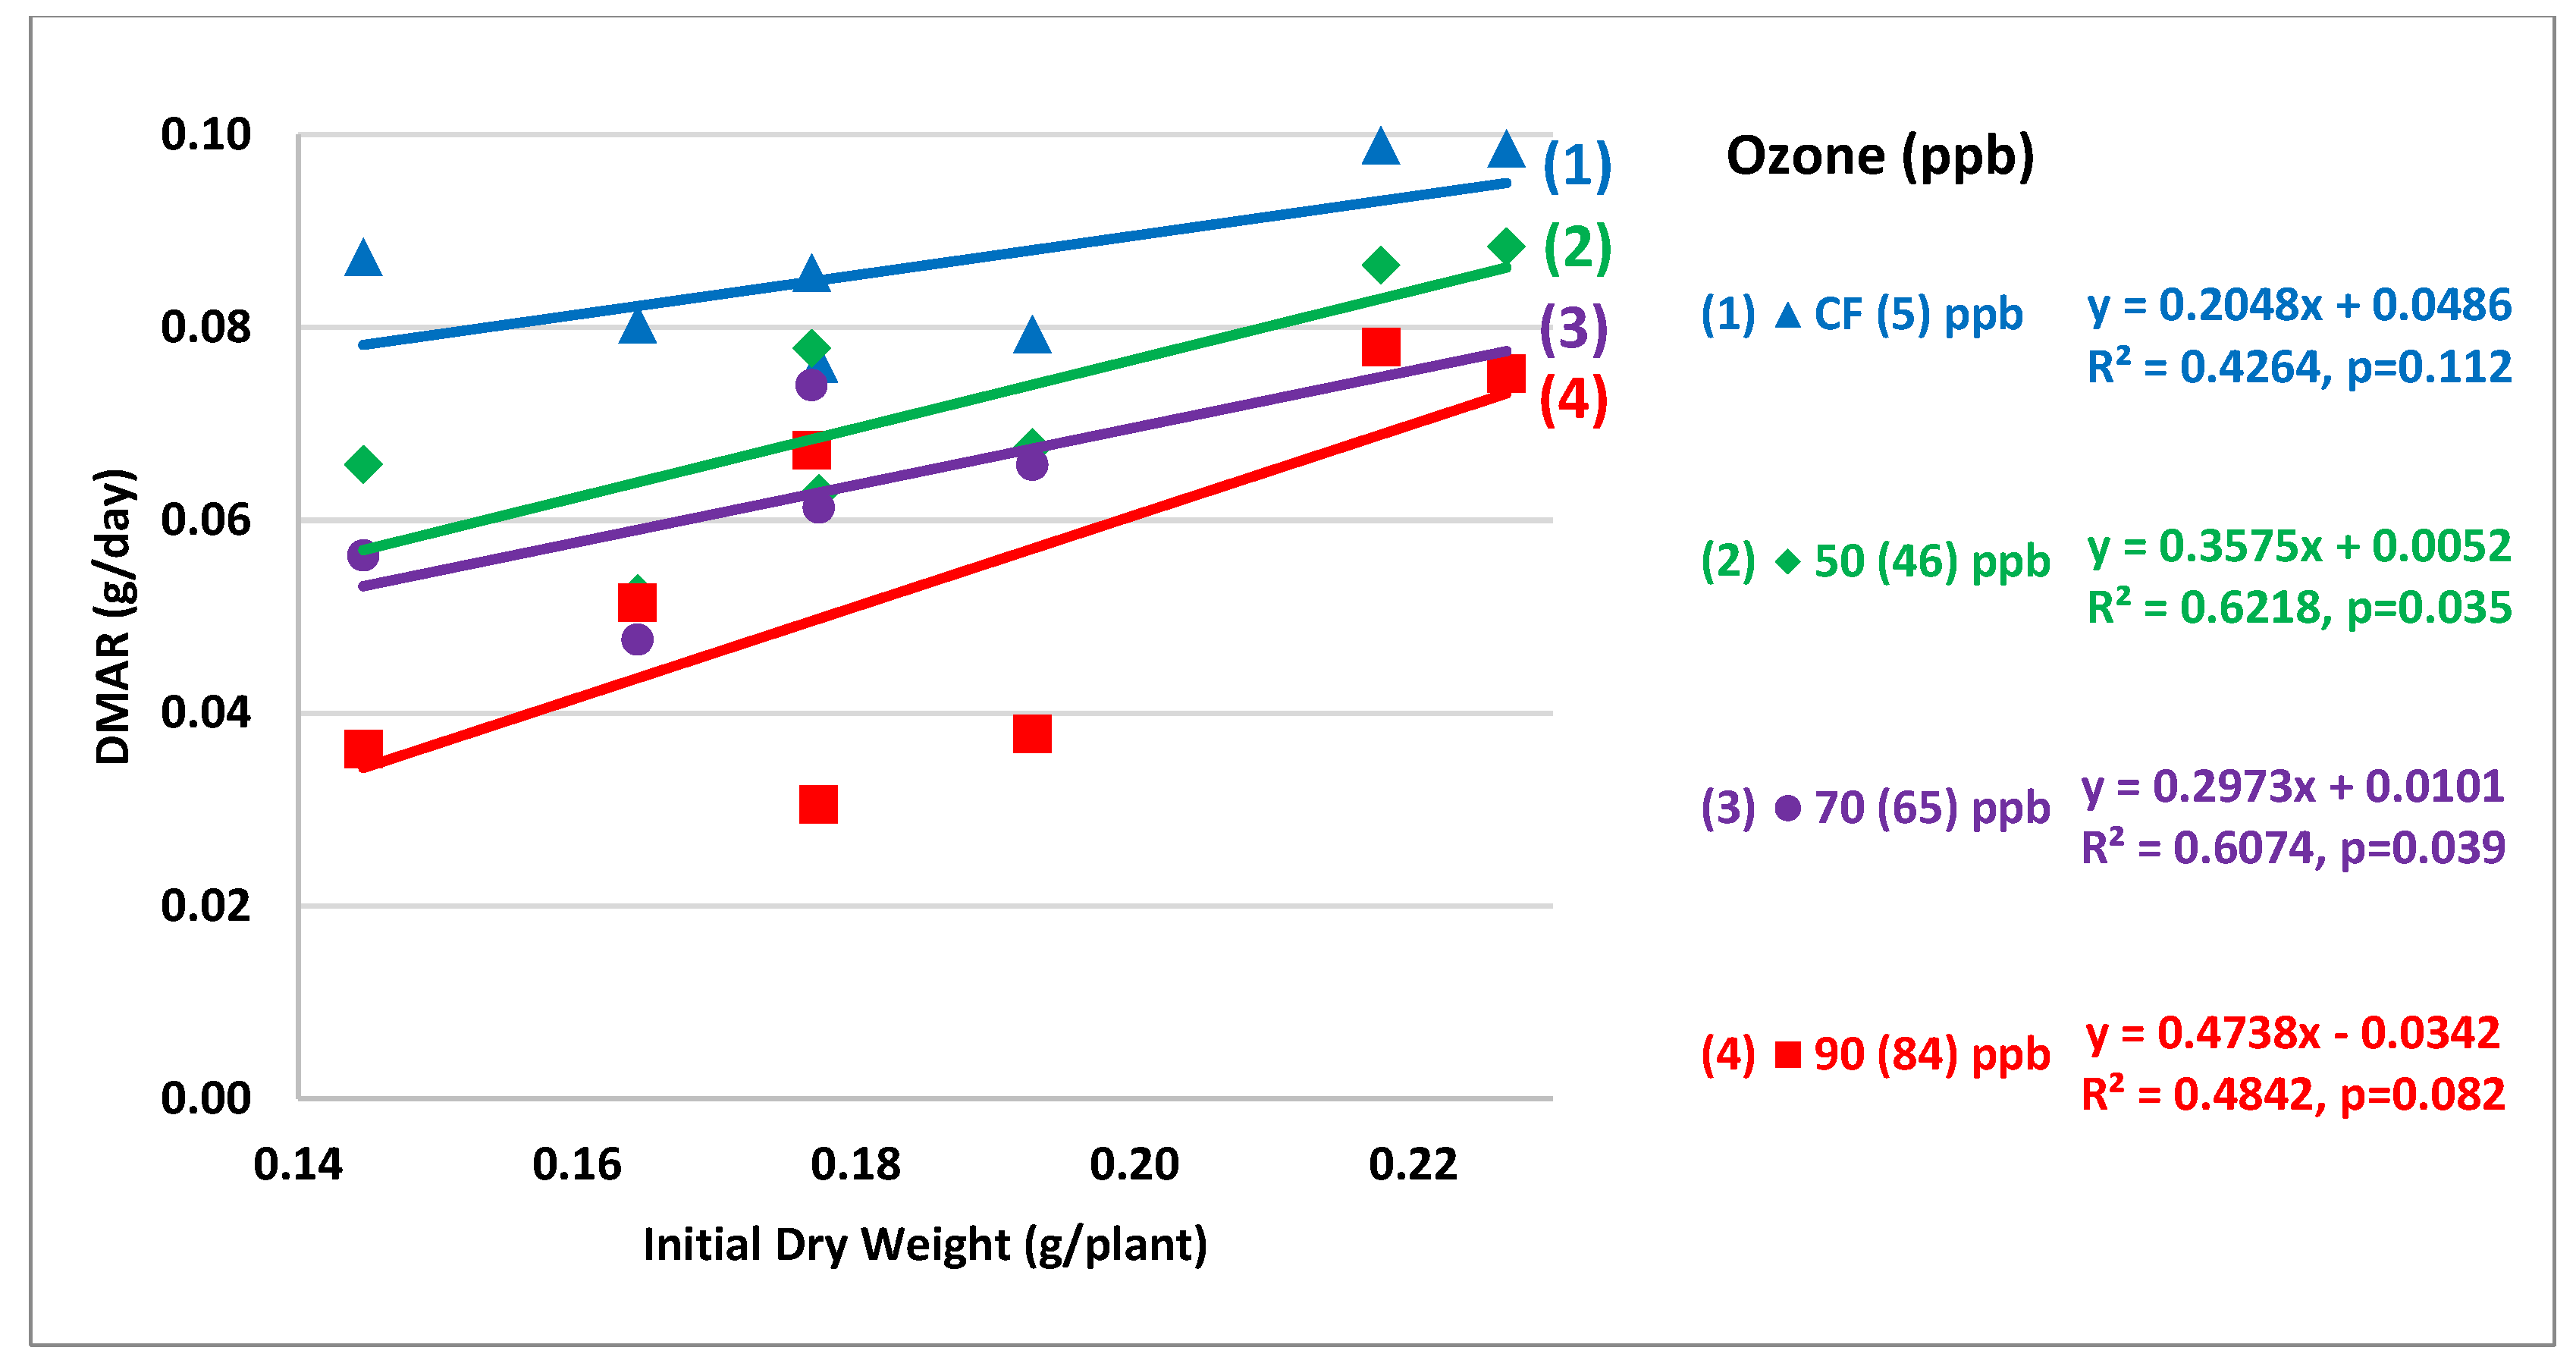
3.2.1. Initial Dry Weight Uniformity and Their Impact on DMAR
3.2.2. Effects of O3 Stress on PRGR
3.2.3. Relationship between Visible Injury and Relative Growth Rate Responses of RnUS Wheat Genotypes to O3 Stress
4. Discussion
5. Conclusions
Author Contributions
Funding
Acknowledgments
Conflicts of Interest
Appendix A

References
- Chakraborty, S.; Luck, J.; Hollaway, G.; Fitzgerald, G.; White, N. Rust-proofing wheat for a changing climate. Euphytica 2011, 179, 19–32. [Google Scholar] [CrossRef]
- Mills, G.; Sharps, K.; Simpson, D.; Pleijel, H.; Broberg, M.; Uddling, J.; Jaramillo, F.; Davies, W.J.; Dentener, F.; Van den Berg, M.; et al. Ozone pollution will compromise efforts to increase global wheat production. Glob. Chang. Biol. 2018, 24. [Google Scholar] [CrossRef] [PubMed]
- Jin, Y.; Rouse, M.; Groth, J. Population Diversity of Puccinia graminis is Sustained Through Sexual Cycle on Alternate Hosts. J. Integr. Agric. 2014, 13, 262–264. [Google Scholar] [CrossRef]
- Sharma, J.S.; Zhang, Q.; Rouse, M.N.; Klindworth, D.L.; Friesen, T.L.; Long, Y.; Olivera, P.D.; Jin, Y.; McClean, P.E.; Xu, S.S. Mapping and characterization of two stem rust resistance genes derived from cultivated emmer wheat accession PI 193883. Theor. Appl. Genet. 2019, 132, 3177–3189. [Google Scholar] [CrossRef]
- Zhang, P.; Yin, G.; Zhou, Y.; Qi, A.; Gao, F.; Xia, X.; He, Z.; Li, Z.; Liu, D. QTL Mapping of Adult-Plant Resistance to Leaf Rust in the Wheat Cross Zhou 8425B/Chinese Spring Using High-Density SNP Markers. Front. Plant Sci. 2017, 8. [Google Scholar] [CrossRef]
- McIntosh, R.A.; Wellings, C.R.; Park, R.F. Wheat Rusts: An Atlas of Resistance Genes; CSIRO Publishing: Melbourne, Australia, 1995. [Google Scholar]
- Sandermann, H.; Ernst, D.; Heller, W.; Langebartels, C. Ozone: An abiotic elicitor of plant defence reactions. Trends Plant Sci. 1998, 3, 47–50. [Google Scholar] [CrossRef]
- Jacob, D.J. Introduction to Atmospheric Chemistry. Available online: http://app.knovel.com/hotlink/toc/id:kpIAC00011/introduction-atmospheric/introduction-atmospheric (accessed on 23 November 2020).
- Iriti, M.; Faoro, F. Oxidative Stress, the Paradigm of Ozone Toxicity in Plants and Animals. Water Air Soil Pollut. 2007, 187, 285–301. [Google Scholar] [CrossRef]
- Fares, S.; Weber, R.; Park, J.-H.; Gentner, D.; Karlik, J.; Goldstein, A.H. Ozone deposition to an orange orchard: Partitioning between stomatal and non-stomatal sinks. Environ. Pollut. 2012, 169, 258–266. [Google Scholar] [CrossRef]
- Pellinen, R.; Palva, T.; Kangasjärvi, J. Subcellular localization of ozone-induced hydrogen peroxide production in birch (Betula pendula) leaf cells. Plant J. 1999, 20, 349–356. [Google Scholar] [CrossRef]
- Vahisalu, T.; Puzõrjova, I.; Brosché, M.; Valk, E.; Lepiku, M.; Moldau, H.; Pechter, P.; Wang, Y.; Lindgren, O.; Salojärvi, J.; et al. Ozone-triggered rapid stomatal response involves the production of reactive oxygen species, and is controlled by SLAC1 and OST1. Plant J. Cell Mol. Biol. 2010, 62, 442. [Google Scholar] [CrossRef]
- Altimir, N.; Kolari, P.; Tuovinen, J.P.; Vesala, T.; Bäck, J.; Suni, T.; Kulmala, M.; Hari, P. Foliage surface ozone deposition: A role for surface moisture? Biogeosciences 2006, 3, 209–228. [Google Scholar] [CrossRef]
- Singh, S.; Agrawal, S.B. Impact of tropospheric ozone on wheat (Triticum aestivum L.) in the eastern Gangetic plains of India as assessed by ethylenediurea (EDU) application during different developmental stages. Agric. Ecosyst. Environ. 2010, 138, 214–221. [Google Scholar] [CrossRef]
- Biswas, D.K.; Xu, H.; Li, Y.G.; Sun, J.Z.; Wang, X.Z.; Han, X.G.; Jiang, G.M. Genotypic differences in leaf biochemical, physiological and growth responses to ozone in 20 winter wheat cultivars released over the past 60 years. Glob. Chang. Biol. 2008, 14, 46–59. [Google Scholar] [CrossRef]
- Pleijel, H.; Eriksen, A.B.; Danielsson, H.; Bondesson, N.; Selldén, G. Differential ozone sensitivity in an old and a modern Swedish wheat cultivar—Grain yield and quality, leaf chlorophyll and stomatal conductance. Environ. Exp. Bot. 2006, 56, 63–71. [Google Scholar] [CrossRef]
- Feng, Z.; Tang, H.; Uddling, J.; Pleijel, H.; Kobayashi, K.; Zhu, J.; Oue, H.; Guo, W. A stomatal ozone flux–response relationship to assess ozone-induced yield loss of winter wheat in subtropical China. Environ. Pollut. 2012, 164, 16–23. [Google Scholar] [CrossRef]
- Hassan, I.A. Interactive Effects of Salinity and Ozone Pollution on Photosynthesis, Stomatal Conductance, Growth, and Assimilate Partitioning of Wheat (Triticum aestivum L.). Photosynthetica 2004, 42, 111–116. [Google Scholar] [CrossRef]
- Tiedemann, A.v.; Pfähler, B. Growth stage-dependent effects of ozone on the permeability for ions and non-electrolytes of wheat leaves in relation to the susceptibility to Septoria nodorum Berk. Physiol. Mol. Plant Pathol. 1994, 45, 153–167. [Google Scholar] [CrossRef]
- Meyer, U.; Köllner, B.; Willenbrink, J.; Krause, G.H.M. Effects of different ozone exposure regimes on photosynthesis, assimilates and thousand grain weight in spring wheat. Agric. Ecosyst. Environ. 2000, 78, 49–55. [Google Scholar] [CrossRef]
- Biswas, D.K.; Xu, H.; Li, Y.G.; Ma, B.L.; Jiang, G.M. Modification of photosynthesis and growth responses to elevated CO2 by ozone in two cultivars of winter wheat with different years of release. J. Exp. Bot. 2013, 64, 1485–1496. [Google Scholar] [CrossRef]
- Wattal, R.K.; Siddiqui, Z.H. Effect of Elevated Levels of Carbon Dioxide on the Activity of RuBisCO and Crop Productivity. In Crop Production and Global Environmental Issues; Hakeem, K.R., Ed.; Springer International Publishing: Berlin/Heidelberg, Germany, 2015; pp. 241–256. [Google Scholar]
- Burkart, S.; Bender, J.; Tarkotta, B.; Faust, S.; Castagna, A.; Ranieri, A.; Weigel, H.-J. Effects of Ozone on Leaf Senescence, Photochemical Efficiency and Grain Yield in Two Winter Wheat Cultivars. J. Agron. Crop Sci. 2013, 199, 275–285. [Google Scholar] [CrossRef]
- Gelang, J.; Pleijel, H.; Sild, E.; Danielsson, H.; Younis, S.; Selldén, G. Rate and duration of grain filling in relation to flag leaf senescence and grain yield in spring wheat (Triticum aestivum) exposed to different concentrations of ozone. Physiol. Plant. 2000, 110, 366–375. [Google Scholar] [CrossRef]
- Ojanpera, K.; Patsikka, E.; Ylaranta, T. Effects of low ozone exposure of spring wheat on net CO2 uptake, Rubisco, leaf senescence and grain filling. New Phytol. 1998, 138, 451–460. [Google Scholar] [CrossRef]
- Mashaheet, A.M.; Burkey, K.O.; Marshall, D.S. Chromosome location contributing to ozone tolerance in wheat. Plants 2019, 8, 261. [Google Scholar] [CrossRef] [PubMed]
- Amundson, R.G.; Kohut, R.J.; Schoettle, A.W.; Raba, R.M.; Reich, P.B. Correlative Reductions in Whole-Plant Photosynthesis and Yield of Winter Wheat Caused by Ozone. Phytopathology 1987, 77, 75–79. Available online: https://www.apsnet.org/publications/phytopathology/backissues/Documents/1987Articles/Phyto77n01_75.PDF (accessed on 23 November 2020). [CrossRef]
- Heagle, A.S.; Miller, J.E.; Pursley, W.A. Growth and yield responses of winter wheat to mixtures of ozone and carbon dioxide. Crop Sci. 2000, 40, 1656–1664. [Google Scholar] [CrossRef]
- Van Dingenena, R.; Dentenera, F.J.; Raesa, F.; Krol, M.C.; Emberson, L.; Cofala, J. The global impact of ozone on agricultural crop yields under current and future air quality legislation. Atmos. Environ. 2009, 43, 604–618. [Google Scholar] [CrossRef]
- Guarin, J.R.; Kassie, B.; Mashaheet, A.M.; Burkey, K.; Asseng, S. Modeling the effects of tropospheric ozone on wheat growth and yield. Eur. J. Agron. 2019, 105, 13–23. [Google Scholar] [CrossRef]
- Pleijel, H.; Broberg, M.C.; Uddling, J.; Mills, G. Current surface ozone concentrations significantly decrease wheat growth, yield and quality. Sci. Total Environ. 2018, 613–614, 687–692. [Google Scholar] [CrossRef]
- Mills, G.; Sharps, K.; Simpson, D.; Pleijel, H.; Frei, M.; Burkey, K.; Emberson, L.; Uddling, J.; Broberg, M.; Feng, Z.; et al. Closing the global ozone yield gap: Quantification and cobenefits for multistress tolerance. Glob. Chang. Biol. 2018, 24, 4869–4893. [Google Scholar] [CrossRef]
- Schauberger, B.; Rolinski, S.; Schaphoff, S.; Müller, C. Global historical soybean and wheat yield loss estimates from ozone pollution considering water and temperature as modifying effects. Agric. For. Meteorol. 2019, 265, 1–15. [Google Scholar] [CrossRef]
- Biswas, D.K.; Xu, H.; Li, Y.G.; Liu, M.Z.; Chen, Y.H.; Sun, J.Z.; Jiang, G.M. Assessing the genetic relatedness of higher ozone sensitivity of modern wheat to its wild and cultivated progenitors/relatives. J. Exp. Bot. 2008, 59, 951–963. [Google Scholar] [CrossRef] [PubMed]
- Broberg, M.C.; Feng, Z.; Xin, Y.; Pleijel, H. Ozone effects on wheat grain quality—A summary. Environ. Pollut. 2015, 197, 203–213. [Google Scholar] [CrossRef] [PubMed]
- Feng, Z.; Kobayashi, K.; Ainsworth, E.A. Impact of elevated ozone concentration on growth, physiology, and yield of wheat (Triticum aestivum L.): A meta-analysis. Glob. Chang. Biol. 2008, 14, 2696–2708. [Google Scholar] [CrossRef]
- Feng, Z.; Kobayashi, K. Assessing the impacts of current and future concentrations of surface ozone on crop yield with meta-analysis. Atmos. Environ. 2009, 43, 1510–1519. [Google Scholar] [CrossRef]
- Barnes, J.; Bender, J.; Lyons, T.; Borland, A. Natural and man-made selection for air pollution resistance. J. Exp. Bot. 1999, 50, 1423–1435. [Google Scholar] [CrossRef]
- Comis, D. Breeding Plants for a High-Ozone World. Agric. Res. 2011, 59, 14. Available online: https://agresearchmag.ars.usda.gov/AR/archive/2011/Jul/plants0711.pdf (accessed on 23 November 2020).
- Ainsworth, E.A.; Rogers, A.; Leakey, A.D.B. Targets for Crop Biotechnology in a Future High-CO2 and High-O3 World. Plant Physiol. 2008, 147, 13–19. [Google Scholar] [CrossRef]
- Rogers, H.H.; Jeffries, H.E.; Stahel, E.P.; Heck, W.W.; Ripperton, L.A.; Witherspoon, A.M. Measuring Air Pollutant Uptake by Plants: A Direct Kinetic Technique. J. Air Pollut. Control Assoc. 1977, 27, 1192. [Google Scholar] [CrossRef]
- Heck, W.W.; Dunning, J.A.; Philbeck, R.B. A Continuous Stirred Tank Reactor (CSTR) System for Exposing Plants to Gaseous Air Contaminants: Principles, Specifications, Construction, and Operation; Deptartment of Agriculture, Agricultural Research Service, Southern Region: New Orleans, LA, USA, 1978. [Google Scholar]
- Flowers, M.D.; Fiscus, E.L.; Burkey, K.O.; Booker, F.L.; Dubois, J.-J.B. Photosynthesis, chlorophyll fluorescence, and yield of snap bean (Phaseolus vulgaris L.) genotypes differing in sensitivity to ozone. Environ. Exp. Bot. 2007, 61, 190–198. [Google Scholar] [CrossRef]
- Begum, H.; Alam, M.S.; Feng, Y.; Koua, P.; Ashrafuzzaman, M.; Shrestha, A.; Kamruzzaman, M.; Dadshani, S.; Ballvora, A.; Naz, A.A. Genetic dissection of bread wheat diversity and identification of adaptive loci in response to elevated tropospheric ozone. Plant. Cell Environ. 2020, 1–16. [Google Scholar] [CrossRef]
- Quarrie, S.A.; Kaminska, A.; Dodmani, A.; González, I. QTLs governing ozone impacts on wheat yield. Comp. Biochem. Physiol. Part A Mol. Integr. Physiol. 2007, 146, S261. [Google Scholar] [CrossRef]
- Morgounov, A.; Tufan, H.A.; Sharma, R.; Akin, B.; Bagci, A.; Braun, H.-J.; Kaya, Y.; Keser, M.; Payne, T.S.; Sonder, K.; et al. Global incidence of wheat rusts and powdery mildew during 1969–2010 and durability of resistance of winter wheat variety Bezostaya 1. Eur. J. Plant Pathol. 2012, 132, 323–340. [Google Scholar] [CrossRef]
- McDonald, B.A.; Linde, C. Pathogen population genetics, evolutionary potential, and durable resistance. Annu. Rev. Phytopathol. 2002, 40, 349–379. [Google Scholar] [CrossRef] [PubMed]
- Kolmer, J.A. Tracking wheat rust on a continental scale. Curr. Opin. Plant Biol. 2005, 8, 441–449. [Google Scholar] [CrossRef] [PubMed]
- Ali, I. Inheritance of Leaf Rust Resistance in Wheat Cultivars Morocco and Little Club. Plant Dis. 1994, 78, 383. [Google Scholar] [CrossRef]
- Zeven, A.C. Fifth supplementary list of wheat varieties classified according to their genotype for hybrid necrosis and geographical distribution of Ne-genes. Euphytica 1971, 20, 239–254. [Google Scholar] [CrossRef]
- Luig, N.H. A Survey of Virulence Genes in Wheat Stem Rust, Puccinia Graminis f. sp. Tritici; Advances i. Berlin, Hamburg; Verlag Paul Parey: Berlin, Germany, 1983. [Google Scholar]
- Knott, D.R. Agronomic and quality characters of near-isogenic lines of wheat carrying genes for stem rust resistance. Euphytica 1993, 68, 33–41. [Google Scholar] [CrossRef]
- Middleton, G.K.; Bennett, J.R.; Newton, H.C. Registration of McNair 701 Wheat. Crop Sci. 1973, 13, 585. [Google Scholar] [CrossRef]
- Zadoks, J.C.; Chang, T.T.; Konzak, C.F. A decimal code for the growth stages of cereals. Weed Res. 1974, 14, 415–421. [Google Scholar] [CrossRef]
- Mashaheet, A.M.S. Effects of Near-Ambient O3 and CO2 on Wheat Performance and Interactions with Leaf and Stem Rust Pathogens. Ph.D. Thesis, North Carolina State University, Raleigh, NC, USA, 2016. [Google Scholar]
- Bergmann, E.; Bender, J.; Weigel, H.J. Impact of tropospheric ozone on terrestrial biodiversity: A literature analysis to identify ozone sensitive taxa. J. Appl. Bot. Food Qual. 2017, 90, 11–21. [Google Scholar] [CrossRef]
- Mills, G.; Hayes, F.; Simpson, D.; Emberson, L.; Norris, D.; Harmens, H.; Büker, P. Evidence of widespread effects of ozone on crops and (semi-)natural vegetation in Europe (1990–2006) in relation to AOT40- and flux-based risk maps. Glob. Chang. Biol. 2011, 17, 592–613. [Google Scholar] [CrossRef]
- Dohmen, G.P. Secondary effects of air pollution: Ozone decreases brown rust disease potential in wheat. Environ. Pollut. 1987, 43, 189–194. [Google Scholar] [CrossRef]
- Heagle, A.S.; Key, L.W. Effect of Puccinia graminis f. sp. tritici on Ozone Injury in Wheat. Phytopathology 1973, 63, 609. [Google Scholar] [CrossRef]
- Helfer, S. Rust fungi and global change. New Phytol. 2014, 201, 770–780. [Google Scholar] [CrossRef]
- Tiedemann, A.; Weigel, H.J.-J.; Jäger, H.J.-J. Effects of open-top chamber fumigations with ozone on three fungal leaf diseases of wheat and the mycoflora of the phyllosphere. Environ. Pollut. 1991, 72, 205–224. [Google Scholar] [CrossRef]
- Tiedemann, A. Ozone Effects on Fungal Leaf Diseases of Wheat in Relation to Epidemiology. II. Biotrophic Pathogens. J. Phytopathol. Z. 1992, 134, 187–197. [Google Scholar]
- Tiedemann, A.V.; Firsching, K.H.; Tiedemann, A.V.; Firsching, K.H. Interactive effects of elevated ozone and carbon dioxide on growth and yield of leaf rust-infected versus non-infected wheat. Environ. Pollut. 2000, 108, 357–363. [Google Scholar] [CrossRef]
- Mayer, K.F.X.; Rogers, J.; Doležel, J.; Pozniak, C.J.; IWGSC. A chromosome-based draft sequence of the hexaploid bread wheat (Triticum aestivum) genome. Science 2014, 345, 1251788. [Google Scholar] [CrossRef]
- Quarrie, S.A.; Steed, A.; Calestani, C.; Semikhodskii, A.; Lebreton, C.; Chinoy, C.; Steele, N.; Pljevljakusić, D.; Waterman, E.; Weyen, J.; et al. A high-density genetic map of hexaploid wheat (Triticum aestivum L.) from the cross Chinese Spring × SQ1 and its use to compare QTLs for grain yield across a range of environments. Theor. Appl. Genet. 2005, 110, 865–880. [Google Scholar] [CrossRef]
- Quarrie, S.A.; Gulli, M.; Calestani, C.; Steed, A.; Marmiroli, N. Location of a gene regulating drought-induced abscisic acid production on the long arm of chromosome 5A of wheat. Theor. Appl. Genet. 1994, 89, 794–800. [Google Scholar] [CrossRef]
- Hiebert, C.W.; Kolmer, J.A.; McCartney, C.A.; Briggs, J.; Fetch, T.; Bariana, H. Major Gene for Field Stem Rust Resistance Co-Locates with Resistance Gene Sr12 in ‘Thatcher’ Wheat. PLoS ONE 2016, 11, e0157029. [Google Scholar] [CrossRef] [PubMed]


Publisher’s Note: MDPI stays neutral with regard to jurisdictional claims in published maps and institutional affiliations. |
© 2020 by the authors. Licensee MDPI, Basel, Switzerland. This article is an open access article distributed under the terms and conditions of the Creative Commons Attribution (CC BY) license (http://creativecommons.org/licenses/by/4.0/).
Share and Cite
Mashaheet, A.M.; Burkey, K.O.; Saitanis, C.J.; Abdelrhim, A.S.; Rafiullah; Marshall, D.S. Differential Ozone Responses Identified among Key Rust-Susceptible Wheat Genotypes. Agronomy 2020, 10, 1853. https://doi.org/10.3390/agronomy10121853
Mashaheet AM, Burkey KO, Saitanis CJ, Abdelrhim AS, Rafiullah, Marshall DS. Differential Ozone Responses Identified among Key Rust-Susceptible Wheat Genotypes. Agronomy. 2020; 10(12):1853. https://doi.org/10.3390/agronomy10121853
Chicago/Turabian StyleMashaheet, Alsayed M., Kent O. Burkey, Costas J. Saitanis, Abdelrazek S. Abdelrhim, Rafiullah, and David S. Marshall. 2020. "Differential Ozone Responses Identified among Key Rust-Susceptible Wheat Genotypes" Agronomy 10, no. 12: 1853. https://doi.org/10.3390/agronomy10121853
APA StyleMashaheet, A. M., Burkey, K. O., Saitanis, C. J., Abdelrhim, A. S., Rafiullah, & Marshall, D. S. (2020). Differential Ozone Responses Identified among Key Rust-Susceptible Wheat Genotypes. Agronomy, 10(12), 1853. https://doi.org/10.3390/agronomy10121853