Article

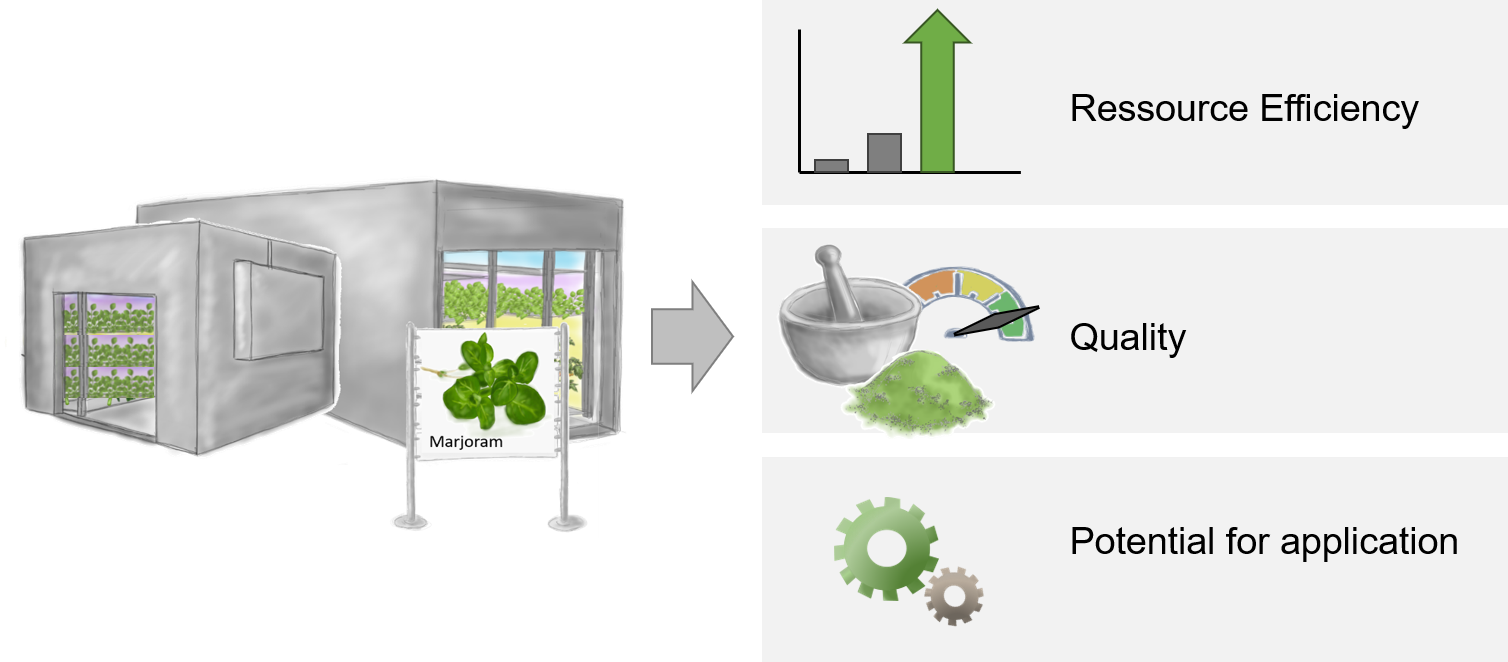
Indoor Farming Marjoram Production—Quality, Resource Efficiency, and Potential of Application

Department of Horticulture and Food Technology, University of Applied Sciences Weihenstephan-Triesdorf (HSWT), Am Staudengarten 10, 85354 Freising, Germany
*
Author to whom correspondence should be addressed.
Agronomy 2020, 10(11), 1769; https://doi.org/10.3390/agronomy10111769
Submission received: 30 September 2020 / Revised: 6 November 2020 / Accepted: 7 November 2020 / Published: 12 November 2020
(This article belongs to the Special Issue Role of Vertical Farming in Modern Horticultural Crop Production)

Abstract

:
Indoor vertical farming offers great opportunities regarding a sustainable and consistent production of high-quality herbs and raw materials all year round for the perfume, chemical, or food industry. Cultivation takes place in an enclosed structure, operating predominantly independent from external conditions in multi-layer systems equipped with artificial lighting, enabling extremely high resource use efficiencies with a simultaneous increase in yield. On the other hand, field production in terms of plant quality and harvesting times is highly influenced by environmental conditions, making it difficult to maintain homogenous raw material qualities throughout the year. To show how different light qualities affect the overall efficiency and quality of Origanum majorana grown in an indoor farm, the resource consumption, yield, and cultivation time as well as the essential oil quantity was analyzed, and the efficiencies in terms of energy and land use efficiency calculated. The experimental setup clearly demonstrated that the yield regarding fresh as well as dry matter and oil content was comparable to one square meter of open field production. Based on this, the multi-layer system and the noticeable lowered growth period result in a significantly higher area efficiency compared to the open field, leading to a potential increase of annual yields of dried leave weight and oil contents by up to 21 times. It was also shown that a white spectrum (W) showed similar influence on plant growth and yield as a spectrum consisting of blue and red (B/R). Nevertheless, the LED treatment W did show higher light use efficiencies as well as a better working conditions inside the cultivation chamber. By an integration of indoor vertical farming into existing industrial processes, new and innovative opportunities for a flexible and low-risk supply chain seem feasible and according to German food industry meet the interests of existing stakeholders.

Graphical Abstract

1. Introduction

Today the production of plant material is highly influenced by industrial needs. The demand is characterized by constant availability and based on quantities and homogeneous qualities. Within recent years, quality also focused on special secondary plant metabolites to be used in aromatic or therapeutic applications or as source material for the perfume and chemical industry. Furthermore, due to the limited availability of water, accessible land, and fertile soil as well as the lack of favorable microclimatic conditions, which are affected by the increased occurrence of extreme weather conditions due to climate change, a sustainable and at the same time highly flexible agricultural production may be necessary for the coming decades. In addition to intensified precision farming and ecologically sustainable methods, a further way of meeting these challenges is indoor vertical farming.
Marjoram (Origanum majorana L.), often also referred to as “sweet marjoram”, is a perennial herb, native to the Mediterranean area. It is commonly used in pharmaceutical and food production processes [1]. The cultivation takes place in several countries in Europe, northern America, and Asia. Marjoram is normally grown outdoors in the field, where it is either sown directly into the soil or less commonly planted by greenhouse grown seedlings [2]. Due to unfavorable and often unpredictable climatic and soil conditions, plant growth, and quality, e.g., yield, and oil content, varies greatly. It is reported that yield, and also a uniform plant size, can be improved by using seedlings, since the initial cultivation stage is more weather independent [1]. Marjoram is harvested as soon as the first flower buds appear by cutting the above ground biomass at a height of 5 cm in order to reduce contamination [1,3,4]. In Germany, two harvest periods are common during a short period of July to September, while depending on the weather conditions and the use of an irrigation system up to three cuts are possible [4]. After drying, the leaves and flowers are separated from the stems.
While in general the focus of fresh vegetable production is primarily on the yield, the parameter for pricing is as important. Once the raw plant material is produced for industrial processes, further quality aspects like the purity of the plant material in terms of microbial infestation, the absence of weeds or insects are of interest. Other important parameters are the essential oil content, concentration of secondary metabolites as well as the absence of heavy metals. This is especially due to a close relationship between the volatile profile and the specific organoleptic properties of the final product, as has been shown for meat products [5]. Quality controls focus on a homogenous quantity and quality of essential oils in plant raw materials. Due to the open field production and the purchase from several producers with differing cultivation conditions, the raw plant material often varies greatly. Furthermore, to cover the year-round demand of dried raw plant material long storage periods are necessary, posing a certain qualitative loss. Apart from the total oil content as an important quality criterion at delivery, oil composition of marjoram and the flavoring character are also of central importance for processing.
The essential oils of marjoram are reported to be present as terpinene-4-ol and sabinene as well as thymol and carvacrol as major compounds [6,7], whereas the combination of terpinene-4-ol with cis-sabinene hydrate is responsible for the characteristic flavor and fragrance [8]. Furthermore, appreciable amounts of p-cymene and γ-terpinene have been found [9]. Thereby the accumulation and the final composition of essential oils is highly influenced by the cultivation conditions, climate, and growth stage at the time of harvest [7,10,11].
One approach to produce consistent quality all year round is indoor vertical farming. By the use of artificial lighting in multi-layer hydroponic systems, the cultivation takes place in an enclosed structure and operates predominantly independent from external conditions. Therefore, it enables a complete control over environmental factors [12]. This production system allows extremely high resource use efficiencies with a simultaneous increase in yield [13,14,15]. Furthermore, due to the ability to precisely manipulate environmental conditions during the production process, an increase in secondary metabolite accumulation in herbs like Coriandrum sativum L. [16] or Ocimum basilicum [17] as well as a decrease in contamination risks [18] is feasible. The application of different light spectral qualities offered by LEDs to influence volatile compounds were investigated by several researchers for plants like Ocimum basilicum [19,20,21]. Therefore, indoor vertical farming offers great opportunities with respect to a sustainable and consistent production of high-quality herbs for the fresh market and year-round raw materials for the perfume, chemical, or food industry. Nevertheless, the investment and running costs for an indoor vertical farm to date are immense [13,22]. Therefore, strategies to maximize productivity and resource efficiency are an important issue in scientific reports as well as for producers.
Despite extensive literature research no scientific studies regarding a production of marjoram in an indoor farming system in combination with information on the influence of light spectral quality on the volatile compounds of marjoram or the resource efficiency could be found. However, an integration of indoor vertical farming into existing industrial processes will open up new and innovative opportunities for flexible and low-risk supply chains. Accordingly, the aim of this study is to demonstrate how different light qualities affect the overall efficiency and quality of marjoram grown in an indoor farm. Therefore, the resource consumption, yield, and cultivation time as well as the essential oil quantity and composition is analyzed. In addition, efficiencies in terms of energy and land use efficiency are calculated for a further evaluation. Furthermore, the potential integration into the existing food processing industry will be discussed.

2. Materials and Methods

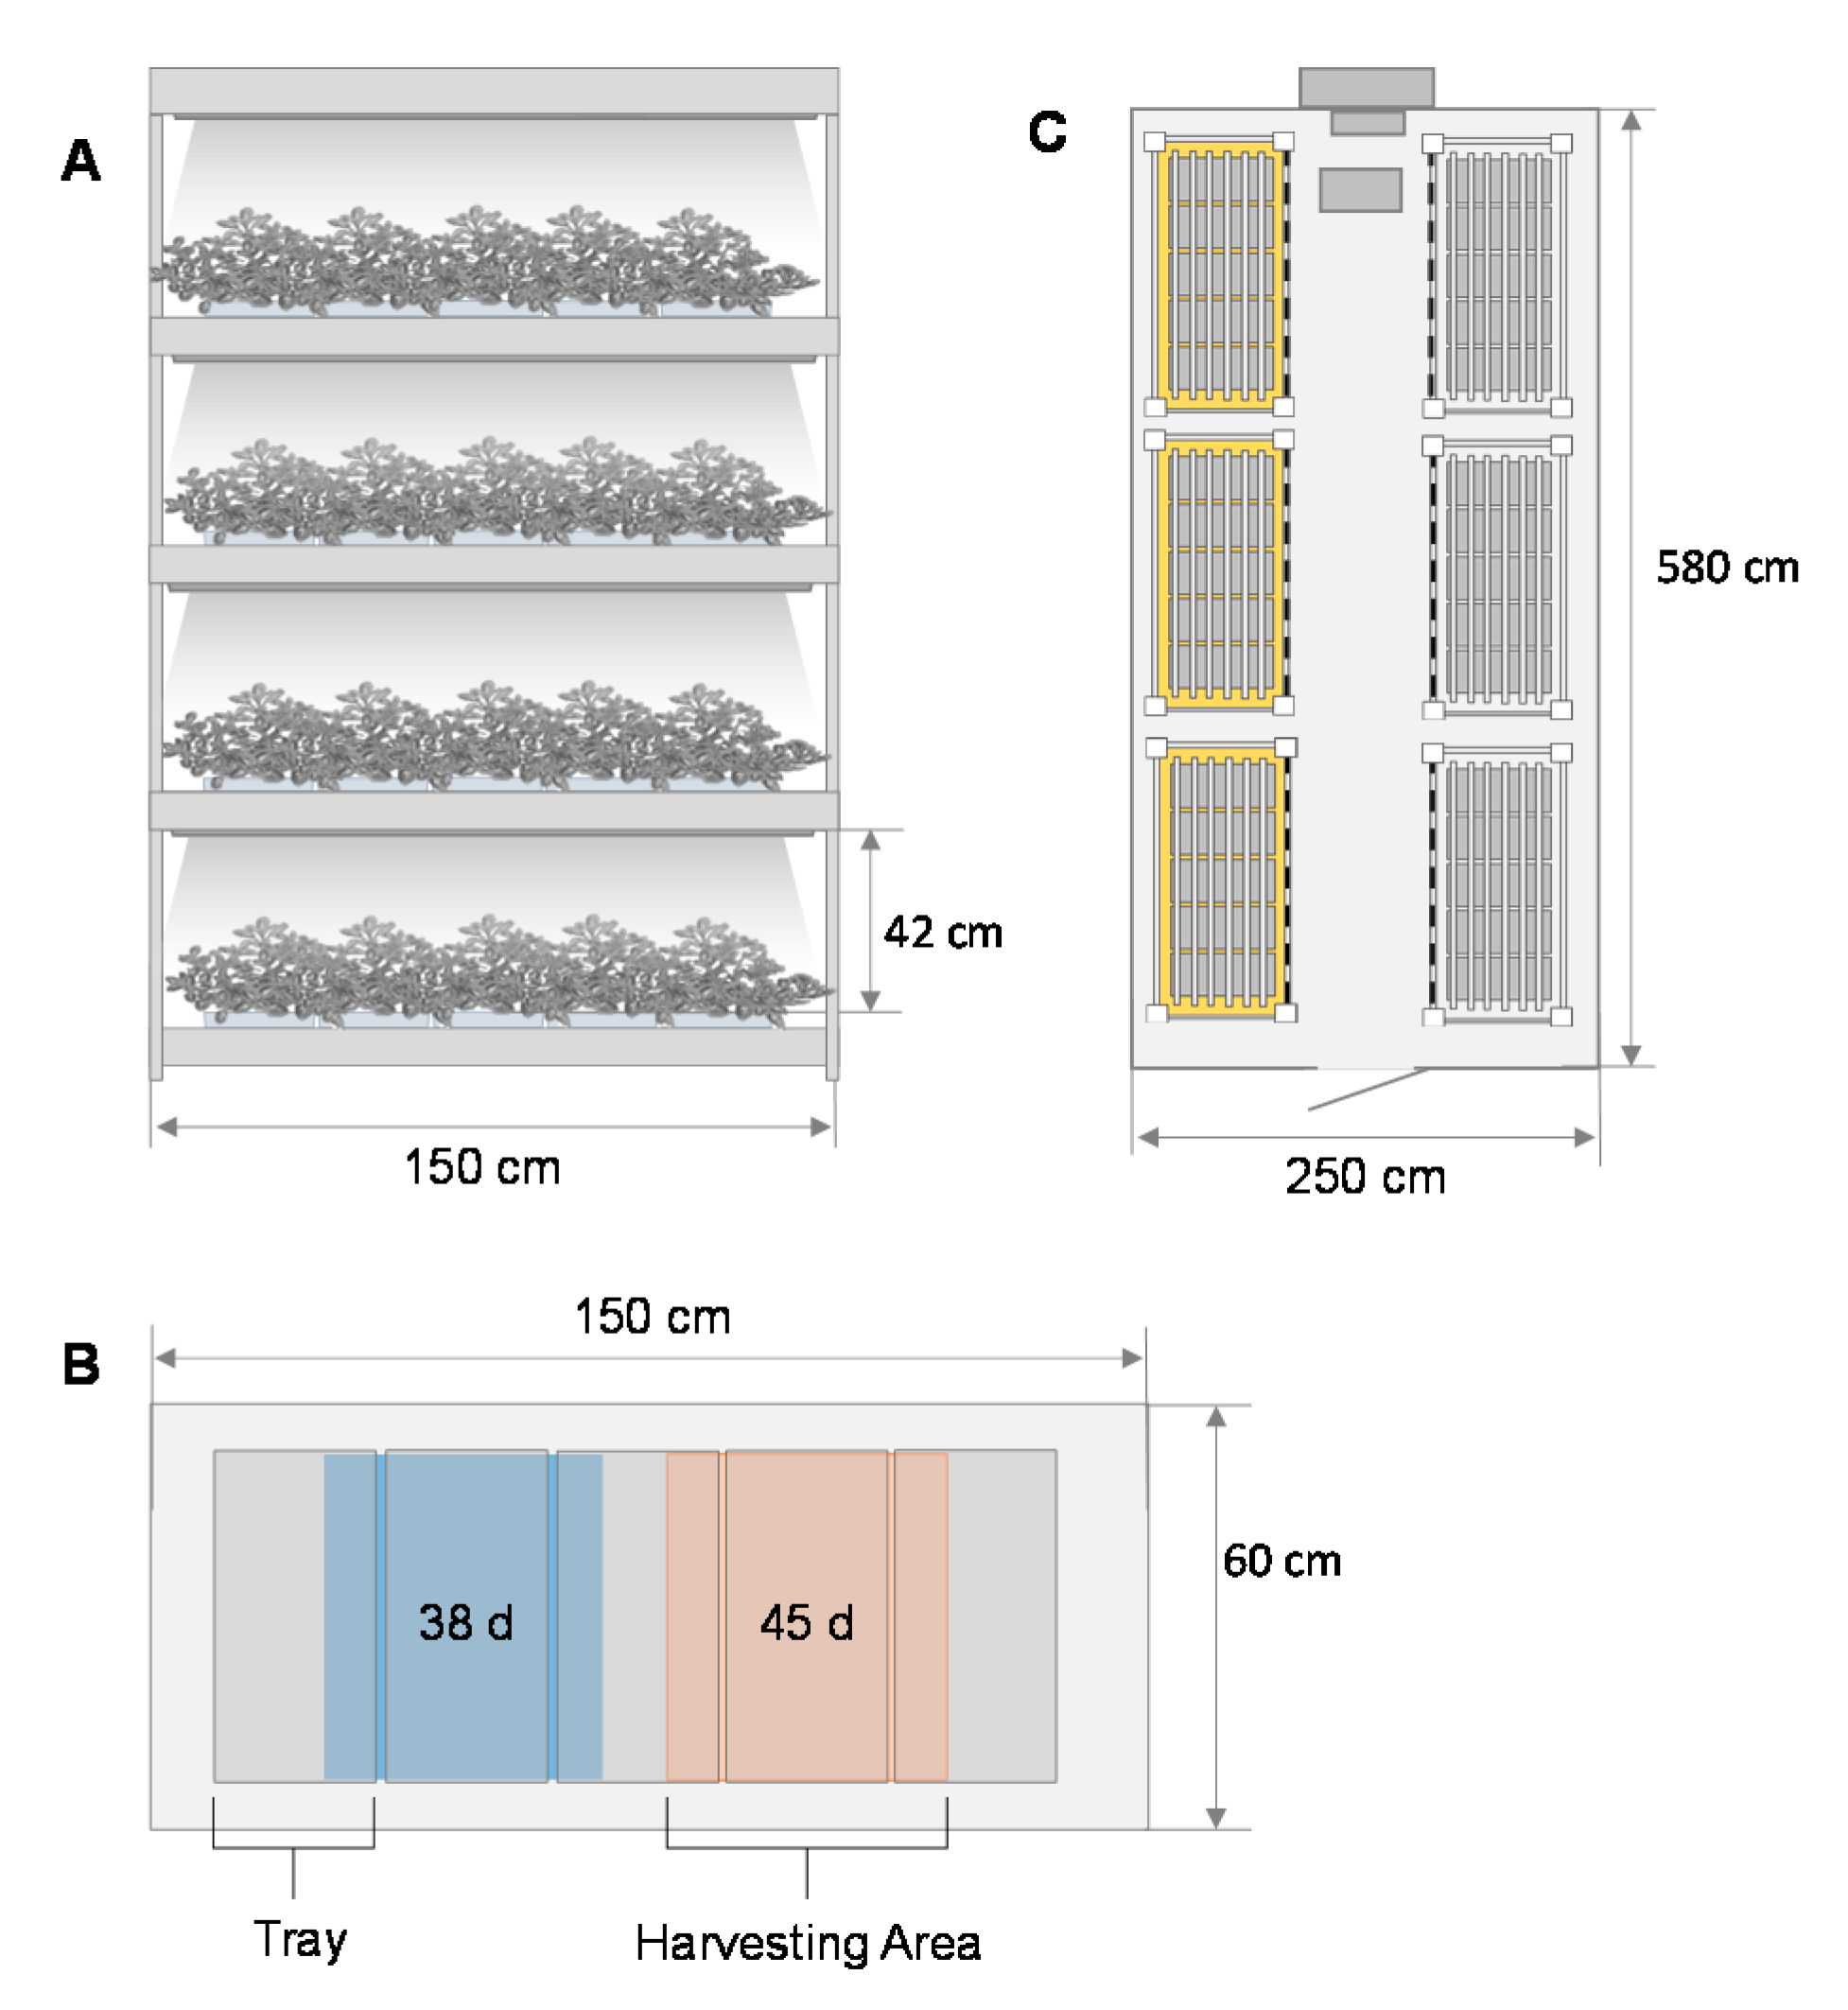
2.1. Plant Material and Culture Conditions

The indoor farm at the University of Applied Science Weihenstephan-Triesdorf is a subsequently insulated 45-foot long shipping container with two identical, separate growth chambers. Each chamber is equipped with six multi-layer shelving-units resulting in a total cultivation area of 21 m2 and a floor area of 10.1 m2. The distance between each level is 40 cm, each level offers 0.84 m2 cultivation area (Figure 1A). Marjoram Origanum majorana seeds (N.L. Chrestensen Erfurter Samen- und Pflanzenzucht GmbH, Erfurt, Germany) were sown in biodegradable Growcoons (104D-H30, Ø 35-28 mm, Maan BioBased Products B.V., Raalte, The Netherlands). Each Growcoon was filled with peat/clay substrate (type P, Einheitserde, Germany) and moisturized one-day prior sowing. Immediately before sowing, the Growcoons were moistened again and 10–15 seeds were evenly distributed on the surface of each Growcoon, respectively. In the following, one Growcoon is defined as one plant. The sowings were placed in trays (HP US 104/3.2P-25, HerkuPlast Kubern GmbH, Erfurt, Germany). After 17 d the plants were set up at final tray-distance, leaving one space between each plant empty, resulting in 52 plants per tray and a total of five trays per level (Figure 1B). Furthermore, a micro-perforated PE-foil (Aquafol®, Reimann Textiles, Emsdetten, Germany) was placed under the trays to improve water buffering of the plants after rooting and to prevent possible algae formation. Three shelving-units with a total of 12 levels were selected for the experiment. To ensure a homogenous climate and light distribution, a white reflective foil was stretched in front of each shelf level, represented as dashed line in (Figure 1C).
During the whole cultivation period the temperature and humidity was kept at 25.9 ± 0.9 °C and 59.4 ± 8.0% RH (the unit of air humidity). Temperature and humidity logger (TFA Dostmann GmbH & Co. KG, Wertheim-Reicholzheim, Germany) placed at each level monitored both temperature as well as humidity during the whole cultivation time. CO2 concentrations were between 467 ± 139 ppm without additional fumigation. The fans were kept at a constant power setting during the entire culture period. Comparable air velocities were controlled using freely fluttering strips that were attached to each shelf level. Irrigation was carried out at the time of sowing by hand and then using the existing ebb and flow system. The irrigation by a nutrient solution (electrical conductivity (EC) of 1.6 mS cm−1 and a pH of 5.7 was activated for the first 15 d once and following twice per day, carefully keeping the plants at a well-watered state at any time depending on their growth stage and water uptake. The composition of the nutrient solution was as followed 13.5 mmM l−1 N (NO3), 1 mmM l−1 P, 6.5 mmM l−1 K, 1.5 mmM l−1 Mg, 4.5 mmM l−1 Ca, and 1.5 mmM l−1 S as major nutrients and minor nutrients: 35 µmM l−1 Fe, 5 µmM l−1 Mn, 20 µmM l−1 B, 0.5 µmM l−1 Mo, 0.75 µmM l−1 Cu, and 4 µmM l−1 Zn. Electrical energy requirements for climatization, lighting, dehumidification, and vents were monitored using energy data logger (Saia-Burgess Controls, Murten, Switzerland) during the entire cultivation period. Since the total power and water consumption of climatization, vents, dehumidification, and fresh water used was documented over the entire compartment, the remaining shelves were also completely filled with plants to ensure a representative consumption calculation per m2 or produced biomass.

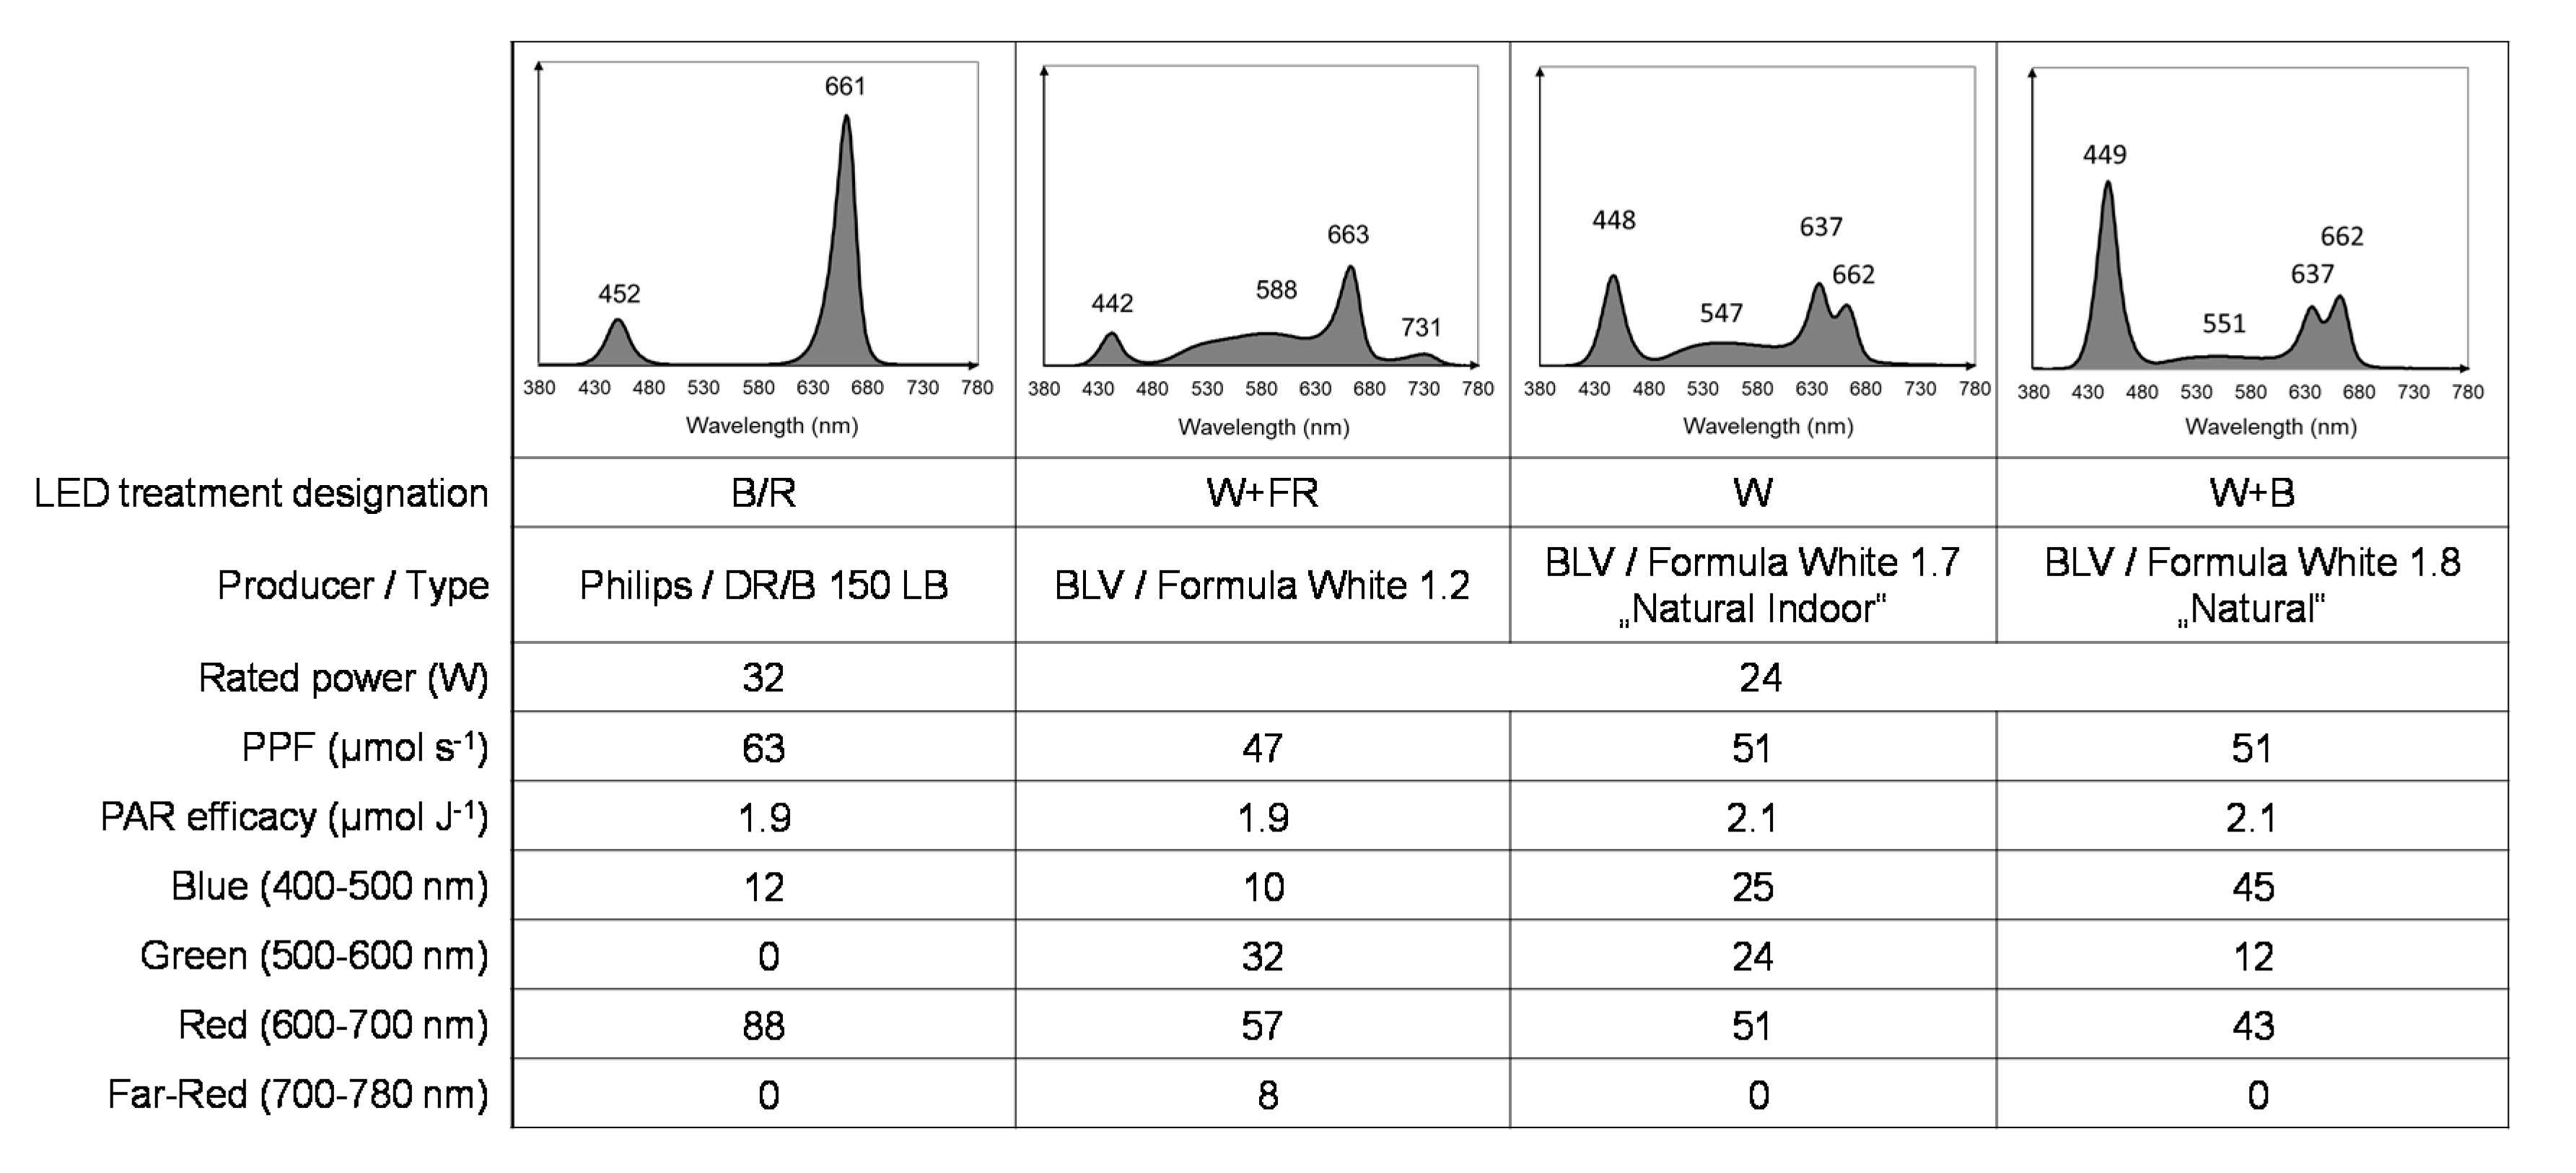
2.2. Light Treatment

The experimental setup comprised four different spectra and two harvest periods. The light treatment RB (B/R) (DR/B 150 LB, Philips (Signify, Eindhoven, The Netherlands) acted as standard. In the experiment we focused on three white spectra (HORTURION CL 230-24 80 Formula White series, BLV, Steinhöring, Germany), characterized by a high proportion of green in combination with far red (W+FR), an equal proportion of green and blue (W) and a significantly increased proportion of blue (W+B) (Figure 2). Spectral properties were determined in each shelf respectively with a handheld spectrometer (MK350S Premium, UPRtek, Taiwan).
The four lighting treatments were randomly assigned to the 12 selected levels of the indoor farm with no duplication of LED treatments within one shelf. In order to reach the maximum yield in the given system, the dark/light period was set to 4/20 h, aiming at a target DLI of 25 mol m−2 d−1. For comparable intensities, 6 LED modules per level were installed for the LED treatments W+FR, W and W+B. The LED treatment B/R consisted of 5 LED modules. To ensure homogeneous light intensities of 362 ± 55 μmol m−2 s−1 at a distance of 25.5 cm to the LED, the light distribution for each lighting treatment was carefully measured by a grid of 10 cm2 using a LI-COR quantum sensor (LI-190R, Li-COR, Lincoln, NE, USA). Based on the recorded light distribution two harvesting areas were defined for all repetitions, leaving the remaining plants as border plants (Figure 1B). In order to determine the electrical energy consumption of the LED, own measurements of the energy consumption as well as the manufacturer’s information of the rated power was used.

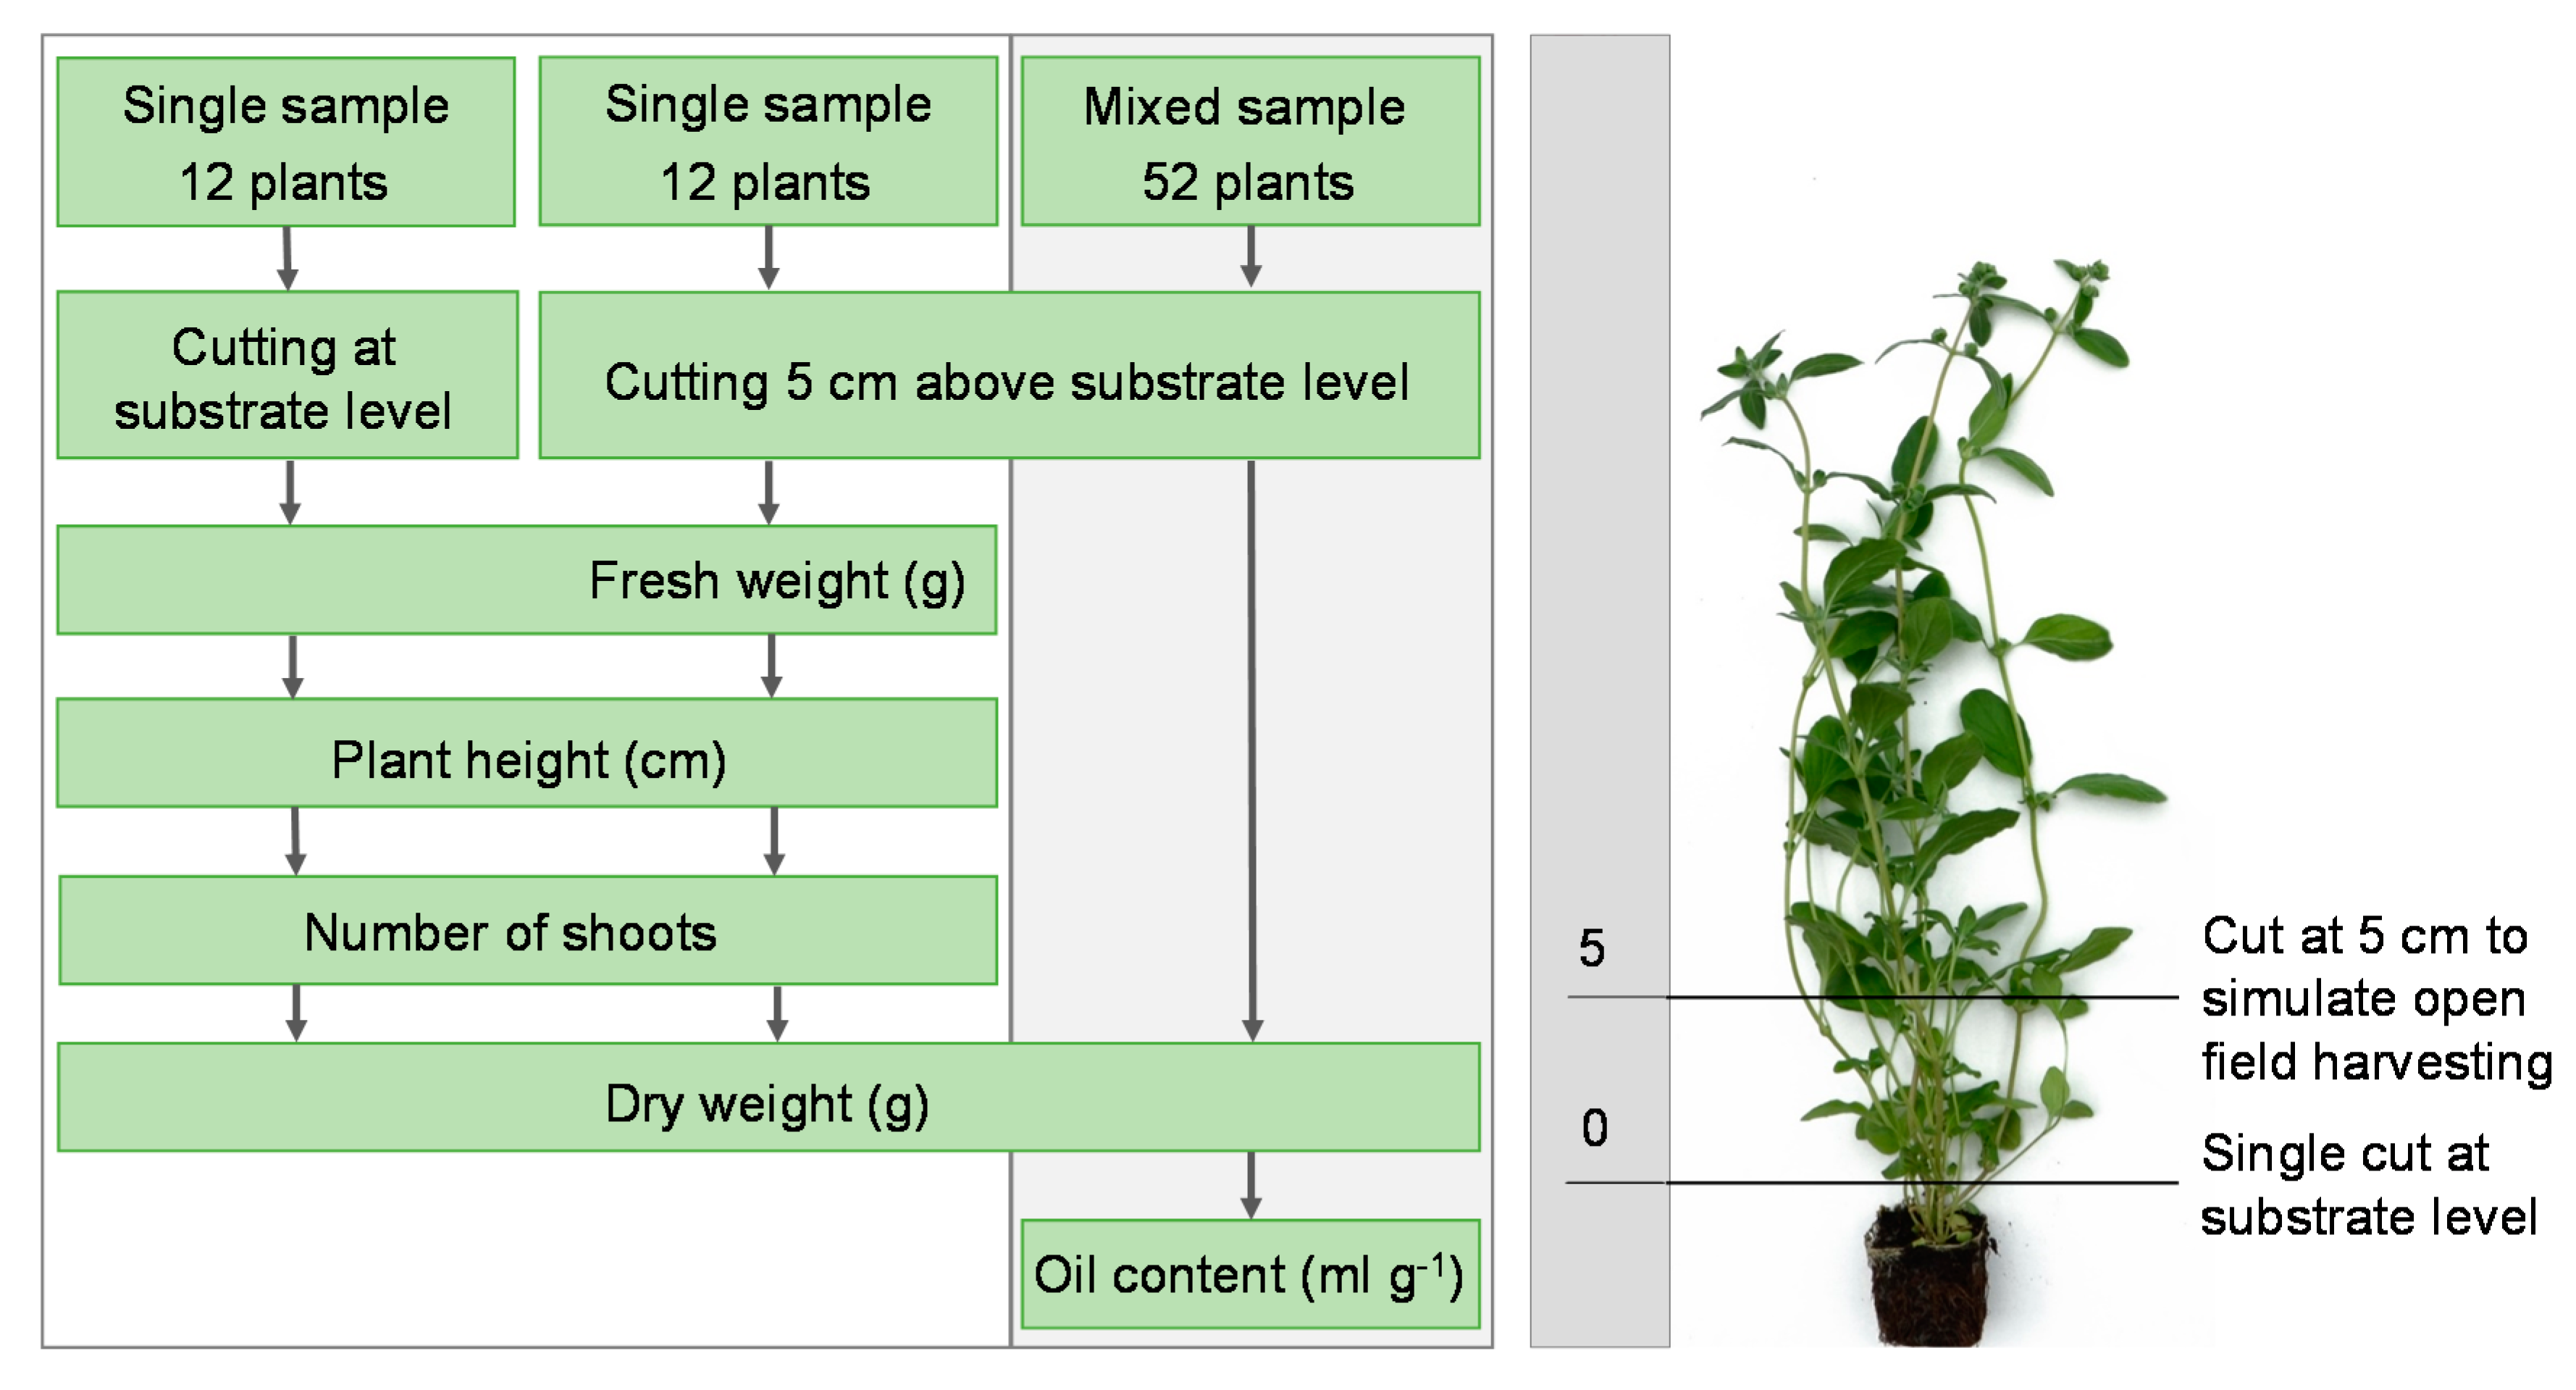
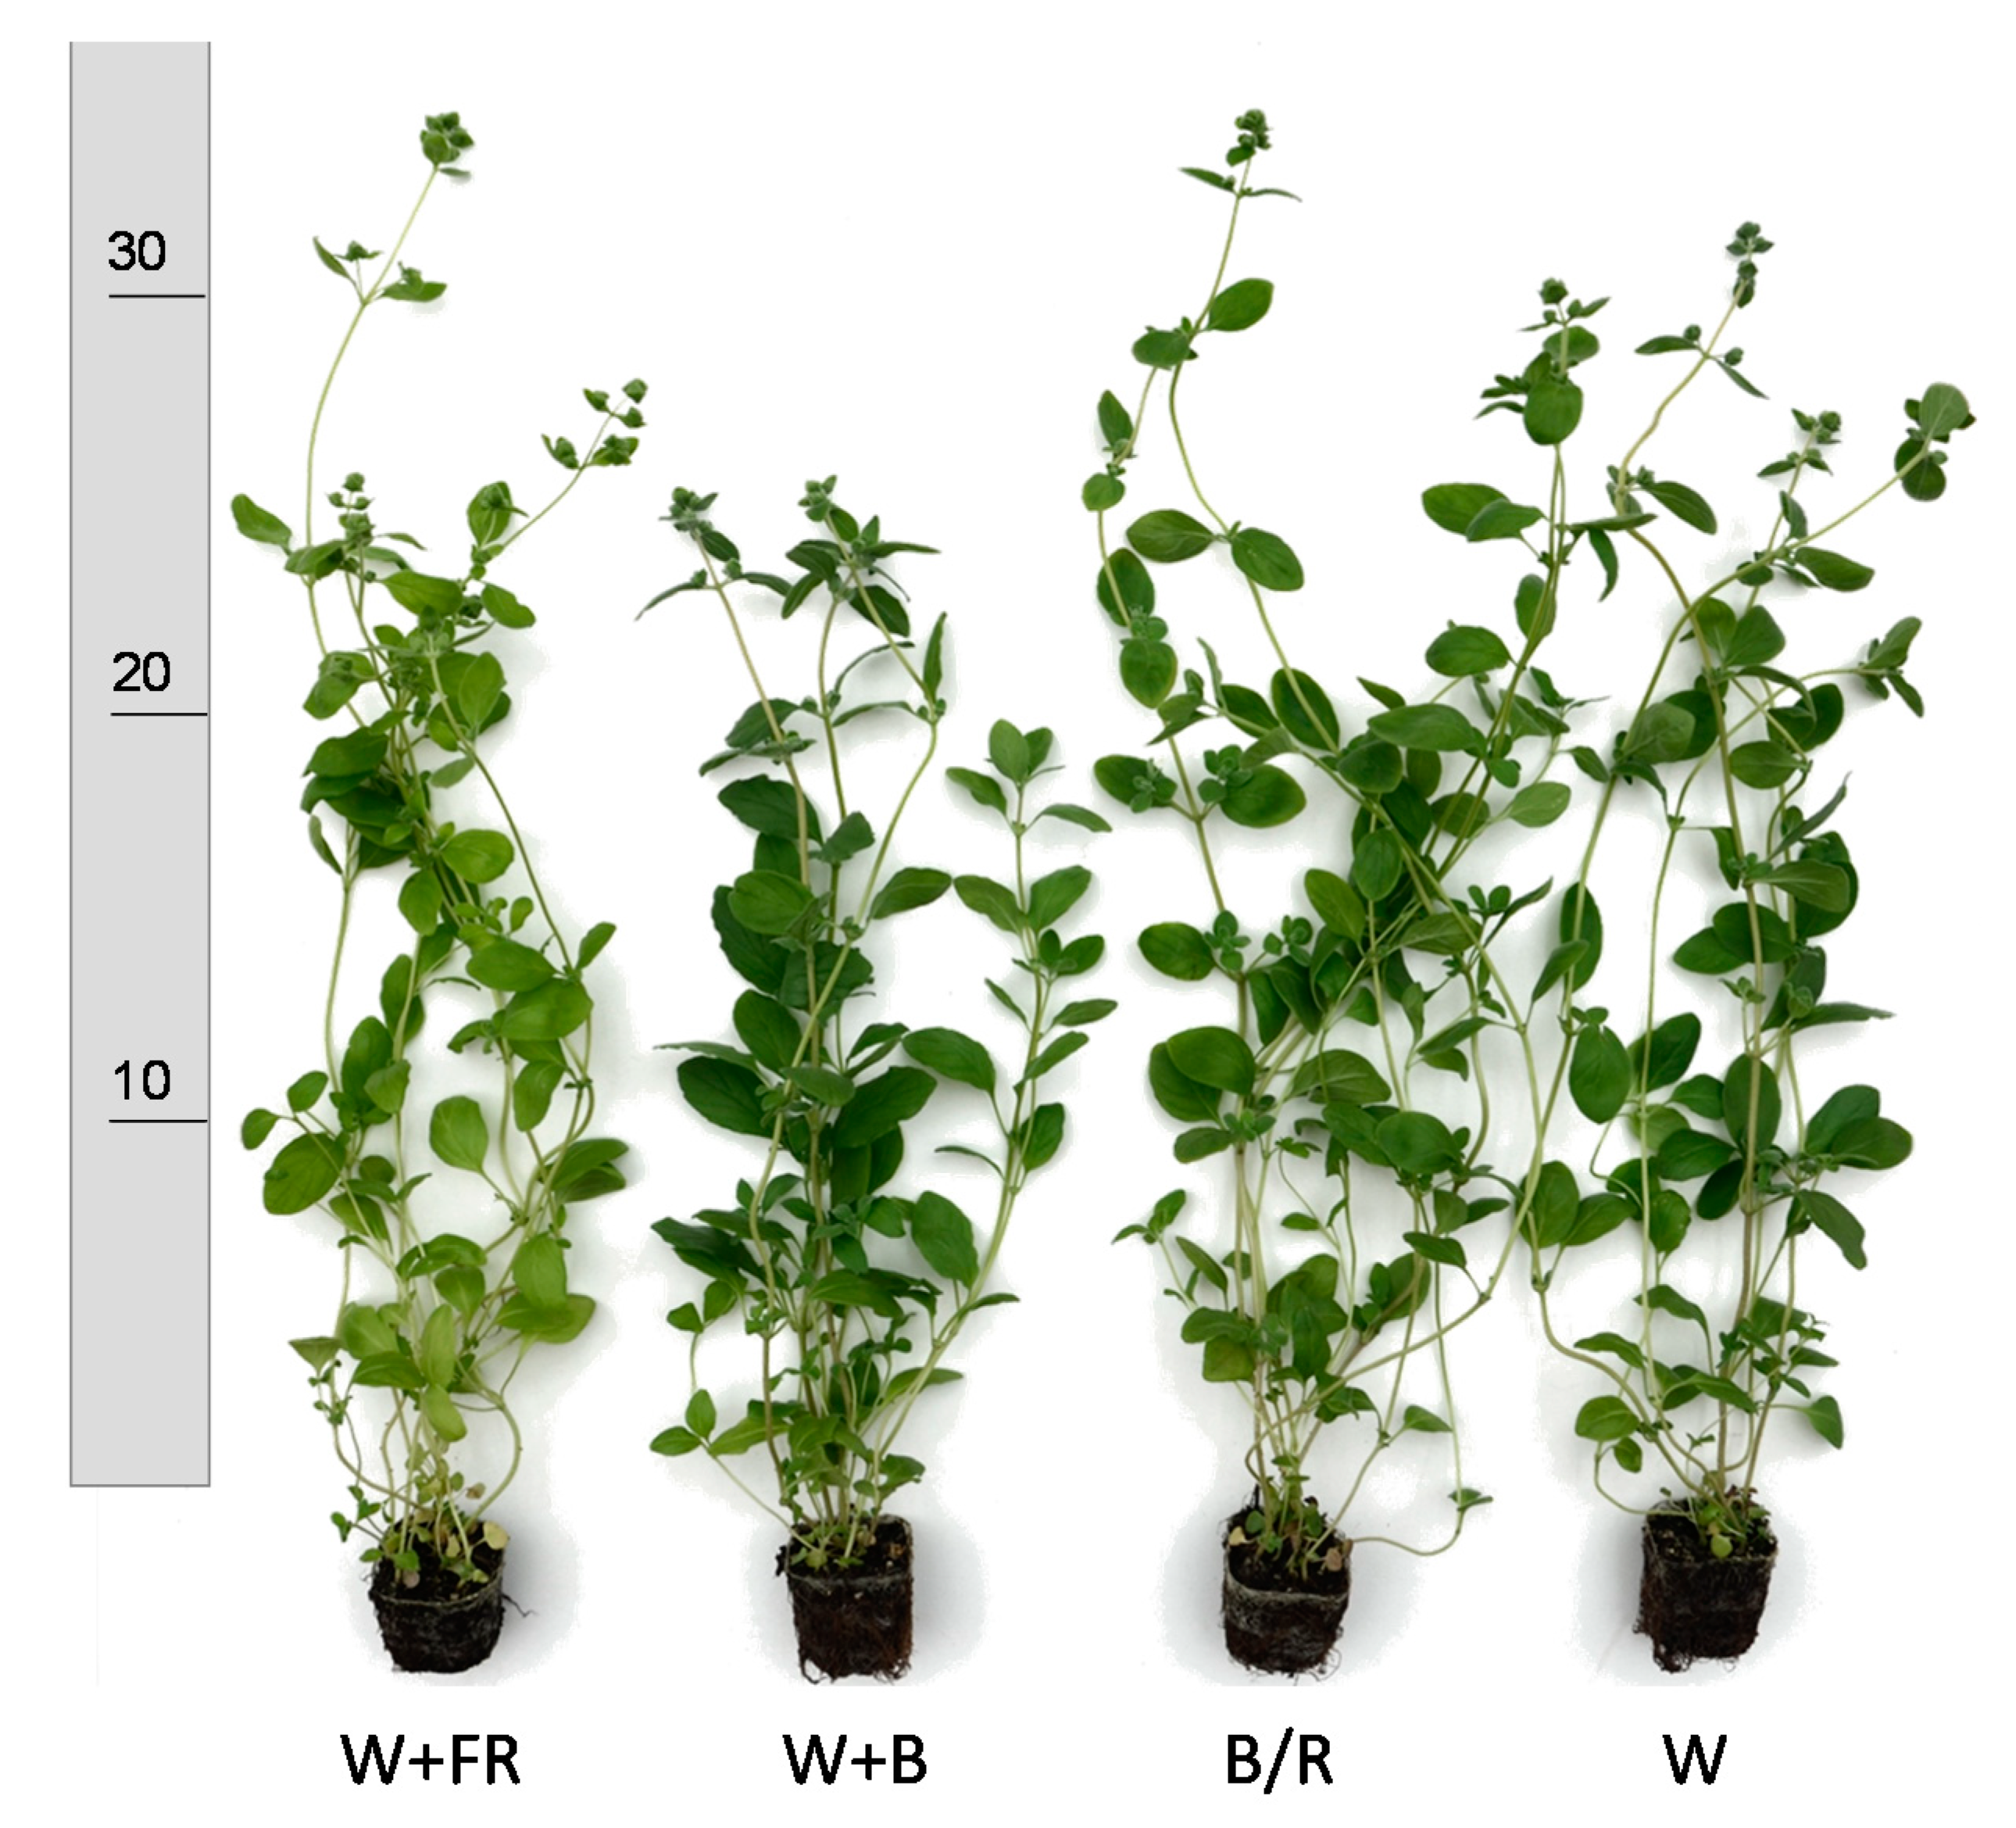
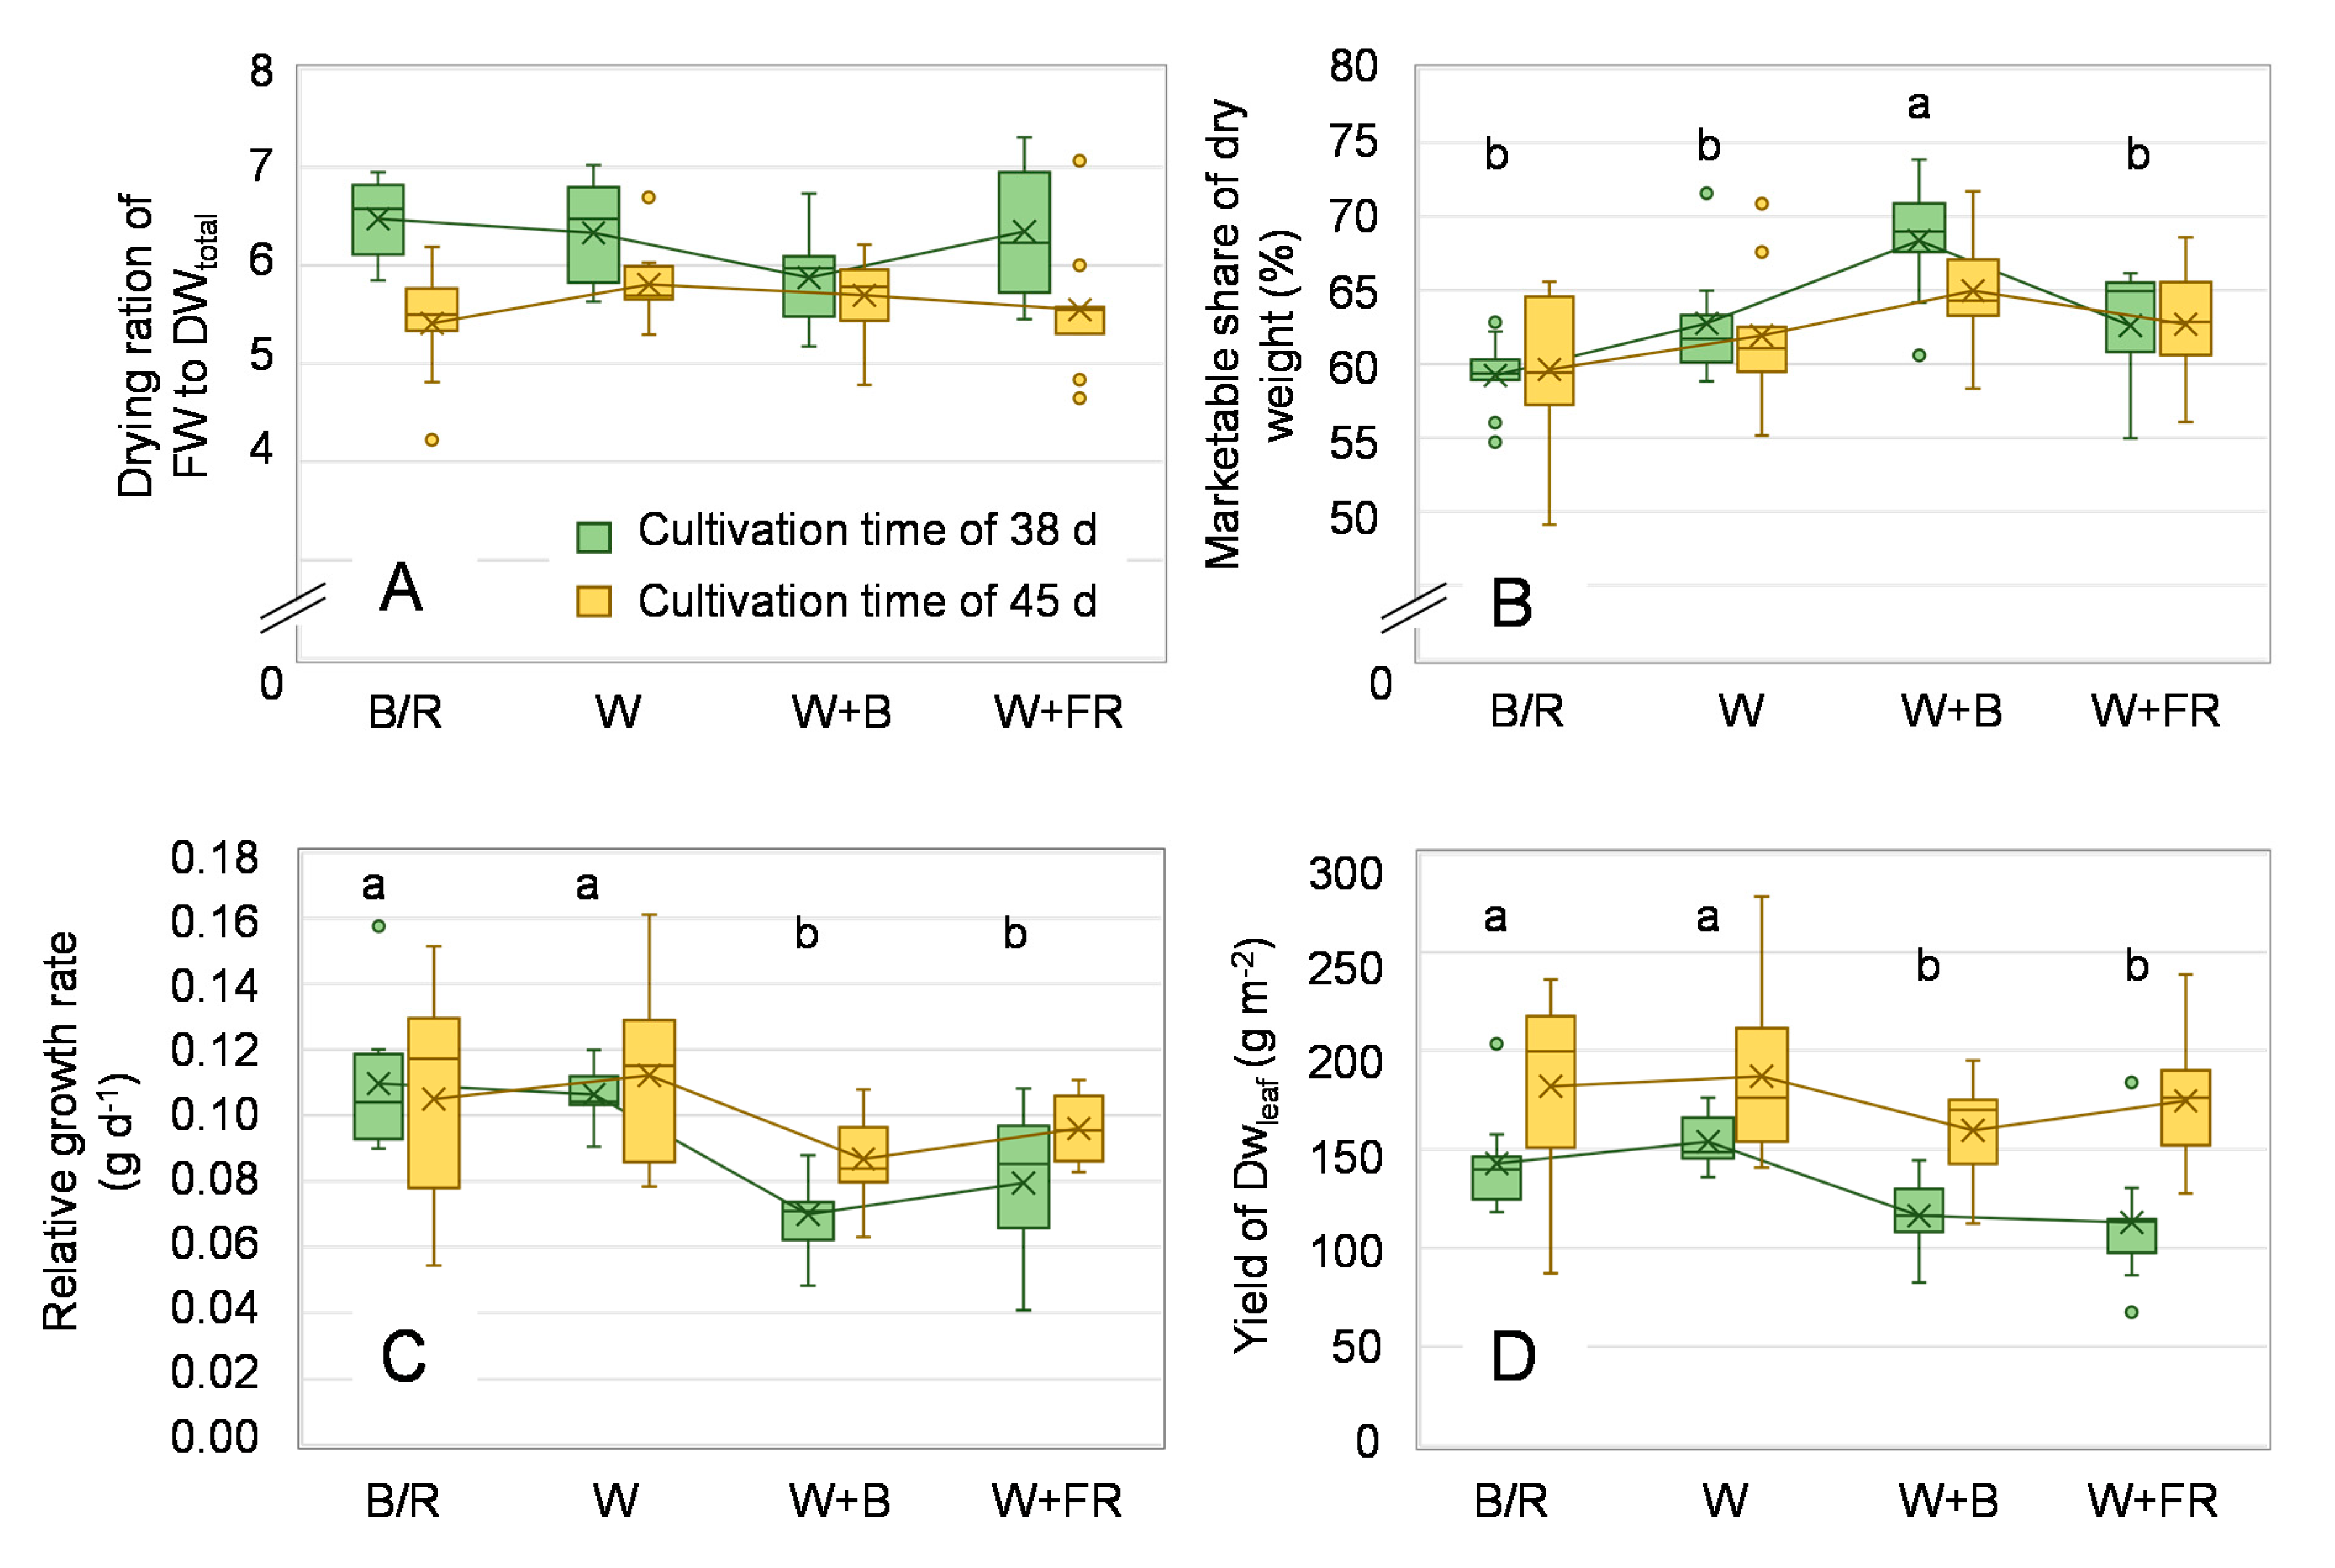
2.3. Cultivation Period, Growth Characteristics, and Resource Efficiency

According to the described dependency of essential oil on the flowering state two different times of harvest were chosen. The harvested area was determined in advance, whereby special care was taken to keep a uniform exposure intensity for both areas (Figure 1B). At a cultivation time of 38 d, which marks the time when the first plants reached initiative flowering of <1% of flowers open regardless the LED treatment, the aerial parts of the plants were harvested in the defined area. The second harvest area followed as soon as the first LED treatment reached full flowering stage defined as more than two-thirds of flowers open, which has been noted at a cultivation time of 45 d. At each harvest, three sets of randomly chosen plants were cut per light treatment and repetition, consisting of two single samples of 12 plants and one mixed sample with 52 plants (Figure 3). Since marjoram is usually cut several times in open field production, the harvesting cut was done five cm above substrate level for the mixed and one single sample. In order to also record the difference in yield and dry matter accumulation by a single cut 12 plants were cut at substrate level.
For both single sample batches, all measurements were collected for each individual plant, while the mixed sample was recorded as a sum parameter per repetition. After recording the fresh weight (FW) the mixed sample was transferred directly to a drying oven (Memmert, Büchenbach, Germany) for dry matter determination. On both single samples the shoot length (cm) were determined. Afterwards they were also transferred to the drying oven. All samples were dried at 40 ± 3 °C for 7 d. The dried plant material (DWtotal) was then carefully separated with regard to leaves (DWleaf) and stem (DWstem) and the weight of dry matter noted in each case. With the recorded data, further parameters for interpretation such as drying ratio of FW:DWtotal, relative growth rate (RGR) as accumulated leaf dry weight (DWleaf) divided by the cultivation time for 38 or 45 d respectively, the marketable share of dry weight (DWleaf) per total dried biomass (DWtotal) and the yield of dried leaves (DWleaf) per cultivation area (m2) was calculated. Water use efficiency (WUE) was quantified as total consumption per biomass produced (DWleaf l−1). The ratio between marketable biomass (DWleaf) and the cumulative electrical energy consumption of the LEDs was used to calculate light energy use efficiency (LUE) and expressed as DWleaf kWh−1. The land surface use efficiency (SUE), as one typically used parameter in agricultural studies, was used to compare the achievable annual yield per m2 floor area of an indoor farm with an open field production. Therefore, the yield (DWleaf) was calculated considering a plant density of 375 plants per m2 cultivation area, based on the experimental setup and a corresponding cultivation period of 38 or 42 d (8 or 9 growth cycles per year from sowing to harvest respectively). Two scenarios were compared, featuring a single layer to represent an open field production and a multi-layer production with 4 levels. A second cut, as it is usually carried out in German marjoram production, was considered for the open field scenario. Electrical energy efficiency (EEF) as well as water efficiency (WE) was calculated as total annual consumption of electrical energy (kWh) or total annual consumption of water (l) per achievable annual yield (FWleaf) based on the total cultivation area of the given indoor farm.

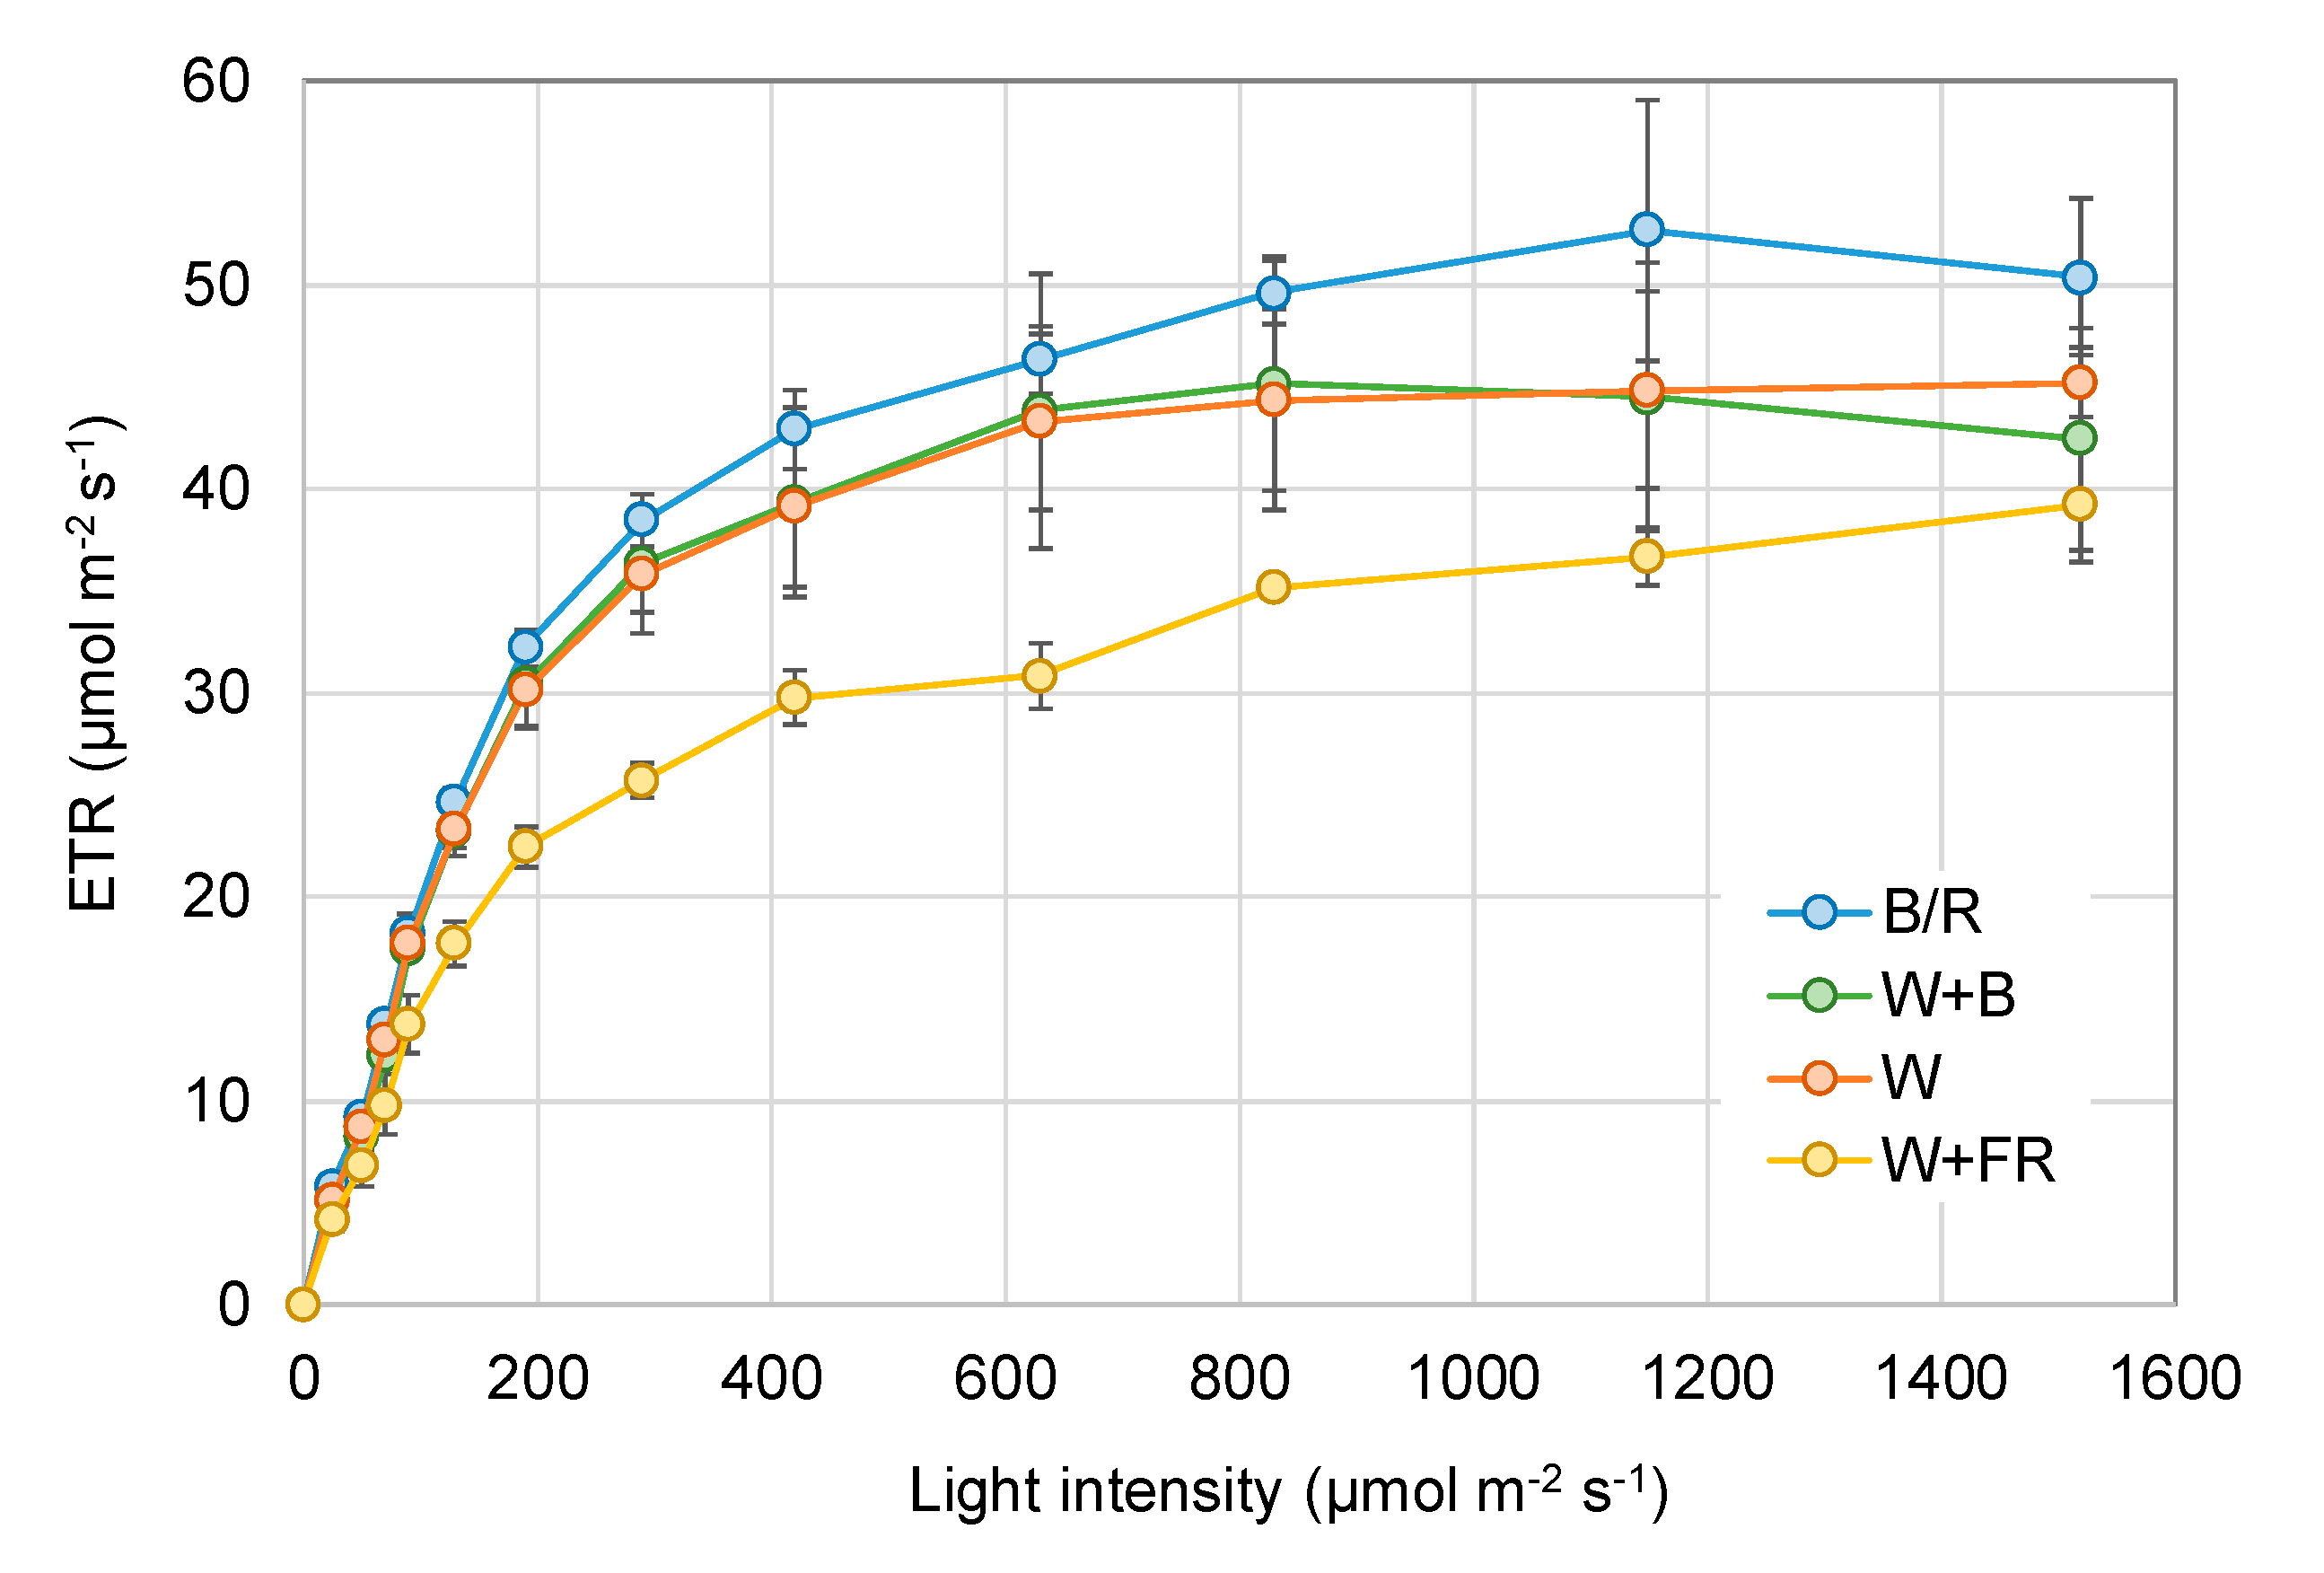
2.4. Chlorophyllfluorescence Measurements

The chlorophyllfluorescence was measured with the Fluorometer MiniPam II/R (Walz, Effeltrich, Germany) at a plant age of 40 d. Instant light-response curves were obtained by an increase of light intensity in 12 steps with the internal light-curve program of the MiniPam (5 min duration with 30 s between each step). Prior to the measurement all leaves were dark adapted for 1 h. F0’ and Fm’ was determined using a saturation pulse (intensity 12, duration 0.8 s) of 6000 μmol m−2 s−1. Using these values, the efficiency of Photosystem II photochemistry, ΦPSII = (Fm’–F’)/Fm and the linear electron transportation rate, ETR = ΦPSII*PPFD*0.84*0.5 was calculated and used to obtain additional parameters such as the maximum electron transportation rate ETRmax [23]. Three leaves were randomly chosen in both defined harvesting areas, but care was taken to take leaves of similar distance to the LEDs. All measurements were done inside the indoor farm with identical climate conditions as used during the cultivation period. Special care was taken not to change the leaf angle during measurements.

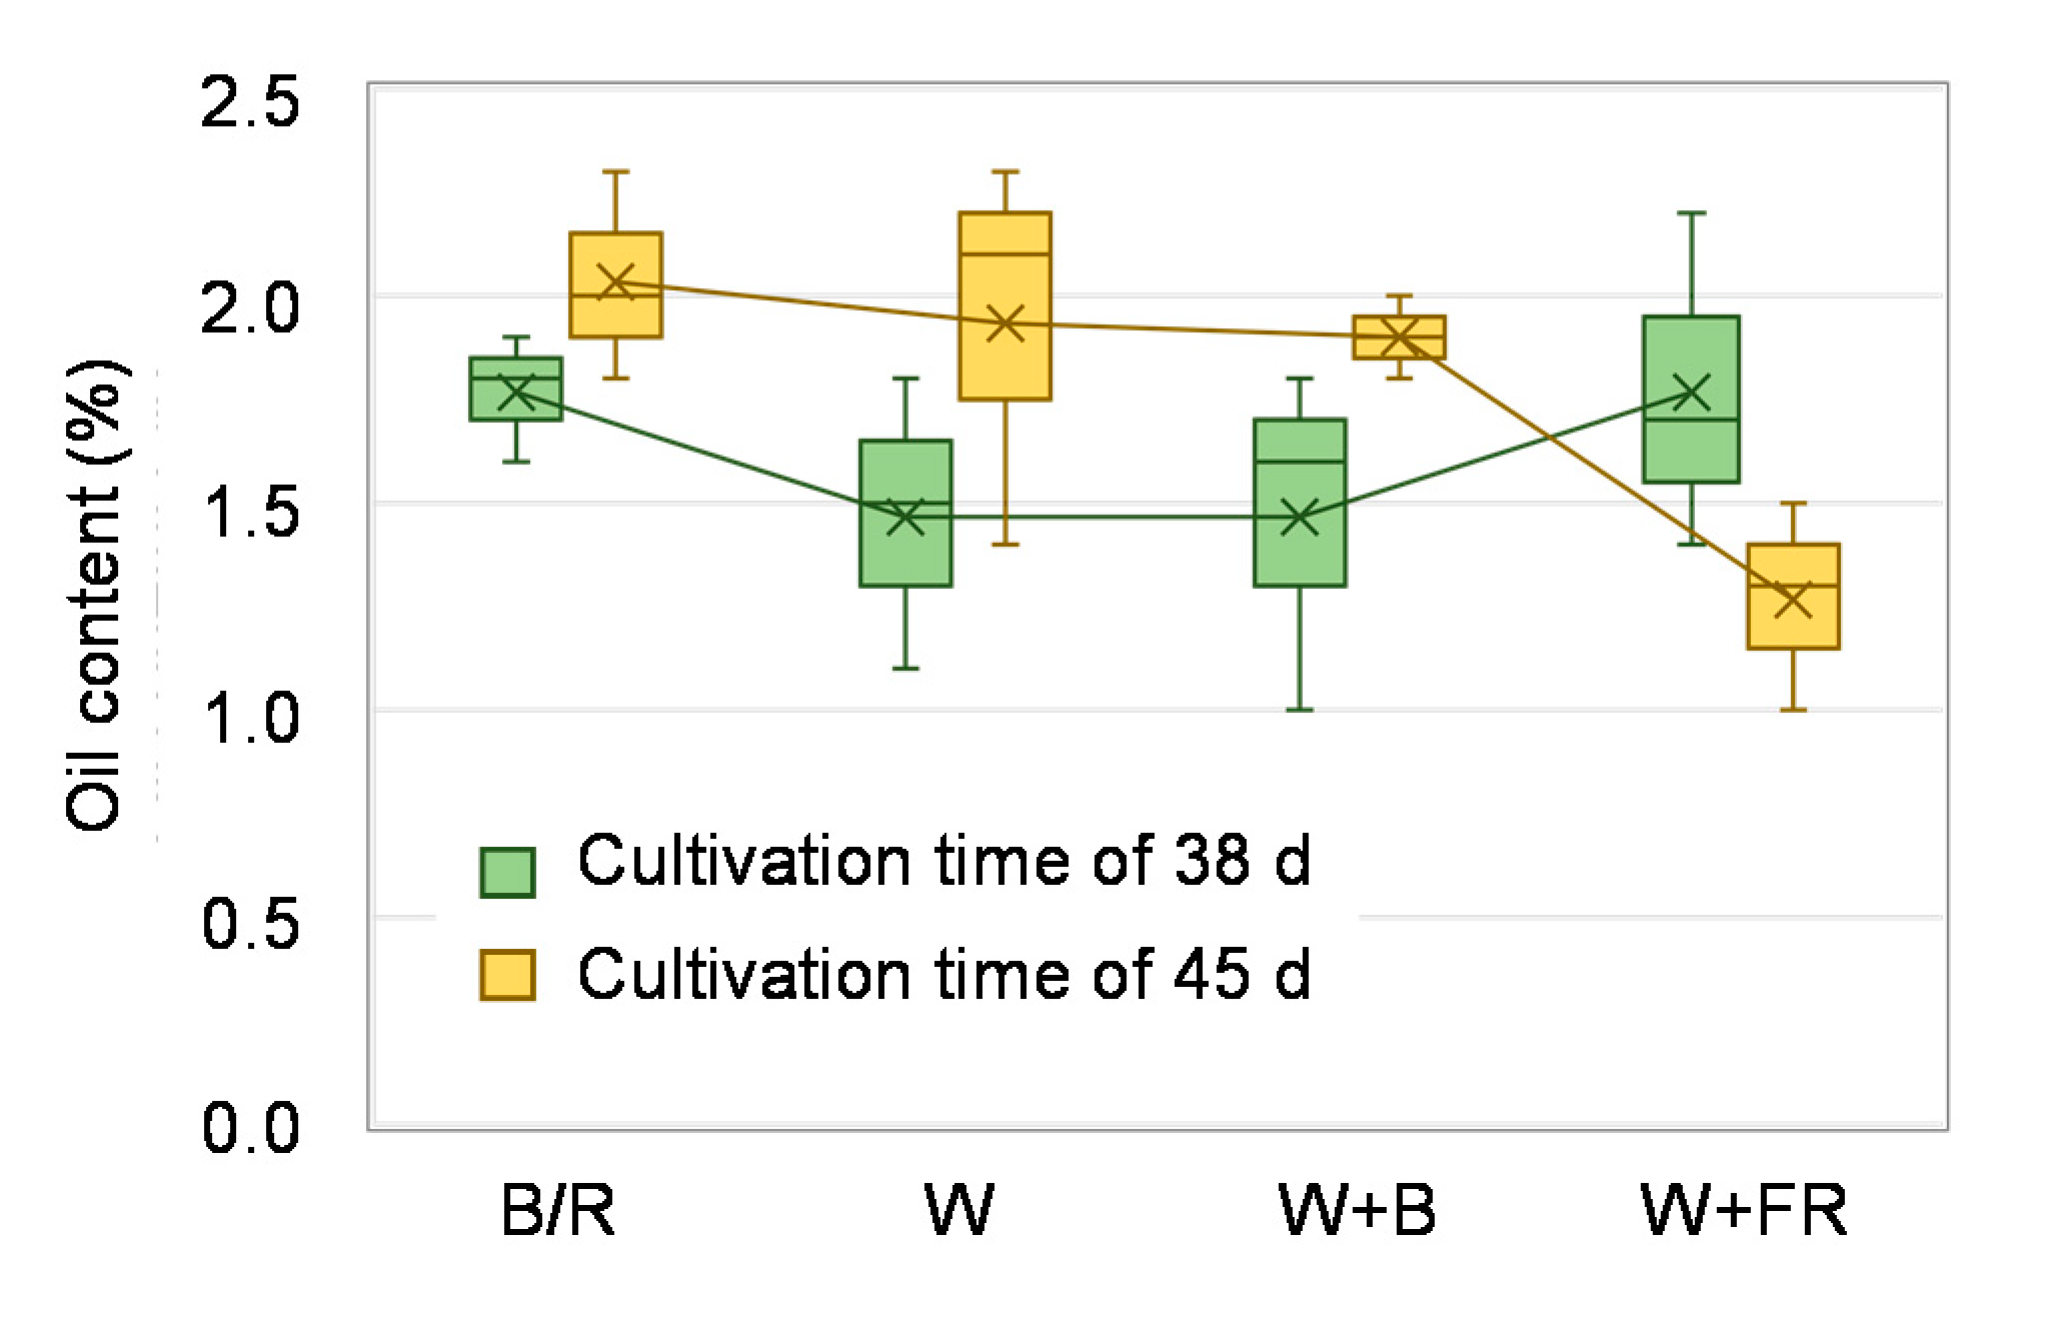
2.5. Essential Oil Content

The dried plant leaf material (DWleaf) of the mixed sample consisting of 52 plants per lighting treatment, repetition, and growth period was then directly transferred to an external laboratory (QSI, Germany). The determination of volatile oil component was done by hydro distillation over four hours according to ISO 6571:2008 [24]. The results were expressed as ml on the basis of dry matter weight.

2.6. Statistical Analysis
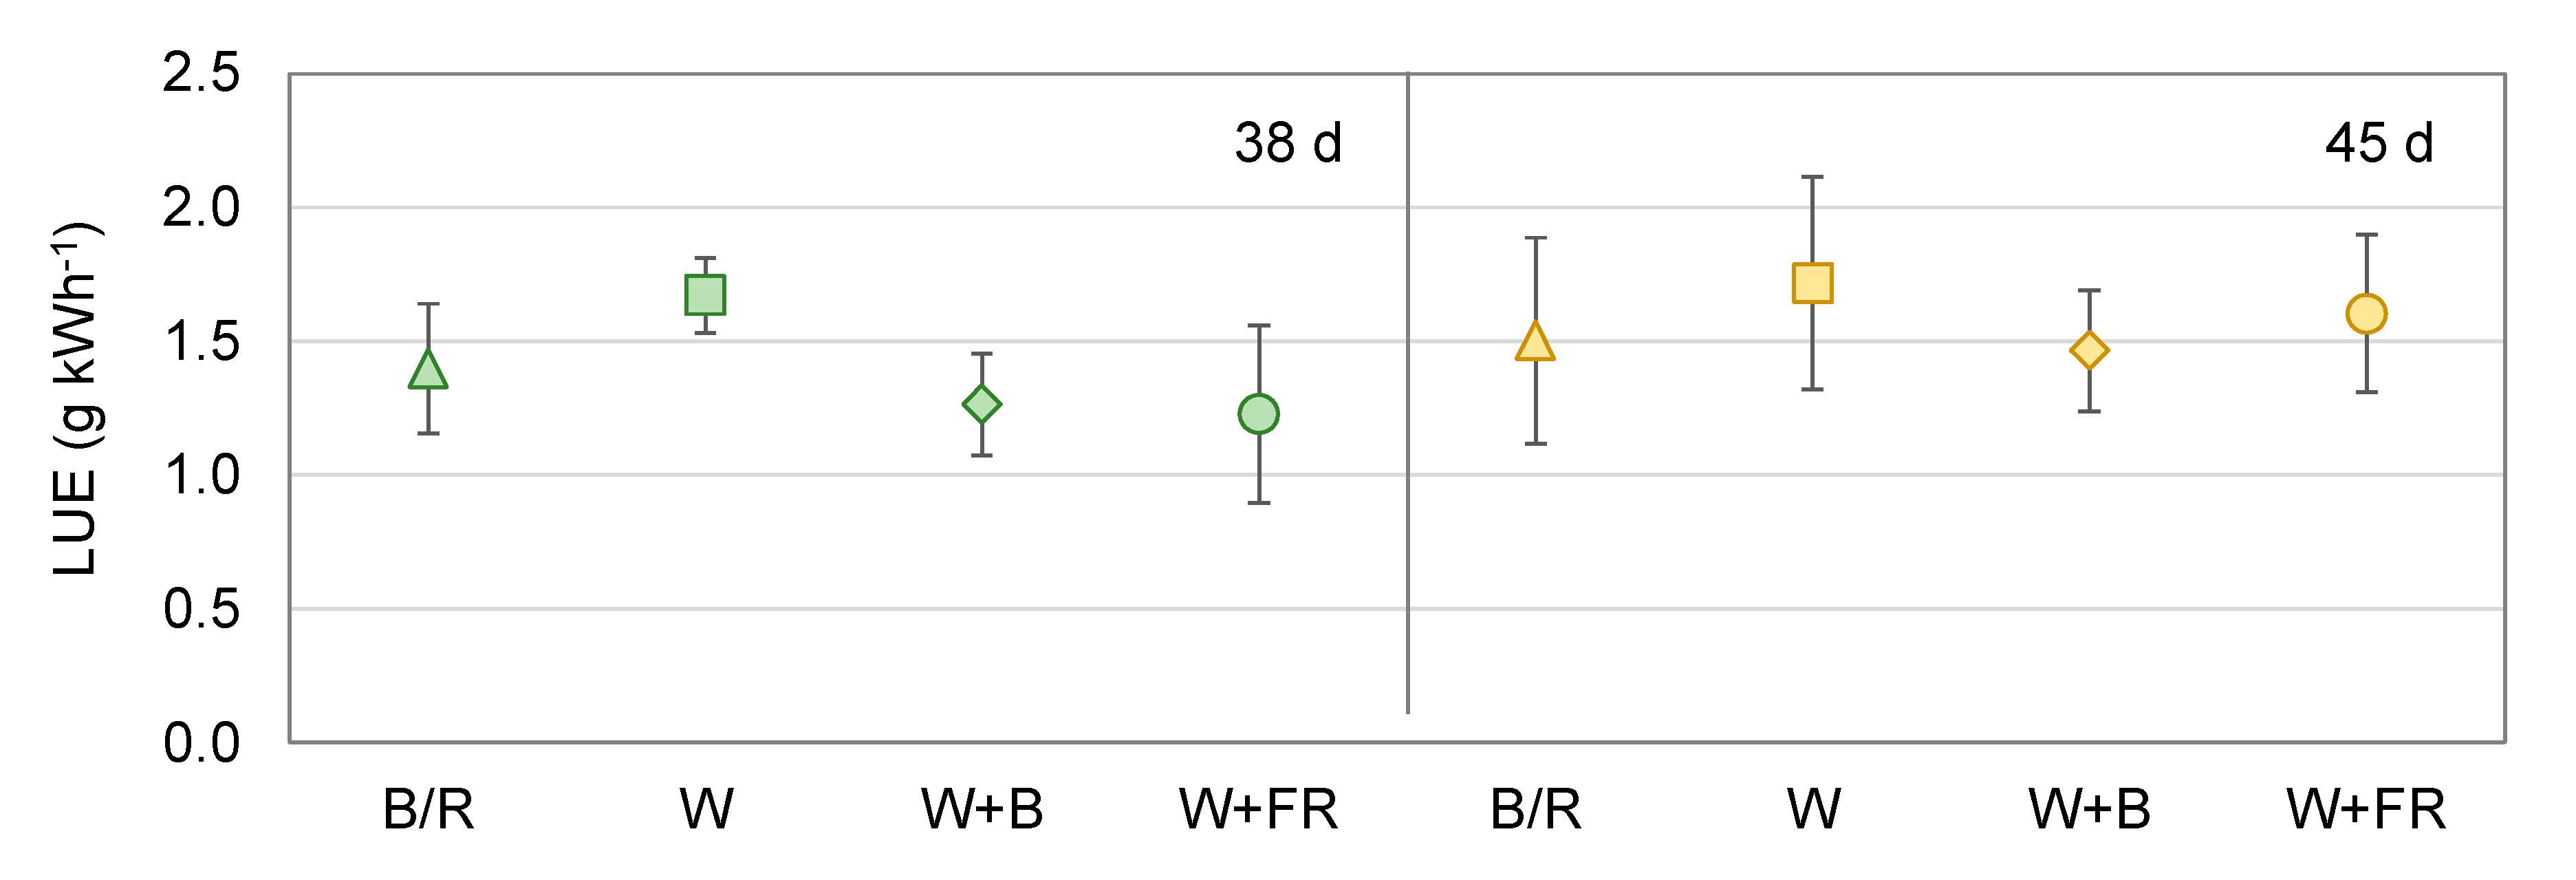
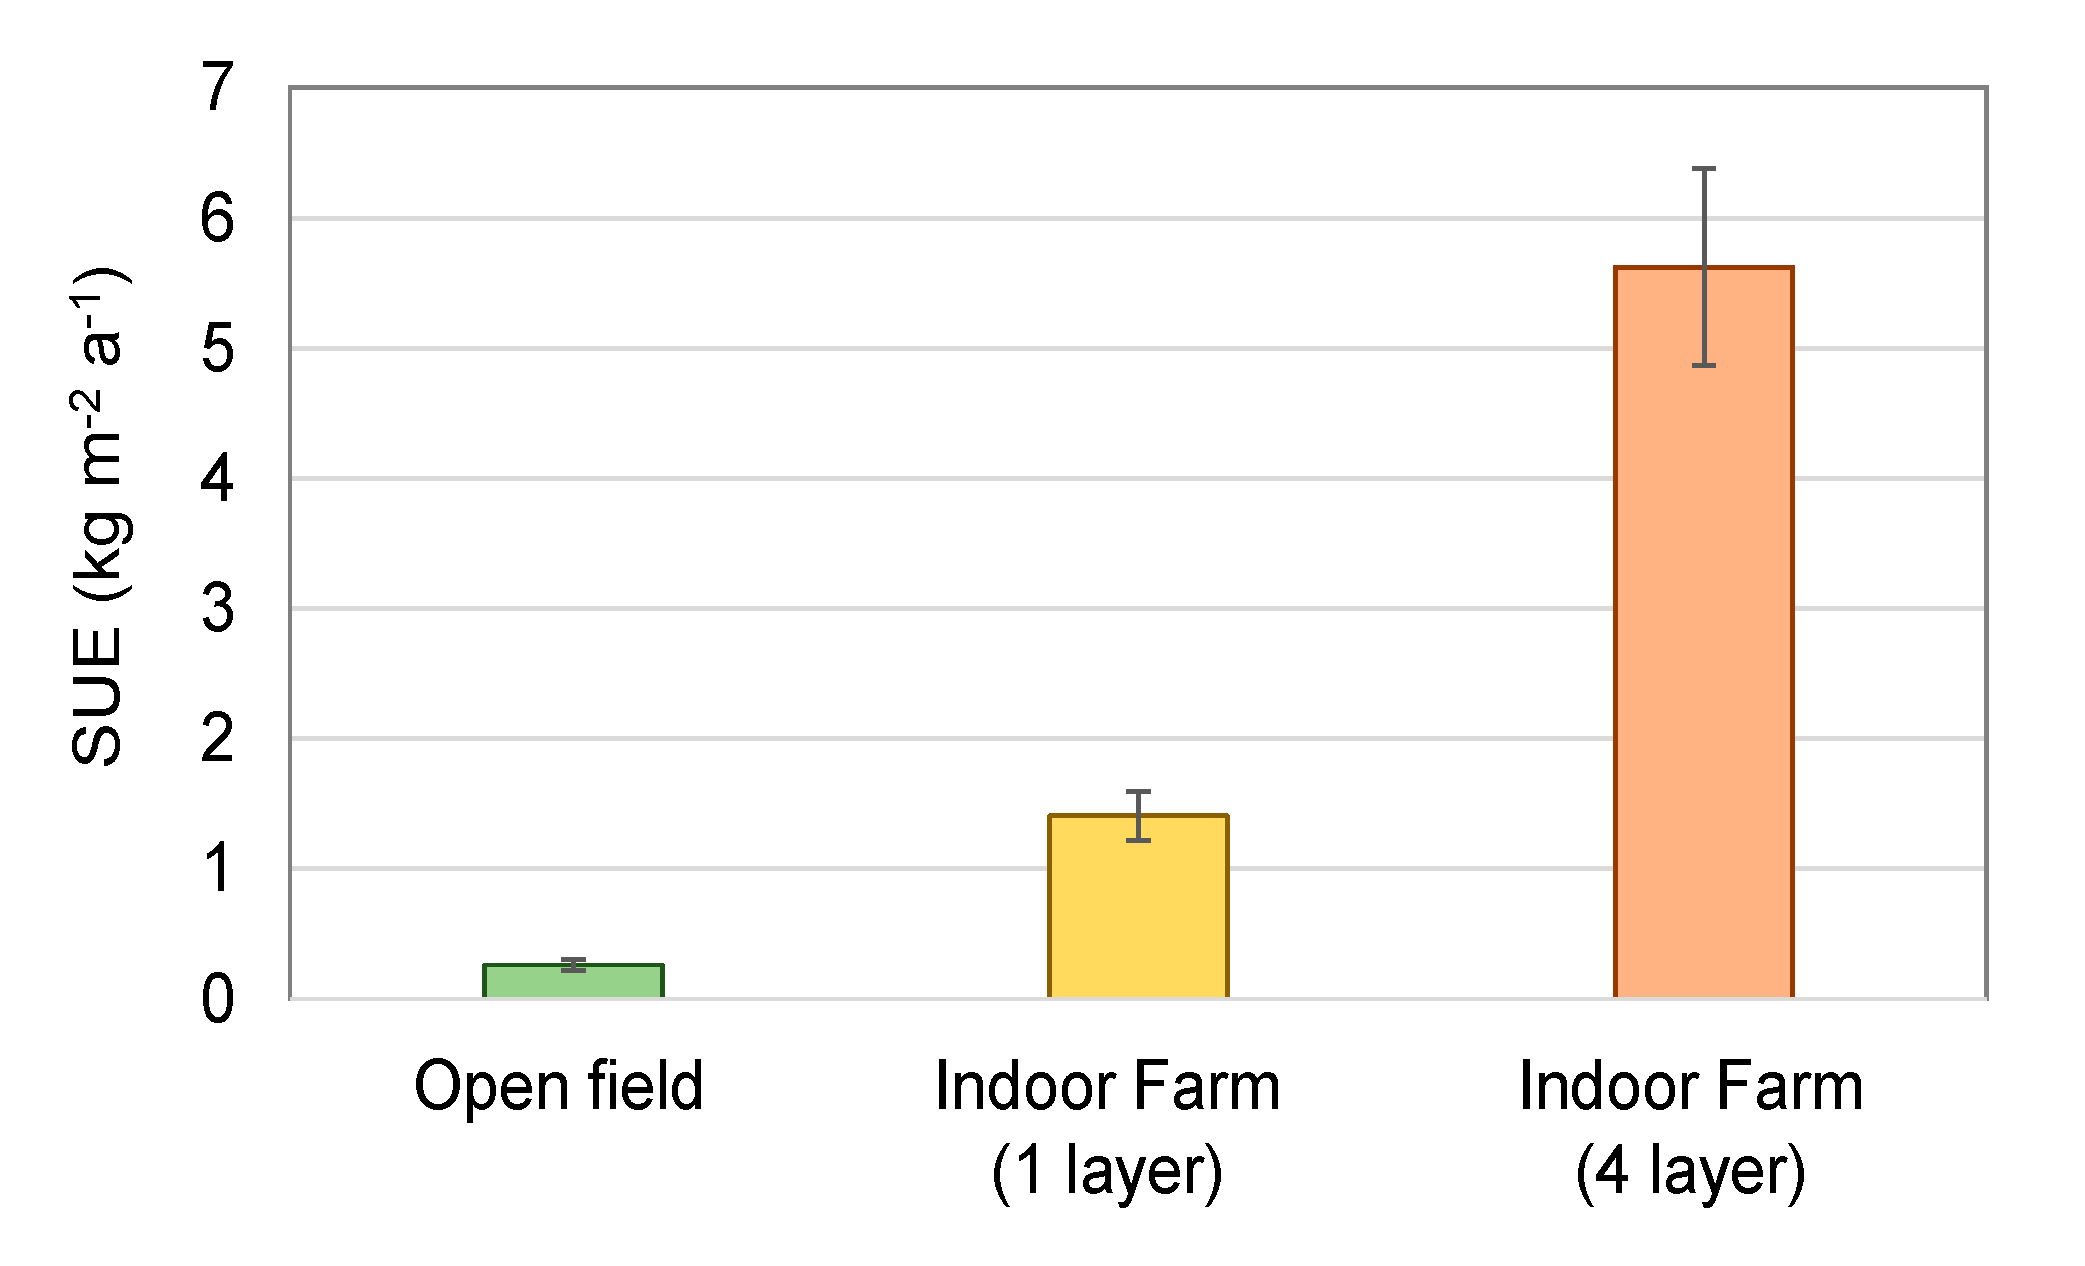
The experimental setup comprised four lighting strategies, each with two different cultivation times. The lighting strategies were randomized in three shelfs-units, with one unit being defined as a repetition. Determinations regarding growth and yield for both harvest times were done with nine repetitions for one LED treatment respectively, with one repetition representing the mean out of four single plants. All laboratory determinations were done as triplicate, with one repetition consisting of 52 plants in total. All data on growth characteristics, as well as the oil content were tested regarding normal distribution and following analyzed with one-way ANOVA to assess effects between the lighting strategies (Minitab 2018, Minitab GmbH, Munich, Germany). Mean value differences were assessed with a Tukey test with a considered significant at p < 0.05, α = 5%. The differences between the harvest times were not statistically assessed.

3. Results

The light treatment had a significant effect on the growth of marjoram plants. Regarding visual appearance, an overall lighter appearance of the leaf color in the LED treatment W+FR was noted but not further quantified by for example colorimetric measurements (Figure 4).
Marjoram grown under B/R were overall bigger, which manifested itself in the highest shoot length as well as an increased fresh weight regardless the harvest time (Table 1). LED treatment W was comparable in both parameters to B/R, respectively. W+B exhibited the lowest shoot length, leading to the impression of a more compact growth. Among all LED treatments, B/R and W had the highest total dry weight (DWtotal) of the plants in both growth periods. Regarding the proportion of leaves (DWleaf), the highest shares for both growing periods showed LED treatment W. The significant differences in dry weight, which were recorded after 38 d of cultivation, were no longer observed after a cultivation period of 45 d.
The drying ratio, which accounts for an evaluation of the stem proportion, amounted to 6.3 on average for a cultivation period of 38 d, with the exception of LED treatment W+B (Figure 5A). The extension of the cultivation period to 45 d led to a noticeable decrease in this ratio of about 20 to an average of 5.6. In contrast, the LED treatment W+B showed no decline in the drying ratio and amounted to approximately 5.7 for both cultivation periods. It should be noted that none of the drying ratios showed significant difference. The calculating of the marketable share allows an estimation of the percentage of marketable dry leaf material within the total of the harvested plant material. The marketable share is calculated as dry leaf weight (DWleaf) divided by total dry weight (DWtotal) and expressed in percentage. The evaluation indicates significant differences for the four LED treatments used in this study (Figure 5B). For both cultivation periods, the marketable share remained similar for LED treatments B/R, W and W+FR, whereas LED treatment W+B expressed a significant higher marketable share for a shorter cultivation period. Plants grown for 45 d using W+B LED treatment showed a reduction in marketable share; however, this value was not significantly different to the other LED treatments. The relative growth rate (RGR) was significantly higher in B/R and W compared to the other LED treatments after a cultivation time of 38 d (Figure 5C). A further expansion of the cultivation time to 45 d had no visible effect on the RGR in the LED treatments B/R and W. In contrast, RGR of the LED treatments W+B and W+FR increased by 24% (W+B) and 21% (W+FR) for a longer cultivation period. Regarding the overall yield of dried leaf weight per square meter cultivation area a LED treatment with B/R and W showed a significant higher yield compared to W+B and W+FR (Figure 5D). These significant differences in the yield were not consistent under a longer cultivation period of 45 d. Nevertheless, on average the yield increased in all LED treatments a longer cultivation. There was no significant difference found for any of the above presented parameters after 45 d of cultivation.
There was a visible effect with respect to the light treatment and the development stage of the flowers. LED treatment W+FR promoted the development of flowers to reach a first opening after a cultivation time of 38 d (Table 2). After 45 d of cultivation, more than 30% of flowers in the light treatment W+FR were in full flowering stage, while the remaining light treatments showed a delay in development (first flowers open).
The evaluation of the instant light-response curves of marjoram leaves showed a significant lower ETRmax in the LED treatment W+FR of 39.20 ± 2.58 µmol m−2 s−1 (Figure 6) compared to 46.80 ± 2.85 µmol m−2 s−1 and 49.10 ± 0.34 µmol m−2 s−1 for W and W+B, respectively. Highest ETRmax values were obtained for B/R with 53.00 ± 5.95 µmol m−2 s−1. Additionally, LED treatment W+FR displayed a smaller initial increase of the light-response curve (0.137 ± 0.010). In comparison, all other LED treatments showed a parallel increase ranging from 0.180 ± 0.006 (W+B), 0.182 ± 0.009 (W), and 0.189 ± 0.004 (B/R).
The mean essential oil contents of dried marjoram leaves were not statistically significant for any of the considered cultivation times. However, the mean values indicated differences with respect to the LED treatment (Figure 7). According to this, for a cultivation period of 38 d, mean oil contents reached 1.8 ± 0.2 mL 100 g−1 (B/R), 1.5 ± 0.4 mL 100g−1 (W), 1.5 ± 0.4 mL 100 g−1 (W+B), and 1.8 ± 0.4 mL 100 g−1 (W+FR). The extension of the cultivation period to 45 d indicated an increase of the oil contents for all LED treatments by 15 to 30% with the exception of W+FR, which indicated a decrease by about 29%.
Regarding the energy consumption for both growth periods a total electrical energy consumption per square meter cultivation area of 192 kWh m−2 (38 d) and 228 kWh m−2 (45 d) was measured. Since the electrical energy consumption was recorded for the entire compartment, only the proportion of energy consumed by the LEDs was assigned directly to the LED treatments. Accordingly, an energy consumption of 2.7 kWh m−2 d−1 (B/R), 2.4 kWh m−2 d−1 (W), 2.4 kWh m−2 d−1 (W+B), and 2.4 kWh m−2 d−1 (W+FR) was calculated based on the technical specifications of the LEDs, respectively. The remaining energy consumption for air conditioning, fans, dehumidifiers, and other consumers was summarized as indirectly attributable energy consumption. LED treatment W expressed the significant highest light use efficiency of 1.67 ± 0.24 g kWh−1 compared to all other light treatments for a cultivation time of 38 d (Figure 8). This light use efficiency can be interpreted as possible accumulation of dried leaf weight (DWleaf) per electrical energy consumption of the respective LED. This overall impression did not change with a longer cultivation time of 45 d. However, all LED treatments showed an increase in the efficiency to convert light energy to dry leave weight by 7% (B/R), 3% (W), 16% (W+B), and 30% (W+FR) at a longer growth period.
The potential to save valuable land by the use of indoor farming was noticeable (Figure 9). Based on the land surface use efficiency (SUE) estimation the potential to increase SUE for marjoram produced in an indoor vertical farm was up to five times higher, compared to an open field production for the reference unit of one square meter floor area. Based on the cultivation times used in our experiments, 8 to 9 growth cycles per year can be estimated. Therefore, the annual yield of dry leave weight as an average for all assessed LED treatments was calculated to 1.4 ± 0.2 kg m−2 a−1 or 1.6 ± 0.3 kg m−2 a−1 for the cultivation periods of 38 and 45 d, respectively. Two harvest times representing an open field production resulted in an annual yield of dry leave weight of 0.26 ± 0.05 kg m−2 a−1. A simulated multilayer system equipped with four levels results in an annual yield per floor area of 5.6 ± 0.8 kg m−2 a−1 (38 d) or 6.3 ± 1.3 kg m−2 a−1 (45 d), increasing the achievable yield compared to an open field production by a factor of 21.
The water consumption for one growth period was 3.9 l m−2 (38 d) and 4.3 (45 d). Since a total value per compartment was reported, the water use efficiency (WUE) varied according to the yield of leaf dry weight. For the four LED treatments an accumulation of leaf dry weight per liter of 46.8 ± 12.7 g l−1 H2O, W of 48.2 ± 11.8 g l−1 H2O, W+B of 41.1 ± 6.8 g l−1 H2O, and W+FR of 45.0 ± 8.7 g l-1 H2O was calculated. The calculation of an annual energy consumption depends strongly on external conditions like air temperature, global radiation, and wind due to the isolation of the indoor farm used in the given experiment. However, based on the assumption of eight or nine cultivation periods and the given results regarding yield and energy consumption the annual electrical energy efficiency (EEF) of the given indoor farm would be 71 to 75 kWh kg−1, respectively. The annual water efficiency (WE) of the given indoor farm regarding fresh mass as a reference would be 1.4 to 1.5 l kg−1.

4. Discussion

4.1. Growth Characteristics and Achievable Yields

The yield of dried marjoram leaves is influenced by several parameters. For example, plant densities increasing from 6.3 to 12.5 plants m−2 was reported to reduce the yield of dried marjoram leaves by up to 50% [1]. After harvest, the stems of the marjoram plants are sorted out by vibrating sieves, leaving the share of dried leaves and flower buds as marketable yield. Furthermore, marjoram is commonly harvested two times in open field production during a short period of July to August, depending on the weather conditions. According to marjoram production in Poland the yield of dried leaves increases in the second harvest by 32–38% [2,3]. Based on this, the expected yield in open field production varies between 46 and 120 g m−2 for the first cut and 70 and 170 g m−2 in the second cut [2,3]. In open field productions in Germany a plant density of 30 plants m−2 seem to be common, leading to an expected annual yield of dried marjoram leaves in the range of 100–250 g m−2 [4]. Similar annual yields of 99–232 g m−2 have been reported for open field grown marjoram in Finland [25]. In contrast to the literature, a significantly higher plant density of 309 plants per m2 was selected in our experiment on a preliminary experiment with marjoram inside a hydroponic system. Our results in the indoor Farm indicated an achievable yield during one harvest in the range of 112–186 g m−2, independent of the LED-treatment, which is comparable to the total annual yield in open field production. The extension of the cultivation period to 45 d in our experiment increased the achievable yield from 18 to 33%. These results are lower compared to one study with marjoram, where the yield at the harvest date, based on the developmental stage of full flowering, was significantly increased by about 56% compared to plants harvested at bud stage [1]. Despite the higher density the shoot length of 22.9–34.5 cm was comparable to those reported for open field production ranging from 18.8 to 42 cm [3,25]. While the literature for open field produced marjoram indicates a fresh weight of 36–67 g per plant and a leaf dry weight of 3–12 g per plant [1,3], plants in the indoor farm showed a fresh weight of 3.8 g per plant and leaf dry weight of about 0.41 g per plant on average. It can be assumed that a reduction in the plant density could lead to a further increase in the harvested yield per m2. Blue light in the LED treatment W+B seemed to promote a more compact growth, which is consistent with several studies reporting a suppression of stem elongation, leaf expansion and a shoot weight reduction [26]. Since only dried leaf and flower buds are suitable for further marketing, a low share of stems in the dried plant material is preferable. It was reported that the proportion of stems range from 22 to 47% [2,27] compared to total dry weight, independently from the harvest time [2]. In the conducted experiment inside the indoor farm, the dried material showed a good quality with a proportion of stems of 32 to 41% compared to total dry weight. The LED treatment W+B had a noticeable influence on a lower contribution of stems of about 30%, whereas the marketable share of leaf and flowers in the LED treatment B/R was significantly smaller and almost 40% accounted for stems. Furthermore the drying ratio between fresh and dried plant material (FW:DWtotal) was slightly better for the LED treatment W+B with 5.8:1 compared to all other LED treatments, which ranged from 6.3:1 to 6.5:1. These differences disappeared at a longer cultivation time, leading to an average drying ratio of 5.6:1. For German open field production a drying ratio of 3.5–4.1:1 is seemingly common [4]. Additionally, the flower development of the indoor grown marjoram plants was noticeable shortened compared to an open field production. Open field produced marjoram is exposed to varying temperatures, differing daily light integrals, and changing lengths in the available growing season. Nevertheless, one study assumed that the total yield of marjoram plants was not influenced by weather conditions with an average temperature of 16 °C, but solely by the time of harvest, which is determined by the flowering stage [2]. However it was reported, that marjoram produced in south Finland at an average temperature of 14.3 °C and a growing season of 136 d allowed a second harvest in one out of four years, while a lower average temperatures of 11.5–12.9 °C and a growing season of 101–111 d limited the marjoram production to one single cut [25]. In Germany as well as Poland cultivation times for open field produced marjoram need about 90–117 d for the first cut [1,4,28] and further 46–92 d for the second cut [2,3,28]. Furthermore, Tunisian marjoram produced in 1 L pots were reported to take about 120 d to reach budding stage [7]. According to this, our results showed that compared to an open field production the cultivation time in an indoor farm at a mean temperature of 25 °C was noticeably reduced by a third up to one half, regardless the outer climate conditions. Marjoram is native to Mediterranean regions of the world, indicating a rather thermophilus habit, which seemed to benefit from a higher average temperature. For the production of marjoram, the initiation of blossoming determines the harvest date and therefore the total biomass accumulation. Since marjoram is a long-day plant, flower formation is highly depending on photoperiod. One study using different day lengths of 10, 13, and 16 h determined a critical day length of 13 h for the promotion of flower development, depending on the genotype [29]. The authors concluded that a longer photoperiod can promote faster flower formation. This enhancing effect is consistent to observations done on Origanum vulgare ssp. [30]. Depending on the LED treatment first flowering was reached in the W+FR after 38 d while all other LED treatments took 45 d. For Origanum vulgare ssp. a direct consequence of extended photoperiods and a shorter growth period is a low biomass due to a rapid development [30]. Even though the growth period was significantly reduced compared to open field production and the photoperiod increased to 20 h at the same time, the dried leave weight was similar to the expected yields of field produced marjoram due to the higher plant density.

4.2. Essential oil Content and Composition

The essential oil content in dried raw plant material is one quality parameter for marjoram, which is supposed to be used in industrial processes. It is known that the yield of essential oils in plants is influenced by intrinsic (e.g., growth stages and variety) as well as extrinsic (e.g., cultivation, weather, drying, and extraction methods) parameters [7]. In marjoram, a high ability to manipulate the content of essential oil through the use of cultivation methods and a particular harvest date was documented, even though reports within the literature are not consistent. For example, open field produced marjoram showed a significant reduction in the average oil contents of about 23% for plants collected during the second harvest [3], while another study reported a comparable oil content in both harvests [28]. The authors assumed a favorable thermal effect by the higher average temperatures of 16.8 °C on the synthesis of marjoram oil. One the other hand, a simple relationship between the total fresh weight of the marjoram plant and its oil content was demonstrated [10]. The authors supposed that a higher temperature primarily influenced plant growth with an indirect effect on the accumulation of essential oils. Based on this linearity the oil content might reflect primary the plant’s assimilatory capacities [10]. In the present study a weak correlation between plant fresh weight and total dry weight was present, but no linearity between fresh weight and oil content could be found (data not shown). However, the average oil content of B/R and W+FR were similarly slightly increased after the first harvest, which could be due to the higher photosynthetic activity of B/R, as ETRmax showed. A significant increase in the essential oil content levels has been reported for progressive growth stages of marjoram, resulting in the highest oil contents at a full flowering stage [1,7]. Similar results regarding favorable oil contents as well as yield at full flowering stage have been reported for other Lamiaceae like Mentha spicata L. [31], Melissa officinalis L. [32], or Rosmarinus officinalis L. [33]. Even though flower formation of marjoram depends strongly on the photoperiod, no direct influence of the photoperiod on the formation of essential oils could be found in a previous study [29]. Furthermore, plant density was found to have no significant influence on the accumulation of essential oil [1]. In general, German producers strive for an essential oil content in dried leaf material of 1 to 1.2%. Depending on the variety, newer cultivars can reach up to 3% [4]. According to a study conducted in Finland the average essential oil content for a total of six harvests was about 1.4% [25]. Several studies in Poland showed oil contents of marjoram ranging from 1.6 to 2.4% [1,3,28]. Greenhouse produced marjoram using pots obtained an essential oil level of 1.4% for an average temperature of 24 °C [34]. In the present study, the essential oil contents achieved were similar to those reported in the literature, ranging at a level of 1.4 to 1.7% for a cultivation time of 38 d. The dependency on the flower development stage was also observed for all LED treatments expect W+FR. The assumption that the LED treatment W+FR should have had the highest oil contents, since it was the only treatment to reach blossoming at the time of harvest, was not confirmed. Instead, the oil content was comparable to the LED treatment B/R. All other LED treatments showed on average about 18% fewer oil contents. A positive effect by far-red as stated in the literature was not significantly noticed [35]. A longer growth period increased oil contents for all LED treatments by 15 to 30% except W+FR, which decreased by 29%. The increase is consistent to a study reporting an increase of 43% between the late vegetative stage and budding stage, as well as 23% between budding stage and full flowering stage [7]. It should be noted that the marjoram plants grown under the LED treatment W+FR showed an overall lighter appearance of the leaf color. Furthermore, the instant light-response curve of W+FR indicated lower ETRmax values compared to all other LED treatments, which may have influenced the significant reduction.

4.3. Ressource Use Efficiency

One of the main advantages of indoor vertical farming is the high efficiency regarding water consumption, estimating a water use efficiency of up to 30 to 50 times higher than a greenhouse production [36]. According to one study comparing hydroponically grown lettuce with an open field production, 13 times less water was needed [22]. There was no information given in the available literature regarding water consumptions of marjoram production. In our experiment, the WUE was between 41 to 48 g DW l−1 H2O, depending on the overall yield of dried marjoram leaves. For lettuce a WUE of about 4 g FW l−1 H2O for open field, 50 g FW l−1 H2O for hydroponic greenhouse, and up to 75 g FW l−1 H2O for an indoor farm was reported [14,22]. Furthermore, WUE of Ocimum basilicum L. reached 3 g FW l−1 H2O for an open field production in Turkey [37], compared to 20 to 22 g FW l−1 H2O in an Italian greenhouse [38] and up to 45 g FW l−1 H2O for an indoor farm [19]. Another study on Brassica rapa ssp. noted a WUE of 29 g FW l−1 H2O for a greenhouse production compared to 357 g FW l−1 H2O in an indoor farm with higher air exchange to the outside and 833 g FW l−1 H2O for a highly isolated climate chamber, recovering all transpired water [39]. Based on our results, an annual WE of 1.4 to 1.5 l kg−1 was calculated, indicating a high potential regarding water saving for marjoram grown in an indoor farm, compared to conventional production methods.
Furthermore, indoor vertical farming shows due to the multi-layer system a high potential regarding the land surface use efficiency (SUE). One model assumed this potential to be in a range of 10 to 100 times higher compared to conventional methods using a single cultivation level like open field production or the majority of greenhouse productions [22]. In our study the achievable annual yield of dried leaves per unit (m2) cultivation area was up to five times higher in the indoor farm, resulting in an annual yield of 1.4 to 1.6 kg m−2 a−1 compared to conventional open field production. Due to the multilayer systems used in an indoor vertical farm, one square meter floor area corresponds to a randomly selectable amount of cultivation area. Depending on the number of levels, the achievable yield increases considerably. Therefore, at four levels, which remains low compared to existing indoor Farms like SPREAD in Japan or Aero Farm in the USA, an increase in the annual achievable yield by 21 times higher compared to an open field production seems feasible. As an example, this would lead to a calculated total annual yield of up to 6 kg m−2 a−1. Since the oil content is based on leave dry weight, a comparable higher ratio of annual oil yields per floor area using an indoor farm with a multi-layer system can be assumed. While compared to an open field production similar oil contents were obtained, the surface use efficiency leads to an achievable total yield of essential oils of 23 mL m−2 a−1 regarding one floor area. Assuming an indoor farm with four levels, the total annual yield of essential oil would increase four times to 91 mL m−2 a−1 based on the cultivation area.
However, one of the most discussed disadvantages of an indoor farm remains the high amount of electrical energy needed to run the system, especially since the artificial lighting takes the highest shares. In our experiment an annual electrical energy efficiency (EEF) of 71 to 75 kWh kg−1 was calculated. Based on existing experience with the annual energy consumption of the indoor farm used, an overestimation of the presented EEF can be assumed, leading to a lower EEF by the use of proper isolation or other suitable actions like favorable light strategies. The ultimate energy efficiency of an indoor farm is determined by the photon efficiency of LEDs used, as well as the ability of the plants to convert light energy into dry matter [19]. The highest efficiency to use light energy was obtained in the LED treatment W. Compared to LED treatment B/R the efficiency was increased in W by 20%. According to the LED specifications, the calculated daily electrical energy consumption of B/R was slightly higher compared to the other LEDs used. However, the comparable LUE of B/R to the LED treatments W+B and W+FR suspects a more efficient biomass accumulation. In fact, the relative growth rate of B/R is similar to W and significantly higher to all other LED treatments. Photosynthesis enhances plant growth and dry matter accumulation. According to this effect, and in comparison, with the other LED treatments, the higher ETRmax values recorded for B/R support a more efficient biomass accumulation. Nevertheless, there was no significant differences in any LED treatment after 45 d, due to the high relative growth rate in the LED treatments W+B and W+FR.

4.4. Application

Our results indicate a good transferability and integration into existing industrial processes due to the high level of interest. Especially based on the quality-influencing factors soil, climate, pathogens, and plant specific requirements like self-incompatibility, production in an indoor farm proves to be advantageous. Furthermore, there is a high possibility of guaranteeing a homogeneous and precisely predictable quantity and quality of the plant-based products all year round. In addition, just-in-time production, which is often necessary for an integration into complex international supply chains of industrial processes, is made easier. A local production in indoor vertical farms offers a new flexibility to respond to market chances, crisis, or innovation motivated chances. Especially since delivery dates can be individually adjusted in terms of time by growing in smaller sets. This also reduces transport and storage times as well as packaging, which makes it easier to maintain the quality level of the vegetable raw material beyond the drying stage. Based on the high efficiency of land use and the resulting yields of dry matter and oil content, a transferability to other secondary metabolites can be assumed, which would further increase economically aspects. Even though electrical energy consumption has a still major impact on economical profitability of indoor farming, the use of renewable energy sources will give new opportunities. Especially as soon as a holistic view of existing material flows beyond the limits of plant production is also considered in order to include further product circles like fish, insects, or algae as well as surrounding material flows from urban regions [40]. According to this, the disadvantage in the area of electrical energy contrasts at present with an advantage in the area of water efficiency.

5. Conclusions

Marjoram production in an indoor farm shows high potential due to comparable yields of leaf dry weight and oil contents per cultivation area. However, due to the multi-layer system and a noticeable lowered growth period, the indoor farm achieves a significantly higher area efficiency compared to the open field. A high energy consumption was noted, indicating the need for renewable energy sources. The majority of the examined parameters on growth and dry matter yield indicated good results in the LED treatments B/R and W. There was no significant influence on the oil content for any LED treatments noted. However, in relation to the light use efficiency, a higher average efficiency in the LED treatment W became evident, especially for shorter cultivation periods. It should be additionally noted, that in practice, working under light that appears white to the eye is considerably more pleasant and enables the recognition of plant damage. This should be taken into account as long as there is no fully automated system available, making human interventions unnecessary within the cultivation room. Further investigations should deal with the optimization of the chosen culture parameters like photoperiod, temperature, the use of specific spectra like UV radiation and different stressors to enhance oil content and yield.

Author Contributions

Conceptualization, S.W., I.J., and H.M.; methodology, S.W. and I.J.; validation, S.W., I.J., and H.M.; formal Analysis, S.W. and I.J.; investigation, S.W., I.J., and H.M.; writing—original draft preparation, S.W.; writing—review and editing, S.W., I.J., and H.M.; visualization, S.W.; supervision, H.M.; project administration, H.M.; funding acquisition, H.M. All authors have read and agreed to the published version of the manuscript.

Funding

The research was financed by the Bavarian Ministry of Food, Agriculture, and Forestry.

Acknowledgments

The authors address special thanks to Thomas Wilke and the Tentamus Group GmbH, especially the laboratory QSI. Furthermore, we want to extend our appreciation to Gemüsering Stuttgart GmbH for their loan of the indoor farm as well as the support of the Applied Science Centre for Smart Indoor Farming.

Conflicts of Interest

The authors declare no conflict of interest.

References

  1. Nurzyńska-Wierdak, R.; Dzida, K. Influence of plant density and term of harvest on yield and chemical composition of sweet marjoram (Origanum majorana L.). Acta Sci. Pol. Hortorum Cultus 2009, 8, 51–61. [Google Scholar]
  2. Zawiślak, G.; Dzida, K. Yield and quality of sweet marjoram herb depending on harvest time. Acta Sci. Pol. Hortorum Cultus 2010, 9, 65–72. [Google Scholar]
  3. Zawiślak, G. Dependence on harvest date and yielding of Marjoram (Origanum majorana L.) cv. ‘Miraż’ cultivated from a seedling. Acta Sci. Pol. Hortorum Cultus 2008, 7, 7. [Google Scholar]
  4. Anbauverfahren Majoran. Available online: https://publikationen.sachsen.de/bdb/artikel/13856 (accessed on 5 April 2020).
  5. Estévez, M.; Ventanas, S.; Ramírez, R.; Cava, R. Influence of the addition of rosemary essential oil on the volatiles pattern of porcine frankfurters. J. Agric. Food Chem. 2005, 53, 8317–8324. [Google Scholar] [CrossRef]
  6. Banchio, E.; Bogino, P.C.; Zygadlo, J.; Giordano, W. Plant growth promoting rhizobacteria improve growth and essential oil yield in Origanum majorana L. Biochem. Syst. Ecol. 2008, 36, 766–771. [Google Scholar] [CrossRef]
  7. Sellami, I.H.; Maamouri, E.; Chahed, T.; Wannes, W.A.; Kchouk, M.E.; Marzouk, B. Effect of growth stage on the content and composition of the essential oil and phenolic fraction of sweet marjoram (Origanum majorana L.). Ind. Crop. Prod. 2009, 30, 395–402. [Google Scholar] [CrossRef]
  8. Vági, E.; Simándi, B.; Suhajda, A.; Hethelyi, E. Essential oil composition and antimicrobial activity of Origanum majorana L. extracts obtained with ethyl alcohol and supercritical carbon dioxide. Food Res. Int. 2005, 38, 51–57. [Google Scholar] [CrossRef]
  9. Vera, R.R.; Chane-Ming, J. Chemical composition of the essential oil of marjoram (Origanum majorana L.) from Reunion Island. Food Chem. 1999, 66, 143–145. [Google Scholar] [CrossRef]
  10. Trivino, M.G.; Johnson, C.B. Season has a Major Effect on the Essential oil Yield response to Nutrient Supply in Origanum Majorana. J. Hortic. Sci. Biotechnol. 2000, 75, 520–527. [Google Scholar] [CrossRef]
  11. Murillo-Amador, B.; Nieto-Garibay, A.; López-Aguilar, R.; Troyo-Diéguez, E.; Rueda-Puente, E.O.; Flores-Hernández, A.; Ruiz-Espinoza, F.H. Physiological, morphometric characteristics and yield of Origanum vulgare L. and Thymus vulgaris L. exposed to open-field and shade-enclosure. Ind. Crop. Prod. 2013, 49, 659–667. [Google Scholar] [CrossRef]
  12. Kozai, T.; Niu, G.; Takagaki, M. (Eds.) Plant Factory. An Indoor Vertical Farming System for Efficient Quality Food Production, 2nd ed.; Academic Press, an Imprint of Elsevier: London, UK, 2020. [Google Scholar]
  13. Graamans, L.; Baeza, E.; van den Dobbelsteen, A.; Tsafaras, I.; Stanghellini, C. Plant factories versus greenhouses: Comparison of resource use efficiency. Agric. Syst. 2018, 160, 31–43. [Google Scholar] [CrossRef]
  14. Pennisi, G.; Orsini, F.; Blasioli, S.; Cellini, A.; Crepaldi, A.; Braschi, I.; Spinelli, F.; Nicola, S.; Fernandez, J.A.; Stanghellini, C. Resource use efficiency of indoor lettuce (Lactuca sativa L.) cultivation as affected by red: Blue ratio provided by LED lighting. Sci. Rep. 2019, 9, 1–11. [Google Scholar] [CrossRef] [PubMed]
  15. Ohyama, K.; Yamaguchi, J.; Enjoji, A. Resource Utilization Efficiencies in a Closed System with Artificial Lighting during Continuous Lettuce Production. Agronomy 2020, 10, 723. [Google Scholar] [CrossRef]
  16. Nguyen, D.T.P.; Kitayama, M.; Lu, N.; Takagaki, M. Improving secondary metabolite accumulation, mineral content, and growth of coriander (Coriandrum sativum L.) by regulating light quality in a plant factory. J. Hortic. Sci. Biotechnol. 2020, 95, 356–363. [Google Scholar] [CrossRef]
  17. Rihan, H.Z.; Aldarkazali, M.; Mohamed, S.J.; McMulkin, N.B.; Jbara, M.H.; Fuller, M.P. A Novel New Light Recipe Significantly Increases the Growth and Yield of Sweet Basil (Ocimum basilicum) Grown in Plant Factory System. Agronomy 2020, 10, 934. [Google Scholar] [CrossRef]
  18. Kalantari, F.; Mohd Tahir, O.; Mahmoudi Lahijani, A.; Kalantari, S. A Review of Vertical Farming Technology: A Guide for Implementation of Building Integrated Agriculture in Cities. AEF Adv. Eng. Forum 2017, 24, 76–91. [Google Scholar] [CrossRef]
  19. Pennisi, G.; Blasioli, S.; Cellini, A.; Maia, L.; Crepaldi, A.; Braschi, I.; Spinelli, F.; Nicola, S.; Fernandez, J.A.; Stanghellini, C. Unraveling the role of red: Blue LED lights on resource use efficiency and nutritional properties of indoor grown sweet basil. Front. Plant Sci. 2019, 10, 305. [Google Scholar] [CrossRef] [Green Version]
  20. Carvalho, S.D.; Schwieterman, M.L.; Abrahan, C.E.; Colquhoun, T.A.; Folta, K.M. Light quality dependent changes in morphology, antioxidant capacity, and volatile production in sweet basil (Ocimum basilicum). Front. Plant Sci. 2016, 7, 1328. [Google Scholar] [CrossRef] [Green Version]
  21. Schwend, T.; Prucker, D.; Peisl, S.; Nitsopoulos, A.; Mempel, H. The rosmarinic acid content of basil and borage correlates with the ratio of red and far-red light. Eur. J. Hortic. Sci. 2016, 81, 243–247. [Google Scholar] [CrossRef]
  22. Barbosa, G.L.; Gadelha, F.D.A.; Kublik, N.; Proctor, A.; Reichelm, L.; Weissinger, E.; Wohlleb, G.M.; Halden, R.U. Comparison of land, water, and energy requirements of lettuce grown using hydroponic vs. conventional agricultural methods. Int. J. Environ. Res. Public Health 2015, 12, 6879–6891. [Google Scholar] [CrossRef] [Green Version]
  23. Rascher, U.; Liebig, M.; Lüttge, U. Evaluation of instant light-response curves of chlorophyll fluorescence parameters obtained with a portable chlorophyll fluorometer on site in the field. Plant Cell Environ. 2000, 23, 1397–1405. [Google Scholar] [CrossRef]
  24. DIN EN ISO 6571. Gewürze, Würzende Zutaten und Kräuter—Bestimmung des Ätherischen Ölgehalts (Wasserdampfdestillationsverfahren) (ISO 6571:2008 + Amd 1:2017); Deutsche Fassung EN ISO 6571:2009 + A1:2017; DIN Deutsches Institut für Normung e.V.: Berlin, Germany, 2018. [Google Scholar]
  25. Galambosi, B.; Galambosi, Z.; Pessala, R.; Hupila, I.; Aflatuni, A.; Repcak, M.; Svoboda, P.K. Yield and Quality of Selected Herb Cultivars in Finland. Acta Hortic. 2002, 139–149. [Google Scholar] [CrossRef]
  26. Son, K.-H.; Oh, M.-M. Leaf shape, growth, and antioxidant phenolic compounds of two lettuce cultivars grown under various combinations of blue and red light-emitting diodes. Horts 2013, 48, 988–995. [Google Scholar] [CrossRef]
  27. Seidler-Łożykowska, K.; Golcz, A.; Wójcik, J. Yield and quality of sweet basil, savory, marjoram and thyme raw materials from organic cultivation on the composted manure. J. Res. Appl. Agric. Eng. 2008, 53, 63–66. [Google Scholar]
  28. Nurzyñska-Wierdak, R.; Zawislak, G.; Kowalski, R. The Content and Composition of Essential Oil of Origanum majorana L. Grown in Poland Depending on Harvest Tme and Method of Raw Material Preparation. J. Essent. Oil Bear. Plants 2015, 18, 1482–1489. [Google Scholar] [CrossRef]
  29. Circella, G.; Franz, C.; Novak, J.; Resch, H. Influence of day length and leaf insertion on the composition of marjoram essential oil. Flavour Fragr. J. 1995, 10, 371–374. [Google Scholar] [CrossRef]
  30. Davidenco, V.; Argüello, J.A.; Piccardi, M.B.; Vega, C.R.C. Day length modulates precocity and productivity through its effect on developmental rate in Origanum vulgare ssp. Sci. Hortic. 2017, 218, 164–170. [Google Scholar] [CrossRef]
  31. Kizil, S.; Toncer, O. Influence of different harvest times on the yield and oil composition of spearmint (Mentha spicata L. var. spicata). J. Food Agric. Environ. 2006, 4, 135. [Google Scholar]
  32. Saeb, K.; Gholamrezaee, S. Variation of essential oil composition of Melissa officinalis L. leaves during different stages of plant growth. Asian Pac. J. Trop. Biomed. 2012, 2, S547–S549. [Google Scholar] [CrossRef]
  33. Yosr, Z.; Hnia, C.; Rim, T.; Mohamed, B. Changes in essential oil composition and phenolic fraction in Rosmarinus officinalis L. var. typicus Batt. organs during growth and incidence on the antioxidant activity. Ind. Crop. Prod. 2013, 43, 412–419. [Google Scholar] [CrossRef]
  34. Alizadeh, A.; Khosh-khui, M.; Javidnia, K.; Firuzi, O.; Jokar, S.M. Chemical Composition of the Essential Oil, Total Phenolic Content and Antioxidant Activity in Origanum majorana L. (Lamiaceae) Cultivated in Iran. Adv. Environ. Biol. 2011, 5, 2326–2331. [Google Scholar]
  35. Meng, Q.; Runkle, E.S. Far-red radiation interacts with relative and absolute blue and red photon flux densities to regulate growth, morphology, and pigmentation of lettuce and basil seedlings. Sci. Hortic. 2019, 255, 269–280. [Google Scholar] [CrossRef]
  36. Kozai, T. Resource use efficiency of closed plant production system with artificial light: Concept, estimation and application to plant factory. Proc. Jpn. Acad. Ser. B 2013, 89, 447–461. [Google Scholar] [CrossRef] [PubMed] [Green Version]
  37. Montesano, F.F.; van Iersel, M.W.; Boari, F.; Cantore, V.; D’Amato, G.; Parente, A. Sensor-based irrigation management of soilless basil using a new smart irrigation system: Effects of set-point on plant physiological responses and crop performance. Agric. Water Manag. 2018, 203, 20–29. [Google Scholar] [CrossRef]
  38. Ekren, S.; Sönmez, Ç.; Özçakal, E.; Kurttaş, Y.S.K.; Bayram, E.; Gürgülü, H. The effect of different irrigation water levels on yield and quality characteristics of purple basil (Ocimum basilicum L.). Agric. Water Manag. 2012, 109, 155–161. [Google Scholar] [CrossRef]
  39. Mempel, H.; Jüttner, I.; Wittmann, S. The potentials of Indoor Farming for plant production. In at-Automatisierungstechnik; De Gruyter: Berlin, Germany, 2021; accepted. [Google Scholar]
  40. CUBES Circle. Available online: https://www.cubescircle.de/ (accessed on 31 October 2020).
Figure 1. Simplified scheme of the experimental setup showing the (A) structure of a shelf with four levels and the (B) top view of one exemplary shelf with the respective arrangement of the five trays and the two harvesting areas, as characterized by two different colored areas and exemplary marked with one tray and one harvesting area. (C) shows an overview of the indoor farm used and the yellow marked position of the shelves used for the experimental setup.
Agronomy 10 01769 g001
Figure 2. Light spectra used. The technical specifications of the LEDs were taken according to the manufacturer. Below each LED treatment, the percentage distribution is given for defined wavelength ranges as measured according to own measurements with a hand-held spectrometer.
Agronomy 10 01769 g002
Figure 3. Exemplary representation of the data collection process during harvest as a flow chart.
Agronomy 10 01769 g003
Figure 4. Exemplary representation of the development stage of marjoram after 38 d of cultivation for each light treatment, respectively. Plant length shown in cm.
Agronomy 10 01769 g004
Figure 5. (A) Drying ratio as percentage of DWtotal:FW, (B) share of marketable leaf dry weight in relation to DWtotal, (C) relative growth rate per day and (D) yield of leaf dry weight per square meter cultivation area (plant density of 375 plants per m−2 based on the experimental setup) of marjoram growth grown under four different light treatments. All results are based on a cutting height of 5 cm. Different letters represent significant differences between light treatments at p < 0.05, determined according to Tukey’s test. There was no significant difference for a cultivation time of 45 d.
Agronomy 10 01769 g005
Figure 6. Results of instant light-response curves with an adaption time of 30 s of chlorophyll fluorescence measurement on marjoram leaves (n = 3) grown under different LED treatment.
Agronomy 10 01769 g006
Figure 7. Essential oil content for dried leaves of marjoram plants grown under different LED treatments (n = 9). Different letters in each column represents significant differences between light treatments at p < 0.05, determined according to Tukey’s test. There was no significant difference for both cultivation times, respectively.
Agronomy 10 01769 g007
Figure 8. Light use efficiency (LUE) for marjoram plants grown under light treatments with blue and red as standard compared to white light with different shares of blue, green, and far red (n = 9). Results are shown for a cultivation time of 38 d and 45 d, respectively.
Agronomy 10 01769 g008
Figure 9. Land surface use efficiency (SUE) for marjoram plants grown on open field and in an indoor vertical farm with the reference value of one square meter floor area. n = 36.
Agronomy 10 01769 g009
Table 1. Results on shoot length, fresh weight (FW), dry weight (DW) separately for total, leaf, and stem of marjoram on day 38 and 45, respectively. Data is shown as means ± SD (n = 9). Different letters in each column represents significant differences between light treatments at p < 0.05, determined according to Tukey’s test.
Treatment
Code
Cultivation
Time (d)
Shoot Length
(cm)
FW
(g plant−1)
DWtotal
(g plant−1)
DWleaf
(g plant−1)
DWstem
(g plant−1)
B/R3832.3 ± 3.1 a4.16 ± 0.81 a0.64 ± 0.09 a0.38 ± 0.07 ab0.26 ± 0.03 a
W 31.2 ± 3.1 ab4.03 ± 0.35 a0.65 ± 0.04 a0.41 ± 0.03 a0.25 ± 0.03 a
W+B 22.9 ± 2.5 c2.65 ± 0.46 b0.45 ± 0.07 b0.30 ± 0.04 b0.14 ± 0.03 b
W+FR 28.0 ± 4.4 b3.01 ± 0.83 b0.48 ± 0.14 b0.30 ± 0.08 b0.18 ± 0.06 b
B/R4534.3 ± 6.1 A4.40 ± 1.38 A0.82 ± 0.22 A0.48 ± 0.13 A0.34 ± 0.10 A
W 34.5 ± 4.2 A4.70 ± 1.20 A0.81 ± 0.20 A0.49 ± 0.12 A0.31 ± 0.09 A
W+B 27.4 ± 3.1 B3.64 ± 0.63 A0.66 ± 0.12 A0.42 ± 0.06 A0.24 ± 0.06 A
W+FR 32.9 ± 3.9 AB4.02 ± 0.43 A0.74 ± 0.11 A0.46 ± 0.09 A0.27 ± 0.04 A
Table 2. Flowering state at the time of harvest for all four light treatments. Budding stage = no flower open, First flowers open = < 1% of flowers open, Full-flowering stage = more than 2/3 of flowers open.
Treatment CodeFlowering Stage after 38 dFlowering Stage after 45 d
B/RBudding stageFirst flowers open
WBudding stageFirst flowers open
W+BBudding stageFirst flowers open
W+FRFirst flowers openFull-flowering stage
Publisher’s Note: MDPI stays neutral with regard to jurisdictional claims in published maps and institutional affiliations.

