Article

Automatic Wheat Lodging Detection and Mapping in Aerial Imagery to Support High-Throughput Phenotyping and In-Season Crop Management

1
Department of Biological Systems Engineering, University of Nebraska-Lincoln, Lincoln, NE 68583, USA
2
Macro Agriculture Research Institute, College of Resource and Environment, Huazhong Agricultural University, Wuhan 430070, Hubei, China
3
Key Laboratory of Arable Land Conservation (Middle and Lower Reaches of Yangtze River), Ministry of Agriculture, Wuhan 430070, Hubei, China
4
Department of Agronomy & Horticulture, University of Nebraska-Lincoln, Lincoln, NE 68583, USA
*
Authors to whom correspondence should be addressed.
Agronomy 2020, 10(11), 1762; https://doi.org/10.3390/agronomy10111762
Submission received: 29 September 2020 / Revised: 5 November 2020 / Accepted: 9 November 2020 / Published: 12 November 2020
(This article belongs to the Special Issue Smart Decision-Making Systems for Precision Agriculture)

Abstract

:
Latest advances in unmanned aerial vehicle (UAV) technology and convolutional neural networks (CNNs) allow us to detect crop lodging in a more precise and accurate way. However, the performance and generalization of a model capable of detecting lodging when the plants may show different spectral and morphological signatures have not been investigated much. This study investigated and compared the performance of models trained using aerial imagery collected at two growth stages of winter wheat with different canopy phenotypes. Specifically, three CNN-based models were trained with aerial imagery collected at early grain filling stage only, at physiological maturity only, and at both stages. Results show that the multi-stage model trained by images from both growth stages outperformed the models trained by images from individual growth stages on all testing data. The mean accuracy of the multi-stage model was 89.23% for both growth stages, while the mean of the other two models were 52.32% and 84.9%, respectively. This study demonstrates the importance of diversity of training data in big data analytics, and the feasibility of developing a universal decision support system for wheat lodging detection and mapping multi-growth stages with high-resolution remote sensing imagery.

1. Introduction

Wheat is one of the most important food crops worldwide providing calories and protein for human consumption [1]. According to the Food and Agriculture Organization of the United Nations, global wheat production reached more than 770 million tons in 2017. Lodging is one of the main issues that reduces wheat yield [2]. Lodging can happen at any time during the growing season. A large number of studies have shown that lodging can reduce wheat yield by up to 50% [3,4,5,6]. Lodged wheat that has fallen flat on the ground reduces harvest efficiency and creates difficulties in post-season pest and residue management [7,8,9]. According to previous research, lodging can be caused by extreme weather events (e.g., wind, hail, and rain), water and nutrient stresses, diseases and insect pests, and unfavorable management practices [10,11]. Efforts to reduce lodging have been made by scientists, agricultural professionals and growers in terms of understanding lodging mechanisms, breeding lodging-resistant varieties [12,13], developing prediction models for extreme weather events [14,15], and improving management practices [16,17].
For decades, crop lodging at regional or national scales has been successfully monitored through remote sensing based on satellite or manned aircraft platforms [18,19,20,21]. Satellites and manned aircrafts can cover large geographic regions and they are suitable to survey and map lodging at the county, state, and national scale. However, their drawbacks are that they are subjective to the weather conditions at the time of the measurements (e.g., cloud covers, and water vapor) and have limited spatial and temporal resolution. Compared with the satellite and manned aircrafts platforms, unmanned aerial vehicle (UAV) is advantageous in terms of cost and image resolution, enabling its application in research on breeding, cultivation, management at the field or plot level in precision agriculture [9,22,23]. Thus, UAV has become an emerging platform for crop lodging identification and monitoring in plot and field scales in recent years [10,24,25,26,27].
Crop lodging detection with UAV-based remote sensing has been tested on several crop species including maize (Zea mays L.) [28], rice (Oryza sativa L.) [29], barley (Hordeum vulgare L.) [30], and wheat (Triticum spp.) [31]. Li et al. [32] compared the methods of using color and texture features to assess the lodging in maize from UAV imagery and an error rate of 3.5% was reported. Similarly, Liu et al. [24] delineated a wheat lodging area combining spectral and textural features from UAV images with an accuracy greater than 80%. Additionally, Rajapaksa et al. [26] employed the support vector machine (SVM) approach to classify wheat lodging with gray level co-occurrence matrix. Three-dimensional structural information based upon changes in crop height was also derived from the high-resolution UAV imagery and used to detect the crop lodging [33]. These previous studies have shown promising results to identify and monitor crop lodging by extracting spectral, textural, and structural features from UAV-acquired imagery, and then coupled them with conventional machine learning approaches.
To maximize the information obtained from the high-resolution remote sensing data, the convolutional neural network (CNN) is one of the most powerful algorithms for image analysis [34,35,36,37]. Different from the conventional image processing methods that require manual extraction for color, texture, or structural features, CNNs extract optimal features automatically, making it well-suited for high resolution image analysis [38,39]. Zhao at el. [27] proposed a method for rice lodging assessment in UAV images based on a full-convolution network called UNet. They reported the best dice-coefficients (also known as F1-score) using RGB image as 0.944, providing a method for rice lodging monitoring in a large area with low cost and high efficiency. Mardanisamani et al. [25] developed a deep convolutional neural network architecture augmented with handcrafted texture features, namely LodgedNet, for lodging classification in UAV imagery. They claimed that their method was suitable for real-time classification tasks. In addition, Yang at el. [40] established an image semantic segmentation model employing fully connected network (FCN-AlexNet), and SegNet neural network for rice lodging identification using UAV imagery. To date, various CNN models were proposed to detect and map crop lodging from the high-resolution UAV imagery [41].
However, most of the studies using high spatial resolution imagery and advanced image analysis algorithms for crop lodging detection were based on data collected at one time point when the lodging happened. The models were often trained by images with lodged plants at a specific growth stage with similar phenotypes, i.e., canopy color and size. However, lodging can happen at any time during the growing season. For practical applications, an automatic lodging detection model is required to be more universal and accurate at various growth stages with different plant phenotypes rather than being limited to a specific growth stage. Hence, the objective of this study was to investigate the importance of training data diversity on CNN-based lodging detection and mapping by comparing the performance of models trained and tested by different combinations of aerial imagery collected at two growth stages with different canopy phenotypes. Specifically, we trained three CNN-based wheat lodging detection and mapping models with aerial imagery collected at early grain filling stage only, at physiological maturity only, and at both stages. These models were tested and compared for their individual performance on each growth stage to investigate their robustness on wheat lodging detection and mapping.

2. Materials and Methods

2.1. Study Site and UAV Image Collections

Experiments were conducted in a wheat breeding field in Lincoln, Nebraska. Coordinates of the center of the field in the WGS84 geographic coordinate system were 96.61° W, 40.86° N (Figure 1). Wheat was sown on 25 October 2017. Data were collected at early grain filling stage on 3 June 2018, when the plants were green and at physiological maturity on 18 June 2018, when the plants started drying down showing a mix of brown and dark green color. There were 360 plots in total. Each plot was 3 m long and 1 m wide. A polygon in the size of 2.5 m by 0.8 m for each plot was created in ArcMap 10.3 software (Esri Inc., Redlands, CA, USA) to mitigate the effect of edges or shadows.
A six-rotary wing UAV Martice 600 Pro (DJI, Shenzhen, Guangdong, China) was used to collect digital images by a nadir-view RGB camera, Zenmuse X5R RGB camera (DJI, Shenzhen, Guangdong, China) (Figure 1a). The UAV was operated at an average altitude of 15 m above ground level, in order to acquire high resolution imagery and balance the flight time. The weather conditions during image collection were clear and sunny with low wind. Images were collected during solar noon to minimize the influence of shadowing with 85% of frontal and side overlaps during the flights. Images were in JPEG format with 4608 × 3456 pixels. Several ground control points (GCPs) were placed in the fields during image collection for geometric correction in image pre-processing (Figure 1c,d). GPS information of these GCPs was measured by a survey-grade GNSS RTK GPS receiver (Topcon Positioning Systems, Inc., Tokyo, Japan), with ±10 mm accuracies in horizontal direction and ±15 mm in vertical direction.

2.2. Image Processing and CNN Modeling

2.2.1. Image Pre-Processing

Images were processed in Pix4D Mapper software Version 4.4.12 (PIX4D, Lausanne, Switzerland) to generate an ortho-mosaic imagery. The spatial resolution of the ortho-mosaic image was 0.50 cm for early grain filling stage, and 0.48 cm for physiological maturity after calibration with the GCPs. For each growth stage, plots were randomly divided into three sections for model training (60%, n = 216), validation (20%, n = 72) and testing (20%, n = 72) (Figure 1c,d). Lodged areas inside these polygons of the plots were labeled and outlined manually in ArcMap 10.3 software based on expertise and notes from the field survey, while the unlabeled areas were considered as non-lodged areas. The computer used for this study is a 64-bit operating system, with Intel® Xeon® CPU E5-1650 v4 @ 3.60 GHz and NVIDIA® Quadro® K620 (NVIDIA®, Santa Clara, CA, USA), as well as a memory of 160 GB (Intel®, Santa Clara, CA, USA).

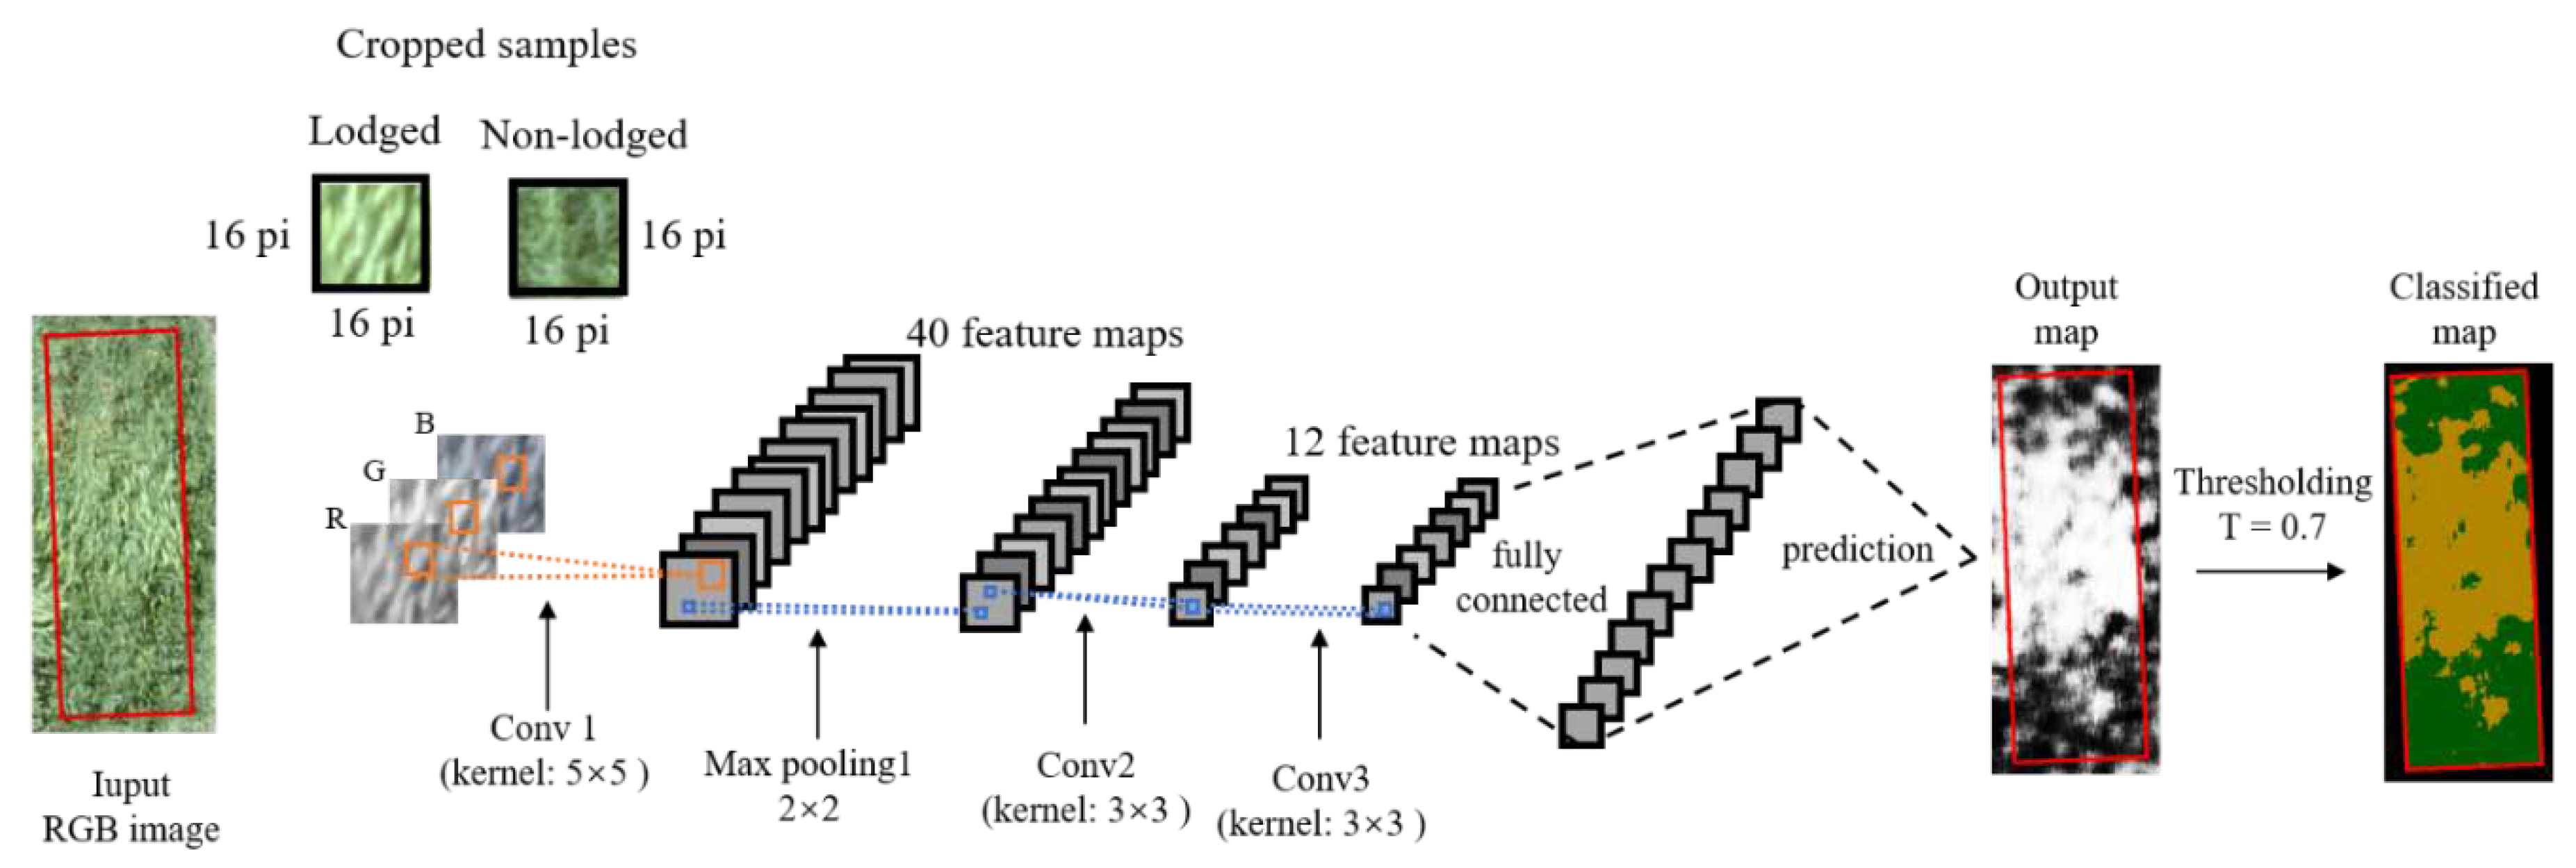
2.2.2. CNN Architecture and Experimental Design

In this study, three CNN models were trained, respectively: (1) model_ grain filling, which was the model trained by image samples at the early grain filling stage exclusively; (2) model_ physiological maturity, which was the model trained by image samples at the physiological maturity exclusively; and (3) model_ both, which was the model trained by image samples at both the early grain filling stage and physiological maturity and tested on both stages (Table 1). The CNN algorithm was based on Google TensorFlow API [42] and implemented in Trimble’s eCognition Developer 9.3 software (Trimble, Sunnyvale, CA, USA). There were three steps: (1) to generate sample patches of lodging and non-lodging classes, (2) to create and train the model, and (3) to test the model and report its performance [43,44]. Some studies have been reported that use the CNN algorithm in this software for trees identification and classification [45,46] and dwelling identification [47,48].
In this study, a customized architecture for the CNN was used, which included three hidden layers and one fully connected layer (Figure 2), and it was applied to the three models. The first hidden layer used a kernel size of 5 × 5 pixels, followed by a max pooling layer in size of 2 × 2 pixels with a stride of 2 pixel. After this hidden layer, there were two additional hidden layers using a kernel size of 3 × 3 pixels but not followed by max pooling layer. The number of feature maps were 40 for the first hidden layer, and 12 for other two layers. After trial and error, the best patch size of the training samples was chosen to be 16 × 16 pixels. Then, 8000 samples per class (lodged and non-lodged wheat) were cropped from the training plots, respectively, in each ortho-mosaic image at wheat early grain filling and physiological maturity. A batch size of 50 and 5000 training steps were used with a learning rate of 0.0005. Each pixel in the output maps in Figure 2 shows a probability value ranging from 0 (dark) to 1 (bright). A pixel value of 0 indicated a very low probability of lodging, while a pixel value of 1 indicated a high probability of lodging. The thresholding value was tuned by classifying the output map (Figure 2) into lodged and non-lodged wheat in a validation dataset, with varying values from 0 to 1 stepping on 0.01. More details about tuning the optimal threshold (0.7 was considered as the optimal threshold in this study) is mentioned in Section 2.3.1 and Section 3.1.

2.3. Model Optimization and Accuracy Assessment

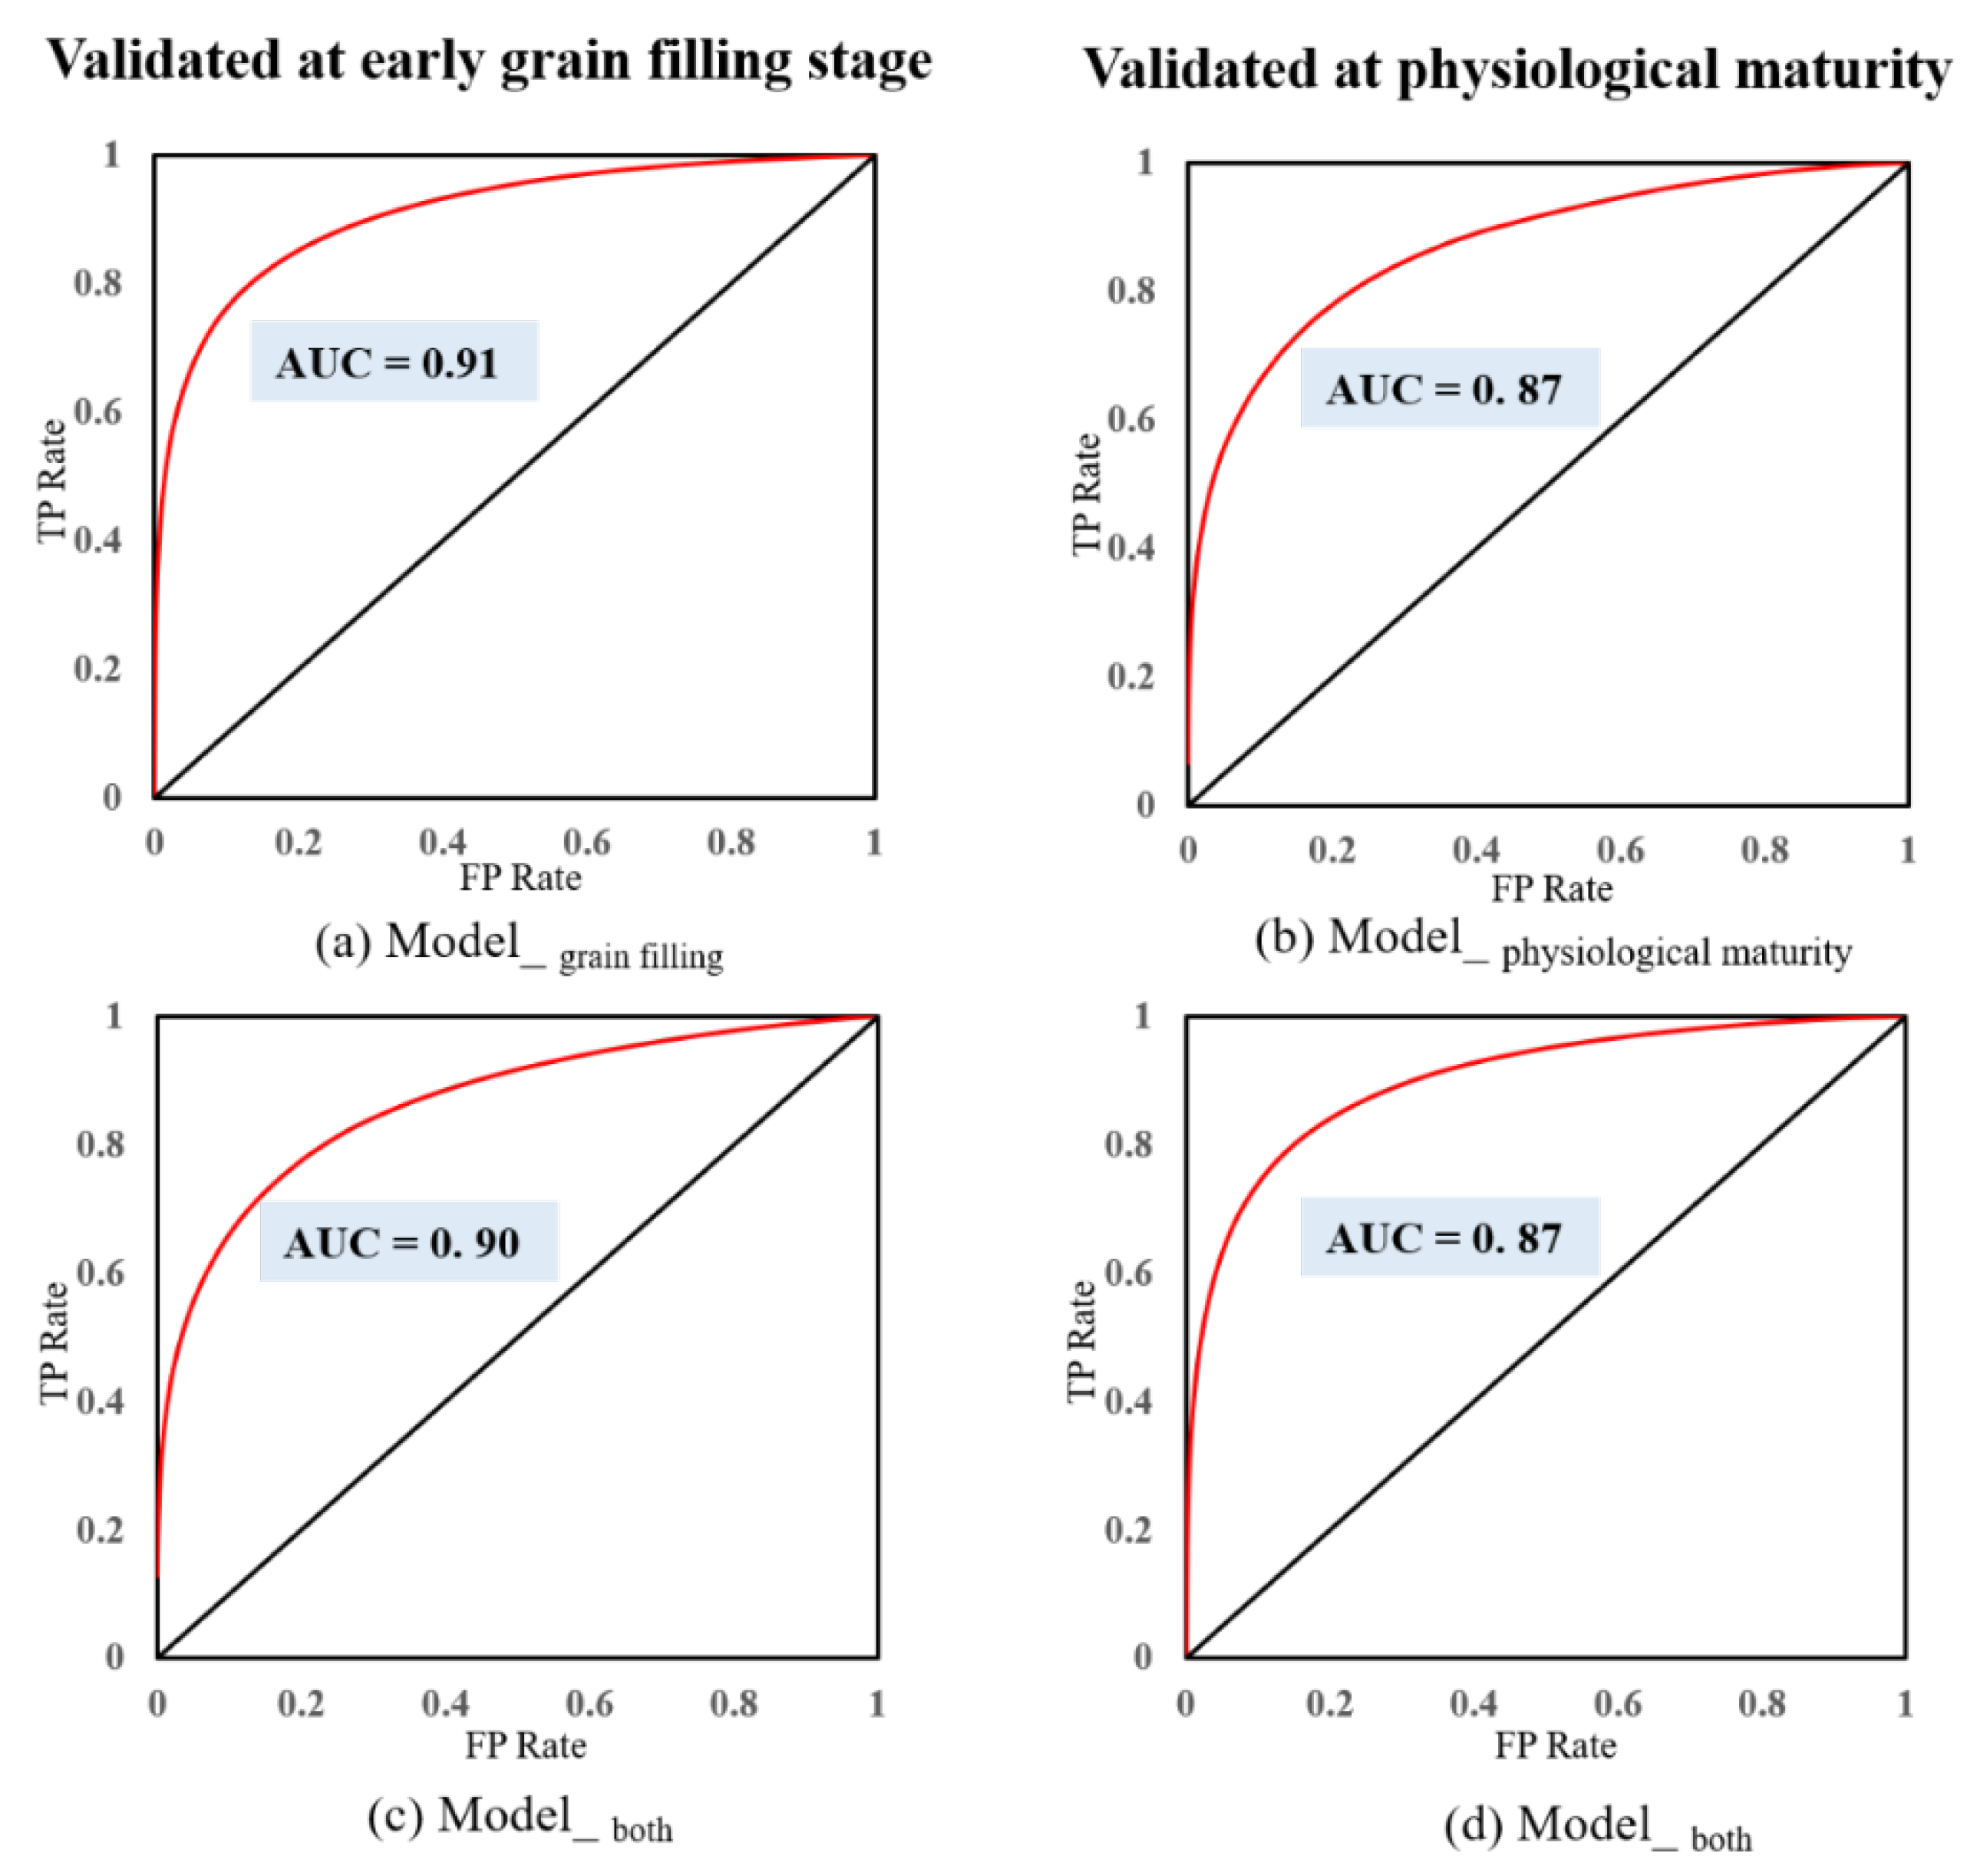
2.3.1. Model Validation

In this study, the receiver operating characteristics (ROC) curve and the area under the curve (AUC) were used to quantify and validate the performance of the model, which was with the true positive rate (TP rate, another term of Recall, Equation (1)) as y-axis and the false positive rate (FP rate, Equation (2)) as x-axis [49]. A model with an AUC of 0.5 was considered as a random classifier, while it was more reliable and precise when its AUC was closer to 1.0 [50]. Each pair of TP rate and FP rate corresponded to a unique threshold that was used to classify the pixel into lodged wheat and non-lodged wheat. Usually, the best threshold can maximize the TP rate and minimize the FP rate, which is an ideal situation. In applications, the threshold that can balance the tradeoff between the TP rate and FP rate was considered as optimal. Here, the optimal threshold was chosen according to the ROC curve graph.

2.3.2. Accuracy Assessment of Lodging Classification in Testing Dataset

Metrics based on the classification confusion matrix were calculated for the performance evaluation in the testing dataset, including Precision, Recall, F1-score, mapping overall accuracy (OA) and kappa coefficient (Kc). The formulas of TP rate (Recall), FP rate, Precision, F1-score, OA and Kc were calculated as follows (Equations (1)–(8)):
TP   Rate = Recall = TP TP + FN
FP   Rate = FP TN + FP
F 1 score = 2 × Precision × Recall Precision + Recall
Precision = TP TN + FP
OA = TP + TN TP + FN + FP + TN
K c = P 0 P e 1 P e
P 0 = OA
P 0 = ( TP + FP ) × ( TP + FN ) + ( FN + TN ) × ( FP + TN ) ( TP + FN + FP + TN ) 2

3. Results and Discussions

3.1. Model Validation

ROC curves and the corresponding AUC values of the three models applied to the validation dataset at the early grain filling stage and physiological maturity were plotted, as shown in Figure 3. All AUCs were greater than 0.85, showing reliable capacity for classifying lodged and non-lodged wheat at field level through these three models. The ordering of AUCs was 0.91 for model_ grain filling, 0.90 for model_ both validated at the early grain filling stage, 0.87 for both model_ both validated at the physiological maturity and model_ physiological maturity. These results also validate that model_ both had comparable performance with model_ grain filling and model_ physiological maturity. After an iteration of segmentation with threshold from 0 to 1 stepping on 0.01, the values ranging from 0.67 to 0.74 showed superior results for classifying lodged and non-lodged wheat among the validation data set. Accordingly, the value of 0.70 was used as the threshold in this study. With this threshold, three models showed mean Precision, Recall, F1-score around 70% among the validation datasets. The issue of overfitting was a concern in the modeling. In our results, the inspection between training data and validation data shows that there was no overfitting among the models.

3.2. Accuracy of Lodging Classification and Mapping

3.2.1. Overall Quantitative Evaluation with Confusion Matrices

Table 2 shows the overall testing performance of the three trained models (model_ grain filling, model_ physiological maturity, and model_ both) on lodging classification in terms of confusion matrix, Precision, Recall, F1-score, overall accuracy (OA) and kappa coefficient (Kc). Results show that when the models trained only by samples at a specific stage were tested on data at a different growth stage, the models showed poor performance (e.g., testing model_ grain filling on data at physiological maturity, or testing model_ physiological maturity on data at the early grain filling stage). In contrast, model_ both that was trained by samples from both stages had satisfactory performance tested either at the early grain filling stage or physiological maturity. This model is more universal and not limited by a specific growth stage, suggesting the importance of training data diversity on CNN-based lodging detection and mapping systems.
On the other hand, model_ both showed a comparable performance with the other two models. When tested at the early grain filling stage, F1-score, overall accuracy (OA) and kappa coefficient (Kc) of model_ grain filling were 67.20%, 90.22%, and 0.61, respectively, while they were 67.70%, 89.47%, and 0.61 for model_ both. Additionally, when tested at physiological maturity, they were 58.01%, 88.89% and 0.52 for model_ both, respectively, while they were 56.13%, 85.67%, and 0.48 for model_ physiological maturity. The comparison also demonstrated that it was feasible to use model_ both to identify and classify wheat lodging in this study. Basically, most wheat does not lodge at true heading or even at anthesis stage, but it will begin to lodge at the early grain filling stage and thereafter. As the two stages used for this study would represent the beginning of likely lodging to the ending of lodging in wheat, the model_ both was expected to provide a perspective and the possibility to detect and map wheat lodging at multiple growth stages, being effective throughout the peak lodging period for wheat detection in order to make advancement decisions.

3.2.2. Visualization of Model Performance

The visualization results display that the models trained by samples at a specific stage showed poor performance when testing on data at different stages. Apparently, the canopy texture, color and characteristics were different when lodging occurred at the early grain filling stage and physiological maturity in the RGB images. This result was expected as there were obvious color differences between green wheat at the early grain filling stage and the tan, senescing wheat at physiological maturity. Thus, when the model_ physiological maturity was tested on the plot at the early grain filling stage, the model mis-recognized more non-lodged area as lodging area at higher possibility (more bright area out of the labelled lodging area compared with the other two maps in Figure 4a). This issue was more severe when the model_ grain filling was tested on the plot at physiological maturity in Figure 4b. However, the results clearly demonstrate and strongly support that the model_ both showed comparable performance with the other two models. For example, testing at the plot at the early grain filling stage, the results of model_ both and model_ grain filling were very similar. When testing at the plot at physiological maturity, the results of model_ both and model_ physiological maturity were also very similar. In the classified maps from model_ both, lodged wheat that were the most distinguishable in the RGB image were successfully classified. The results are valuable for wheat lodging management decisions, providing the lodging location and lodging situation.
The manual labeling of the lodging areas in aerial imagery was subjected to errors that affected the performance of lodging detection and classification. Table 3 shows the intersection over union (IoU) of plots in Figure 4 and all test plots for the lodging detection in the study. The values of IoU for lodging class over the models were not high, which indicates some discrepancies between the manually labelled lodging areas and the model predicted lodging areas. One of the major reasons leading to this relatively low IoU was the errors in the subjective manual labeling for model training to delineate the boundaries of the lodging areas. In most cases, the manual labeling could only delineate a rough boundary of the lodging area. A model may manage to learn to differentiate lodging and non-lodging pixels, but the evaluation of the model performance would still be based on the manual labels. On the other hand, a relatively low IoU (0.4–0.6) may not necessarily mean a poor performance of the classification model. In fact, in many applications, knowing the locations and rough sizes of lodging areas in the field would be useful enough for decision-making in agricultural production and cultivar selection. For example, the model-predicted lodging areas in the last column of Figure 4 were pixel-wise and did not have a perfect overlap with the labelled lodging areas in column one shown by the blue lines (low IoU), but it precisely captured most of the lodging areas to provide useful information for breeders.
Results in this study confirm the importance of training data diversity to increase the generalizability and reliability of machine/deep learning models. The model_ both trained by different combinations of aerial imagery collected at the two wheat growth stages with different canopy phenotypes and characteristics showed obviously better performance than the models that did not include the different plant phenotypes in their training data sets. As lodging can happen throughout the grain filling period to harvest, a robust lodging detection model should be trained with data from various growth stages with different plant phenotypes representing this continuum. The data available to be used in this study were at the wheat early grain filling stages and physiological maturity. Efforts can be made to pool lodging data/imagery for individual crops with different varieties, at more growth stages collected by different groups at different geographic regions in a centralized and shared database to facilitate further model training and improvement.

3.3. Applications and Limitations

This study investigated the feasibility of developing a decision support system for wheat lodging detection at multiple growth stages with different canopy phenology. The key technologies that enable this system are high spatial resolution aerial imagery and the CNN-based data analytics. The high spatial resolution aerial imagery provides rich information about canopy phenology (spectral, structural, and textural information), which makes it possible for the CNN-based data analytics to achieve decision-making in a way much closer to how humans make decisions. On the other hand, a precondition of effectively utilizing the latest machine or deep learning technology is having a vast amount of training data so that the algorithms can learn well. In addition to algorithm advancement, accumulating datasets with various sensing configurations and environment conditions, growth stages, and even cultivars are necessary to move towards the goal of an automatic, accurate, and reliable machine learning-based decision-making system in agriculture.
Improving the CNN model’s architecture was not a focus in this study. However, there is no doubt that this will be important in future work. More complex model architectures with well-recognized performances, such as AlexNet, ResNet, DenNet, and VGGNet, have been investigated and evaluated in agricultural applications, including plant lodging detections, with very promising results as mentioned in the introduction. For example, performances of wheat lodging using multiple machine learning methods were compared by Zhang et al. [41]. Compared with such a complex model, the CNN model used in this study had a substantially lower number of parameters and a higher efficiency with acceptable accuracies. Most of the lodging detection and mapping may not require super accurate pixel-wise classification, whereas factors including model generalizability, robustness, speed, efficiency, and computational resource requirements are important elements to consider beyond the detection accuracy.
This study used a UAV flying at a very low altitude (15 m) and collected RGB images over a winter wheat breeding field of about 0.004 square kms (one acre), resulting in a very high spatial resolution of 0.5 cm. This method needs to be adapted in order to be applied in production agriculture with much larger fields by increasing the flying altitude, switching to cameras with higher pixel resolution, and using UAVs with longer endurance. There are commercial off-the-shelf UAV systems that can fly up to five hours (e.g., HSE SP9, Casselberry, FL, USA). This makes it possible to cover a production field of about 0.65 square kms (160 acres) with a flying altitude lower than 120 m (400 ft) at a regular flying speed. On the other hand, with the low-end RGB cameras carried on most of the UAVs today, we can reach a spatial resolution at the level of a few centimeters (inch level) by flying at the upper limit (400 ft). If depicting the exact boundary is not necessary but mapping the locations and rough sizes is the focus, this spatial resolution may already be enough to detect row or regional lodging patches given the size of the common lodging patches in production. Nevertheless, it is necessary and in demand to investigate the model structure and performance with input images in a lower spatial resolution.

4. Conclusions

Our study suggests the importance of incorporating diversity into training data in the big data analytics and suggests the exploitation of the temporal data to enhance the data diversity for decision-making systems. We evaluated the performance on winter wheat lodging mapping using CNN-based deep learning models trained by different sets of UAV imagery collected at two growth stages with different phenology. Performance of a multi-stage model trained by data from both growth stages as well as two models trained by data from one growth stage were compared. Results show that it is feasible to develop a universal detection model for lodging detection at multi-growth stages and different phenology. The universal model showed satisfactory and consistent performance with overall testing accuracies of 89.47% and 88.98% at the early grain filling stage and at physiological maturity, respectively, while the other two models trained by data from individual growth stages had overall testing accuracies of 14.41% and 84.13% on data that they were not trained with. In our application, this result is useful enough for decision-making within agricultural production and cultivar selection using the universal model. The study also emphasizes the importance of the diversity of training samples for CNN-based machines/deep learning models. With the rapid advances in high spatial and temporal resolution remote sensing technologies, accumulating and sharing more lodging image data with different varieties, at more growth stages, and at different geographic regions is important to develop robust crop-specific lodging detection models that can be used in agricultural production and breeding efforts.

Author Contributions

Conceptualization, Y.S.; methodology, B.Z., J.Z. and Y.S.; software, B.Z.; formal analysis, B.Z.; investigation, J.L.; resources, P.S.B. and V.B.; data curation, J.L.; writing—original draft preparation, B.Z.; writing—review and editing, J.L., P.S.B., V.B., Y.G., J.Z. and Y.S.; supervision, Y.S.; project administration, Y.S.; funding acquisition, J.Z. and Y.S. All authors have read and agreed to the published version of the manuscript.

Funding

This research was funded by the Wheat Innovation Foundation fund from the Agricultural Research Division of the University of Nebraska-Lincoln, and the funding supported by the Nebraska Agricultural Experiment Station through the Hatch Act capacity funding program (accession number 1011130) from the United States Department of Agriculture (USDA) National Institute of Food and Agriculture. Thanks for the short-term exchange scholarship (fund: 534-18001050610) from Huazhong Agricultural University, offering Biquan Zhao the opportunity to visit and to engage in academic exchange in University of Nebraska-Lincoln.

Acknowledgments

The authors would like to thank Arun-Narenthiran Veeranampalayam-Sivakumar for his efforts in aerial imagery collections.

Conflicts of Interest

The authors declare no conflict of interest.

References

  1. Du, M.; Noguchi, N. Monitoring of Wheat Growth Status and Mapping of Wheat Yield’s within-Field Spatial Variations Using Color Images Acquired from UAV-camera System. Remote Sens. 2017, 9, 289. [Google Scholar] [CrossRef] [Green Version]
  2. Food and Agricultural Organization of the United Nations (FAO). FAOSTAT Statistical Database. Crops. Available online: http://www.fao.org/faostat/en/?#data/QC (accessed on 27 August 2019).
  3. Berry, P.; Spink, J. Predicting yield losses caused by lodging in wheat. Field Crop. Res. 2012, 137, 19–26. [Google Scholar] [CrossRef]
  4. Foulkes, M.J.; Slafer, G.A.; Davies, W.J.; Berry, P.M.; Sylvester-Bradley, R.; Martre, P.; Calderini, D.F.; Griffiths, S.; Reynolds, M.P. Raising yield potential of wheat. III. Optimizing partitioning to grain while maintaining lodging resistance. J. Exp. Bot. 2010, 62, 469–486. [Google Scholar] [CrossRef] [PubMed] [Green Version]
  5. Peng, D.; Chen, X.; Yin, Y.; Lu, K.; Yang, W.; Tang, Y.; Wang, Z. Lodging resistance of winter wheat (Triticum aestivum L.): Lignin accumulation and its related enzymes activities due to the application of paclobutrazol or gibberellin acid. Field Crop. Res. 2014, 157, 1–7. [Google Scholar] [CrossRef]
  6. Pinthus, M.J. Lodging in wheat, barley, and oats: The phenomenon, its causes, and preventive measures. In Advances in Agronomy; Elsevier: Amsterdam, The Netherlands, 1974; Volume 25, pp. 209–263. ISBN 978-0-12-000725-7. [Google Scholar]
  7. Berry, P.M.; Sterling, M.; Spink, J.H.; Baker, C.J.; Sylvester-Bradley, R.; Mooney, S.J.; Tams, A.R.; Ennos, A.R. Understanding and Reducing Lodging in Cereals. In Advances in Agronomy; Elsevier: Amsterdam, The Netherlands, 2004; Volume 84, pp. 217–271. ISBN 978-0-12-000782-0. [Google Scholar]
  8. Tripathi, S.; Sayre, K.; Kaul, J.; Narang, R. Lodging behavior and yield potential of spring wheat (Triticum aestivum L.): Effects of ethephon and genotypes. Field Crop. Res. 2004, 87, 207–220. [Google Scholar] [CrossRef]
  9. Yang, H.; Chen, E.; Li, Z.; Zhao, C.; Yang, G.; Pignatti, S.; Casa, R.; Zhao, L. Wheat lodging monitoring using polarimetric index from RADARSAT-2 data. Int. J. Appl. Earth Obs. Geoinf. 2015, 34, 157–166. [Google Scholar] [CrossRef]
  10. Chauhan, S.; Darvishzadeh, R.; Lu, Y.; Stroppiana, D.; Boschetti, M.; Pepe, M.; Nelson, A. Wheat Lodging Assessment Using Multispectral Uav Data. ISPRS Int. Arch. Photogramm. Remote Sens. Spat. Inf. Sci. 2019, 235–240. [Google Scholar] [CrossRef] [Green Version]
  11. Shah, A.N.; Tanveer, M.; Rehman, A.U.; Anjum, S.A.; Iqbal, J.; Ahmad, R. Lodging stress in cereal–effects and management: An overview. Environ. Sci. Pollut. Res. 2017, 24, 5222–5237. [Google Scholar] [CrossRef]
  12. Berry, P.M.; Kendall, S.; Rutterford, Z.; Orford, S.; Griffiths, S. Historical analysis of the effects of breeding on the height of winter wheat (Triticum aestivum) and consequences for lodging. Euphytica 2014, 203, 375–383. [Google Scholar] [CrossRef]
  13. Piñera-Chavez, F.; Berry, P.; Foulkes, M.; Jesson, M.; Reynolds, M. Avoiding lodging in irrigated spring wheat. I. Stem and root structural requirements. Field Crop. Res. 2016, 196, 325–336. [Google Scholar] [CrossRef]
  14. Baker, C.; Berry, P.; Spink, J.; Sylvester-Bradley, R.; Griffin, J.; Scott, R.; Clare, R. A Method for the Assessment of the Risk of Wheat Lodging. J. Theor. Biol. 1998, 194, 587–603. [Google Scholar] [CrossRef]
  15. Sterling, M.; Baker, C.; Berry, P.; Wade, A. An experimental investigation of the lodging of wheat. Agric. For. Meteorol. 2003, 119, 149–165. [Google Scholar] [CrossRef]
  16. Prajapat, P.; Choudhary, R.; Jat, B.L. Studies on agro-chemicals for lodging management in wheat (Triticum aestivum L.) for higher productivity. Asian J. BIO Sci. 2017, 12, 134–155. [Google Scholar] [CrossRef]
  17. Zhang, M.; Wang, H.; Yi, Y.; Ding, J.; Zhu, M.; Li, C.; Guo, W.; Feng, C.; Zhu, X. Effect of nitrogen levels and nitrogen ratios on lodging resistance and yield potential of winter wheat (Triticum aestivum L.). PLoS ONE 2017, 12, e0187543. [Google Scholar] [CrossRef] [PubMed]
  18. Erickson, B.J.; Johannsen, C.J.; Vorst, J.J.; Biehl, L.L. Using Remote Sensing to Assess Stand Loss and Defoliation in Maize. Photogramm. Eng. Remote Sens. 2004, 70, 717–722. [Google Scholar] [CrossRef]
  19. Liu, W.; Huang, J.; Wei, C.; Wang, X.; Mansaray, L.R.; Han, J.; Zhang, D.; Chen, Y. Mapping water-logging damage on winter wheat at parcel level using high spatial resolution satellite data. ISPRS J. Photogramm. Remote Sens. 2018, 142, 243–256. [Google Scholar] [CrossRef]
  20. Peters, A.J.; Griffin, S.C.; Vina, A.; Ji, L. Use of Remotely Sensed Data for Assessing Crop Hail Damage. Photogramm. Eng. Remote Sens. 2000, 66, 1349–1355. [Google Scholar]
  21. Mirik, M.; Jones, D.C.; Price, J.; Workneh, F.; Ansley, R.J.; Rush, C.M. Satellite Remote Sensing of Wheat Infected by Wheat streak mosaic virus. Plant Dis. 2011, 95, 4–12. [Google Scholar] [CrossRef] [Green Version]
  22. Shi, Y.; Thomasson, J.A.; Murray, S.C.; Pugh, N.A.; Rooney, W.L.; Shafian, S.; Rajan, N.; Rouze, G.; Morgan, C.L.S.; Neely, H.L.; et al. Unmanned Aerial Vehicles for High-Throughput Phenotyping and Agronomic Research. PLoS ONE 2016, 11, e0159781. [Google Scholar] [CrossRef] [Green Version]
  23. Yang, G.; Liu, J.; Zhao, C.; Li, Z.; Huang, Y.; Yu, H.; Xu, B.; Yang, X.; Zhu, D.; Zhang, X.; et al. Unmanned Aerial Vehicle Remote Sensing for Field-Based Crop Phenotyping: Current Status and Perspectives. Front. Plant Sci. 2017, 8, 1111. [Google Scholar] [CrossRef]
  24. Liu, H.-Y.; Yang, G.J.; Zhu, H.-C. The Extraction of Wheat Lodging Area in UAV’s Image Used Spectral and Texture Features. Appl. Mech. Mater. 2014, 651, 2390–2393. [Google Scholar] [CrossRef]
  25. Mardanisamani, S.; Maleki, F.; Kassani, S.H.; Rajapaksa, S.; Duddu, H.; Wang, M.; Shirtliffe, S.; Ryu, S.; Josuttes, A.; Zhang, T.; et al. Crop Lodging Prediction From UAV-Acquired Images of Wheat and Canola Using a DCNN Augmented With Handcrafted Texture Features. arXiv 2019, arXiv:1906.07771. [Google Scholar]
  26. Rajapaksa, S.; Eramian, M.; Duddu, H.; Wang, M.; Shirtliffe, S.; Ryu, S.; Josuttes, A.; Zhang, T.; Vail, S.; Pozniak, C.; et al. Classification of Crop Lodging with Gray Level Co-occurrence Matrix. In Proceedings of the 2018 IEEE Winter Conference on Applications of Computer Vision (WACV), Lake Tahoe, NV, USA, 12–15 March 2018; pp. 251–258. [Google Scholar]
  27. Zhao, X.; Yuan, Y.; Song, M.; Ding, Y.; Lin, F.; Liang, D.; Zhang, D. Use of Unmanned Aerial Vehicle Imagery and Deep Learning UNet to Extract Rice Lodging. Sensors 2019, 19, 3859. [Google Scholar] [CrossRef] [PubMed] [Green Version]
  28. Maresma, Á.; Ariza, M.; Martínez, E.; Lloveras, J.; Casasnovas, J.A.M. Analysis of Vegetation Indices to Determine Nitrogen Application and Yield Prediction in Maize (Zea mays L.) from a Standard UAV Service. Remote Sens. 2016, 8, 973. [Google Scholar] [CrossRef] [Green Version]
  29. Zhou, X.; Zheng, H.; Xu, X.; He, J.; Ge, X.; Yao, X.; Cheng, T.; Zhu, Y.; Cao, W.; Tian, Y. Predicting grain yield in rice using multi-temporal vegetation indices from UAV-based multispectral and digital imagery. ISPRS J. Photogramm. Remote Sens. 2017, 130, 246–255. [Google Scholar] [CrossRef]
  30. Näsi, R.; Viljanen, N.; Kaivosoja, J.; Alhonoja, K.; Hakala, T.; Markelin, L.; Honkavaara, E. Estimating Biomass and Nitrogen Amount of Barley and Grass Using UAV and Aircraft Based Spectral and Photogrammetric 3D Features. Remote Sens. 2018, 10, 1082. [Google Scholar] [CrossRef] [Green Version]
  31. Jin, X.; Liu, S.; Baret, F.; Hemerlé, M.; Comar, A. Estimates of plant density of wheat crops at emergence from very low altitude UAV imagery. Remote Sens. Environ. 2017, 198, 105–114. [Google Scholar] [CrossRef] [Green Version]
  32. Li, Z.; Chen, Z.; Wang, L.; Liu, J.; Zhou, Q. Area extraction of maize lodging based on remote sensing by small unmanned aerial vehicle. Trans. Chin. Soc. Agric. Eng. 2014, 30, 207–213. [Google Scholar]
  33. Chu, T.; Starek, M.J.; Brewer, M.J.; Masiane, T.; Murray, S.C. UAS imaging for automated crop lodging detection: A case study over an experimental maize field. In SPIE Commercial + Scientific Sensing and Imaging; Thomasson, J.A., McKee, M., Moorhead, R.J., Eds.; Proc. SPIE: Anaheim, CA, USA, 2017; p. 102180E. [Google Scholar] [CrossRef]
  34. Kerkech, M.; Hafiane, A.; Canals, R. Deep leaning approach with colorimetric spaces and vegetation indices for vine diseases detection in UAV images. Comput. Electron. Agric. 2018, 155, 237–243. [Google Scholar] [CrossRef]
  35. Liu, Y.; Cen, C.; Che, Y.; Ke, R.; Ma, Y.; Ma, Y. Detection of Maize Tassels from UAV RGB Imagery with Faster R-CNN. Remote Sens. 2020, 12, 338. [Google Scholar] [CrossRef] [Green Version]
  36. Singh, A.; Ganapathysubramanian, B.; Singh, A.K.; Sarkar, S. Machine Learning for High-Throughput Stress Phenotyping in Plants. Trends Plant Sci. 2016, 21, 110–124. [Google Scholar] [CrossRef] [PubMed] [Green Version]
  37. Ubbens, J.R.; Stavness, I. Deep Plant Phenomics: A Deep Learning Platform for Complex Plant Phenotyping Tasks. Front. Plant Sci. 2017, 8, 1190. [Google Scholar] [CrossRef] [PubMed] [Green Version]
  38. Li, W.; Fu, H.; Yu, L.; Cracknell, A.P. Deep Learning Based Oil Palm Tree Detection and Counting for High-Resolution Remote Sensing Images. Remote Sens. 2016, 9, 22. [Google Scholar] [CrossRef] [Green Version]
  39. Lu, J.; Hu, J.; Zhao, G.; Mei, F.; Zhang, C. An in-field automatic wheat disease diagnosis system. Comput. Electron. Agric. 2017, 142, 369–379. [Google Scholar] [CrossRef] [Green Version]
  40. Yang, M.-D.; Tseng, H.-H.; Hsu, Y.-C.; Tsai, H.-P. Semantic Segmentation Using Deep Learning with Vegetation Indices for Rice Lodging Identification in Multi-date UAV Visible Images. Remote Sens. 2020, 12, 633. [Google Scholar] [CrossRef] [Green Version]
  41. Zhang, Z.; Flores, P.; Igathinathane, C.; Naik, D.L.; Kiran, R.; Ransom, J.K. Wheat Lodging Detection from UAS Imagery Using Machine Learning Algorithms. Remote Sens. 2020, 12, 1838. [Google Scholar] [CrossRef]
  42. Abadi, M.; Barham, P.; Chen, J.; Chen, Z.; Davis, A.; Dean, J.; Devin, M.; Ghemawat, S.; Irving, G.; Isard, M.; et al. TensorFlow: A system for large-scale machine learning. In Proceedings of the 12th USENIX Symposium on Operating Systems Design and Implementation (OSDI ’16), Savannah, GA, USA, 2–4 November 2016; Volume 21. [Google Scholar]
  43. Trimble Inc. Trimble Tutorial 7-Convolutional Neural Networks in eCognition; Trimble Inc.: Raunheim, Germany, 2017. [Google Scholar]
  44. Trimble Inc. Trimble eCognition Developer 9.3 Reference Book; Trimble Inc.: Raunheim, Germany, 2018. [Google Scholar]
  45. Csillik, O.; Cherbini, J.; Johnson, R.; Lyons, A.; Kelly, M. Identification of citrus trees from unmanned aerial vehicle imagery using convolutional neural networks. Drones 2018, 2, 39. [Google Scholar] [CrossRef] [Green Version]
  46. Timilsina, S.; Sharma, S.K.; Aryal, J. Mapping urban trees within cadastral parcels using an object-based convolutional neural network. ISPRS Ann. Photogramm. Remote Sens. Spat. Inf. Sci. 2019, 111–117. [Google Scholar] [CrossRef] [Green Version]
  47. Ghorbanzadeh, O.; Tiede, D.; Dabiri, Z.; Sudmanns, M.; Lang, S. Dwelling extraction in refugee camps using CNN–first experiences and lessons learnt. ISPRS Int. Arch. Photogramm. Remote Sens. Spat. Inf. Sci. 2018, 161–166. [Google Scholar] [CrossRef] [Green Version]
  48. Ghorbanzadeh, O.; Tiede, D.; Wendt, L.; Sudmanns, M.; Lang, S. Transferable instance segmentation of dwellings in a refugee camp-integrating CNN and OBIA. Eur. J. Remote Sens. 2020, 1–14. [Google Scholar] [CrossRef]
  49. Fawcett, T. An introduction to ROC analysis. Pattern Recognit. Lett. 2006, 27, 861–874. [Google Scholar] [CrossRef]
  50. Geng, J.; Xiao, L.; He, X.; Rao, X. Discrimination of clods and stones from potatoes using laser backscattering imaging technique. Comput. Electron. Agric. 2019, 160, 108–116. [Google Scholar] [CrossRef]
Figure 1. Study area and unmanned aerial vehicle system: (a) unmanned aerial vehicle (UAV) platform, (b) study area in Nebraska, (c) ortho-mosaic imagery at early grain filling stage, (d) ortho-mosaic imagery at physiological maturity.
Agronomy 10 01762 g001
Figure 2. Using the CNN algorithm to identify and classify lodging and non-lodging wheat at plots level.
Agronomy 10 01762 g002
Figure 3. Receiver operating characteristics (ROC) curves and areas under the curves (AUC) of three models (model_ grain filling, model_ physiological maturity, and model_ both) for the validation datasets.
Agronomy 10 01762 g003
Figure 4. Comparison of wheat lodging possibility maps derived from the three CNN models: (a) visualization of a plot at the early grain filling stage, (b) visualization of a plot at physiological maturity. RGB images are in first column. The second to fourth columns are the probability maps of lodging in which the value closer to 1 was brighter and represented higher possibility of lodged wheat, while the value closer to 0 was darker and represented higher possibility of non-lodged wheat. The fifth column are classified maps from the probability maps of lodged wheat in the fourth column, using the threshold of 0.7.
Agronomy 10 01762 g004
Table 1. The source of training samples and testing imagery of the three convolutional neural network (CNN) models.
Trained (Validated) by Images fromTested on Imagery at
1Model_ grain fillingearly grain filling stageboth early grain filling stage and physiological maturity
2Model_ physiological maturityphysiological maturityboth early grain filling stage and physiological maturity
3Model_ bothboth early grain filling stage and physiological maturityboth early grain filling stage and physiological maturity
Table 2. Performance evaluation and comparison with confusion matrices based on pixel counting, and Precision, Recall, F1-score, overall accuracies (OA) and kappa coefficient (Kc) of the three models.
PredictedPrecisionRecallF1-ScoreOAKc
LodgingNon-Lodging(%)(%)(%)(%)
Model_ grain filling and tested at early grain filling stage
ActualLodging56342632865371.7963.1667.2090.220.61
Non-lodging2214304508971
Model_ grain filling and tested at physiological maturity
Lodging56985054959.4199.0417.1814.410.01
Non-lodging5487168354986
Model_ physiological maturity and tested at early grain filling stage
Lodging32018014704730.0368.5341.7984.130.32
Non-lodging7450324410221
Model_ physiological maturity and tested at physiological maturity
Lodging58817232023849.5464.7556.1385.670.48
Non-lodging5990884908403
Model_ both and tested at early grain filling stage
Lodging62032027175965.9669.5467.7089.470.61
Non-lodging3201804410221
Model_ both and tested at physiological maturity
Lodging48849241991862.9653.7758.0188.980.52
Non-lodging2873245220167
Note: model_ grain filling is the model trained only by the data from the early grain filling stage; model_ physiological maturity is the model trained only by the data from physiological maturity; model_ both is the model trained by the data from both the early grain filling stage and physiological maturity.
Table 3. Intersection over union (IoU) of lodging detection for three models.
IoU of
Lodging Class
Model_ grain filling Model_
physiological maturity
Model_ both Model_ grain filling Model_
physiological maturity
Model_ both
Tested at Early Grain Filling StageTested at Physiological Maturity
Plots in Figure 40.470.550.470.450.590.59
All test plots0.510.260.510.090.390.41
Note: model_ early grain filling is the model trained only by the data from the early grain filling stage; model_ physiological maturity is the model trained only by the data from physiological maturity; model_ both is the model trained by the data from both the early grain filling stage and physiological maturity.
Publisher’s Note: MDPI stays neutral with regard to jurisdictional claims in published maps and institutional affiliations.

