Article

Comparison of the Yield and Chemical Composition of Eleven Timothy (Phleum pratense L.) Genotypes under Three Locations in Poland

1
Department of Agroecology and Plant Production, University of Agriculture in Kraków, Mickiewicza 21, 31-120 Kraków, Poland
2
Department of Mathematical and Statistical Methods, Poznań University of Life Sciences, Wojska Polskiego 28, 60-637 Poznań, Poland
3
Department of Genetics, Plant Breeding and Seed Production, Wrocław University of Environmental and Life Sciences, Grunwaldzki 24A, 53-363 Wrocław, Poland
4
Małopolska Plant Breeding, Plant Breeding Station in Polanowice, Polanowice 122, 32-090 Słomniki, Poland
5
Institute of Mathematics, Poznań University of Technology, Piotrowo 3A, 60-965 Poznań, Poland
6
Department of Cattle Breeding, National Research Institute of Animal Production, Krakowska 1, 32-083 Balice, Poland
7
Department of Agroecology and Plant Production, Wrocław University of Environmental and Life Sciences, Grunwaldzki 24A, 50-363 Wrocław, Poland
*
Author to whom correspondence should be addressed.
These authors contributed equally to this work.
Agronomy 2020, 10(11), 1743; https://doi.org/10.3390/agronomy10111743
Submission received: 2 October 2020 / Revised: 28 October 2020 / Accepted: 4 November 2020 / Published: 9 November 2020
(This article belongs to the Section Crop Breeding and Genetics)

Abstract

:
Field trials were conducted in the years 2017–2019 at the Małopolska Plant Breeding in the Plant Breeding Stations in Polanowice, Nieznanice and Palikije. The trials were designed to determine the yield of some timothy genotypes in the context of chemical composition under different habitat conditions. The present evaluation of the strain quality shows a high potential for breeding. The analyzed genotypes produced high dry matter yields, which differed by as much as 53%. The experimental plots also differed in the crude protein content, which varied from 104.5 to 230.1 g kg−1 d.m., depending on the crop and year of harvest. For crude fiber, these values ranged from 173.9 to 274.8 g kg−1 d.m., depending on the crop and harvest year. The analysis of the mineral composition also revealed significant large variation.

1. Introduction

Timothy (Phleum pratense L.) is a commonly grown species in cool and damp regions of the world, including north-eastern and north-western North America, Nordic countries, Russia and Japan [1,2]. It is a basic component of almost every seed mixture for meadows and pastures. It grows best in moist and tight soils. The species has low soil requirements except for adequate moisture, which is why it responds well to irrigation during the growth period. At the same time, it is characterized by moderate resistance to treading. The main limitation to timothy cultivation is the shallow root system and, consequently, its low resistance to drought. Timothy is characterized by good winter hardiness and high feed value, but harvest dates must be observed because timothy shows large protein losses after fading. The nutritive value of timothy can also be enhanced through breeding.
Improving the nutritive value of forage grasses is the objective of many breeding works. The main criterion in the selective breeding of timothy is to increase the yield, but it is fairly difficult to considerably improve the yield through breeding [3]. There are many research studies confirming an inverse relationship between dry matter yield and nutritive value [4,5,6]. Therefore, it was found that breeding work whose aim is to increase dry matter yield may reduce its nutritive value.
The negative relationship between nutritive value and dry matter yield is well documented [2]. It often follows from this relationship that any factors increasing dry matter yield will most probably decrease the nutritive value, and, conversely, factors that reduce dry matter yield may increase the nutritive value. The negative correlation between nutritive value parameters and dry matter yield indicates that cultivars with a higher dry matter yield may be of a lower nutritive value. In order to improve both dry matter yield and nutritive value, it is necessary to identify genotypes that are characterized by a weaker negative correlation between their dry matter yield and nutritive value. Brégard et al. [7] and Claessens et al. [8,9] identified genotypes with a high yielding potential and high nutritive value. However, there are still no timothy cultivars that show improvements in both feed yield and nutritive value, and further research is needed to incorporate this genetic variation into commercial varieties. The principal aim of timothy breeding is to combine high yields, good winter survival and high feed quality. Varietal breeding of timothy is based on the phenotypic selection of individual plants, followed by progeny testing and selecting best parents.
The aims of this study were: (1) to determine differences between timothy strains and cultivars in dry matter yield, jointly with the content of crude protein, crude fiber and macronutrients under diverse habitat conditions and (2) to analyze genotype-by-environment interaction for observed quantitative traits.

2. Materials and Methods

2.1. Experimental Field

Field trials were conducted in the years 2017–2019 at the Małopolska Plant Breeding in the Plant Breeding Stations in Polanowice (50°20′ N, 20°08′ E), Nieznanice (50°91′ N, 19°31′ E) and Palikije (51°23′ N, 22°31′ E). The soil conditions are presented in Table 1.
The trial was set up in a randomized block design with three replications (1 × 10.0 m2 plots), and involved the standard cultivar Karta, the accompanying cultivars Skald, Egida, Emma, Skala and Skaut, and five strains: POB-TT1, POB-TT2 POB-TT3, POB-T-100 and POB-T-107.
The trials were set up in different stations in mid-May of 2017. The seeding rate was 10 kg ha−1. In the autumn, phosphate fertilizers were applied at a rate of 26–35 kg P ha−1 as enriched superphosphate and potassium fertilizers at a rate of 66–83 kg K ha−1 in the form of potassium salt. Nitrogen fertilization was applied before sowing at a rate of 80 kg N ha−1 in the form of ammonium nitrate.
In the years of full use, the following fertilization was applied: 80 kg N·ha−1 in spring, 60 kg N·ha−1 after the second cut, and 40 kg N·ha−1 after the third cut in the form of ammonium nitrate; phosphorus once in spring at a rate of 26–52 P·ha−1 in the form of enriched superphosphate; and potassium at 42–58 kg K·ha−1 as 57% in the form of potassium salt in spring and at 42–58 kg K·ha−1 after the first cut.
After drying and grinding, the weighted averages of the plant samples were analyzed for total Kjeldahl nitrogen, and for crude fiber according to Van Soest. The determination of mineral compounds contents, i.e., of calcium, of magnesium, of potassium and of sodium, was carried out by means of the validated Atomic Absorption Spectrometry method with the atomization in the flame Fast Sequential Atomic Absorption (Varian AA240FS Varian Inc., Palo Alto, Santa Clara, CA, USA) according to the norm PN-EN 15505:2009 standard. The total phosphorus content was established based on UV-VIS spectrophotometry and staining with ammonium monovanadate (V) and ammonium heptomolybdate, following the sample mineralization as described in PN-ISO 13730:1999 standard [10].

2.2. Statistical Analysis

Firstly, the normality of the distributions of the studied traits (dry matter yield, crude protein, crude fiber, phosphorus, potassium, calcium, magnesium and sodium) were tested using the Shapiro-Wilk’s normality test [11]. A multivariate analysis of variance (MANOVA) was performed on the basis of the following model using a procedure MANOVA in GenStat 18th edition: Y = XT + E, where: Y is the (n × p)-dimensional matrix of observations, n is the number of all observations, p is the number of traits (p = 8), X is the (n × k)-dimensional matrix of design, k is the number of genotypes (k = 11), T is the (k × p)-dimensional matrix of unknown effects, and E is the (n × p)-dimensional matrix of residuals. Next, a four-way analysis of variance (ANOVA) was carried out to determine the effects of the years, locations, genotypes and cuts as well as all interactions on the variability of the traits studied. The arithmetical means of the traits and standard deviations were calculated. Moreover, the Fisher’s least significant differences (LSDs) were also estimated at the significance level α = 0.05. The relationships between the observed traits were assessed on the basis of the Pearson’s correlation coefficients, using FCORRELATION procedure in the GenStat 18th edition for each cut independently. The results were also analyzed by means of multivariate methods. The canonical variate analysis was applied in order to present a multitrait assessment of the similarity of the tested genotypes in a lower number of dimensions with the least possible loss of information [12]. This makes it possible to illustrate variation in the genotypes in terms of all observed traits in the graphic form. The Mahalanobis distance was suggested as a measure of “polytrait” genotypes similarity [13], whose significance was verified by means of the critical value Dα called “the least significant distance” [14]. The Mahalanobis distances were calculated for the genotypes in each cut independently as well as for all environmental data jointly. All of the analyses were conducted using the GenStat v. 18 statistical software package [15].

3. Results

3.1. Weather Conditions

The total annual precipitation during the study period (2017–2019) ranged from 428.1 to 734.5 mm. The average total precipitation during the growth period (April–September) was in the 263.2–534.0 mm range. The average annual temperature ranged from 6.1 to 10.9 °C during the study years, and from 12.1 to 17.9 °C between April and September (Table S1).

3.2. Yield Assessment

All studied traits have a normal distribution as well as a multivariate normality. The results of MANOVA indicate that the years (Wilk’s λ = 0.1269; F1;396 = 334.55; p < 0.0001), locations (Wilk’s λ = 0.0080; F2;396 = 496.30; p < 0.0001), genotypes (Wilk’s λ = 0.0127; F10;396 = 30.67; p < 0.0001) and cuts (Wilk’s λ = 0.0026; F2;396 = 903.69; p < 0.0001) were significantly different for all eight traits. Moreover, the interactions year × location, location × genotype, year × cut, location × cut, genotype × cut, year × location × cut and location × genotype × cut were significant. However, the interactions year × genotype, year × location × genotype, year × genotype × cut and year × location × genotype × cut were not statistically significant. The analysis of variance indicated that the main effects of the locations, genotypes and cuts were significant for all eight traits of the study (Table S2). The main effects of the year were significant for seven traits (except potassium). The year × genotype × cut interaction was not significant for all of the eight observed traits (Table S2).
The dry matter yields ranged from 0.86 to 8.51 t·ha−1 according to the treatment applied and were significantly different (Table S3). Higher yields were obtained at the first harvest date and were around 60% of the second and third cut. Out of the analyzed genotypes, the dry matter yields were highest for the Skald cultivar and the lowest for the Karta cultivar (Table S3).

3.3. Quality Analysis

The highest crude protein concentration (194.2 g kg−1 d.m.) was noted in the third cut of timothy cultivar Karta in 2019 in Nieznanice (Table S4). The different concentrations were due, among other things, to different weather conditions. In the years with a higher temperature (2018—second year of study) timothy contained more crude protein. The cultivar analysis showed that the protein concentrations were the highest in cultivar Skala and strain POB-T-107, and the lowest in cultivar Egida. As regards the harvest date, the crude protein concentration was the lowest in the first cut and the highest in the second cut.
As regards crude fiber, our study found significant differences according to the treatment factors. The well-known rule about the inverse protein and fiber concentrations in grass plants was not always proven/true. The crude fiber was found the lowest in the plants of the third cut (204.9 g·kg−1), and significantly higher in the first (260.2 g kg−1) and the second cut (253.7 g kg−1).
The mineral content of the analyzed samples showed differences (Table S5). The average weighted content of macronutrients was in the following ranges: 1.91–3.14 g for P; 17.86–32.52 g for K; 3.49–9.13 g for Ca; 1.01–3.72 g for Mg; 0.03–0.31 g for Na kg−1 d.m.

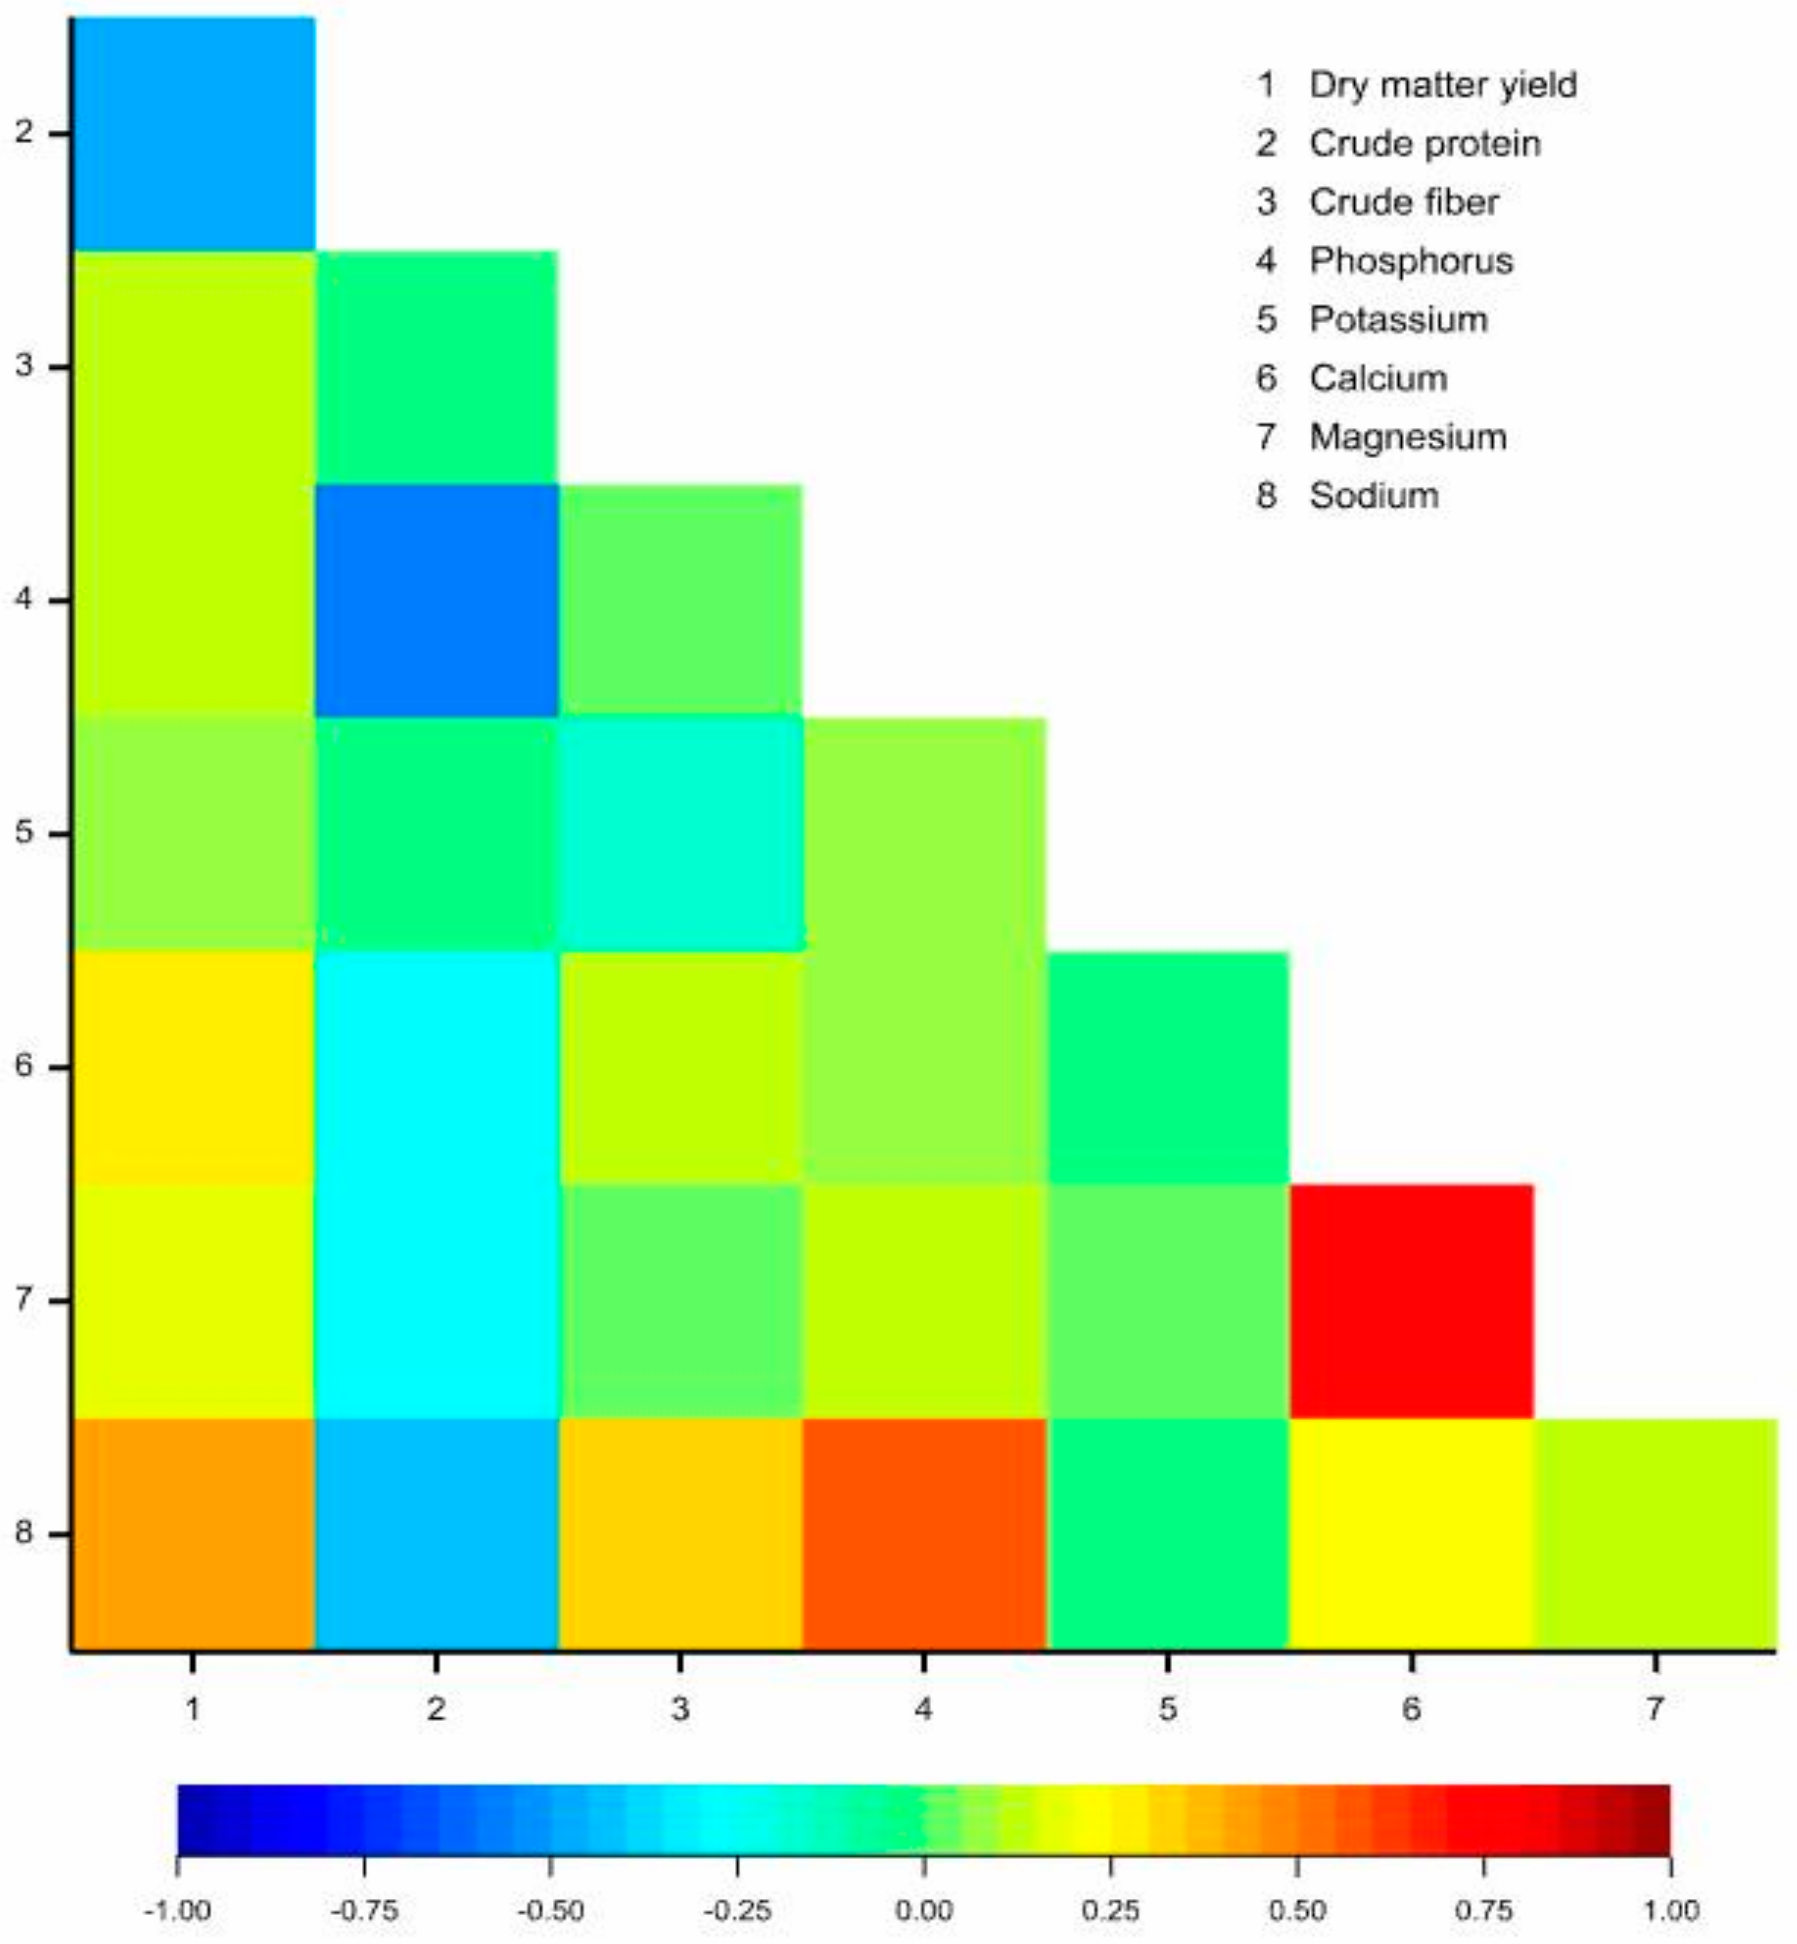
3.4. Correlations between Observed Traits

The crude protein was negatively correlated with phosphorus and sodium in all three cuts (Table 2, Figure 1, Figure 2 and Figure 3). Sodium was positively correlated with crude fiber and phosphorus as well as magnesium with calcium in all three cuts (Table 2). The dry matter yield was correlated with crude protein in all three cuts. While it was negatively correlated in the first (Figure 1) and the third (Figure 3) cuts, the correlation in the second (Figure 2) cut was positeve. The correlation coefficients were not statistically significant in all three cuts for: potassium and dry matter yield, potassium and crude protein, potassium and phosphorus, calcium and crude fiber, magnesium and crude fiber, magnesium and phosphorus as well as magnesium and potassium (Table 2). Additionally, we observed some correlations in two cuts or in only one cut (Table 2).

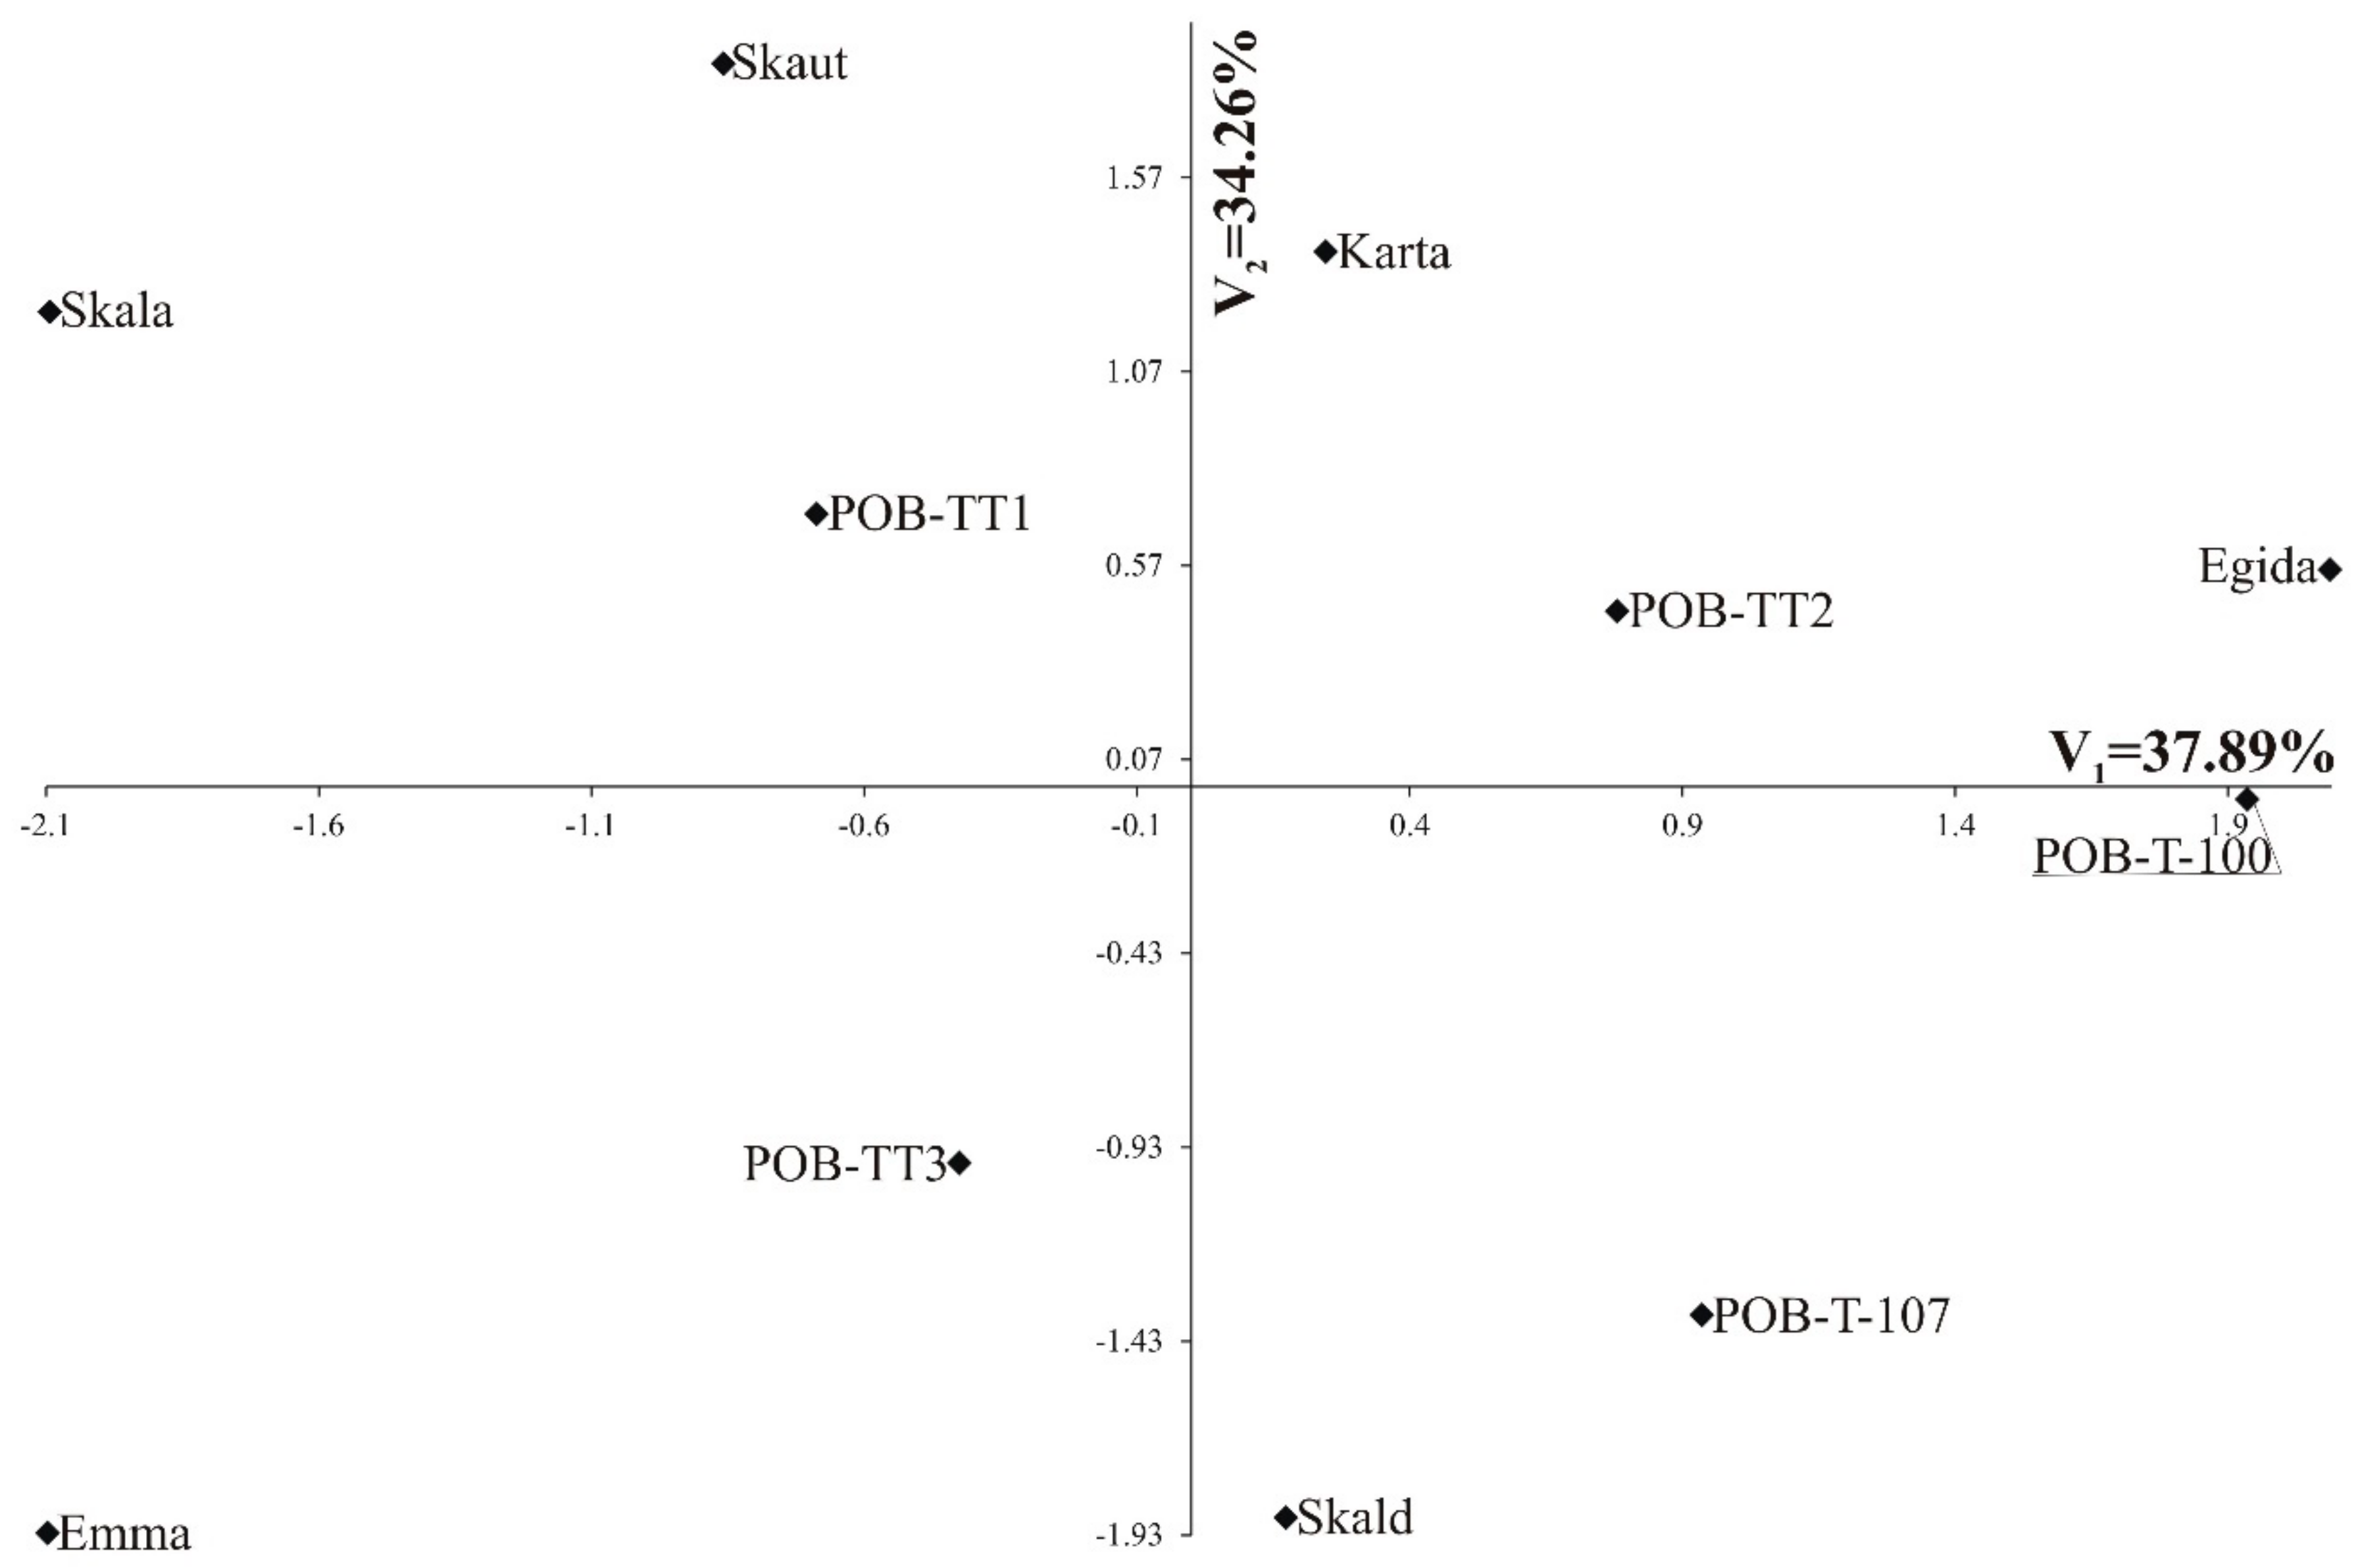
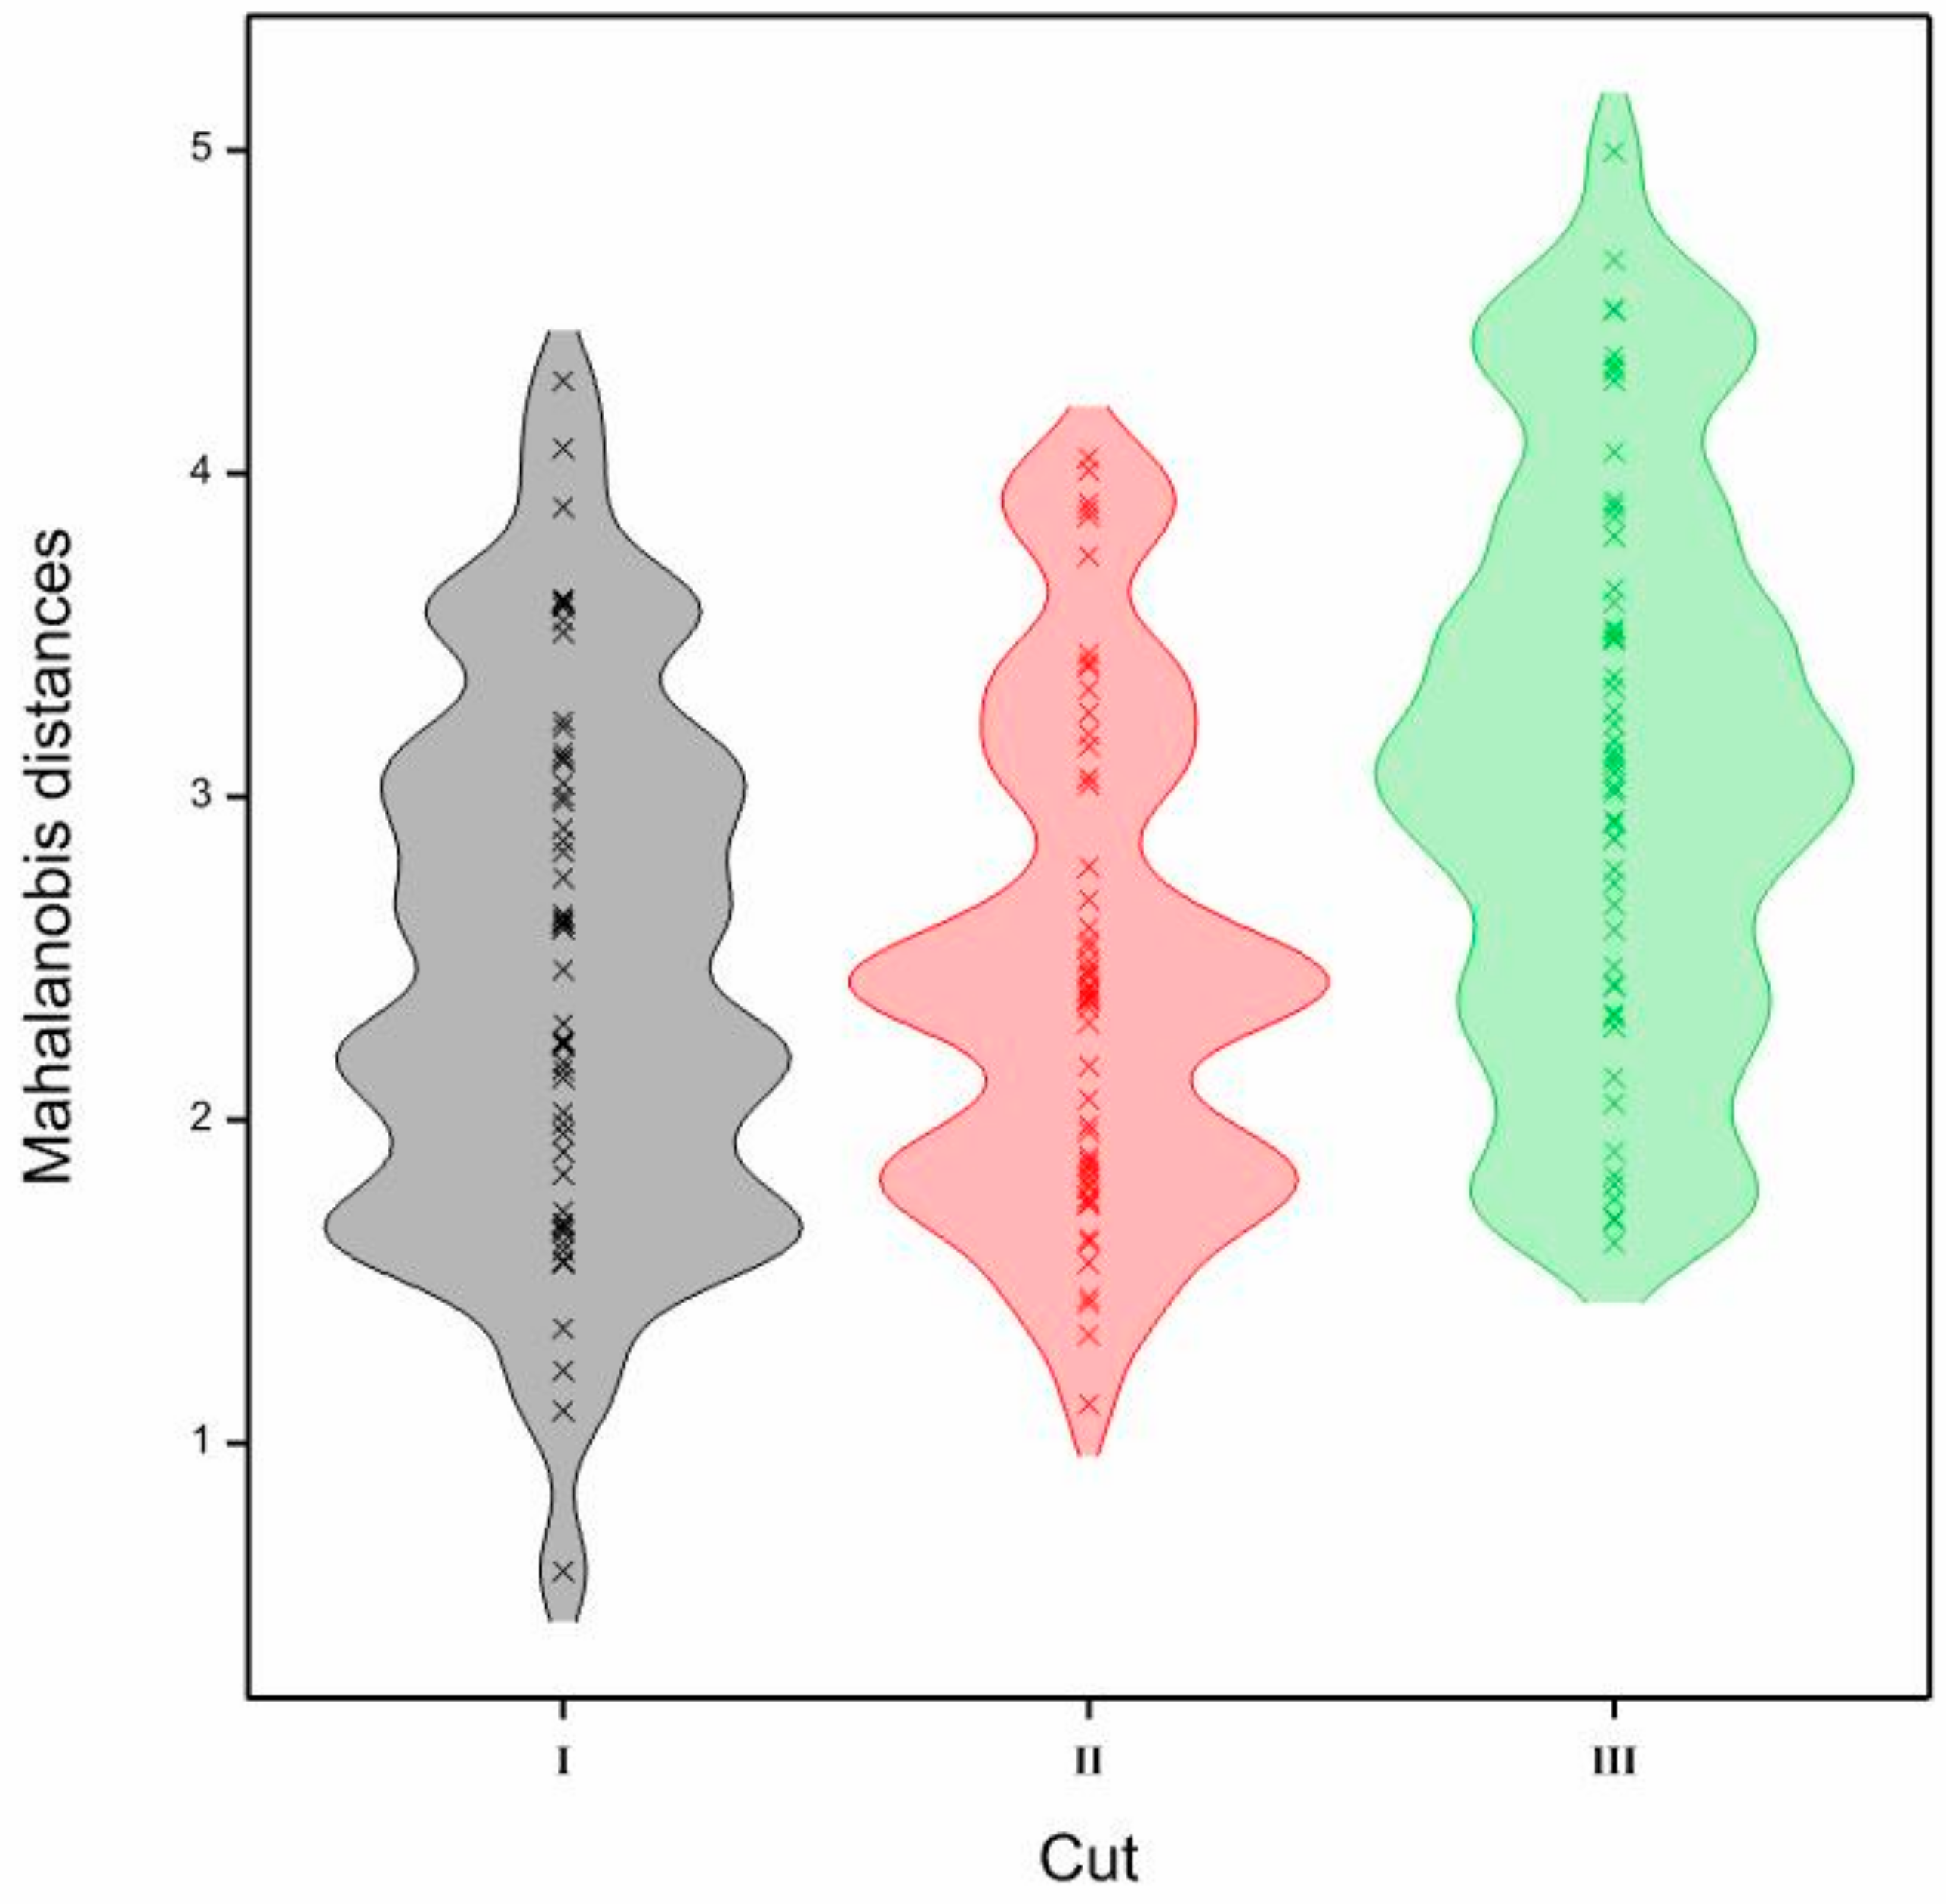
3.5. Multivariate Relationships

Particular traits are characterized by a different degree of significance and a different extent of contribution to the overall multi-trait variability. The multi-trait variability analysis includes identification of the most important traits in the objects’ multi-trait variability. A statistical tool which helps solve this problem is the canonical variable analysis. The results of the analysis for the analyzed cultivars are presented in Table 3. The multidimensional analysis of the tested traits compared 11 genotypes with respect to eight traits simultaneously in particular cuts independently (Figure 4, Figure 5 and Figure 6). The first and second canonical varieties in the first cut elucidated 46.63% and 31.23%, respectively, of the multivariate variability of genotypes (Figure 4). Figure 4 shows the variability of the analyzed traits in the configuration of the first two canonical variables in the first cut. On the graph, the coordinates of the point for particular genotypes are values of the first and second canonical variables, respectively. The most significant linear relation with the first canonical variable was observed for: calcium, magnesium and sodium. However, the most significant linear relation with the second canonical variable was observed for: dry matter yield, phosphorus, calcium (positive correlation) and potassium (negative correlations) (Table 3). The largest difference with regard to all eight traits in the first cut (measured in the Mahalanobis distances) was recorded for genotypes POB-T-100 and Emma (the Mahalanobis distance between them was 4.288). The largest similarities were recorded for POB-TT1 and POB-TT2 (0.604) (Table 4). The first and second canonical varieties in the second cut elucidated 53.44% and 21.89%, respectively, of the multivariate variability of genotypes (Figure 5). The most positive significant linear relation with the first canonical variable was observed for calcium and magnesium but a negative one between the second canonical variable and potassium (Table 3). The largest difference with regard to all eight traits in cut II was recorded for cultivars Skald and Skala (4.049). The largest similarities were recorded for POB-TT1 and POB-TT2 (1.121) (Table 4). The first and second canonical varieties in cut III elucidated 37.89% and 34.26%, respectively, of the multivariate variability of genotypes (Figure 6). The first canonical variable was correlated with crude fiber. However, the second canonical variable was correlated with calcium and magnesium (Table 3). The largest difference with regard to all eight traits in cut III was recorded for cultivars Egida and Emma (4.996). The largest similarities were recorded for cultivars Skaut and Karta (1.620) (Table 4). The density plots of the values of the Mahalanobis distances classified by the cuts were presented in Figure 7 The phenotypic diversity (measured by the Mahalanobis distances) was positively correlated to a significant degree in cuts: 1st and 2nd (r = 0.4632, p < 0.001), 1st and 3rd (r = 0.6269, p < 0.001), and 2nd and 3rd (r = 0.4892, p < 0.001) (Figure 7).

4. Discussion

A very important property of forage grasses is their ability to give stable and high dry matter yield, crude protein, phosphorus, potassium, calcium, magnesium and sodium as well as low crude fiber. A good dry matter yield in the particular environments of study can be explained by an excellent regrowth of this grass species after cuttings and a good drought resistance. The dry matter yield of the grasses increases with time up to a certain level, while their crude protein content and digestibility reach the maximum very early in the growth period and then decrease with time. The rate of decline in digestibility with time varies a great deal and is dependent on many factors, of which temperature is most important. In a literature review for timothy, based on 69 experimental years from different countries, the daily decline of digestibility varied between 0.25 and 0.69 per cent units day−1 [16]. Many other studies published afterwards gave results within this range [5,17].
Michaud et al. [18] did not find a significant correlation between protein and dry matter yield. The correlation among the progeny tests showed that open-pollinated and selfed progeny tests agreed for all characters, except for harvest index, while the correlation between polycross and selfed tests were significant for six characters but not dry matter yield, and acid and neutral detergent fibers [19].
Raw fiber content of timothy plants varied significantly across harvests. Jankowski and Jodełka [20] suggested that high temperature might increase it. This was confirmed in the present experiment, with the highest raw fiber content in the plants of the first and second harvests as a consequence of high temperatures in June and July.
To a large extent, the interaction between phenotypes and growing seasons affected this content, thus reflecting difficult meteorological conditions throughout the experiment. The results clearly indicated that there was a need for further research into the possibility of replacing less resistant old varieties with new ones of higher quality, which can be of great importance in agricultural production.
According to the available feeding recommendations, a good-quality feed on dry matter basis should contain at least 3.0 g of P; 17–20 g of K; 7.0 g of Ca; 2.0 g of Mg; and 1.5–2.5 g of Na kg−1 d.m. [21]. In our study, the content of phosphorus, calcium and sodium in all of the tested samples was low and below optimal values.
Individual traits are of different importance and have a different share in the joint multivariate variation. A study on the multivariate variation for treatments also includes the identification of the most important traits in the multivariate variation of treatments. The canonical variables analysis (CVA) is a statistical tool making it possible to solve this problem [22,23,24]. The results of the CVA for the investigated treatments are presented in Table 3. The presented multivariate characteristic of the behavior of the analyzed treatments is a convincing illustration of this aspect. In this way, the efficiency of the canonical variables analysis was shown. This results from the fact that these variables explained a considerable part of the total variation (77.86%, 75.33% and 72.15% for cuts I, II and III, respectively). Thus, this is a reliable method, which may be confirmed by its extensive application by breeders and geneticists [25,26,27,28,29,30].
Phenotypic and other observations must be made in close connection with actual breeding goals. A selection index should be developed to choose the best genetic material for new cultivars and for further breeding [31].

5. Future Breeding Strategies

Essential knowledge about timothy should be elaborated. Therefore, laboratory techniques and conventional breeding methods should be combined. Additionally, breeding populations should be created for international geographic regions and for management systems. It is also advised to develop selection indices to improve the choice of genetic material for further breeding work.

6. Conclusions

On the basis of the results, it can be concluded that the meteorological and habitat conditions contributed significantly to the differences between the cultivars and strains. Thus, the total protein content of plants was affected by air humidity. Lower humidity increased total protein content in grass, and phosphorus content was favourably affected by lower temperatures. Magnesium content was the only parameter not affected by water conditions. Based on the long-term observations reflected in a statistically significant genotype by the environment interaction, it was concluded that detailed observations must be continued to identify valuable strains. Agronomic characteristics are of particular importance in timothy breeding programmes. The content of organic ingredients and minerals in the dry matter of the timothy strains and cultivars studied in the experiment reflects their high value as a feed.

Supplementary Materials

The following are available online at https://www.mdpi.com/2073-4395/10/11/1743/s1, Table S1: Meteorological conditions (monthly precipitation and average annual temperature) in Polanowice, Nieznanice and Palikije during 2017, 2018 and 2019. (In parentheses are presented minimum and maximum air temperature values), Table S2: Mean squares from four-way analysis of variance for eight observed traits, Table S3: Mean values and standard deviations (s.d.) for dry matter yield [t ha−1], Table S4: Mean values and standard deviations (s.d.) for organic ingredients: crude protein and crude fiber [g kg−1 d.m.], Table S5: Mean values and standard deviations (s.d.) for minerals-mean content of macroelements [g kg−1 d.m.]: phosphorus, potassium, calcium, magnesium and sodium.

Author Contributions

Conceptualization, A.R., J.B., E.B. and I.R.; methodology, A.R., E.P., J.B. and K.N.; software, J.B. and K.N.; validation, J.B.; formal analysis, J.B. and K.N.; investigation, A.R. and I.R.; resources, A.R. and J.B.; data curation, A.R. and J.B.; writing—original draft preparation, A.R. and J.B.; writing—review and editing, A.R., J.B., K.N., E.B. and K.W.; visualization, J.B. and K.N.; supervision, A.R. and J.B. All authors have read and agreed to the published version of the manuscript.

Funding

This paper is co-financed by the project: Innovative methods of cattle breeding in order to obtain the best quality beef from the Lower Silesia region (B130/0005/19).

Conflicts of Interest

The authors declare no conflict of interest.

References

  1. Larsen, A. Breeding winter hardy grasses. Euphytica 1994, 77, 231–237. [Google Scholar] [CrossRef]
  2. Bélanger, G.; Michaud, R.; Jefferson, P.G.; Tremblay, G.F.; Brégard, A. Improving the nutritive value of timothy through management and breeding. Can. J. Plant Sci. 2001, 81, 577–585. [Google Scholar] [CrossRef]
  3. Berg, C.C.; McElroy, A.R.; Kunelius, H.T. Timothy. In Cool-Season Forage Grasses; Moser, L.E., Buxton, D.R., Casler, M.D., Eds.; ASA: Brooklyn, NY, USA; CSSA: Hong Kong; SSSA: Madison, WI, USA, 1996; pp. 643–664. [Google Scholar]
  4. Bélanger, G.; McQueen, R.E. Digestibility and cell wall concentration of early- and late-maturing timothy (Phleum pratense L.) cultivars. Can. J. Plant Sci. 1996, 76, 107–112. [Google Scholar] [CrossRef] [Green Version]
  5. Bélanger, G.; McQueen, R.E. Analysis of the nutritive value of timothy grown with varying N nutrition. Grass Forage Sci. 1998, 53, 109–119. [Google Scholar] [CrossRef]
  6. Casler, M.D.; Vogel, K.P. Accomplishments and impact from breeding for increased forage nutritional value. Crop Sci. 1999, 39, 12–20. [Google Scholar] [CrossRef] [Green Version]
  7. Brégard, A.; Bélanger, G.; Michaud, R.; Tremblay, G.F. Biomass partitioning, forage nutritive value, and yield of contrasting genotypes of timothy. Crop Sci. 2001, 41, 1212–1219. [Google Scholar] [CrossRef]
  8. Claessens, A.; Michaud, R.; Bélanger, G.; Mather, D.E. Responses to divergent phenotypic selection for fiber traits in timothy. Crop Sci. 2005, 45, 1017–1022. [Google Scholar] [CrossRef]
  9. Claessens, A.; Michaud, R.; Bélanger, G.; Mather, D.E. Leaf and stem characteristics of timothy plants divergently selected for the ration of lignin to cellulose. Crop Sci. 2005, 45, 2425–2429. [Google Scholar] [CrossRef]
  10. AOAC. Official Methods of Analysis, 18th ed.; Association of Official Analytical Chemists: Arlington, VA, USA, 2006. [Google Scholar]
  11. Shapiro, S.S.; Wilk, M.B. An analysis of variance test for normality (complete samples). Biometrika 1965, 52, 591–611. [Google Scholar] [CrossRef]
  12. Rencher, A.C. Interpretation of canonical discriminant functions, canonical variates, and principal components. Am. Stat. 1992, 46, 217–225. [Google Scholar]
  13. Seidler-Łożykowska, K.; Bocianowski, J. Evaluation of variability of morphological traits of selected caraway (Carum carvi L.) genotypes. Ind. Crops Prod. 2012, 35, 140–145. [Google Scholar] [CrossRef]
  14. Mahalanobis, P.C. On the generalized distance in statistics. Proc. Natl. Inst. Sci. India 1936, 12, 49–55. [Google Scholar]
  15. Genstat, 18th ed.; v.18.2.0.18409; VSN International Ltd.: Hemel Hempstead, UK, 2016.
  16. Thorvaldsson, G.; Andersson, S. Variations in timothy dry matter yield and nutritional value as affected by harvest date, nitrogen fertilization, year and location in Northern Sweden. Acta Agric. Scand. 1986, 36, 367–385. [Google Scholar] [CrossRef]
  17. Thorvaldsson, G.; Björnsson, H. The effects of weather on growth, crude protein and digestibility of some grass species in Iceland. Icel. Agric. Sci. 1990, 4, 19–36. [Google Scholar]
  18. Michaud, R.; Tremblay, G.F.; Bélanger, G. Protein fractions and N fertilization in timothy. Czech J. Genet. Plant Breed. 2003, 39, 279–281. [Google Scholar]
  19. De Araüjo, M.R.A.; Coulman, B.E.; Rakow, G. Genetic variation, heritability and progeny testing in meadow bromegrass. Plant Breed. 2002, 121, 417–424. [Google Scholar] [CrossRef]
  20. Jankowski, K.; Jodełka, J. Analysis of the impact of climatic factors on the yield and nutritional value of four legume-grass mixtures. Sci. Noteb. Siedlce Agric. 2000, 57, 93–101. [Google Scholar]
  21. Falkowski, M.; Kukułka, I.; Kozłowski, S. Chemical Properties of Meadow Plants; Academy of Agriculture Poznań: Poznań, Poland, 2000; p. 132. [Google Scholar]
  22. Lahuta, L.B.; Ciak, M.; Rybiński, W.; Bocianowski, J.; Börner, A. Diversity of the composition and content of soluble carbohydrates in seeds of the genus Vicia (Leguminosae). Genet. Resour. Crop Eviron. 2018, 65, 541–554. [Google Scholar] [CrossRef] [Green Version]
  23. Niemann, J.; Bocianowski, J.; Wojciechowski, A. Effects of genotype and environment on seed quality traits variability in interspecific cross-derived Brassica lines. Euphytica 2018, 214, 193. [Google Scholar] [CrossRef] [Green Version]
  24. Bocianowski, J.; Majchrzak, L. Analysis of effects of cover crop and tillage method combinations on the phenotypic traits of spring wheat (Triticum aestivum L.) using multivariate methods. Appl. Ecol. Environ. Res. 2019, 17, 15267–15276. [Google Scholar] [CrossRef]
  25. Shamsuddin, A.K.M. Genetic diversity in relation to heterosis and combining ability in spring wheat. Theor. Appl. Genet. 1985, 70, 306–308. [Google Scholar] [CrossRef] [PubMed]
  26. Seidler-Łożykowska, K.; Bocianowski, J.; Król, D. The evaluation of the variability of morphological and chemical traits of the selected lemon balm (Melissa officinalis L.) genotypes. Ind. Crops Prod. 2013, 49, 515–520. [Google Scholar] [CrossRef]
  27. Nowosad, K.; Liersch, A.; Popławska, W.; Bocianowski, J. Genotype by environment interaction for seed yield in rapeseed (Brassica napus L.) using additive main effects and multiplicative interaction model. Euphytica 2016, 208, 187–194. [Google Scholar] [CrossRef]
  28. Bocianowski, J.; Nowosad, K.; Szulc, P. Soil tillage methods by years interaction for harvest index of maize (Zea mays L.) using additive main effects and multiplicative interaction model. Acta Agric. Scand. Sect. B 2019, 69, 75–81. [Google Scholar] [CrossRef]
  29. Bocianowski, J.; Szulc, P.; Nowosad, K. Soil tillage methods by years interaction for dry matter of plant yield of maize (Zea mays L.) using additive main effects and multiplicative interaction model. J. Integr. Agric. 2018, 17, 2836–2839. [Google Scholar] [CrossRef] [Green Version]
  30. Wrońska-Pilarek, D.; Szkudlarz, P.; Bocianowski, J. Systematic importance of morphological features of pollen grains of species from Erica (Ericaceae) genus. PLoS ONE 2018, 13, e0204557. [Google Scholar] [CrossRef]
  31. Bocianowski, J.; Nowosad, K.; Bujak, H.; Łuczkiewicz, T.; Piesik, D. Evaluation of the breeding value of the spring oilseed rape (Brassica napus L.) inbred lines based on a multi-trait analysis. Indian J. Genet. Plant Breed. 2016, 76, 284–289. [Google Scholar] [CrossRef]
Figure 1. Heatmap for linear Pearson’ correlation coefficients between dry matter yield, crude protein, crude fiber, phosphorus, potassium, calcium, magnesium and sodium in the first cut (rcr = 0.19).
Agronomy 10 01743 g001
Figure 2. Heatmap for linear Pearson’ correlation coefficients between dry matter yield, crude protein, crude fiber, phosphorus, potassium, calcium, magnesium and sodium in the second cut (rcr = 0.19).
Agronomy 10 01743 g002
Figure 3. Heatmap for linear Pearson’ correlation coefficients between dry matter yield, crude protein, crude fiber, phosphorus, potassium, calcium, magnesium and sodium in the third cut (rcr = 0.19).
Agronomy 10 01743 g003
Figure 4. Distribution of 11 timothy genotypes in the space of two first canonical variables in the first cut.
Agronomy 10 01743 g004
Figure 5. Distribution of 11 timothy genotypes in the space of two first canonical variables in the second cut.
Agronomy 10 01743 g005
Figure 6. Distribution of 11 timothy genotypes in the space of two first canonical variables in the third cut.
Agronomy 10 01743 g006
Figure 7. Density plots of the values of Mahalanobis distances, classified by the cuts. Mahalanobis distances were calculated on the basis of all observed traits: dry matter yield, crude protein, crude fiber, phosphorus, potassium, calcium, magnesium and sodium. The range of violins mean minimal and maximal values of Mahalanobis discances between studied genotypes for particular cuts. The points (crosses inside violins) are plotted along a line, with a kernel density smooth on either side to indicate the density of points along the line.
Agronomy 10 01743 g007
Table 1. Basic data on soil properties.
DescriptionNieznanicePolanowicePalikije
Soil typebrowndegraded chernozem derived from loessbrown
Complex agricultural soil suitabilityrye, goodwheat, very goodwheat, good
Class of soil valuationIIIbIIIIa
soil pH in KCl6.07.26.5
Table 2. Correlation coefficients between observed traits calculated independently on the basis of genotypes’ means in cuts.
TraitCutDry Matter YieldCrude ProteinCrude FiberPhosphorusPotassiumCalciumMagnesium
Crude proteinI−0.29 *
II0.28 *
III−0.51 ***
Crude fiberI0.02−0.44 ***
II0.62 ***0.40 ***
III0.14−0.06
PhosphorusI0.27 *−0.44 ***0.16
II−0.39 **−0.61 ***−0.33 **
III0.15−0.57 ***0.01
PotassiumI−0.09−0.220.07−0.05
II−0.18−0.22−0.100.14
III0.13−0.05−0.41 ***0.13
CalciumI0.28 *−0.190.030.34 **−0.34 **
II0.15−0.190.18−0.04−0.22
III0.33 **−0.34 **0.060.07−0.31 *
MagnesiumI0.41 ***−0.14−0.010.16−0.160.71 ***
II−0.05−0.23−0.040.20−0.090.68 ***
III0.20−0.36 **−0.030.17−0.150.77 ***
SodiumI0.23−0.75 ***0.48 ***0.53 ***0.26 *0.29 *0.29 *
II0.21−0.41 ***0.38 **0.48 ***0.220.240.10
III0.48 ***−0.46 ***0.34 **0.62 ***0.000.240.12
* p < 0.05; ** p < 0.01; *** p < 0.001.
Table 3. Correlation coefficients between the first two principal components and the observed traits.
CutIIIIII
TraitV1V2V1V2V1V2
Dry matter yield0.0140.781 **0.2240.079−0.08−0.359
Crude protein−0.576−0.0280.4340.055−0.5240.202
Crude fiber0.0910.146−0.006−0.3020.923 ***0.222
Phosphorus0.4720.694 *0.1120.4840.0430.075
Potassium0.102−0.837 **−0.319−0.765 **−0.4910.294
Calcium−0.685 *0.623 *0.685 *0.336−0.029−0.816 **
Magnesium−0.901 ***0.3370.980 ***−0.0670.134−0.974 ***
Sodium−0.712 *−0.48−0.249−0.468−0.3630.169
Percentage of elucidated multivariate variability46.6331.2353.4421.8937.8934.26
* p < 0.05; ** p < 0.01; *** p < 0.001. V1-first canonical variable; V2-second canonical variable.
Table 4. Mahalanobis distances between studied genotypes estimated on the basis of data form all environments in particular cuts.
GenotypeCutPOB-TT1POB-TT2POB-TT3POB-T-100POB-T-107SkaldEgidaEmmaSkalaSkaut
POB-TT2I0.604
II1.121
III1.902
POB-TT3I1.5581.683
II1.7491.451
III1.8272.052
POB-T-100I1.9581.6772.246
II2.4521.8451.791
III2.9181.6962.733
POB-T-107I1.8311.621.3552.023
II3.0382.4031.6222.783
III3.5222.4192.4753.099
SkaldI3.1223.2142.4643.6052.244
II3.4433.0582.0643.261.739
III3.2253.2652.1323.6452.288
EgidaI1.5961.7171.12.6131.9012.606
II1.8741.9841.8042.4143.0592.533
III3.032.3293.3372.1323.4933.601
EmmaI3.5083.6132.8314.2882.6361.5642.902
II2.6822.3881.8592.5542.3012.4472.349
III3.1383.9162.324.6613.8053.1194.996
SkalaI1.2251.6522.2372.6242.5923.042.133.6
II1.5581.7612.5952.3693.8894.0491.9653.416
III1.6893.0762.7764.3194.5054.3654.5083.371
SkautI2.1782.1553.2363.5873.0023.8962.9854.0792.23
II2.372.4913.1573.7463.913.8682.4674.012.167
III2.4142.9293.5114.3373.8674.0673.8974.512.588
KartaI1.9882.2362.7493.5462.8633.1092.2983.1381.6811.664
II1.4331.6342.3773.0693.3333.4031.8883.1931.8251.335
III1.81.7562.8693.0163.1723.4852.6654.2882.8711.62
Publisher’s Note: MDPI stays neutral with regard to jurisdictional claims in published maps and institutional affiliations.

