1. Introduction
In recent years, a record amount of ethanol is produced globally. The top ethanol-producing countries are the United States (U.S.), Brazil, and European Union. In 2019, U.S. has produced around 15,800 million gallons of ethanol, 8620 million gallons of ethanol was produced in Brazil, and the European Union produced around 1440 million gallons of ethanol [
1]. As energy consumption worldwide will almost double between 2018 and 2050 [
2], expectations for further expansion of biofuel production has been growing in these countries and other developing countries such as China [
3]. With the rapid growth of China’s economy in recent decades, China’s carbon dioxide (CO
2) emission has rapidly increased, becoming the largest carbon emitter worldwide in 2018 [
4]. Although it is not easy to reduce emissions as an emerging economy with a huge population, the Chinese government has been focusing on increases in the efficiencies of energy use and pollution control through expanding biofuel production [
3]. As a result, China is now the fourth largest ethanol producer worldwide [
1].
Biofuel is still produced mainly from food crops such as corn. However, the diversion of food crops to biofuel increases concerns over shortage in corn, which leads to increased corn prices as well as corn ethanol production costs. In U.S., to avoid the food–fuel competition, the finalized RFS (i.e., RFS-2) regulates annual production of grain-based ethanol under 15 billion gallons out of 36 billion gallons [
5]. Over the past decades, there has been a growing use of biodiesel- and ethanol-based fuels for transport vehicles [
6]. In the U.S. alone, there are at least 3473 alternative fuel stations which offer ethanol (E85), and at least 190 fuel stations that sell biodiesel (B20 and above) [
7]. This number has gradually increased. Therefore, the substantial improvement in the economics of the biofuel (ethanol) supply chain can significantly improve its usage by exploiting ways to maximize the efficiency of biofuel production as well as to reduce the cost of biofuel production using existing resources [
8]. To improve the economics of biofuel production, most researchers have focused on optimizing the supply chain, and methods for the optimal selection of the location of bio refineries and feed stock processing plants [
9]. Unlike the existing studies, this study aims to identify the optimal capacity of a biofuel refinery for improvements in its operational efficiency. Given the current number of ethanol and biodiesel production plants, which currently stands at 214 ethanol plants and 99 biodiesel plants, a number that is constantly increasing [
10], optimizing the capacity will yield improved system productivity, reduce ethanol selling price, and also improve availability.
This study aims to find the optimum capacity/number of reactors in the hydrolysis and fermentation operation under the given feedstock quantity. Continuous-event simulation (CES) is used to conceptualize and simulate the various stages (e.g., feedstock delivery, storage, pretreatment, enzyme production, and hydrolysis) of ethanol production, so researchers can explore techniques to accurately optimize these processes for a given amount of feedstock (i.e., corn stover). The simulation-based approach implemented here mimics biofuel refinery operations and the various interaction between different phases of production; the method comprises two sections: (1) the CES modeling using AnyLogic® simulation software to mimic operations of the different phases of a biofuel refinery in detail and (2) the simulation-based optimization via OptQuest® to find the optimum number of reactors. By using the high-fidelity simulation, researchers can accurately estimate the optimum bio-reactor capacity for the hydrolysis and fermentation.
The paper is organized as follows:
Section 2 will review details of the general operations of a biofuel refinery.
Section 3 consists of the developed mathematical model and the Anylogic
® CES model, that is designed to identify the optimal number of reactors regarding detailed operations at each phase of a biofuel refinery.
Section 4 will demonstrate the performance of the proposed approach.
Section 5 concludes the study and findings.
2. Backgrounds
2.1. Biofuel Refinery Operation
In 2017, there were 214 biofuel refineries with the capacity to produce 16.1 billion gallons of ethanol biofuel in U.S. Ninety percent of the 214 biofuel refineries are corn-based facilities that convert corn or corn stover to ethanol [
11].
The existing methods of biofuel refining suggest that the feed stock generation is included in the refinery design [
12], however, this poses a number of challenges: the first is to obtain a large enough expanse of land to generate the required feedstock for optimal production. If that is achieved and, for some reason, there is a drought or some agricultural mishap affecting the surrounding land, it automatically affects the output of the refinery. This makes it less feasible to implement that approach for large-scale production. Another issue with this approach is that the plant would also need large storage capacity for the feedstock, because it is more expensive to harvest feedstock in shorter schedules, and thus not economically feasible [
13]. Thus, a constant supply of feedstock to the refinery from external sources is preferred. For feedstock delivery optimization, using Dijkstra-based GIS, the authors of [
14] developed a methodology that can calculate a network of processing sites around a region. Furthermore, the two-phase location allocation method proposed by [
15] can be implemented to select an optimal location for a refinery to ensure optimal proximity to feedstock farms and a storage site. In addition, cellulose enzyme production was incorporated in the design, which helps improve transparency in actual cost of enzyme production. The cellulase enzyme is an integral part of the whole process. Thus, having the production unit will ensure that it is always available for use and save the costs of procuring [
16].
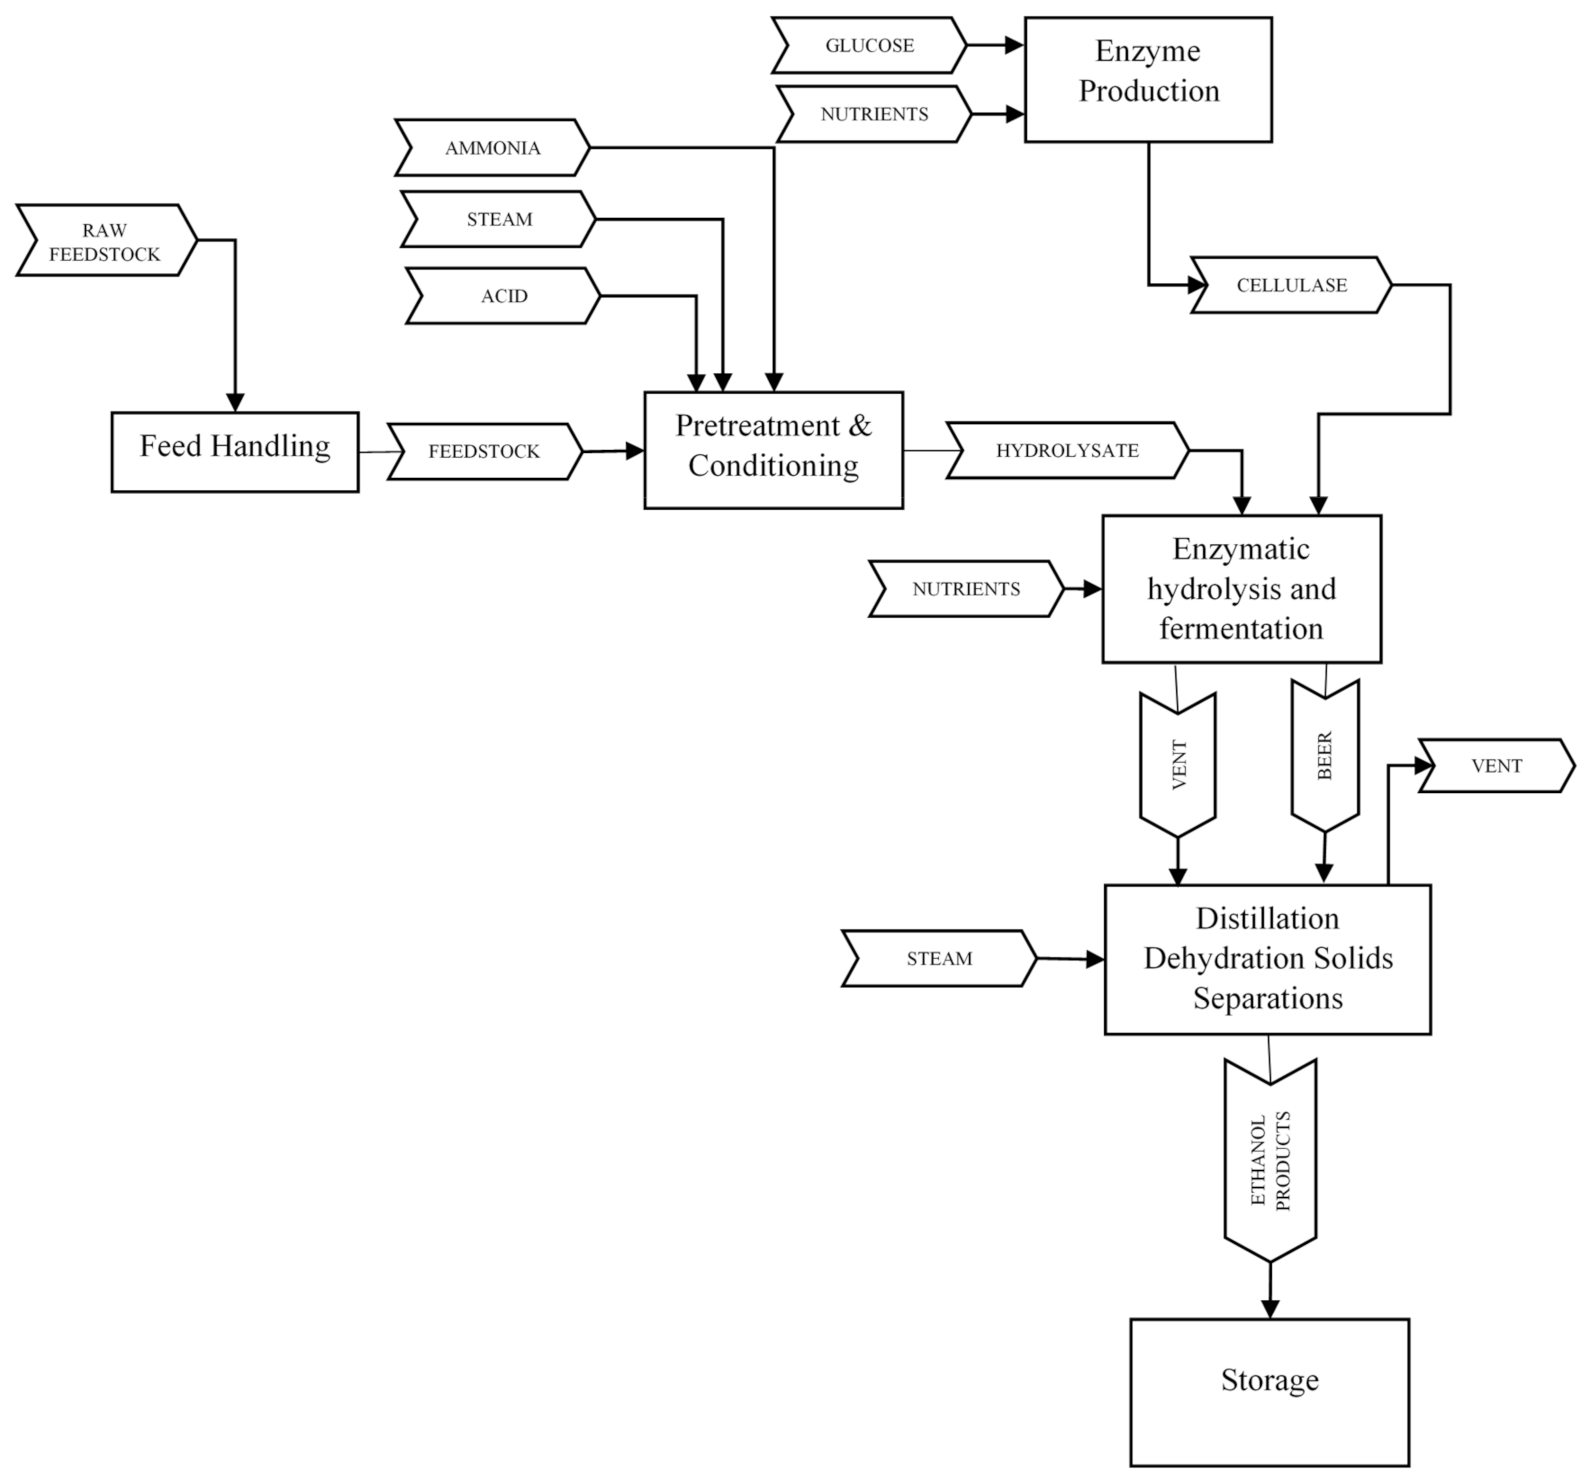
The corn-based biofuel refinery process consists of the following phases from the time the raw feedstock gets to the refinery to the finished refined product (1) feedstock storage and handling (2) pretreatment and conditioning, (3) enzymatic hydrolysis and fermentation, (4) cellulase enzyme production, (5) product, solid and water recovery, (6) waste water treatment, (7) product and feed chemical storage, (8) combustor and turbo generator, and (9) utilities, feed stock storage and handling [
16]. This paper adopts the process design contained in the National Renewable Laboratory Report on the biochemical conversion of lignocellulose biomass to ethanol (see [
16]); the report grouped the process of biofuel refining into the nine areas mentioned above. Encompassing feedstock storage and handling through to the process of conversion to storage of the resulting fuel and conservation and recycling of by-products. The major stages, such as feedstock storage and handling, pretreatment and conditioning, enzymatic hydrolysis and fermentation, and cellulase enzyme production, are shown in
Figure 1.
2.1.1. Feedstock Storage and Handling
This is the first phase of ethanol production, the handling phase, where feedstock is first received into the facility and stored in a short-term storage for further processing and handling. Ideally, it usually is comprised of a weighing and unloading station, short-term queuing storage and conveyors for transmitting the feedstock (corn stover) to the pretreatment reactor. Most feedstock is delivered in optimal condition, as feedstock transportation takes extra care to preserve the quality of feedstock by the location of the intermittent storage site from farms to the refinery [
15]. Furthermore, it is assumed that the incoming feedstock has been treated to required specification, with reference to particle size distribution, moisture content and bulk density [
17]. The unloading process, by design, should take about 7–10 min and is also equipped with dust collectors [
16], which implies that the integrity of the feedstock is not compromised during the process.
2.1.2. Pretreatment and Conditioning
After the feedstock has been received into the facility as corn stover, it is transferred from feedstock storage and handling, with the aid of conveyors for pretreatment and conditioning. This process, through a hydrolysis reaction, involves converting the hemicellulose carbohydrates in the corn stover to sugars [
16]. These sugars will be used during the enzymatic hydrolysis stage. The purpose of this conversion is to facilitate the enzymatic hydrolysis by sending only usable extracts form the corn stover for hydrolysis. Residues that are not usable are given off as acetate. Pretreatment is usually carried out in two phases, a horizontal screw-feed reactor and a lower temperature conversion, with a residency time of 5–10 and 20–30 min, respectively. There is no benefit of keeping the corn stover longer than necessary in this stage, since this fermentation process uses ammonia [
17]. The ratio of converted product varies across various corn varieties. This paper adopts a 45.4% Glucan, 22.7% Xylan and 1.9% Arabian as the percentage of converted products [
18]. This summation sums up to 70% of the total mass of the corn stover. The remaining 30% is given off as acetate or can be utilized for other processes.
2.1.3. Enzymatic Hydrolysis and Fermentation
After pretreatment, the slurry is ready for the enzymatic hydrolysis and fermentation, the hydrolysis and fermentation process combine cellulase enzymes prepared in the cellulase enzyme production unit and aid in the breaking down of cellulose fibers. This results in sugars being fermented to ethanol. This fermentation is usually done using a recombinant co-fermenting bacterium Zymomonas mobilis [
19] because of its abundance in nature. It is best to commence hydrolysis when slurry from pretreatment is still at a high temperature, because enzyme activity is usually higher at a high temperature. This ensures faster conversion than when slurry is cooled [
16]. This process is a continuous process with a high residency time of about 5 days to get optimal results. Thus, it is imperative for a scheduling algorithm that can ensure optimal production.
2.1.4. Cellulase Enzyme Production
The production of the enzymes used for hydrolysis is done here. This process can be outsourced or incorporated into plant design. However, to maximize output and reduce the minimum ethanol selling price, enzyme production should be done in the plant. This case study assumes, in plant conversion of a small fraction of glucose to sophorose, to help induce cellulose enzyme production [
16].
2.2. Literature Review on Operations Management of Biofuel Refinery
Though the statistics presented in
Section 1 and
Section 2.1 might seem interesting, it is worthy to note that biofuels are still a long way from replacing fossil fuels. Regarding the need to optimize production, biofuel optimization decisions can be categorized into strategic, tactical and operational [
20]. Interestingly, biofuel supply chain network design (BSCND) decisions are normally the prime choice since they have long-term effects on the supply chain process [
21]. This paper focuses on facility-related strategic decision related to the BSCND. Biofuel strategic decision are classified into facility-related, biomass-related and final-product-related, with the processing/refining of the biofuel has the highest number of decision variables [
9]. The linear approach appears to be dominant in BSCND models, and a comprehensive review puts the figure as 88%, while about 12% utilized nonlinear methods [
9]. These BSCND models however, proposed a solution to the optimal location of storage, refining, and farm site while achieving various aims. A classic example is the model for the design and sustainable bioethanol supply chain proposed by [
22], which minimizes total ecological foot prints while considering the use of various feedstock, production technologies, transportation and disposal, and is dynamic and covers a broad range issues, However, it does not deal with the optimization of production technologies, which is one main issue addressed by this paper. The authors of [
23] proposed a model that determines uncertainty in the biofuel supply chain development. However, the issues of the uncertainty could be averted when any of the suggested models for feedstock supply to the refinery are implemented. This is a major reason why the simulation developed for this paper assumes the delivery of feedstock from external sites.
There are a number of refinery operation optimizations for crude oil, which focus on different phases of crude oil refinery operation. For instance, [
24] proposed a model for petroleum refinery effluent treatment using upflow anaerobic sludge blanket bioreactors, which improves productivity. Extensive research has been conducted and is still on-going for biofuel refinery bioreactors’ performance [
25]. Their paper focused on scheduling optimization using a specific production and treatment unit. Such techniques can be adapted to biofuel refining but production will be limited to the number of bio-reactors, hence the need for an approach that can find an optimal solution for the number of reactors and treatment plants. The main goal of this study is to find such optimal parameters.
To obtain a modelling method that conforms to reality, a simulation approach is proposed in this study. This is because simulation allows us to obtain a realistic conceptualization of any real-life scenario, such as a biofuel refinery, to enable us to study the overall refinery process. This is a major advantage over other models since it can further incorporate methods like linear, nonlinear, mixed-integer linear and mixed-integer nonlinear model during simulation optimization to achieve better results faster.
3. Simulation-Based Capacity Planning of a Biofuel Refinery
To develop an efficient simulation model for a general corn-based ethanol biofuel refinery, this study utilizes simulation-based optimization approach under the AnyLogic® simulation software. The simulation-based optimization consists two components: (1) CES-based capacity planning and (2) optimization. The capacity planning focuses on simulating the refining processes involving the feedstock delivery and handling, pretreatment and conditioning, cellulose enzyme production, and enzymatic hydrolysis and fermentation. The study assumes that a unit of feedstock delivered by the truck represents a ton of feed stock, which is conveyed to pretreatment and conditioning. Another assumption is that the conditioning process considers only the constituents hemicellulose carbohydrate as being generated from the feedstock. Finally, since most of these processes are chemical reactions, the reaction times take constant values or follow a stochastic triangular distribution.
The optimization is conducted to find the optimum number of reactors via OptQuest®. To this end, the optimization engine changes the number of reactors (i.e., the decision variable) and evaluates each alternative via the simulation model (i.e., CES-based capacity planning) in Anylogic®. This continues until the best number of reactors is found in terms of the productivity of a refinery. The solution will be achieved by simultaneously considering the process schedule and average processing time for each process; care should be taken, however, to allow enough time for specific chemical stages to be completed, since chemical reactions require specific timing, like the cellulase enzyme production, but consider adjusting the capacity of the production unit to optimized production.
3.1. Continuous-Event Simulation Modeling of Biofuel Refinery
The operations of the ethanol refinery mentioned in
Section 2.1 is developed via Process Modeling Library in Anylogic
® simulation software (AnyLogic University 8.4). Particularly, four major operations converting lignocellulose biomass (i.e., corn stover) to ethanol were considered to develop a cost-effective capacity of the refinery. The operations include feedstock storage and handling, pretreatment and conditioning, fermentation and hydrolysis, and enzyme production.
Figure 2 shows an overview of the refinery operations considered in this study.
In
Figure 2, the Feedstock Storage and Handling process receives a feedstock (i.e., corn stover) and stores it in short-term storage (e.g., a silo) for further processing and handling. During fermentation and hydrolysis, the pretreated and conditioned feedstock is received as glucose, and xylose. Once the glucose and xylose are received, they undergo enzymatic hydrolysis and are then fermented for 5 days to produce ethanol as the final product (see
Figure 3).
The total ethanol produced is the sum of ethanol from the reaction of glucose (or glucan) with enzyme, and xylose with enzyme.
Table 1 represents various chemical reactions associated with glucose and xylose. All glucose reactions are summed up as one, and consequently all xylose reactions are also summed up as one.
The cellulase enzyme used for the enzymatic hydrolysis are produced concurrently as the feedstock undergoes pretreatment, then sent to hydrolyze and ferment the soluble sugars that are produced from the pretreatment and conditioning. Typically, enzyme production can start as early as the pretreatment process, by using a backwash of the hydrolysate slurry from the pretreatment of the corn stover [
12]. Here, enzyme production is implemented using submerged aerobic cultivation of Trichoderma reesei-like fungus on glucose and fresh water, which produces significantly higher enzyme titers [
26].
The cellulose enzyme production is modelled to start at the beginning of the simulation process; just as the feedstock is delivered the enzyme production begins, as a separate process to ensure that the enzymes are ready for hydrolysis when needed during fermentation and hydrolysis. The enzymes are then sent to hydrolysis and fermentation (see
Figure 3).
3.2. Capacity Planning Model
To find the optimum number of reactors, a mathematical optimization model has been devised. Since the refinery process is continuous, the mathematical model assumes that the refinery works continuously without a break.
Table 2 shows the nomenclature used in the mathematical model.
Equation (1) shows the mathematical model to identify the optimum number of reactors via the simulation-based optimization with OptQuest
®
subject to
Since the devised simulation model is a stochastic model running with different random seeds, each simulation run provides the expected production of ethanol. Equation (1) separately determines numbers of glucose (or glucan) reactors and xylan reactors for the maximization of the total production of ethanol. The optimization model is restricted by the constraints shown in Equations (2)–(6). There are three major processes in a refinery: (1) feedstock delivery and storage, (2) pretreatment and conditioning, and (3) enzymatic hydrolysis and fermentation. Equation (2) defines the total production of ethanol which is the sum of ethanol produced from the two types of chemicals at the enzymatic hydrolysis and fermentation process (j = 3). The output of each process should be less than and equal to the output of the previous process multiplied by the expected conversion rate at process j (see Equation (3)), and output of reactors should be less than output of the previous process multiplied by the expected conversion rate at process j (see Equation (4)). Equation (5) is used to regulate output of the first process (i.e., feedstock delivery and storage). Nonnegativity conditions for decision variables are addressed in Equation (6). Note that all expected values in the optimization model are given by the simulation model (i.e., CES-based capacity planning) in Anylogic®.
4. Simulation-Based Capacity Planning of a Biofuel Refinery
The simulation-based optimization approach addressed in
Section 3 is utilized to identify the optimal number of hydrolysis reactors in terms of utilization and productivity of the subject facility. The simulation model mainly focuses on the process design and economics for the biochemical conversion of lignocellulosic biomass (i.e., corn stover) to ethanol. The experiment scenario and its results will be addressed in
Section 4.1 and
Section 4.2, respectively.
4.1. Scenario
The process design for conversion of lignocellulose biomass to ethanol by the U.S. National Renewable Energy Laboratory [
16] is selected to accurately consider the detailed operations of a refinery. The capacity-planning model addressed in
Section 3.2 derives the (near) optimal hydrolysis reactor capacity required to produce maximum ethanol output from a given quantity of feedstock (i.e., corn stover). In the model, trucks deliver about 10 tons of feedstock per delivery to the refinery, then the feedstock is received and immediately pretreated and conditioned for hydrolysis. The locations of feedstock farms are Minier, Delavan, Allentown, Morton, and Sewell lake in Tazewell County, Illinois, U.S. Since we assume that the subject facility is located in Schaeferville Tazewell County, the annual transportation distance is 1,707,245 km with USD 1,929,186. Note that the unit transportation cost is USD 1.13 per km according to ATRI [
27]. During this process, hemicellulose carbohydrates are extracted from the corn stover, in form of glucan (45.4%), xylan (22.7%), aramian (1.9%), galactican (2.5%) and mananian (1.8%). The hemicellulose carbohydrates are then sent to the hydrolysis reactors for fermentation into alcohol. As this process is being run, enzyme production takes place concurrently. These enzymes serve as catalysts for the hydrolysis and fermentation process.
Using the process design described in
Section 3, the proposed CES approach is executed for a runtime of 365 days (1 year) with 30 replicates per scenario. The simulation assumes that feedstock is supplied by an external silo storage so that there is continuous supply of feedstock all year round. The mean processing/delay times of the feedstock in each phase are determined by the refinery system proposed by [
16], addressed in
Section 2.1. In addition, conversion rates shown in
Table 1 are used to determine the processing time of the feedstock or pretreated slurry at each phase of conversion.
In this experiment, the real data of feedstock in Tazewell County, Illinois, U.S. was used. Data for corn grain yields in Tazewell County, Illinois were obtained from National Agricultural Statistics Service [
28].
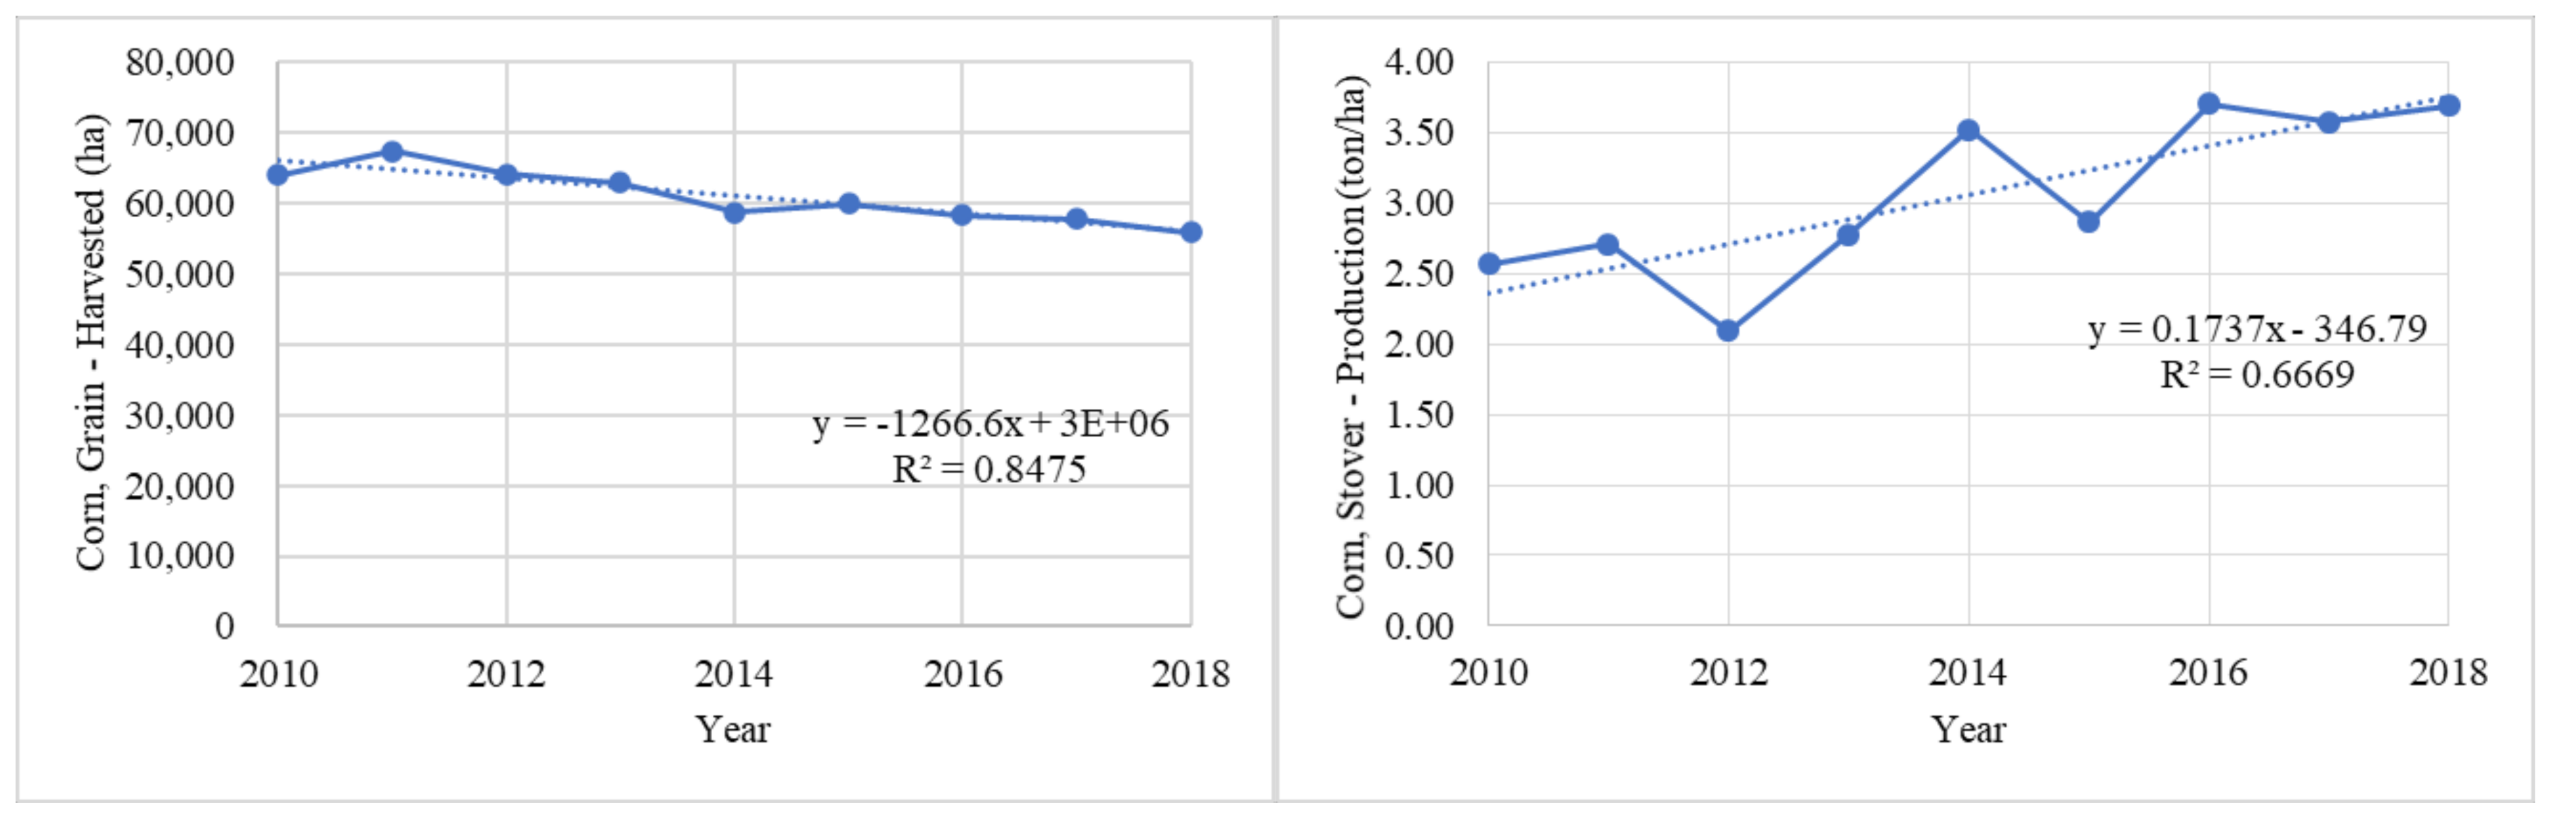
Table 3 shows the corn and corn stover yield data covering a period between 2010 and 2018 for Tazewell county in Illinois. The potential yield of corn stover from corn are closely related; the grain to stover ratio is close to 1:1 [
29]. However, to avoid the negative effects of corn stover removal on soil quality (e.g., soil organic matter), the removal rate should be no more than 25% of corn crop residues [
30]. Thus, this study assumes that the yield of corn stover is 25% of corn yield.
Figure 4 shows harvested area (ha) and yield of corn stover in ton/ha. These data show an increased corn grain production even with a decline in the corn grain planted, showing the ability to provide a sufficient supply of feedstock to the refinery. The experiment utilized average yield of 7,269,306 bushels (184,640 tons) of corn stover in Tazewell County in Illinois, U.S. This study assumes that the subject refinery can fully utilize the harvested corn stover to produce ethanol.
4.2. Result
The existing refinery, consisting of three reactors, is annually producing 13,018,494 gallons (49,275,000 L) of ethanol from 4,535,753 bushels (115,208 tons) of corn stover. In other words, the daily production rate of ethanol is 35,667 gallons (135,000 L). Regarding that the subject refinery uses a reactor with capacity of 900 m
3 (900,000 L), the refinery has 100% as its utilization rate. Note that the reactor has water (70%) and solids (15%) in addition to the ethanol (15%). To enhance the profit of the facility, the proposed approach is adopted.
Table 4 reveals performance of the subject facility under different numbers of reactors.
The three-batch system (i.e., a refinery with three reactors) is currently used in the refinery. Regarding the process time of fermentation (72 h), it is better to have the three-batch system to maximize utilization of the entire facility. In other words, while one fermentation reactor spends 72 h, other operations can fill two more reactors. Note that the fermentation process is a bottle neck process at a refinery. The processing time of operations before the fermentation process takes approximately one day.
Although the facility is fully utilized, capacity of the subject facility is inappropriate. The facility only consumes 4,535,753 bushels (115,208 tons) of corn stover. Annually 2,733,552 bushels (69,432 tons), which can be converted to 29,696,451 L of ethanol, are wasted and unused. To mitigate the waste, it is appropriate to have more than four reactors at the facility.
Figure 5 shows the profit and utilization of two best options in terms of daily profit, shown in
Table 4.
Although the option with five reactors has a higher utilization than another option with six reactors, it requires overproduction in 2014, 2016, 2017, and 2018. In other words, the option with five reactors is not reliable because it cannot handle a case with high yield of corn stover. To make utilization over 100%, a refinery should spend additional operational cost (e.g., extra payment for overtime). Thus, the ratios of production cost to production quantity (USD/L) between two options are quite similar, even though the option with six reactors has a higher fixed cost in its production cost. The ratio of the option with five reactors has 0.8648, and the ratio of the option with six reactors is 0.8700. Since the option with six reactors can produce more ethanol than another option with five reactors, it has a higher daily profit than another scenario. In fact, the NPV of the case with six reactors has the highest value (i.e., USD 291,768,314) so that buying three more reactors will be the best option for the subject facility.
The proposed model is generic so that it can be applied to a biofuel refinery with any type of feedstock. Once the detailed operations or processes of a subject system are analyzed (see
Section 2), the subject system can be modeled via the proposed CES under AnyLogic
®. This is flexible simulation software used to model numerous production systems [
33]. As each refinery must have appropriate capacity for reduction of its operational cost, it is necessary to use the proposed model for the facility design.
5. Conclusions
The main objective of this paper is to develop an effective and practical capacity planning model for biofuel-refining process using CES. The proposed CES enables us to accurately model four major phases (i.e., feedstock storage and delivery, pretreatment and conditioning, enzymatic hydrolysis, and cellulose enzyme production) of a biofuel refinery. The devised approach has been applied to the process design and economics for biochemical conversion of lignocellulosic biomass to ethanol proposed by the national renewal energy laboratory using Anylogic®. Based on the devised CES, OptQuest® was used to identify the (near) optimal number of bioreactors in the hydrolysis and fermentation operation regarding its utilization. According the experiment results, the hydrolysis reactors can operate at maximum capacity of 1,800,000 L. The selected best scenario can make daily profit of USD 82,217, and it can fully utilize the harvested corn stover yields from 2010 to 2018. The average utilization is 80.13, with a five-day operating time. As a result, design engineers can use the proposed model to determine optimal reactor capacity during biofuel refinery design. Moreover, once the yields of corn stover are estimated, the engineering can conduct what-if analysis as well as cost-benefit analysis for the cost-effective management of a refinery.
Irrespective of the contributions, this study requires further research that will explore optimization problems associated with other phases (e.g., product, solid and water recovery, waste water treatment, product and feed chemical storage, combustor and turbo generator, and utilities, feed stock storage and handling) of a biofuel refinery. In addition, barriers to utilize the proposed approach should be investigated and mitigated. The major challenge of the proposed approach is that it takes time to develop a CES model with understanding about the system. Even with a skilled simulation modeler, the engineer is needed to understand the detailed operations and their interaction. Thus, the way to provide a supportive environment for the simulation modeling should be investigated. Furthermore, the proposed approach should be applied to other biofuel production methods (e.g., sugarcane, rice straw, sawdust, wood chips and switchgrass) so that the approach can be generalized in future. Other applications (e.g., analysis of environmental and economic impact of the devised system) of the proposed approach should also be investigated in future.
Author Contributions
Conceptualization, S.K. (Sojung Kim), S.K. (Sumin Kim), E.O.; methodology, S.K. (Sojung Kim), S.K. (Sumin Kim), E.O.; software, S.K. (Sojung Kim), E.O.; validation, S.K. (Sojung Kim), S.K. (Sumin Kim), E.O.; resources, S.K. (Sumin Kim); writing—original draft preparation, S.K. (Sojung Kim), S.K. (Sumin Kim), E.O.; writing—review and editing, S.K. (Sojung Kim), S.K. (Sumin Kim), J.R.K.; visualization, S.K. (Sojung Kim), S.K. (Sumin Kim); project administration, J.R.K.; funding acquisition, J.R.K. All authors have read and agreed to the published version of the manuscript.
Funding
This work was supported by the Dongguk University Research Fund of 2020. This work was conducted as part of the activities of the USDA Natural Resources Conservation Service Conservation Effects Assessment Project (NRCS-CEAP) Project agreement number 68-3A75-17-479.
Conflicts of Interest
The authors declare no conflict of interest.
References
- Statista. Fuel Ethanol Production Worldwide in 2019, by Country (in Million Gallons). Available online: https://www.statista.com/statistics/281606/ethanol-production-in-selected-countries/ (accessed on 26 September 2020).
- U.S. Energy Information Administration (EIA). International Energy Outlook 2019 with Projections to 2050. Available online: https://www.eia.gov/outlooks/ieo/pdf/ieo2019.pdf (accessed on 26 September 2020).
- Zhang, Z.; Lis, M. Modeling green energy development based on sustainable economic growth in China. Sustainability 2020, 12, 1368. [Google Scholar] [CrossRef]
- Statista. Largest Producers of Fossil Fuel CO2 Emissions Worldwide in 2018, by Share of Emissions. Available online: //www.statista.com/statistics/271748/the-largest-emitters-of-co2-in-the-world/ (accessed on 26 September 2020).
- CRS, Congresional Research Service. The Renewable Fuel Standard (RFS) An Overview. Available online: https://fas.org/sgp/crs/misc/R43325.pdf (accessed on 26 September 2020).
- Hoekman, S.K. Biofuels in the US–challenges and opportunities. Renew. Energy 2009, 34, 14–22. [Google Scholar]
- U.S. Department of Energy (DOE). Alternative Fuels Data Center. Available online: https://afdc.energy.gov/stations/#/find/nearest?country=US&fuel=E85 (accessed on 14 October 2020).
- Balaman, Ş.Y.; Selim, H. Sustainable design of renewable energy supply chains integrated with district heating systems: A fuzzy optimization approach. J. Clean. Prod. 2016, 133, 863–885. [Google Scholar]
- Ghaderi, H.; Pishvaee, M.S.; Moini, A. Biomass supply chain network design: An optimization-oriented review and analysis. Ind. Crop. Prod. 2016, 94, 972–1000. [Google Scholar] [CrossRef]
- U.S. National Renewable Energy Laboratory (NREL). The Biofuels Atlas. Available online: https://maps.nrel.gov/biofuels-atlas (accessed on 14 October 2020).
- U.S. Department of Agriculture-Economic Research Service (USDA-ERS). U.S. Bioenergy Statistics. Available online: https://www.ers.usda.gov/data-products/us-bioenergy-statistics/us-bioenergy-statistics/#Supply%20and%20Disappearance (accessed on 24 June 2019).
- Aden, A.; Ruth, M.; Ibsen, K.; Jechura, J.; Neeves, K.; Sheehan, J.; Lukas, J.; Wallace, B. Lignocellulosic Biomass to Ethanol Process Design and Economics Utilizing Co-Current Dilute Acid Prehydrolysis and Enzymatic Hydrolysis for Corn Stover; (No. NREL/TP-510-32438); National Renewable Energy Lab. (NREL): Golden, CO, USA, 2002. [Google Scholar]
- Jin, Y.; Illukpitiya, P. Cost minimization of supplying biomass for ethanol biorefineries. Energy 2016, 96, 209–214. [Google Scholar] [CrossRef]
- Perpina, C.; Alfonso, D.; Pérez-Navarro, A.; Penalvo, E.; Vargas, C.; Cárdenas, R. Methodology based on Geographic Information Systems for biomass logistics and transport optimisation. Renew. Energy 2009, 34, 555–565. [Google Scholar] [CrossRef]
- Kim, S.; Kim, S.; Kiniry, J.R. Two-phase simulation-based location-allocation optimization of biomass storage distribution. Simul. Model. Pract. Theory 2018, 86, 155–168. [Google Scholar] [CrossRef]
- Humbird, D.; Davis, R.; Tao, L.; Kinchin, C.; Hsu, D.; Aden, A.; Schoen, P.; Lukas, J.; Olthof, B.; Worley, M.; et al. Process Design and Economics for Biochemical Conversion of Lignocellulosic Biomass to Ethanol: Dilute-Acid Pretreatment and Enzymatic Hydrolysis of Corn Stover; (No. NREL/TP-5100-47764); National Renewable Energy Lab. (NREL): Golden, CO, USA, 2011. [Google Scholar]
- Hess, J.R.; Wright, C.T.; Kenney, K.L.; Searcy, E.M. Uniform-Format Solid Feedstock Supply System: A Commodity-Scale Design to Produce an Infrastructure-Compatible Bulk Solid from Lignocellulosic Biomass--Executive Summary; (No. INL/EXT-09-15423); Idaho National Laboratory (INL): Idaho Falls, ID, USA, 2009. [Google Scholar]
- Mourtzinis, S.; Cantrell, K.B.; Arriaga, F.J.; Balkcom, K.S.; Novak, J.M.; Frederick, J.R.; Karlen, D.L. Carbohydrate and nutrient composition of corn stover from three southeastern USA locations. Biomass Bioenergy 2016, 85, 153–158. [Google Scholar] [CrossRef]
- Zhang, M.; Eddy, C.; Deanda, K.; Finkelstein, M.; Picataggio, S. Metabolic engineering of a pentose metabolism pathway in ethanologenic Zymomonas mobilis. Science 1995, 267, 240–243. [Google Scholar] [CrossRef] [PubMed]
- Mula, J.; Peidro, D.; Díaz-Madroñero, M.; Vicens, E. Mathematical programming models for supply chain production and transport planning. Eur. J. Oper. Res. 2010, 204, 377–390. [Google Scholar] [CrossRef]
- Rahemi, H.; Torabi, S.A.; Avami, A.; Jolai, F. Bioethanol supply chain network design considering land characteristics. Renew. Sustain. Energy Rev. 2020, 119, 109517. [Google Scholar] [CrossRef]
- Ren, J.; Manzardo, A.; Toniolo, S.; Scipioni, A.; Tan, S.; Dong, L.; Gao, S. Design and modeling of sustainable bioethanol supply chain by minimizing the total ecological footprint in life cycle perspective. Bioresour. Technol. 2013, 146, 771–774. [Google Scholar] [CrossRef] [PubMed]
- Awudu, I.; Zhang, J. Uncertainties and sustainability concepts in biofuel supply chain management: A review. Renew. Sustain. Energy Rev. 2012, 16, 1359–1368. [Google Scholar] [CrossRef]
- Rastegar, S.O.; Mousavi, S.M.; Shojaosadati, S.A.; Sheibani, S. Optimization of petroleum refinery effluent treatment in a UASB reactor using response surface methodology. J. Hazard. Mater. 2011, 197, 26–32. [Google Scholar] [CrossRef] [PubMed]
- Göthe-Lundgren, M.; Lundgren, J.T.; Persson, J.A. An optimization model for refinery production scheduling. Int. J. Product. Econ. 2002, 78, 255–270. [Google Scholar] [CrossRef]
- Baneyx, F. Protein Expression Technologies: Current Status and Future Trends; Garland Science: New York, NY, USA, 2004. [Google Scholar]
- American Transportation Research Institute (ATRI). An Analysis of the Operational Costs of Trucking: 2019 Update. Available online: https://truckingresearch.org/wp-content/uploads/2019/11/ATRI-Operational-Costs-of-Trucking-2019-1.pdf (accessed on 15 September 2020).
- USDA National Agricultural Statistics Services (NASS). Illinois Corn County Estimates. Available online: http://www.nass.usda.gov (accessed on 14 November 2019).
- Roth, G. Corn Stover for Biofuel Production. EXtension Farm Energy. Available online: https://farm-energy.extension.org/corn-stover-for-biofuel-production/ (accessed on 3 April 2020).
- Battaglia, M.; Groover, G.E.; Thomason, W.E. Value and Implications of Corn Stover Removal from Virginia Fields. Virginia Cooperative Extension. Available online: https://www.pubs.ext.vt.edu/content/dam/pubs_ext_vt_edu/CSES/CSES-180/CSES-180-PDF_rev2.pdf (accessed on 14 October 2020).
- Trading Economics. Ethanol 2005–2020 Data. Available online: https://tradingeconomics.com/commodity/ethanol (accessed on 14 September 2020).
- Trading Economics. United States Fed Fund Rate 1971–2020 Data. Available online: https://tradingeconomics.com/united-states/interest-rate (accessed on 28 October 2020).
- AnyLogic. Anylogic Simulation Software. Available online: https://www.anylogic.com/ (accessed on 28 October 2020).
| Publisher’s Note: MDPI stays neutral with regard to jurisdictional claims in published maps and institutional affiliations. |
© 2020 by the authors. Licensee MDPI, Basel, Switzerland. This article is an open access article distributed under the terms and conditions of the Creative Commons Attribution (CC BY) license (http://creativecommons.org/licenses/by/4.0/).


