Article

Carbon Isotope Composition and the NDVI as Phenotyping Approaches for Drought Adaptation in Durum Wheat: Beyond Trait Selection

by
Rut Sanchez-Bragado
1,2,
Maria Newcomb
3,
Fadia Chairi
4,
Giuseppe Emanuele Condorelli
5,
Richard W. Ward
3,
Jeffrey W. White
6,
Marco Maccaferri
5,
Roberto Tuberosa
5,
Jose Luis Araus
2,4 and
Maria Dolors Serret Molins
4,*
1
Department of Crop and Forest Sciences, University of Lleida, 25198 Lleida, Spain
2
AGROTECNIO (Center of Research in Agrotechnology), 25198 Lleida, Spain
3
Maricopa Agricultural Center, University of Arizona, Maricopa, AZ 85138, USA
4
Section of Plant Physiology, University of Barcelona, 08028 Barcelona, Spain
5
Department of Agricultural and Food Sciences, University of Bologna, 40126 Bologna, Italy
6
US Arid Land Agricultural Research Center, USDA-ARS, 21881 N. Cardon Lane, Maricopa, AZ 85138, USA
*
Author to whom correspondence should be addressed.
Agronomy 2020, 10(11), 1679; https://doi.org/10.3390/agronomy10111679
Submission received: 3 August 2020 / Revised: 19 October 2020 / Accepted: 23 October 2020 / Published: 29 October 2020
(This article belongs to the Special Issue Photosynthetic Performance and Water-Use-Efficiency in Grasses)

Abstract

:
High-throughput phenotyping platforms provide valuable opportunities to investigate biomass and drought-adaptive traits. We explored the capacity of traits associated with drought adaptation such as aerial measurements of the Normalized Difference Vegetation Index (NDVI) and carbon isotope composition (δ13C) determined at the leaf level to predict genetic variation in biomass. A panel of 248 elite durum wheat accessions was grown at the Maricopa Phenotyping platform (US) under well-watered conditions until anthesis, and then irrigation was stopped and plot biomass was harvested about three weeks later. Globally, the δ13C values increased from the first to the second sampling date, in keeping with the imposition of progressive water stress. Additionally, δ13C was negatively correlated with final biomass, and the correlation increased at the second sampling, suggesting that accessions with lower water-use efficiency maintained better water status and, thus, performed better. Flowering time affected NDVI predictions of biomass, revealing the importance of developmental stage when measuring the NDVI and the effect that phenology has on its accuracy when monitoring genotypic adaptation to specific environments. The results indicate that in addition to choosing the optimal phenotypic traits, the time at which they are assessed, and avoiding a wide genotypic range in phenology is crucial.

1. Introduction

Global warming makes agricultural productivity more unpredictable, especially in the semiarid regions of the world. Indeed, in the southern and eastern parts of the Mediterranean Basin where durum wheat is the main annual crop and of great cultural importance, the frequency and severity of drought events (understood as the combination of water and heat stresses) show an upward trend [1]. Drought is a major factor limiting wheat yield, but, despite decades of research, it remains a challenge for plant breeders [2]. Drought stress significantly affects growth and photosynthetic plant performance and, consequently, agronomical grain yield components such as the number of fertile spikes per unit area, the number of grains per spike, grain weight, harvest index, or plant height [3,4]. In this context there is an urgent need to increase genetic yield potential and drought resilience in new cultivars [5]. Genetic gains in grain yield can be achieved by targeting proxy traits closely associated with improved wheat adaptation [4,5]. Among them, crop phenology has been one of the most successful proxies used by breeders in Mediterranean environments, where the frequency and intensity of drought episodes occurring during grain filling have increased in the past decades. In these conditions, genotypes with earlier anthesis have demonstrated their value [6,7,8]. Stay-green at the reproductive stage, particularly during grain filling, is another relevant proxy trait for breeding in Mediterranean environments. High levels of green biomass during grain filling are associated with high potential canopy photosynthesis and radiation use efficiency, not only when environmental stresses are absent, but also under conditions where some degree of drought stress is present. Stay-green has proven relevant among the genetic gains of recent decades under both high-yielding [9] and growth-limiting conditions [10,11]. Therefore, it is expected that it will have an important impact on future genetic gain in yield [12,13].
Estimating direct plant green biomass under field conditions is labor intensive, which makes it almost impracticable to manage experiments where thousands of genotypes need to be screened. Alternatively, remote sensing approaches have been suggested as tools to estimate biomass directly, potentially based on the canopy’s spectral reflectance properties [14,15,16]. Therefore, remote sensing tools provide an excellent opportunity for improving the capacity to phenotype under field conditions. In addition, the preferred platforms for remote sensing are unmanned aerial vehicles (UAVs) because they are versatile and effective for measuring plant traits at suitable spatial and temporal resolutions [11,17,18,19]. Sensors and imagers installed in UAVs can accurately measure proxy traits, such as multispectral indices, in hundreds of plots with low investment in time [20,21,22]. Multispectral cameras with different band centers and bandwidths (e.g., Parrot Sequoia and MicaSense RedEdge) mounted on unmanned and autopiloted vehicles such as drones (including fixed-wing and polycopter devices) have been used in the past to measure the normalized difference vegetation index (NDVI) [23]. The NDVI is one of the best-known multispectral indices and is a widely used vegetation index to infer canopy photosynthesis, stay-green, and overall plant status [24]. The NDVI compares the spectral reflectance of the vegetation in the red (from 620 to 690 nm) and in the near-infrared (NIR, from 760 to 900 nm) portions of the spectrum and relates to chlorophyll content through the absorption features of the molecule, representing a proxy of the green photosynthetically active area of the plant [24,25]. Therefore, when assessed at the plot level, the NDVI calculated as (NIR − Red)/(NIR + Red) may be a proxy of canopy chlorophyll [26], green biomass, and, consequently, grain yield [27]. In this sense, the NDVI has been used not only to characterize plant growth under good agronomical conditions but also as an indicator of plant response to drought [28] including the genetic dissection of the NDVI as a key secondary trait for selecting genetic loci associated with drought tolerance and yield potential [29] in wheat.
However, in spite of the numerous advantages of remote sensing, particularly when devices are mounted on a UAV, lab-based phenotypic traits may still be useful. In this regard, the stable carbon isotope composition (δ13C) in its natural abundance in plant dry matter has proven its value [30,31,32], which has been used for decades as a tool for screening water-use efficiency (WUE) during grain filling in C3 plants, including wheat [30,33]. Water-use efficiency, expressed as assimilation rate divided by transpiration rate, is the rate of CO2 uptake for a given rate of water loss. The δ13C has been successfully used as a time-integrated proxy for WUE and is based on the 13C discrimination that occurs during two steps of CO2 uptake. The first step is diffusion from the air to the intercellular air space through the boundary layer and stomata, followed by the second step where Rubisco is involved in the carboxylation reaction [34]. During these two steps, the lighter 12C preferentially diffuses and is fixed by Rubisco, resulting in assimilates being depleted in 13C compared to the ambient CO2 [30]. The extent to which this occurs is dependent on the ratio of the intercellular versus atmospheric CO2 concentration (Ci/Ca), which can be affected by both the assimilation rate and stomatal conductance. All else equal, a lower Ci/Ca will correspond to a higher WUE and a higher δ13C [30,35].
Under field conditions, the δ13C has been negatively associated with biomass and yield, not only under well-watered conditions [36] but also in environments exhibiting moderate to severe drought [32,37]. As a lower δ13C implies a lower WUE under drought conditions, the yield advantage may result from constitutive (e.g., phenology, plant size, etc.) or stress-adaptive (e.g., osmotic adjustment, root architecture, etc.) traits that allow the crop to avoid the negative effects of drought stress. However, positive relationships between δ13C and biomass and yield [38,39,40] have also been reported, particularly under severe drought conditions [30,35,41,42]. δ13C is a good indicator of the water strategy that crop plants adopt in the field and is a desirable trait for breeding programs [3] because it integrates plant transpiration [43] and the photosynthetic performance of the plant over time [31] and can be easily sampled in a large number of genotypes [35] with high repeatability [43]. In addition, although the application of δ13C has been mainly related to plant water status, it has been used as a secondary trait for selecting genetic loci associated with drought tolerance and also as a measure of increasing yield under good agronomical conditions in wheat [44] and other cereals [45,46].
Although this is often forgotten, timing is key for phenotyping as well as defining derived actions such as selection indices and ideotypes and even the genetic dissection and formulation of quantitative trait loci (QTL) [47]. The objective of the present study was to explore the capacity to predict genotypic variability in green biomass during grain filling by using aerial measurements of NDVI at different phenological stages and evaluate the δ13C in the flag leaves sampled initially under well-watered conditions and, subsequently, under drought. In addition to the assessment of these phenotypic traits, another important objective was to determine the best time to measure such traits in terms of crop phenology and growing conditions. The study was performed in a panel of 248 genotypes of durum wheat grown in the Maricopa phenotyping platform, one of the best-integrated agricultural technology platforms and the largest open-air phenotyping robotic scanner in the world. The rationale of our work was to illustrate the confounding effects phenology may have when phenotyping wheat. We addressed phenology under two premises. Firstly, genotypic variability in phenology, which results in different genotypes being sampled at different phenological stages at a given moment. This may affect, for example, the sign and strength of the relationships between δ13C and plant biomass. Secondly, the phenological stage at which plants are measured may strongly affect the performance of any phenotypic trait. As an example, the sign and strength of the relationship between NDVI and crop biomass may be affected by the crop stage when NDVI is measured. We might even add a third factor, which may somehow interact with the previous ones: Besides phenology, the growing conditions during evaluation will likely influence phenotypic values. This is illustrated again by the relationship between carbon isotope composition and biomass, where the strength of the relationship changes from well-irrigated plants to plants last irrigated two weeks before, a scenario frequently experienced by wheat under Mediterranean conditions where terminal drought (i.e., during grain filling, the last part of the cropping cycle) occurs. In other words, even analyzing the same organ (the flag leaf in our study), the information derived from δ13C is not similar but is affected by growing conditions.

2. Materials and Methods

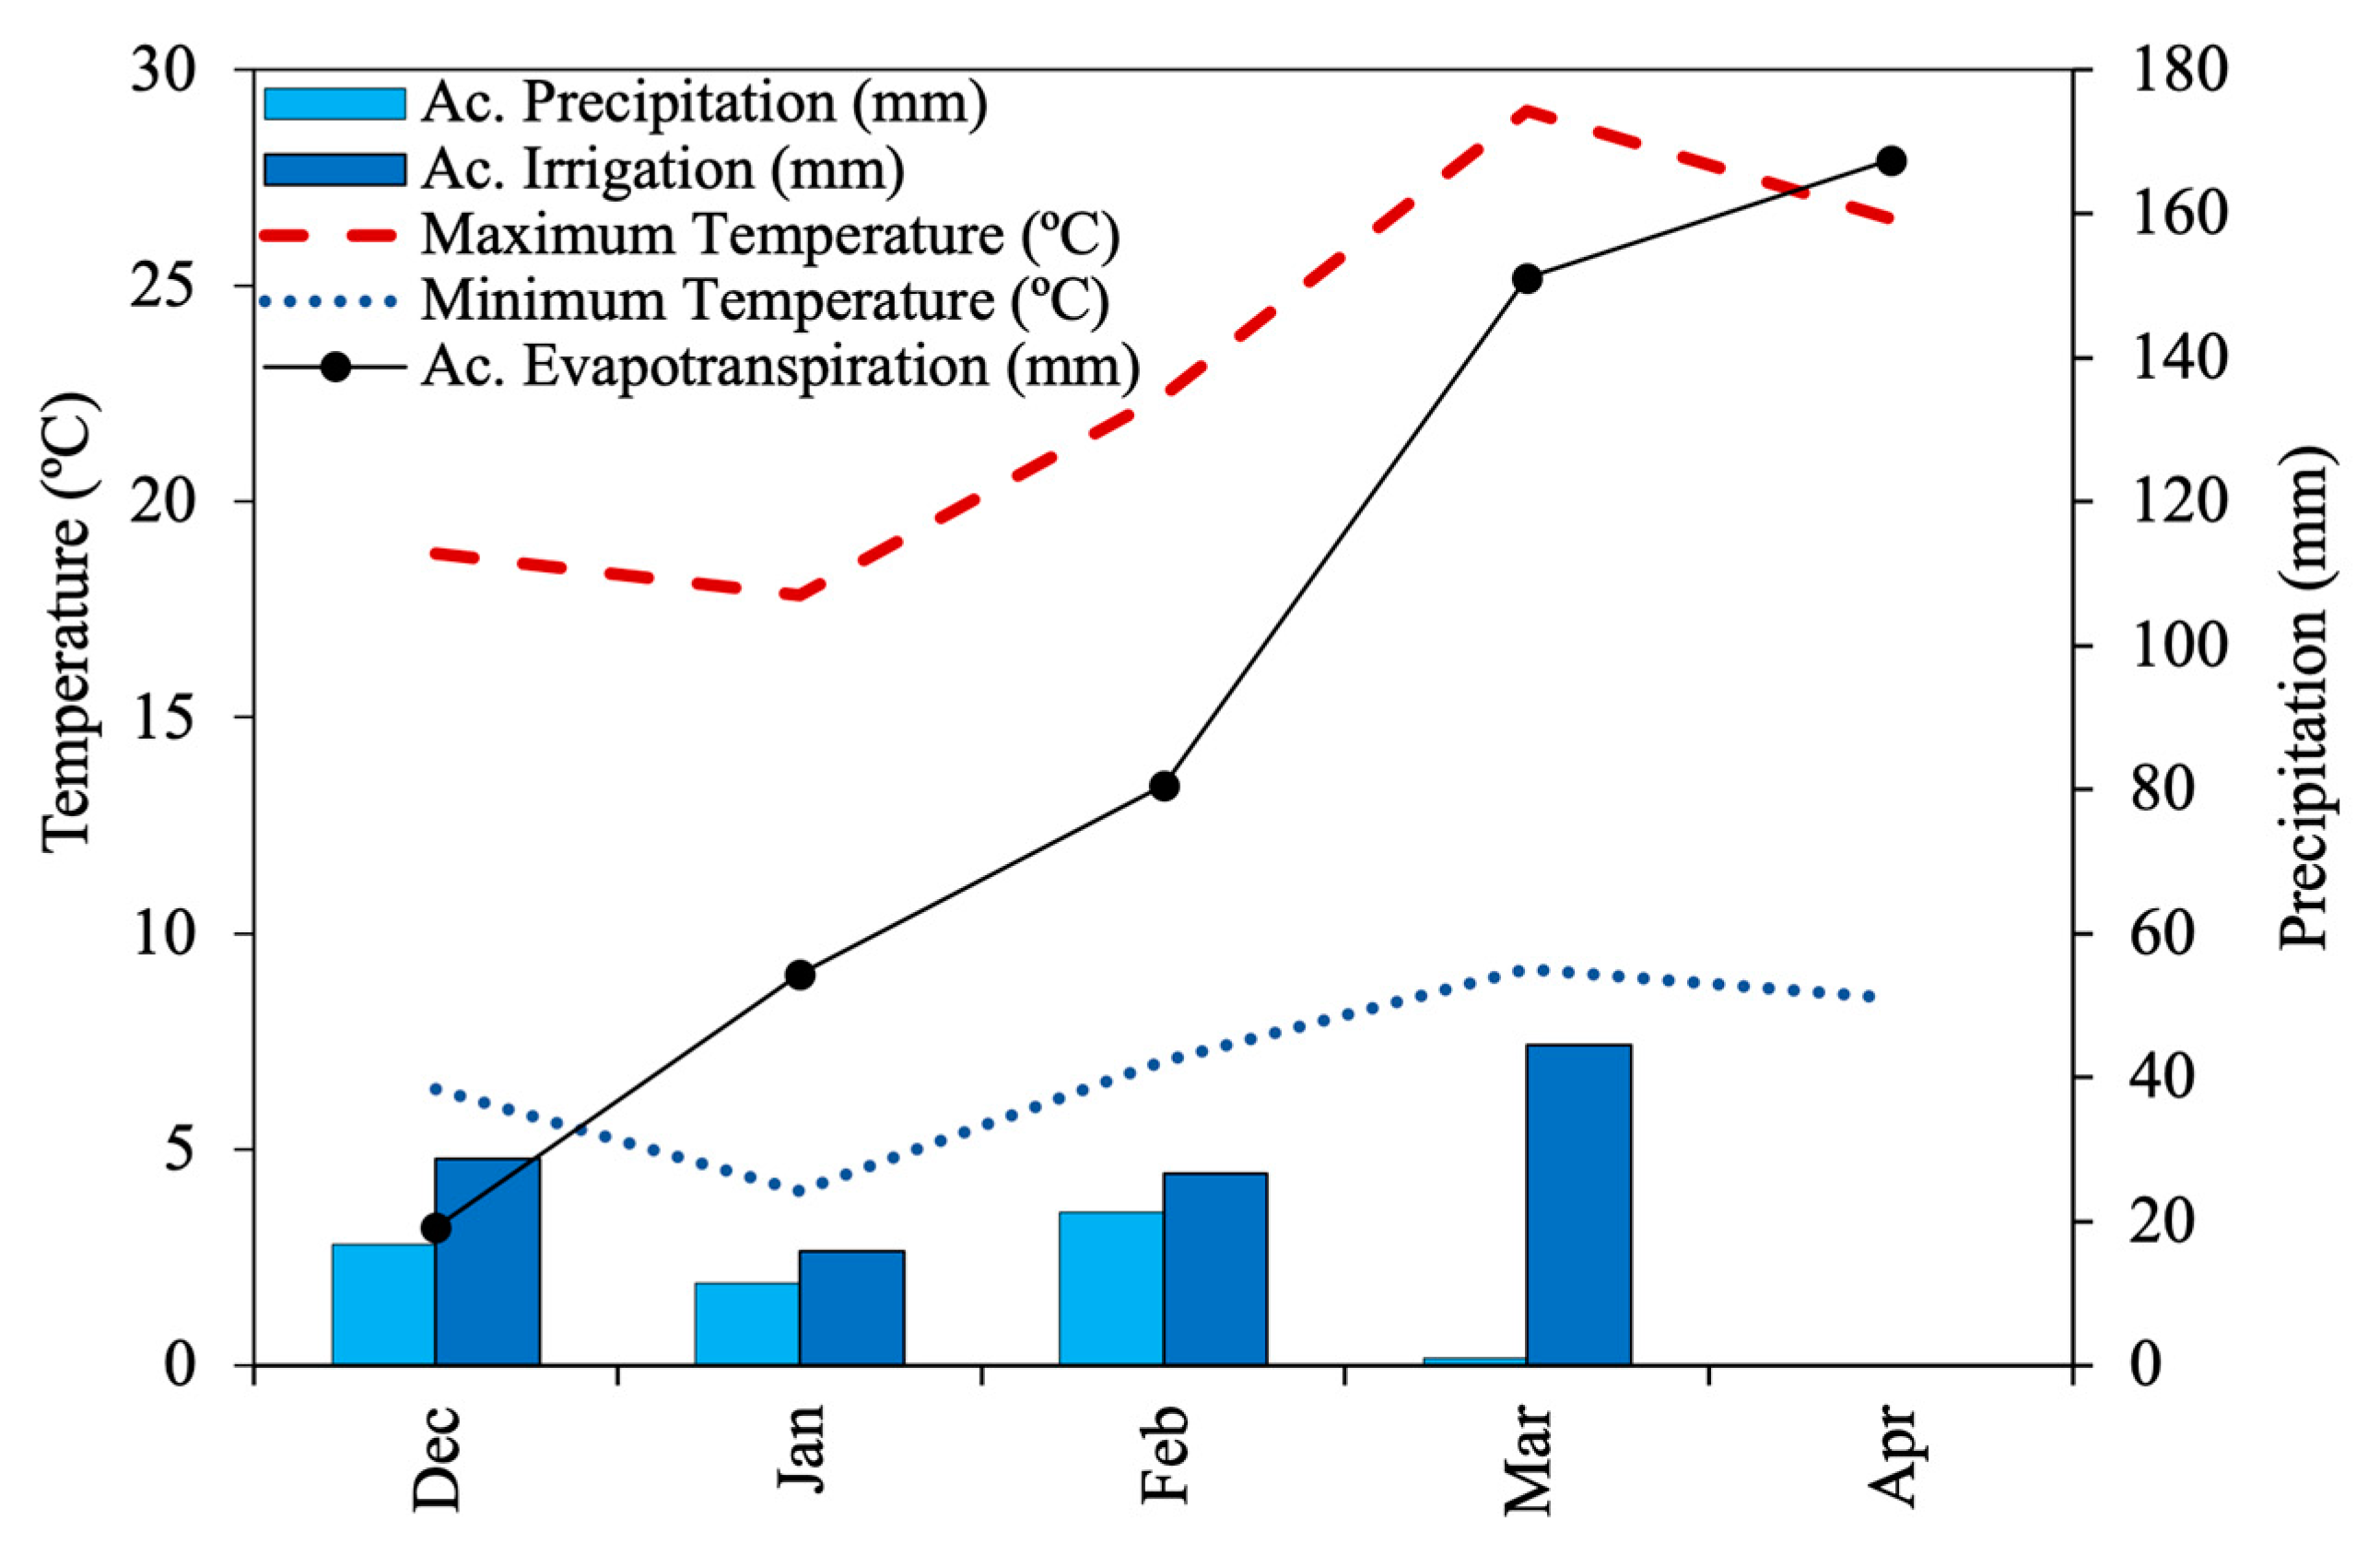
2.1. Germplasm Used and Experimental Conditions

The field experiment was conducted during 2016 at the Maricopa Agricultural Center (33.070° N, long. 111.974° W, elev. 360 m) (Supplementary Figure S1) on a Casa Grande sandy loam soil (fine-loamy, mixed, superactive, hyperthermic Typic Natrargids). The plant material included 248 accessions of durum wheat (Triticum turgidum L. subsp. durum (Desf.) Husn.) from the association mapping population assembled by Maccaferri and co-workers at the University of Bologna (UNIBO), namely the UNIBO-Durum Panel representing an Elite Durum Panel (EDP) that comprises a large portion of the genetic diversity present in the most important improved durum wheat gene pools. EDP encompassed Mediterranean-adapted accessions from different private and public international breeding programs and included elite cultivars and lines originally collected from Mediterranean countries, Mexico, Australia, Europe, and the Southwestern USA [23]. The accessions were planted on 20 December 2016 according to a Randomized Complete Block Design (RCBD) with two replicates and border plots (consisting of durum wheat cv. Orita). Each accession was evaluated in two-row plots (3.5 m long, 0.76 m apart) with a final density of 22 plants m−2. Prior to sowing, the experiment received 112 kg ha−1 of nitrogen and 56 kg ha−1 of phosphorus (P205). Phenology was assessed visually using Zadoks decimal code and flowering time was assessed as the number of days to reach anthesis between the latest and earliest accessions, assigning zero to the earliest accession (Supplementary Table S1). Disease and insect pest pressure were negligible throughout the crop cycle.
Initial irrigations were provided by sprinklers and further irrigations were delivered via subsurface drip irrigation. The field received a total of 115 mm of water distributed from 15 irrigations (4 by sprinklers and 11 by subsurface drip). Drip irrigation was stopped on 16 March 2017, which corresponded to growth stage (GS) 45 (averaged across the 248 accessions) according to the Zadoks decimal code [48], and from that date the accessions were subjected to a progressive drought stress until 3–4 April 2017 (averaged GS 62) when plants were harvested to measure biomass.
The accumulated precipitation from planting to crop harvest was 50 mm, while the accumulated potential evapotranspiration from planting to the last irrigation was 222 mm and from planting until crop harvest was 320 mm (Figure 1). Environmental conditions during growth are detailed in Figure 1.

2.2. NDVI Measurements

UAV-based NDVI data were extracted from georeferenced orthomosaic Geostationary Earth Orbit Tagged Image File Format (GeoTIFF) files generated from images captured by autopiloted flights of a Parrot Sequoia (Parrot, Paris, France) multi-spectral camera (referred to as SE), carried on an eBee (SenseFly, Lausanne, France) fixed-wing aircraft, and a MicaSense RedEdge (MicaSense, Seattle, WA, USA) multi-spectral camera (referred to as RE), carried on a hexacopter. Differences between the two multispectral cameras were mainly based on band centers and bandwidths as described in [23]. The purpose for using cameras with slightly different band centers and bandwidths was to explore the phenotypic performance of the NDVI generated with the two multispectral sensors. The flights were performed at a height of 40 m to 42 m from ground level where it was possible to achieve a ground sampling distance of 4.4 cm/pixel for the Sequoia and ~3 cm/pixel for the RedEdge. Mission planning was undertaken with either eMotion 3 (senseFly, Lausanne, France) or Atlas Flight (MicaSense, Seattle, WA, USA) software for the Sequoia camera and with UgCS software (UgCS, Riga, Latvia) for the RedEdge camera. An 80% image overlap along the flight corridors was achieved for all flights. Both the Sequoia and RedEdge cameras use global shutters. Orthomosaics for each camera band were generated with Pix4DMapperPro desktop software (Pix4D SA, Prilly, Switzerland, http://pix4d.com), as explained elsewhere [23]. Real-time kinematic (RTK) survey precision was used to geolocate six to eight ground control points (GCPs) and to georeference the orthomosaics. At the beginning of each flight, manufacturer-supplied reflectance panels were imaged in order to calibrate camera images. QGIS software version 2.18.3 (QGIS, Zurich, Switzerland, http://www.qgis.org) was used to create plot-level NDVI means from UAVs. Spatial adjustment analysis of the raw NDVI plot data from aerial platforms was conducted with the lme4 package (r-project) and custom R scripts using a mixed procedure including random effects of columns and rows and a moving mean of variable size for optimizing spatial adjustment. Annotated, single-plot polygons enclosed by shape files were generated with an R (r-project.org) script. Based on RTK survey-grade measuring devices, shape files with GCPs as features (points) were also employed. NDVI orthomosaics generated from Pix4D and the GeoTIFF were combined with the GCP shape files and the plot polygon in a single QGIS project. Verification of proper geolocations of the Pix4D orthomosaics was performed by visually confirming the alignment of the visible GCPs with the corresponding points in the feature shape file. The Zonal Statistics function in QGIS was used to generate NDVI plot means. NDVI was measured at multiple times using RE and SE sensors. NDVI based on SE sensor was measured on 13 and 21 February and 3 and 13 March 2017, whereas NDVI based on RE sensor was measured at two different time points on 21 and 28 March 2017.

2.3. Dry Biomass Evaluation

At the end of the field trial, plants within the entire two-row plots were harvested mechanically (Carter Manufacturing Company, Brookston, IN, USA) and the weight was adjusted to 0% moisture. Plant moisture content (%) at harvest was estimated from a subsample of biomass from 2–3 plants, either placed directly in a drying oven or stored temporarily in an uncooled greenhouse that reached a diurnal high temperature of 60 °C before being transferred to an oven at 60 °C for final drying.

2.4. Total Nitrogen and Carbon Content and Carbon Isotope Composition

On 17 March (the day after the final irrigation, i.e., before water stress induction) and 30 March (about two weeks after drought induction) six representative leaves (the flag leaf, if present, or the most recent fully developed leaf) from main tillers were collected per plot, oven dried at 70 °C for 48 h, weighed, and finely ground for carbon isotope analysis. The stable carbon isotope composition (δ13C) together with the total carbon and nitrogen concentrations of the control (17 March) and stressed (30 March) leaves were determined using an elemental analyzer (EA; Flash 1112 EA, Thermo Fisher Scientific, Bremen, Germany) coupled with an isotope ratio-mass spectrometer (IRMS; Delta C with CONFLO III interface, Thermo Fisher Scientific, Bremen, Germany) operating in continuous-flow mode in order to determine the stable carbon (13C/12C) isotope ratios of the same samples. Samples of approximately 1 mg of total dry matter (DM) for the dry biomass and reference materials were weighed into tin capsules, sealed, and then loaded into an automatic sampler (Thermo Fisher Scientific, Bremen, Germany) before EA-IRMS analysis. The 13C/12C ratios of the plant material were expressed in δ notation [49]: δ13C = (13C/12C)sample/(13C/12C)standard − 1, where “sample” refers to plant material and “standard” to international secondary standards of known 13C/12C ratios (International Atomic Energy Agency (IAEA) CH7 polyethylene foil, IAEA CH6 Sucrose, and the United States Geological Survey (USGS) 40 l-glutamic acid) calibrated against Vienna Pee Dee Belemnite calcium carbonate with an analytical precision (SD) of 0.10‰. Total carbon and nitrogen contents were expressed as a percentage of the dry matter (%). Measurements were carried out at the Scientific Facilities of the University of Barcelona. The δ13C of the samples collected before drought induction (17 March) and two weeks after (30 March) are referred to as δ13C control and δ13C stress, respectively.

2.5. Statistical Analysis

NDVI measurements, phenology, δ13C, and total carbon and nitrogen contents were subjected to one-way analysis of variance (ANOVA) using the general linear model to calculate the effect of crop growth prior to anthesis and progressive drought from anthesis to mid grain filling. For the NDVI, the date of measurement was included as a fixed factor in the ANOVA, whereas in the δ13C it was the absence of irrigation. Means were compared by Tukey’s honestly significant difference (HSD) test. A bivariate correlation procedure was constructed to analyze the relationships between the measured traits and plant dry matter. Descriptive statistics of agronomic variables were estimated, and analysis of principal components (PCA) and stepwise analysis were calculated using the SPSS 18.0 statistical package (SPSS, Chicago, IL, USA).

3. Results

3.1. General Characteristics of the Elite Durum Panel (EDP)

The EDP ranged from 0 to 35 days between extreme accessions in terms of date of anthesis. The dry biomass harvested two weeks after the last irrigation and averaged across the genotypes of the EDP was 2.67 Mg ha−1 (Table 1). The Normalized Difference Vegetation Index (NDVI) increased as crop development progressed, reaching its maximum around anthesis (Table 1). Thus, the lowest NDVI value, averaged across the EDP, was 0.548 (measured with the SE sensor) and was measured on 13 February, corresponding on average to GS 31 on the Zadoks phenological scale [48]. The highest NDVI average value was 0.879, using the SE sensor, which corresponded to a value of 0.829 (when measured with the RE sensor). This measurement took place on 21 March, five days after the last irrigation. Twelve days after the last irrigation (28 March), which corresponded on average to the GS 58 stage, the NDVI (RE) decreased to 0.772.
Control plants showed lower values for δ13C (more negative δ13C) compared to water-stressed plants (Table 2). Total C and N concentrations were higher after drought induction, although in the one-way analysis of variance the effect of drought was more significant in C than N, as observed from the higher values of the mean squares in the former (Table 2).

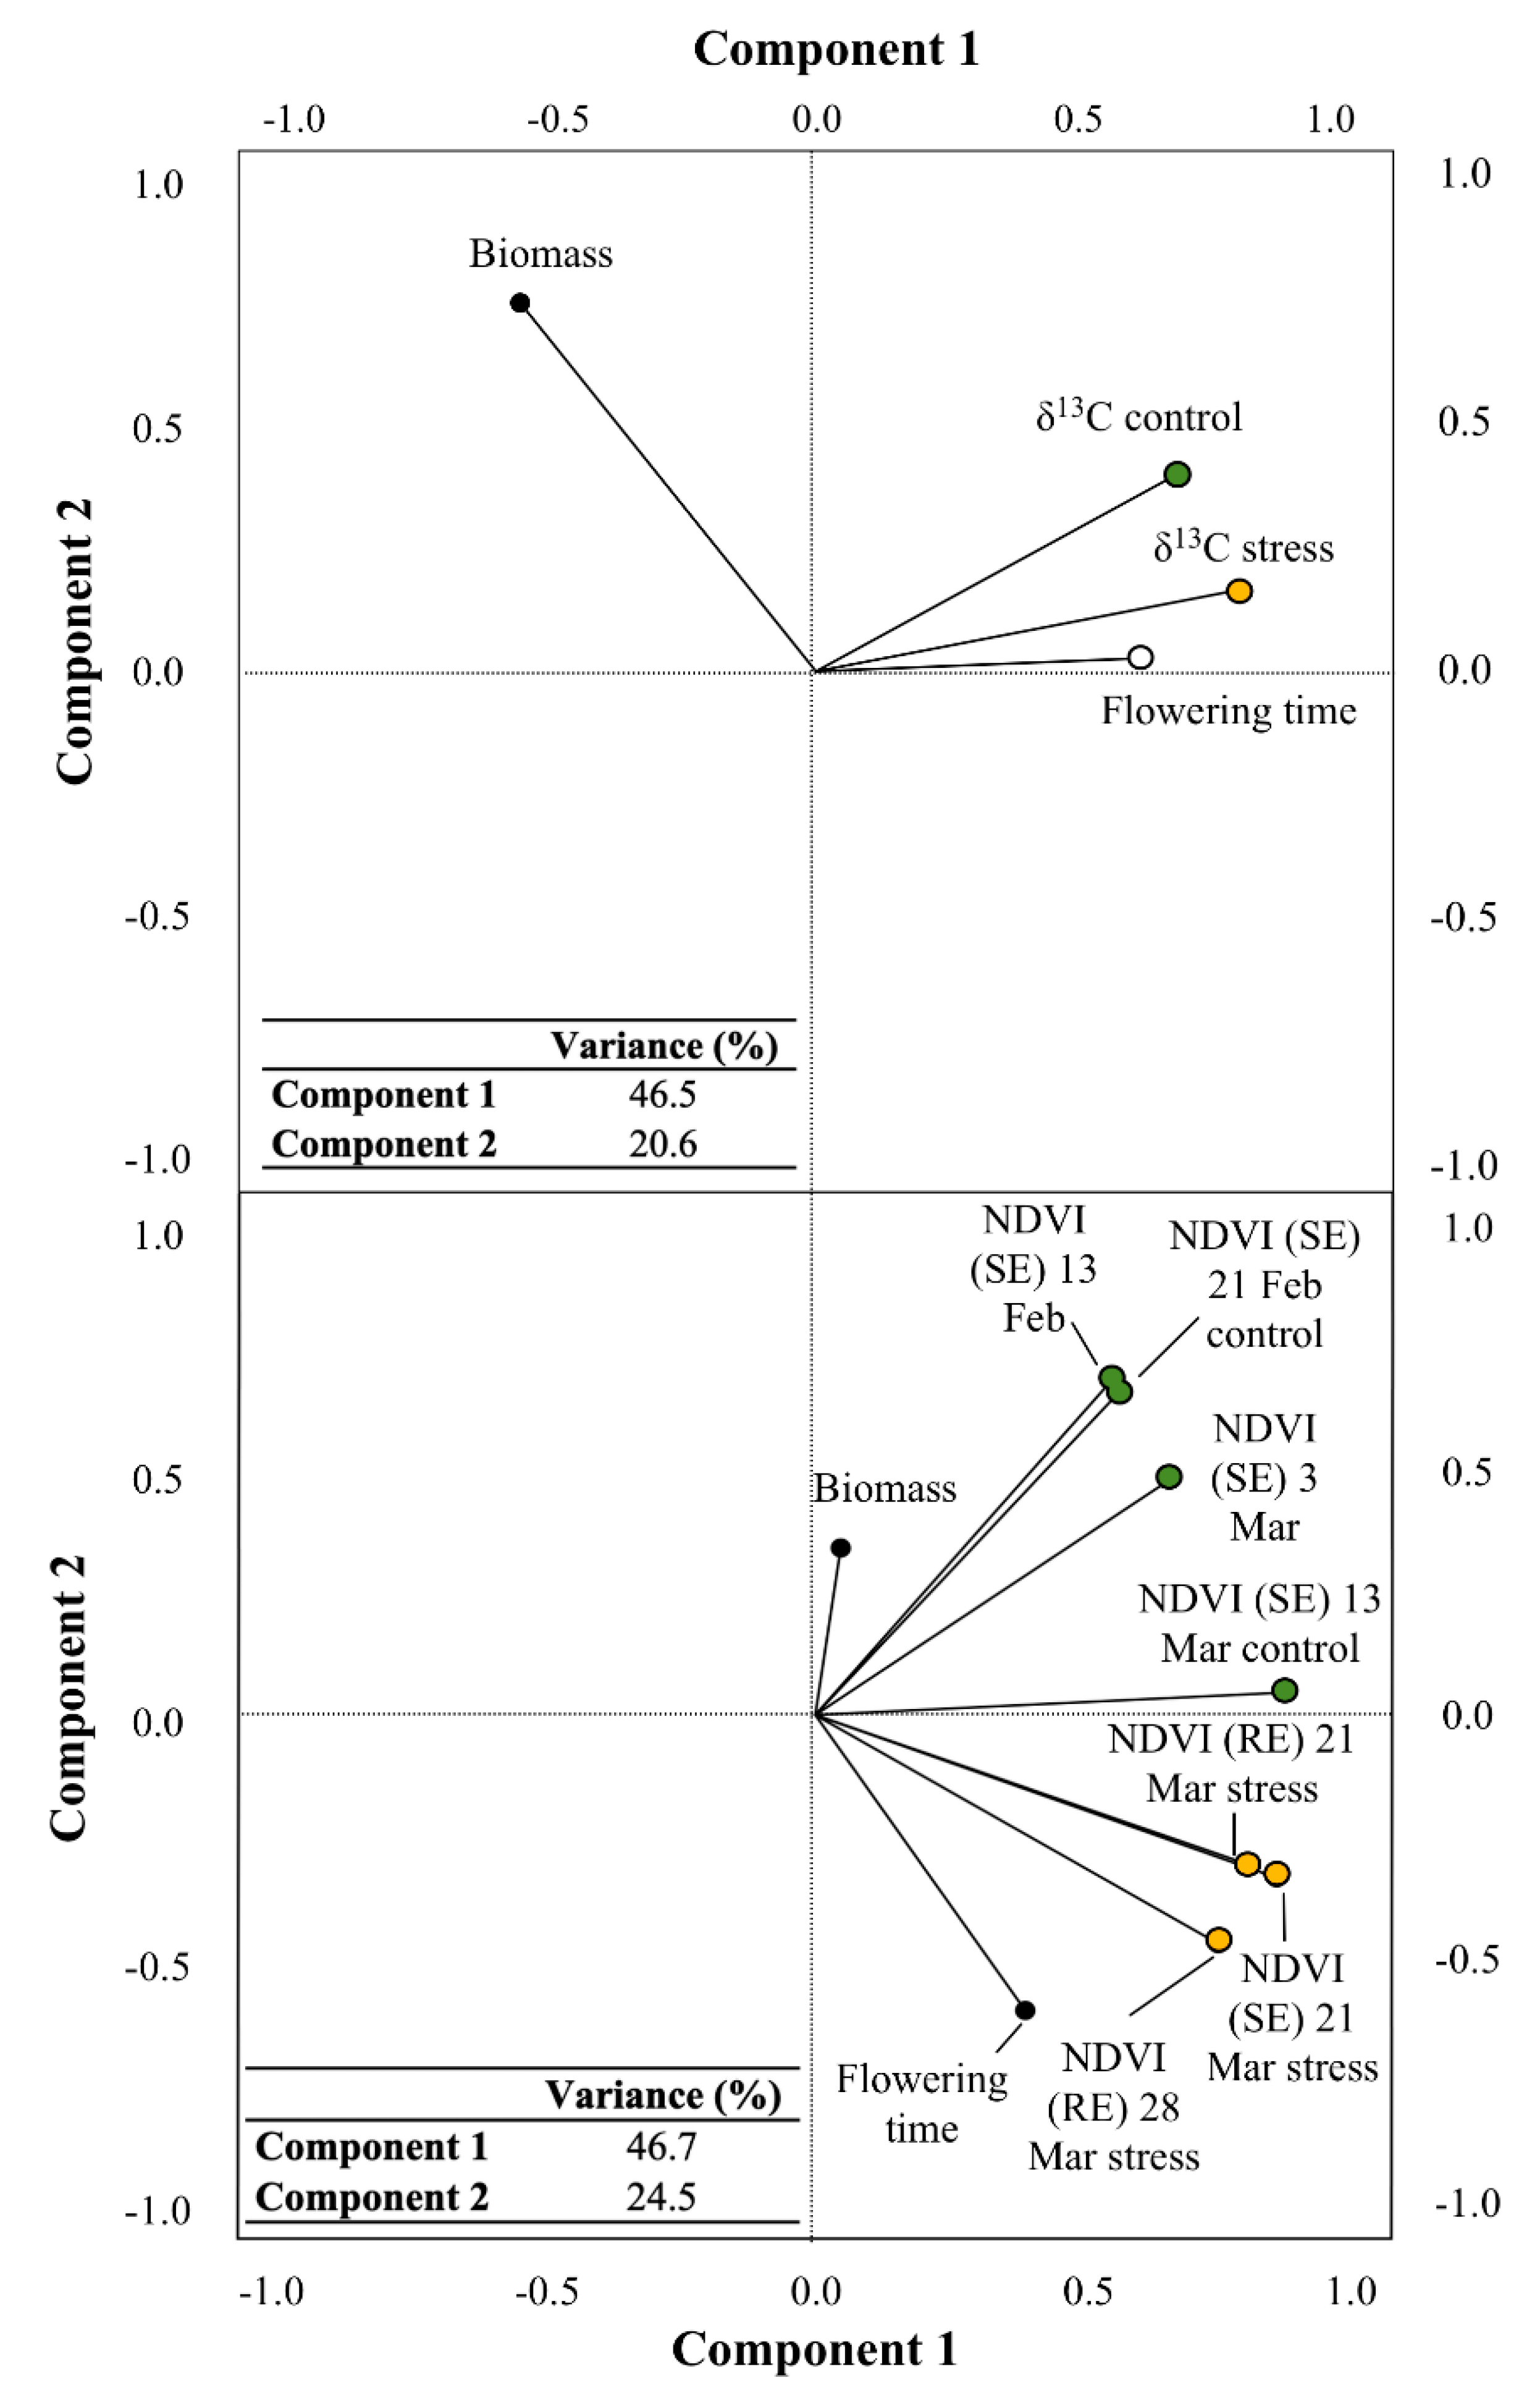
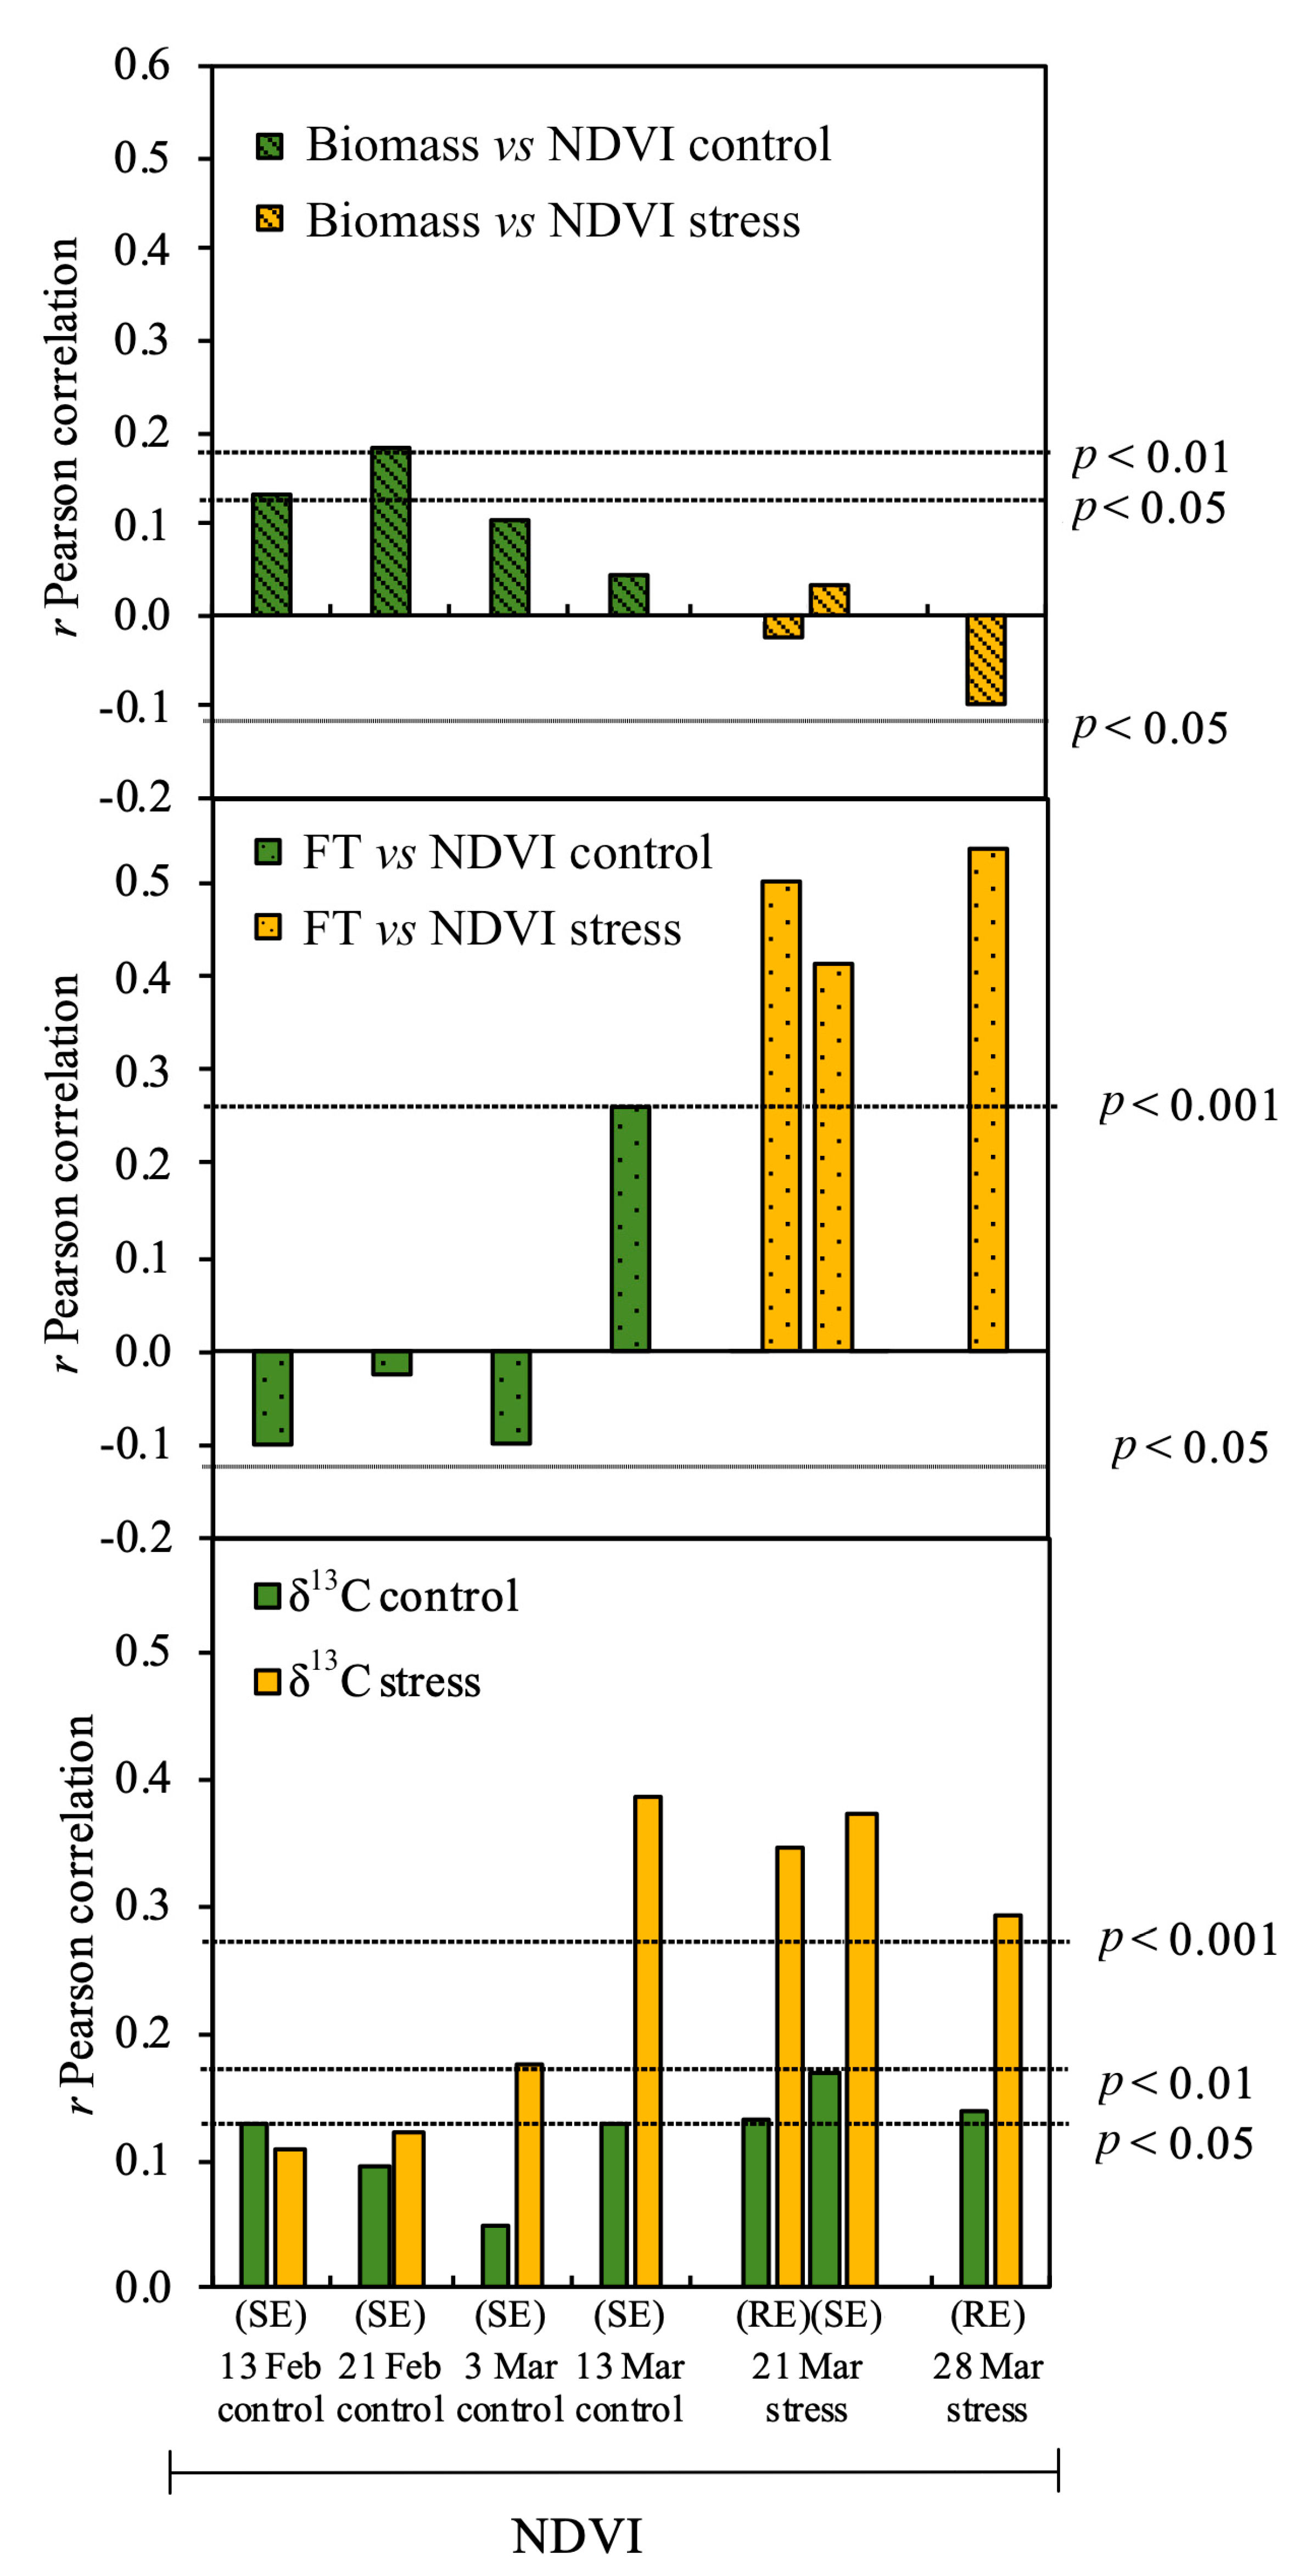
3.2. Relationship between Studied Parameters and Biomass

Principal component analysis (PCA) showed that the δ13C of stressed plants was negatively correlated with plant biomass (Figure 2, upper panel), whereas the δ13C of control plants did not show a clear relationship to the biomass (because a perpendicular angle was observed between the two parameters). The δ13C (either control or stressed plants) showed a positive relationship with the flowering time, suggesting a sensitivity of δ13C to the wide range of phenologies present in the EDP (Figure 2, upper panel). Biomass was also sensitive to phenology, as observed by its negative relationship to flowering time in the PCA, with early accessions being related to higher biomass, whereas late accessions showed lower biomass (Figure 2, upper panel).
Considering the NDVI measurements at different time points, the NDVI (SE) measured at early time points during crop development and before drought induction (13 and 21 February) showed a closer and positive relationship to the biomass (Figure 2, lower panel). In contrast, the NDVI measured after the last irrigation (i.e., under increasing drought conditions) was poorly correlated with biomass, as observed by the perpendicular angle between the biomass and the NDVI (RE) measured at the later time points (21 and 28 March). However, the NDVIs measured after drought induction were closely correlated with flowering time in the PCA (Figure 2, lower panel), suggesting that these NDVIs primarily represented the ‘greenness’ of late-phenology accessions, which are associated with a lower biomass (as observed by the negative relationship between flowering time and biomass). In fact, when considering the accessions for each flowering time independently, no correlations were observed between biomass and NDVI in either the accessions with early or late phenologies (Supplementary Table S2). However, the NDVIs measured in accessions with early phenology (10 to 15 days to flowering time) tended to be positively correlated with biomass (meaning that early phenologies are associated with higher biomass, as observed in the PCA), whereas correlations in accessions with delayed phenologies (16 to 35 days to flowering time) tended to be negative (delayed phenologies are associated with a lower biomass).
Moreover, in accordance with the PCA, the linear regressions between the NDVI measured before anthesis in the absence of water stress (i.e., control plants) and biomass (Figure 3, upper panel) were positive and significant: r = 0.13 (p < 0.05) and r = 0.18 (p < 0.01), for NDVI (SE) measurements performed on 13 and 21 February, respectively. However, no correlation with biomass was observed when the NDVI was measured five days after the last irrigation (21 March), and the relationship tended to be negative and almost significant (p < 0.05) when the NDVI was measured nearly two weeks after the last irrigation (28 March). Moreover, linear correlation coefficients between flowering time and the NDVI changed from being non-significant before anthesis to positive and highly significant (p < 0.001) around anthesis, and further increased as drought advanced. Therefore, the positive relationship between NDVI and flowering time during the late stages of the crop (13, 21, and 28 March) was substantiated by the ‘greenness’ of the most delayed accessions (Figure 3, middle panel). Similarly, the δ13C of stressed plants showed positive correlations with NDVI (p < 0.001) and their strength increased progressively as NDVI was measured through drought induction (13, 21, and 28 March), whereas correlation between the δ13C of control plants and the NDVI did not clearly increase over time in the presence of drought (on average r ≅ 0.12, p < 0.05) (Figure 3, lower panel).
The δ13C in the stressed plants seemed to be the best parameter correlated with biomass as it was the first variable chosen in the multilinear model (stepwise analysis) combining the whole set of genotypes with all flowering times (global) and considering the biomass as the dependent variable (Table 3) and all NDVI and δ13C measurements as independent variables. However, when subsets of genotypes were considered on the basis of their flowering time alone, the results were different. When a flowering time range of 10 to 15 days was considered, the δ13C of the control plants was the first variable chosen by the multilinear model, whereas the δ13C of stressed plants was the first variable chosen for the subset of genotypes with a flowering time of 17 days (Table 3). For the subset of late genotypes, with a flowering time of 25 days, the variables chosen by the multilinear model were NDVIs measured after drought (28 March, followed by 21 March) (Table 3).

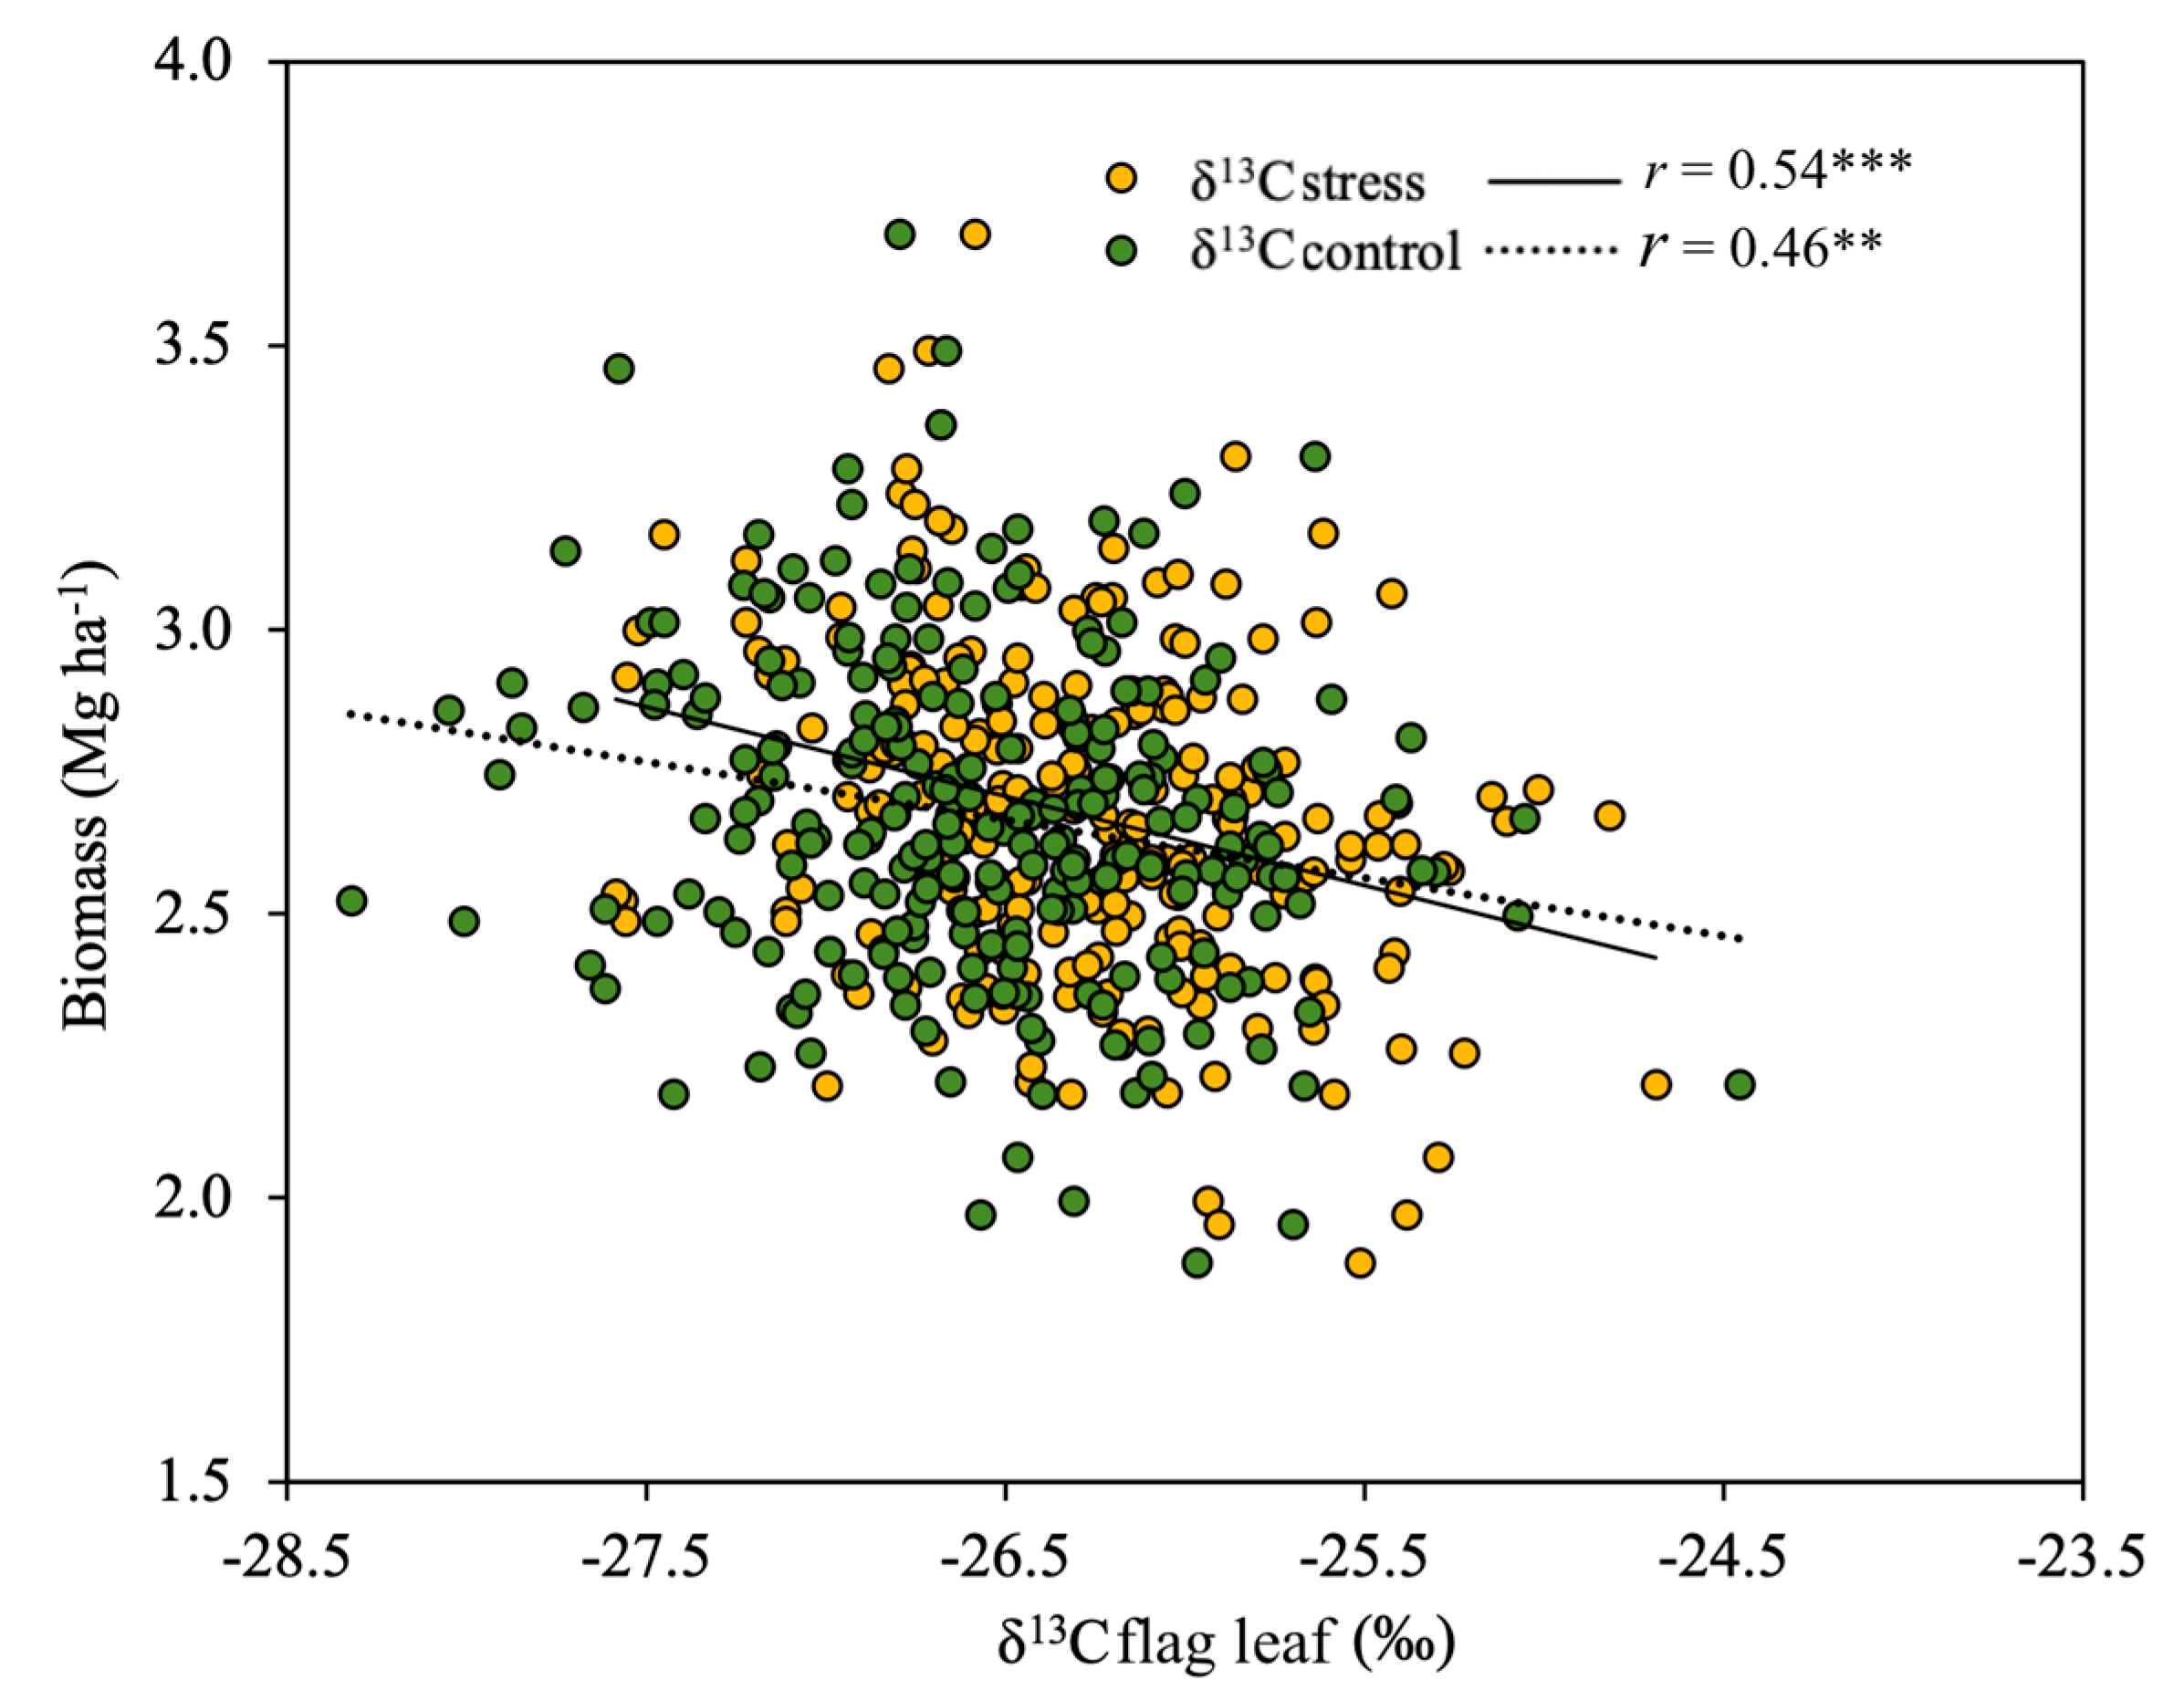
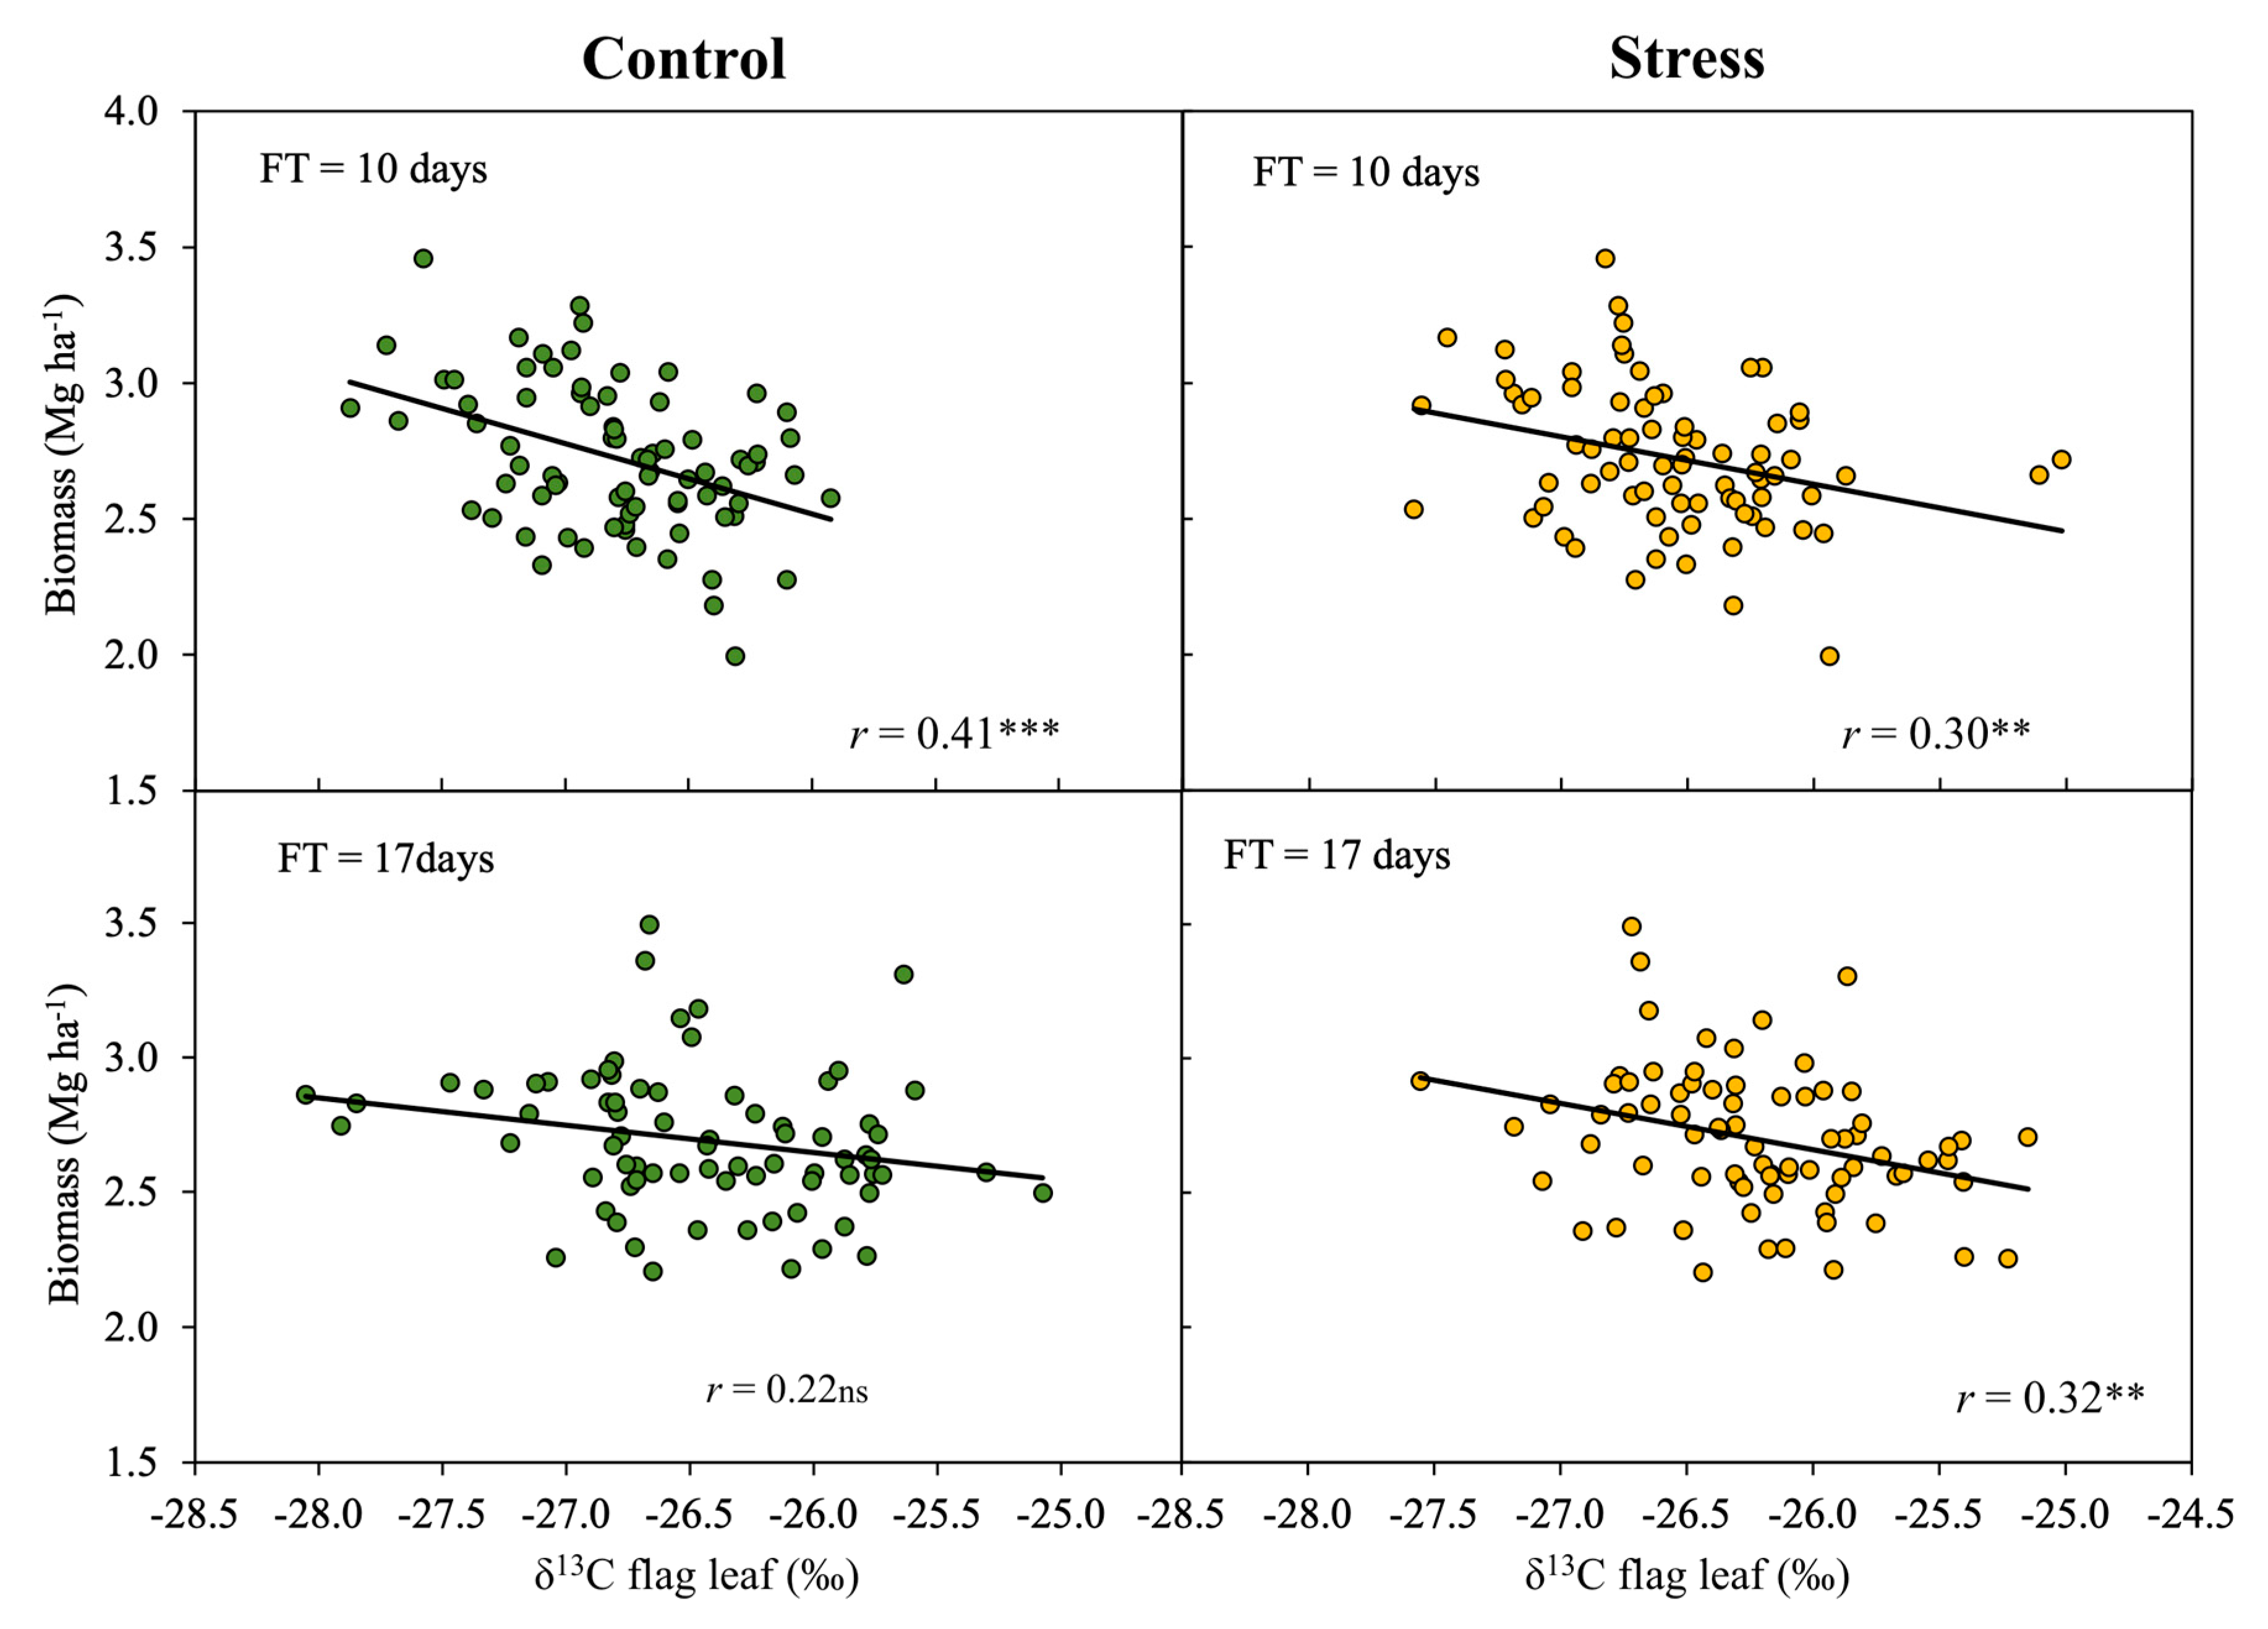
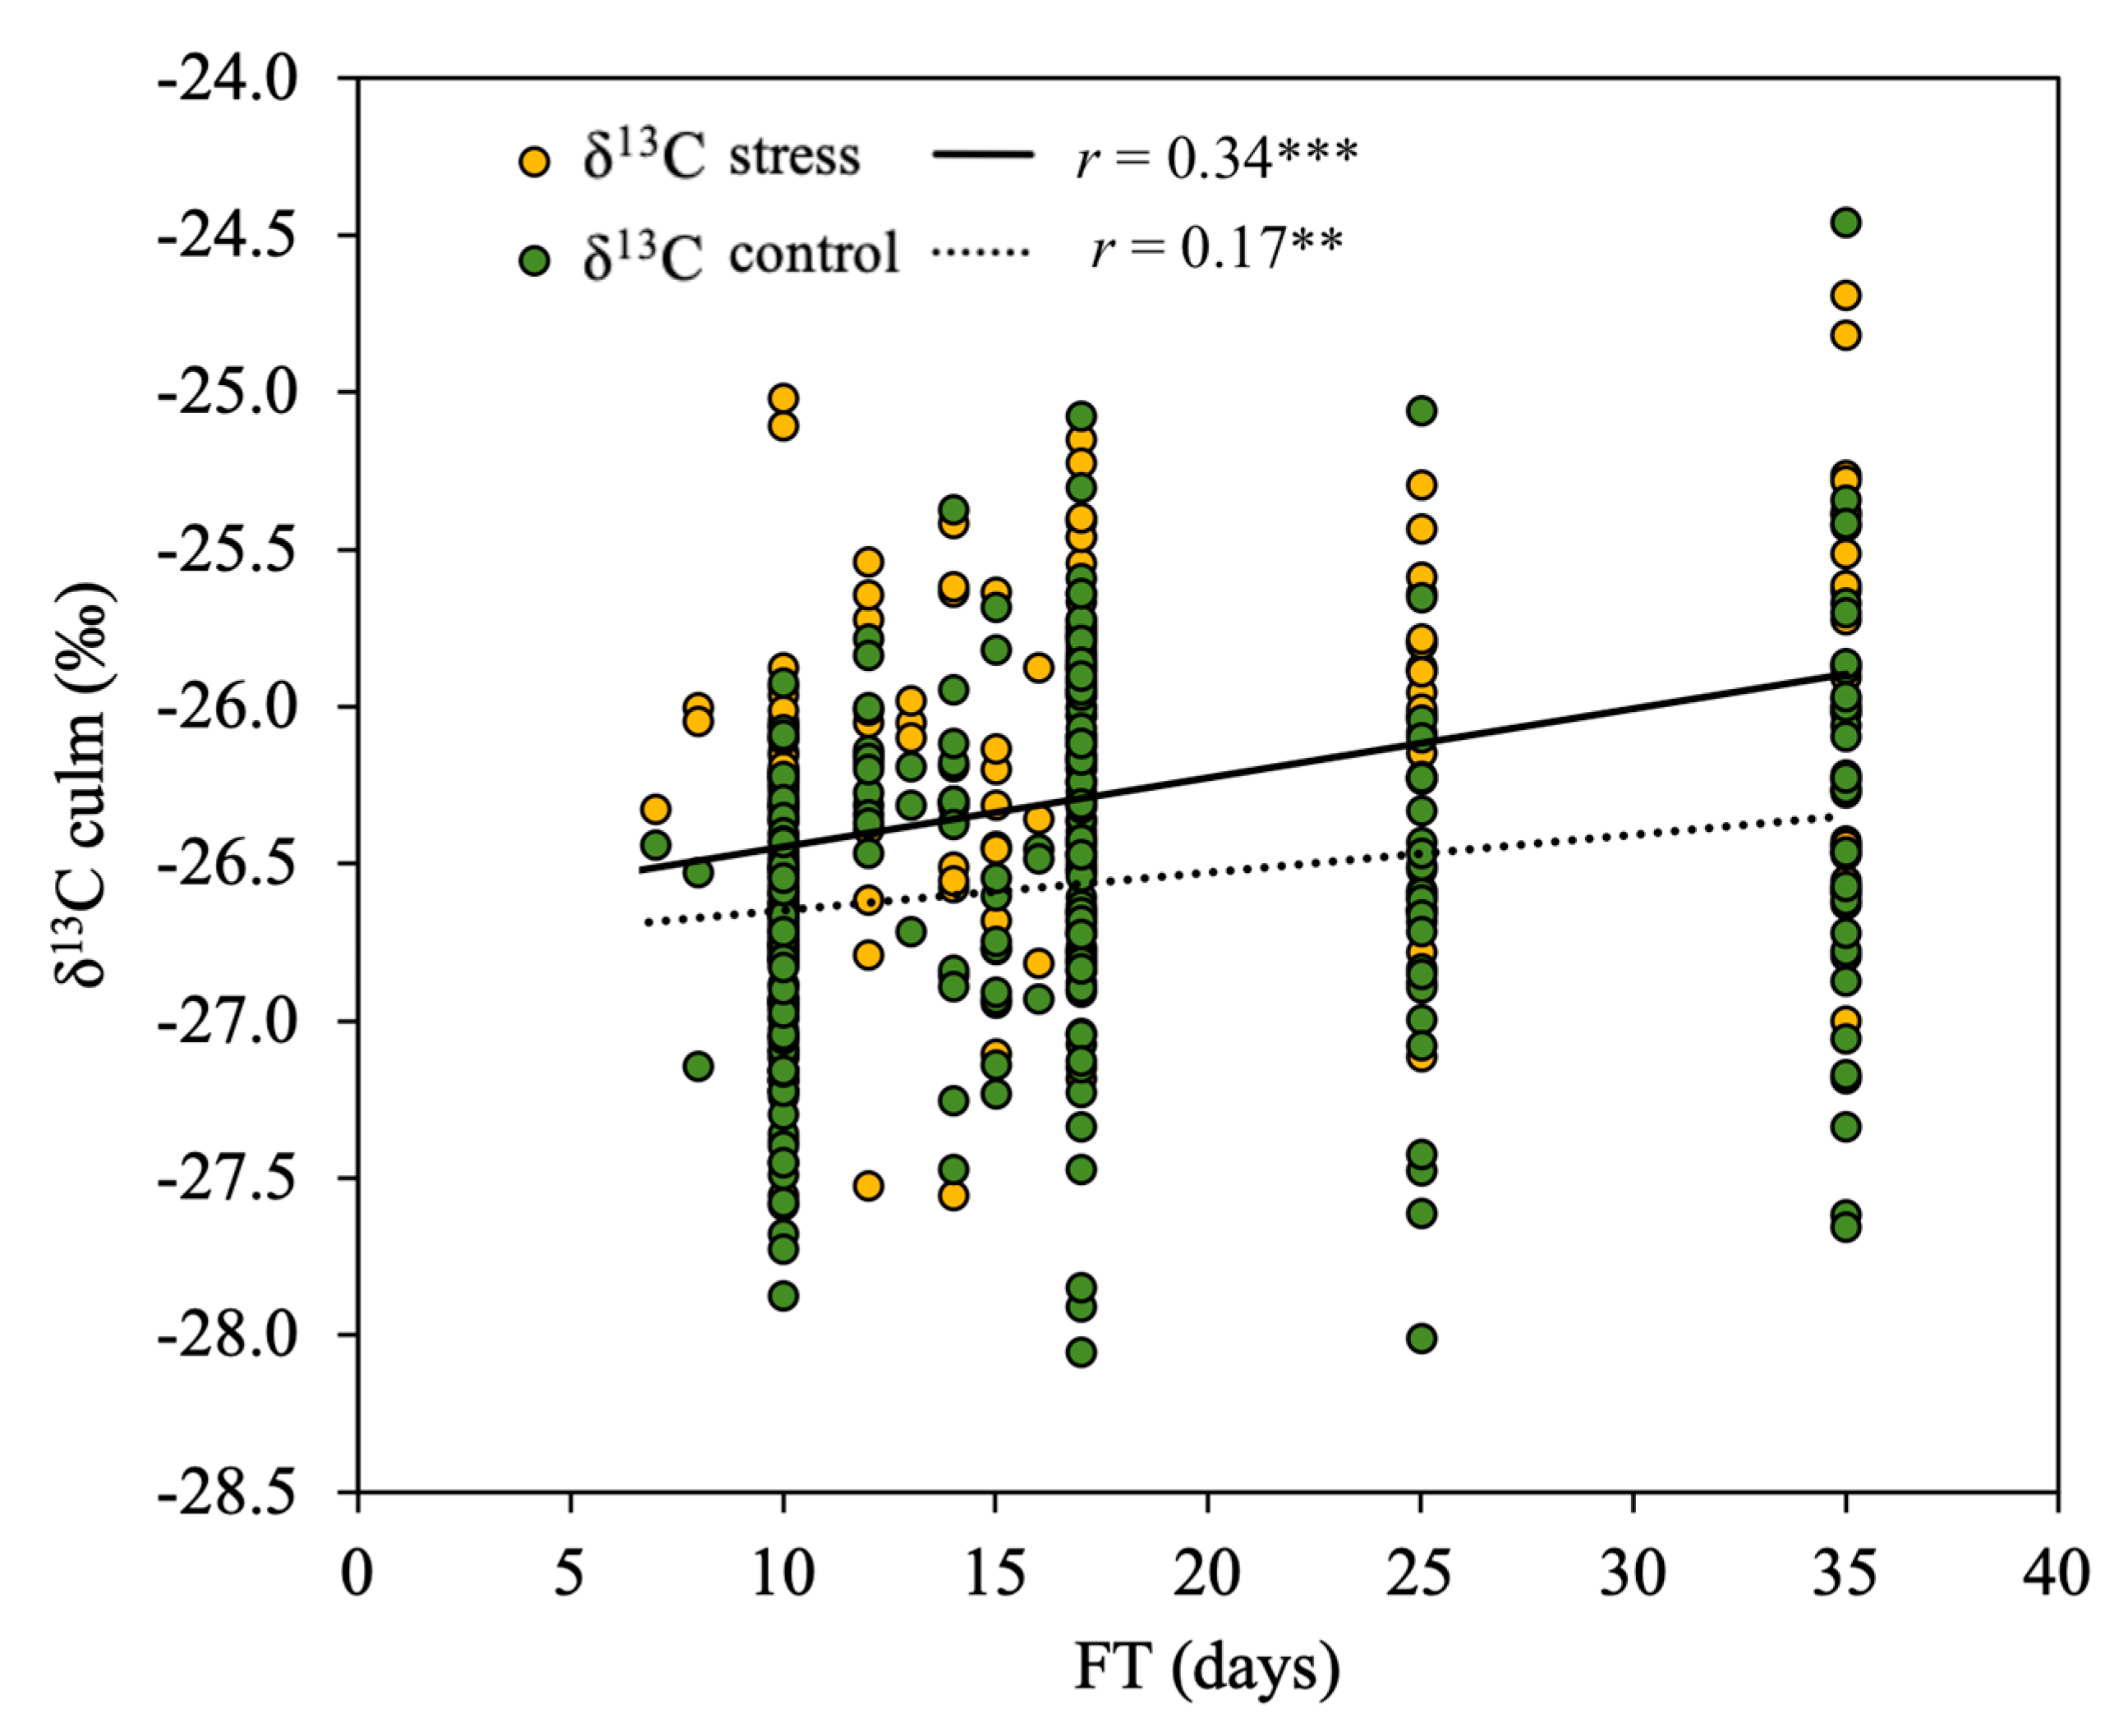
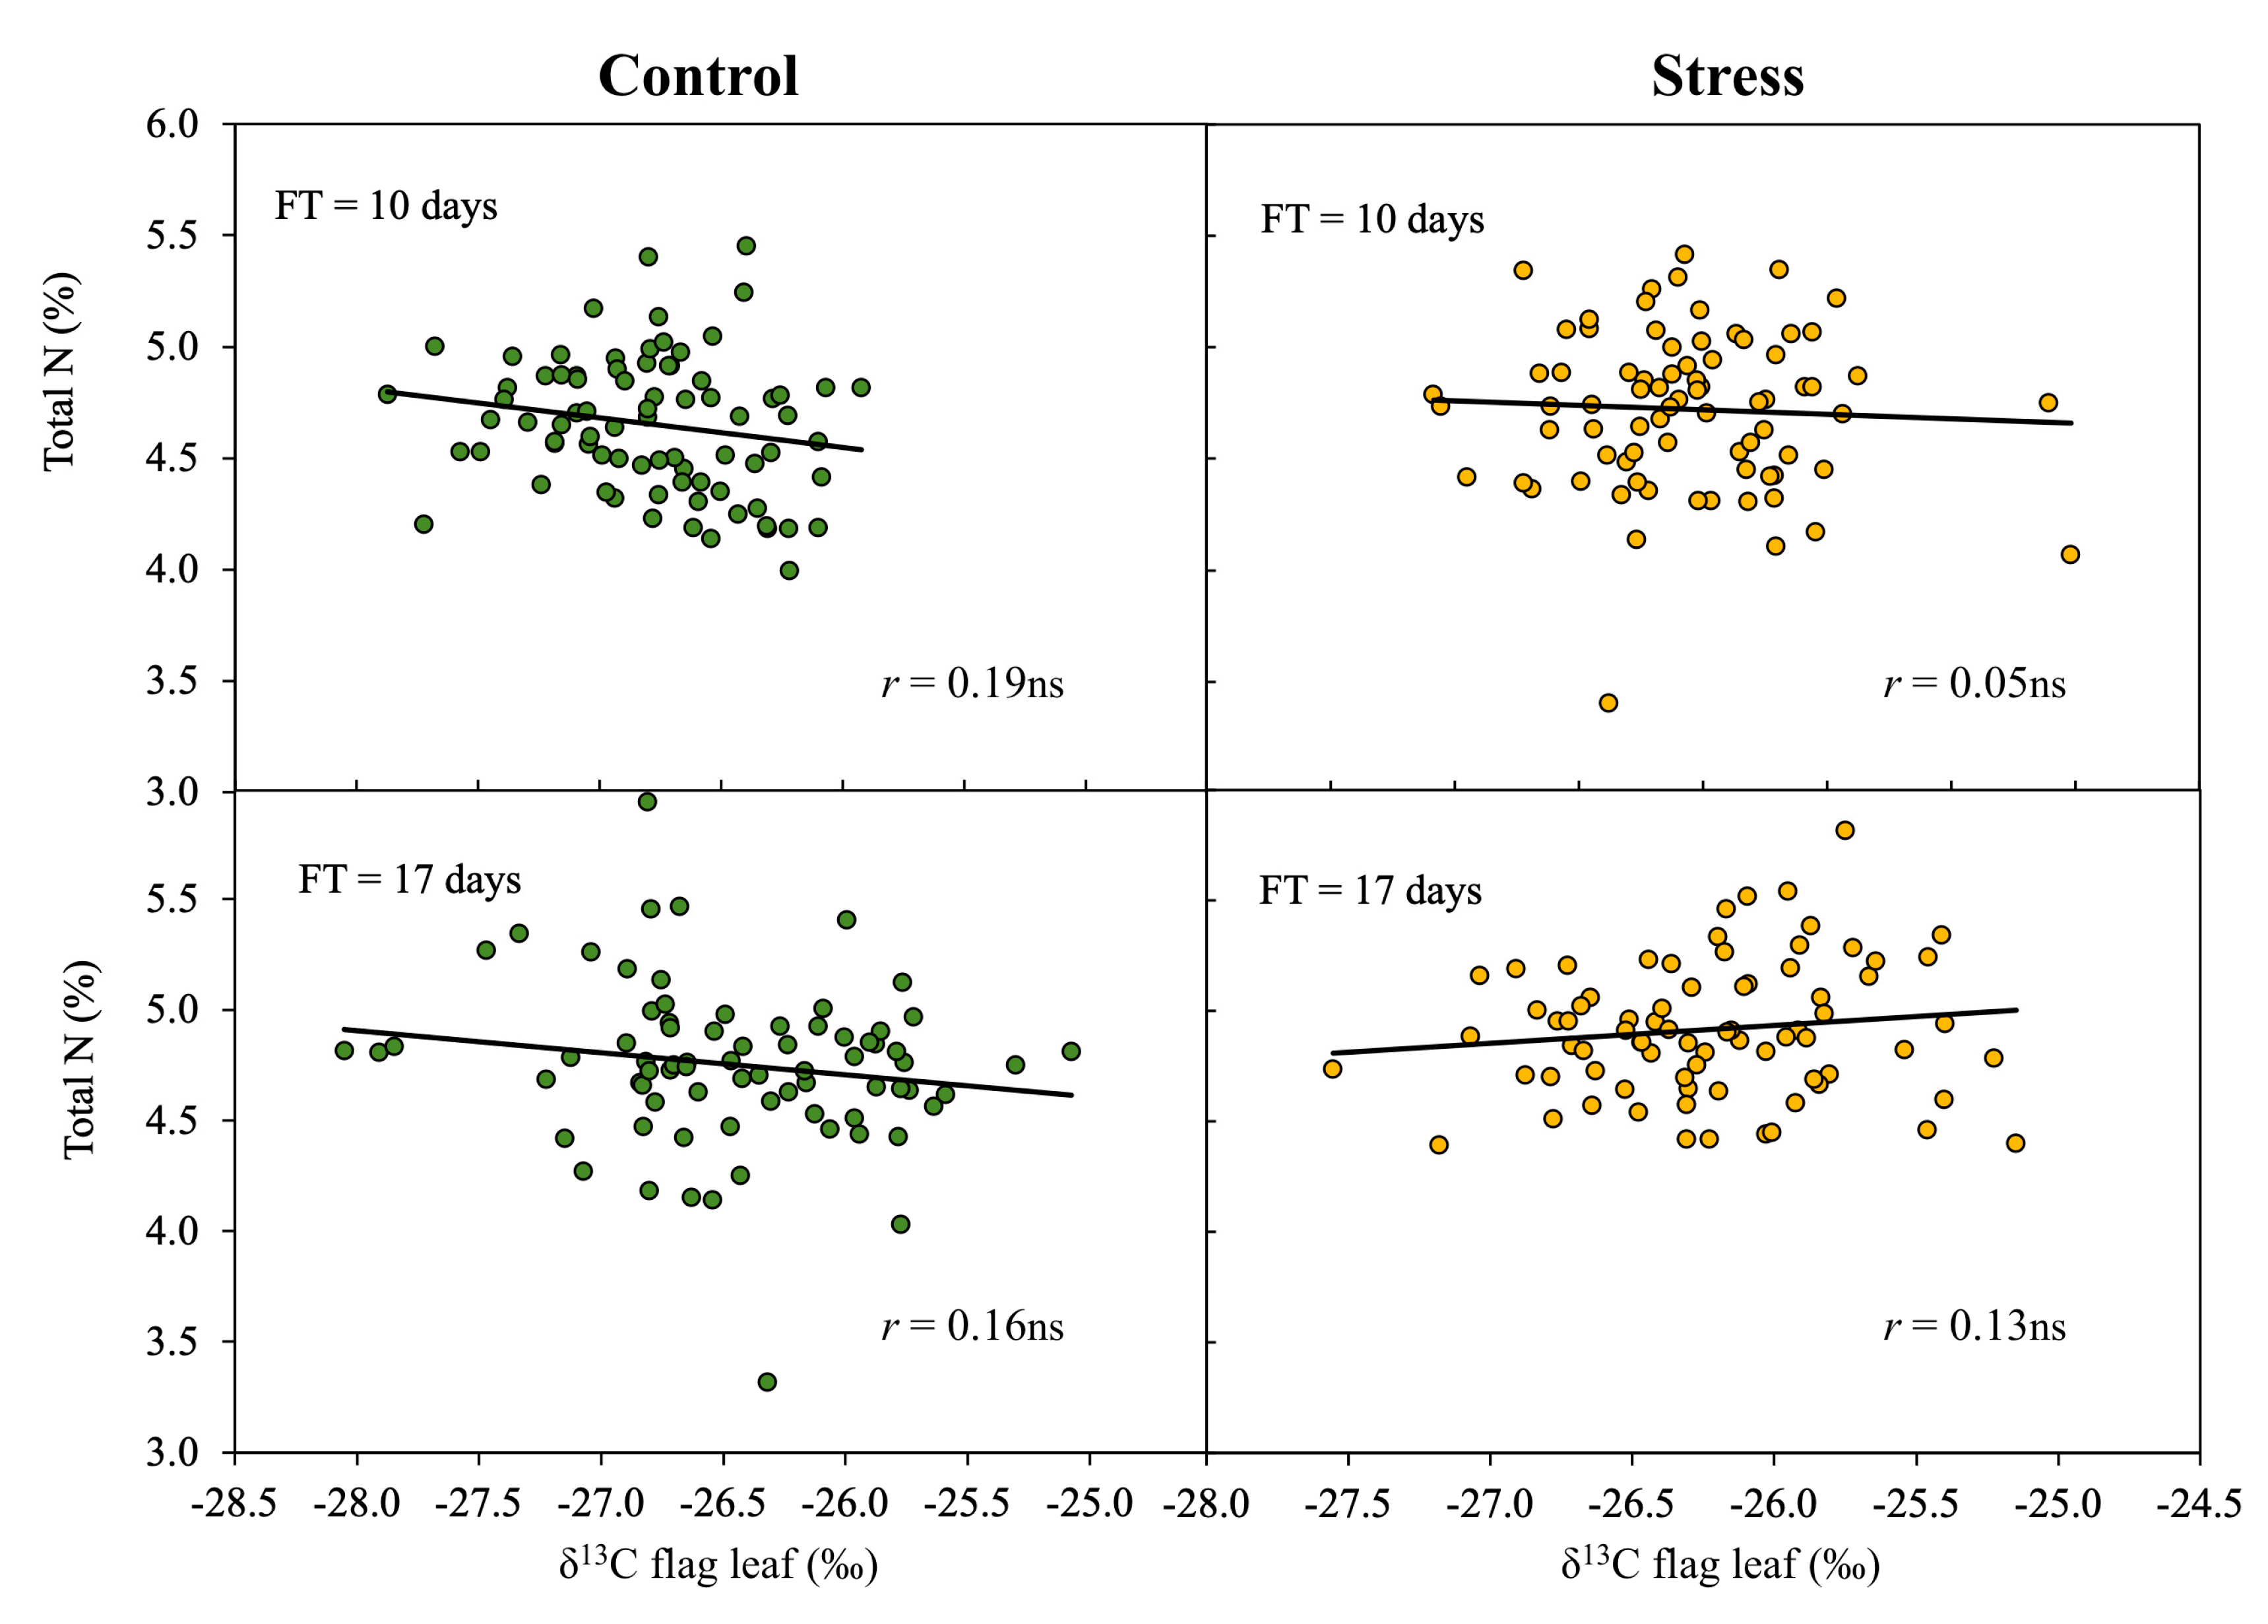
3.3. Effect of Phenology on the Relationship of δ13C to Biomass

Biomass was negatively correlated with the δ13C of stressed and control plants (Figure 4). However, the correlation between biomass and the δ13C was slightly improved in stressed plants (r = 0.54, p < 0.001) compared to control plants (r = 0.46, p < 0.01). Even so, considering the sensitivity of the δ13C to phenology (as observed by the close relationship between flowering time and the δ13C in the PCA, see above), correlations among biomass and δ13C for the subset of genotypes with specific flowering times were studied (Figure 5 and Supplementary Table S3). Such correlations still remained negative and significant at different flowering times (Supplementary Table S3), especially in accessions with earlier phenologies (flowering times of 10 and 17 days). Moreover, days to flowering was positively correlated with the δ13C of control plants and even more strongly with the δ13C of stressed plants (Figure 6). Thus, considering that one of the driving factors linked to the δ13C is the intrinsic photosynthetic capacity of the leaf, total N (used as a proxy for the intrinsic photosynthetic capacity) was correlated with δ13C (Figure 7). Both parameters showed no significant correlations in the control or stressed plants.

4. Discussion

4.1. Effect of Drought in the EDP Based on the NDVI and δ13C

To the best of our knowledge, this is the first study that estimates crop growth capacity, in terms of biomass at mid grain filling, in a panel of hundreds of durum wheat accessions by simultaneously measuring the NDVI via UAV-based remote sensing platforms and the δ13C at a plant level and using these parameters as proxies for plant growth, stay-green, and performance under different water conditions. In the present study, the UAV-based NDVI measured at different time points in the crop cycle reflected the increase in biomass during crop development until anthesis and the degree of stay-green during grain filling in response to progressive drought (Table 1). Regardless of the multispectral imager used (RE or SE), the NDVI increased from the early stages of crop growth along with increases in the green biomass and the ability of the crop to intercept radiation [50] and peaked (0.879, i.e., close to saturation) shortly after anthesis and five days after the last irrigation (21 March). Such peak on NDVI values has been observed in the past as a consequence of canopy closure [51,52]. In fact, on 21 March, the NDVI was recorded simultaneously with RE and SE multispectral cameras and the different band centers and bandwidths of the cameras did not significantly affect the NDVI correlation with biomass or the other traits, and this suggests that both sensor types produced comparable NDVIs. In other words, although absolute NDVI values were in some cases statistically different, pattern and significance of the relationships of NDVI with biomass and other traits were not affected by the sensor used. Fourteen days after anthesis (28 March), progressive canopy senescence (inferred from the decrease of NDVI values and the visual, on-ground observation of the lower plant leaves) during grain filling probably affected NDVI by reducing the reflectance in the near-infrared while the reflectance in the red part of the spectrum increased, most likely due to cell degeneration and chlorophyll loss [14,16,50] as well as decreases in cell water content [53]. Moreover, water-limiting conditions also affected the δ13C (Table 2). Thus, reductions in soil water content and increases in vapor pressure deficit (VPD) contributed to differential water use [35] increasing the δ13C of the plant biomass relative to control in our study as the season progressed. Higher δ13C values in the plant biomass under drought conditions were probably related to low stomatal conductance, causing a lower Ci/Ca, which is frequently associated with an increased WUE [30,33]. Nitrogen concentration values of the flag leaves were very high at the two sampling dates and even increased slightly after two weeks from the last irrigation, which suggests that senescence induced by the treatment was not severe and did not affect the upper leaves. In that sense, the decreased NDVI values observed two weeks after the last irrigation relative to the values obtained five days after the last irrigation might have an alternative explanation. A leaf-rolling effect resulting from water deficit stress [23,54] could have been an important factor that decreased the NDVI, as observed from the negative relationship between the NDVI and leaf rolling in a previous study in the same trial [23]. A methodological limitation of the NDVI is that this vegetation index tends to saturate beyond values of 0.65–0.70, which would be the case for both NDVI measurements taken on 21sand 28 March. However, notwithstanding this limitation, a small decrease was recorded between five days and two weeks after the last irrigation, suggesting plants were progressively experiencing senescence, leaf rolling, or a combination of both factors, after last irrigation.

4.2. Biomass Predictions in Early Stages of Crop Development in the EDP Based on the NDVI

NDVI measurements performed during the relatively early stages of crop development before anthesis and full water conditions were positively correlated with biomass at harvest (mid grain filling). This is in keeping with previous studies where NDVIs measured in the early stages of crop development have been positively correlated with biomass [55]. This is not trivial since biomass is correlated with yield and, in turn, yield is strongly correlated with the number of grains per area, a component that is basically determined in the early stages of crop development [56]. Thus, the NDVI values, which are usually below the threshold for saturation when measured early during the crop cycle, make this vegetation index a good proxy of green biomass [10,11,55,57,58]. Therefore, differences in canopy development estimated during the early stages of crop growth according to the NDVI may help to forecast crop growth capacity [14,55,58] and thus yield. The positive relationship between biomass and NDVI was strongest early in the crop development (Figure 3), suggesting that accessions with greater canopy development before anthesis were the most productive in terms of biomass at mid grain filling.

4.3. Biomass Prediction During the Late Stages of Crop Development Based on the NDVI

Unlike the relationship of biomass to the NDVI measured in the early stages of crop growth, the relationship between the NDVI measured after drought induction and biomass was poor and even tended to be negative (Figure 3). Although it was not the objective of our study, maximum growth in wheat is usually achieved around anthesis and afterwards the canopy starts to senesce, more or less quickly, depending on the growing conditions, and starting with the older leaves in the lower part of the plant. In accordance with this, after two weeks of progressive drought induction, the NDVI measured at mid grain filling decreased compared to values observed just five days after the last irrigation. However, the negative correlation between the NDVI measured after drought induction versus biomass and the positive relationship between the NDVI measured after drought versus flowering time (Figure 2 and Figure 3) led to other interpretations of our results. Thus, genotypes with delayed phenology are characterized by more vegetative growth, which accounts for the higher NDVI of such accessions, while earlier genotypes are characterized by less vegetative growth [59]. The larger transpirative biomass of the late accessions may lead to faster water exhaustion and, so, to a worse water status. These results suggest that, after drought, late phenologies with lower biomass (although greener than in early phenologies) were probably associated with a lower proportion of stems and spikes relative to leaves, hence, affecting plant water status negatively due to a faster exhaustion of soil moisture in comparison to early flowering genotypes. This would agree with the more positive δ13C values of the late phenology genotypes (Figure 2 and Figure 3).
Nevertheless, while the general relationships between NDVI and biomass are well established, selection of the correct crop phenological stage for NDVI monitoring of genotypic adaptation to specific environments will depend on the growing conditions and also the genotypic range of phenologies. For example, contrary to positive correlations between NDVIs measured after anthesis and yield in bread [16] and durum wheat [14,60], the range in phenology across the panel of genotypes tested was negligible.

4.4. Biomass Predictions Based on δ13C

The accessions with higher biomass were those with better water status (and lower WUE), as observed by the negative correlation between biomass versus δ13C in both stress and control conditions (Figure 4). In addition, positive correlations between the δ13C and flowering time (Figure 6) supported the idea of better water status in accessions with relatively early phenologies (e.g., flowering times of 10 to 17 days) in contrast to the worse water status (as shown by the higher δ13C values) of accessions with late phenology (e.g., with a flowering time of 35 days). These results suggest that the more positive δ13C values in late phenologies are driven by a decrease in stomatal conductance due to terminal stress [61]. However, when the potentially disturbing effect of phenology was removed by analyzing the relationship between δ13C and biomass within subsets of genotypes with similar dates of anthesis (Figure 5), relationships were in many cases still negative and significant, suggesting genotypes with higher δ13C (and, thus, higher WUE) were those which accumulated less biomass. Negative genotypic relationships of δ13C with canopy biomass and even more with grain yield have been reported before [3,38,47,62]. Accordingly, an extensive review on wheat and other herbaceous crops [63] have highlighted the positive association between higher stomatal conductance and a more productive genotype. In our study, the increase in δ13C due to stomatal closure was supported by the absence of a correlation between δ13C and total N either within subsets with the same date of anthesis (Figure 7) or across the whole set. The absence of a correlation between δ13C and total N discarded the intrinsic photosynthetic capacity of the plant as the main cause of δ13C enrichment [64] in response to elevated N fertilization and differences in phenology and senescence during grain filling [42]. While a positive relationship between days to anthesis and the δ13C of mature kernels in wheat has been reported [32,41,65], our study is the first to show that this relationship is already present in the δ13C of the flag leaves. Genotypes with lower δ13C values were likely associated with greater transpirative rates that were triggered by an increase in stomatal conductance. Thus, early flowering accessions that escaped from terminal drought maintained higher levels of stomatal conductance (which decreased δ13C), being the most productive in terms of biomass. This finding suggests that under well-watered conditions it is worthwhile for the plant to invest in growth rather than survival [8,37] and to ensure the maximization of production per unit of transpiration [66,67]. In fact, the maximization of productivity of green biomass occurred not only in well-watered plants but also after drought because the correlation between biomass and δ13C under drought was stronger than in the control and remained negative (Figure 3). Therefore, our results indicate that even under (moderate) water-limiting conditions, the plant strategy is likely to have an impact on growth rather than survival mechanisms [37]. More importantly, our results also suggest that environmental factors are not the only basis of such a relationship. While the positive relationship between the date of anthesis and the δ13C of mature kernels under Mediterranean conditions can be related to the later genotypes being exposed to more severe drought conditions during grain filling [41], in our study the δ13C was analyzed in flag leaves sampled simultaneously, and they were, therefore, exposed to the same environmental conditions. In fact, in the absence of water stress, a lower (i.e., more negative) δ13C has been associated with faster growth [37,68]. The mechanisms underlying the observed response behind this are unclear but different avenues should be explored in the future. For example, higher stomatal conductance as an indicator of better water status [30,33,35,37,41] or thinner leaves associated with faster growth [37,68] may be related to a lower δ13C.

4.5. Concluding Remarks on How and When to Use Phenotyping Traits

Although phenology affected the δ13C, this trait (rather than days to anthesis) was the first variable chosen by the multilinear model for biomass prediction both when we considered the whole set of genotypes as well as for the larger subsets with a given anthesis time (Table 3). In contrast, NDVI measurements based on UAV-mounted platforms did not predict biomass effectively, although a notable decrease in the NDVI was observed 14 days after drought induction. The results observed in this study not only reveal the importance of environmental conditions on NDVI measurements but also the significance of the developmental stage in which the NDVI is measured when monitoring genotypic adaptation to specific environments. Consequently, the crop developmental stage should be considered in deciding when to measure NDVI because phenology could bias interpretation of the results due to the negative association of biomass with NDVI during advanced developmental stages. Therefore, accessions undergoing NDVI or δ13C assessment should have similar phenology, otherwise the phenotypic performance of these traits may be biased. Our results concur with a recent report on wheat [69] that advocates the phenotyping of photosynthetic traits at multiple scales (leaf to canopy) and multiple development stages (vegetative, and pre- and post-anthesis). Additionally, our study highlights the confounding effect of phenology when phenotyping other agronomic traits, a well-known issue when interpreting the effects of QTL for drought-related proxies of biomass and yield productivity [47,70]. Accordingly, any given trait such as NDVI and δ13C may have a positive, negative, or null association with the target trait under selection, in accordance with previous reports [38,41,47,55,71]. Therefore, a wide variation in phenology should be avoided in studies that aim to elucidate the relationship between proxy traits and other agronomic traits, otherwise the interpretation of the results may be compromised.
Our study illustrates how a correct phenotyping is only feasible providing (1) a good understanding of phenotyping conditions in terms of traits measured, crop stages, and growing conditions when these traits are evaluated and (2) genotypic variability in intrinsic characteristics, such as phenology, is accounted for.

Supplementary Materials

The following are available online at https://www.mdpi.com/2073-4395/10/11/1679/s1, Table S1: Number of accessions at different flowering times and phenological stages, Table S2: Linear regression of the relationship between the biomass at mid grain filling and the NDVI, Table S3: Linear regression of the relationship between the biomass and δ13C in the flag leaf dry matter sampled before imposition of stress and after two weeks of stress conditions, Figure S1: Image of the field trial at the Maricopa phenotyping platform.

Author Contributions

Conceptualization, R.S.-B., J.L.A., M.D.S.M., R.T., and J.W.W.; Methodology, M.N., G.E.C., M.M., J.W.W., and M.D.S.M.; Formal Analysis, M.D.S.M.; Investigation, G.E.C.; Resources, R.W.W.; Data Curation, F.C., R.S.-B., and J.L.A.; Writing—Original Draft Preparation, R.S.-B.; Writing—Review & Editing, R.S.B, J.L.A., and R.T.; Visualization, R.S.-B.; Supervision, J.L.A. and M.D.S.M.; Project Administration, R.T., M.N., J.L.A., and M.D.S.M.; Funding Acquisition, R.W.W., J.W.W., J.L.A., and M.D.S.M. All authors have read and agreed to the published version of the manuscript.

Funding

Stable isotope analyses were covered through the Spanish projects AGL2016-76527-R from the Ministerio de Economía y Empresa, and PID2019-106650RB-C21 from the Ministerio de Ciencia e Innovación. The field trial was part of the Transportation Energy Resources from Renewable Agriculture, Phenotyping Reference Platform (TERRA REF) project funded by the Advanced Research Projects Agency-Energy (ARPA-E), U.S. Department of Energy, under award number DE-AR0000594, with additional support for this study from US Department of Agriculture-Agricultural Research Service (USDA-ARS) agreement no. 58-2020-6-019 from the Arid-Land Agricultural Research Center of USDA-ARS (USA).

Acknowledgments

R.S.-B. was supported by the Juan de la Cierva program JDC-Formación (FJCI-2016-28164). R.S.-B., J.L.A., and M.D.S.M. acknowledge the Support of the Spanish project PID2019-106650RB-C21 from the Ministerio de Ciencia e Innovación and J.L.A. acknowledges the support from the Institució Catalana de Investigació i Estudis Avançats (ICREA) Academia, Generalitat de Catalunya, Spain. G.E.C. was supported by the Ph.D. program from the University of Bologna, Italy.

Conflicts of Interest

The authors declare that they have no known competing financial interests or personal relationships that could have appeared to influence the work reported in this paper.

References

  1. Lobell, D.B.; Burke, M.B.; Tebaldi, C.; Mastrandrea, M.D.; Falcon, W.P.; Naylor, R.L. Prioritizing climate change adaptation needs for food security in 2030. Science 2008, 319, 607–610. [Google Scholar] [CrossRef]
  2. Ceccarelli, S.; Grando, S. Drought as a challenge for the plant breeder. Plant Growth Regul. 1996, 20, 149–155. [Google Scholar] [CrossRef]
  3. Araus, J.L.; Slafer, G.A.; Reynolds, M.P.; Royo, C. Plant breeding and drought in C3 cereals: What should we breed for? Ann. Bot. 2002, 89, 925–940. [Google Scholar] [CrossRef]
  4. Passioura, J. Grain yield, harvest index, and water use of wheat. J. Aust. Inst. Agric. Sci. 1977, 43, 117–120. [Google Scholar]
  5. Reynolds, M.P.; Foulkes, M.J.; Slafer, G.A.; Berry, P.; Parry, M.A.J.; Snape, J.W.; Angus, W.J. Raising yield potential in wheat. J. Exp. Bot. 2009, 60, 1899–1918. [Google Scholar] [CrossRef] [Green Version]
  6. Siddique, K.H.M.; Belford, R.K.; Perry, M.W.; Tennant, D. Growth, development and light interception of old and modern wheat cultivars in a Mediterranean-type environment. Aust. J. Agric. Res. 1989, 40, 473–487. [Google Scholar] [CrossRef]
  7. Slafer, G.A.; Satorre, E.H.; Andrade, F.H. Increases in grain yield in bread wheat from breeding and associated physiological changes. In Genetic Improvement of Field Crops; Slafer, G.A., Ed.; Marcel Dekker Inc.: New York, NY, USA, 1994; pp. 1–68. ISBN 0-8247-8980-6. [Google Scholar]
  8. González, A.; Martín, I.; Ayerbe, L. Barley yield in water-stress conditions. The influence of precocity, osmotic adjustment and stomatal conductance. Field Crops Res. 1999, 62, 23–24. [Google Scholar] [CrossRef]
  9. Carmo-Silva, E.; Andralojc, P.J.; Scales, J.C.; Driever, S.M.; Mead, A.; Lawson, T.; Raines, C.A.; Parry, M.A.J. Phenotyping of field-grown wheat in the UK highlights contribution of light response of photosynthesis and flag leaf longevity to grain yield. J. Exp. Bot. 2017, 68, 3473–3486. [Google Scholar] [CrossRef]
  10. Fernandez-Gallego, J.A.; Kefauver, S.C.; Vatter, T.; Aparicio Gutiérrez, N.; Nieto-Taladriz, M.T.; Araus, J.L. Low-cost assessment of grain yield in durum wheat using RGB images. Eur. J. Agron. 2019, 105, 146–156. [Google Scholar] [CrossRef]
  11. Gracia-Romero, A.; Kefauver, S.C.; Fernandez-Gallego, J.A.; Vergara-Díaz, O.; Nieto-Taladriz, M.T.; Araus, J.L. UAV and ground image-based phenotyping: A proof of concept with durum wheat. Remote Sens. 2019, 10, 1244. [Google Scholar] [CrossRef] [Green Version]
  12. Van Den Boogaard, R.; Veneklaas, E.J.; Lambers, H. The association of biomass allocation with growth and water use efficiency of two Triticum aestivum cultivars. Aust. J. Plant Physiol. 1996, 23, 751–761. [Google Scholar] [CrossRef]
  13. Villegas, D.; Aparicio, N.; Blanco, R.; Royo, C. Biomass accumulation and main stem elongation of durum wheat grown under Mediterranean conditions. Ann. Bot. 2001, 88, 617–627. [Google Scholar] [CrossRef] [Green Version]
  14. Aparicio, N.; Villegas, D.; Casadesus, J.; Araus, J.L.; Royo, C. Spectral vegetation indices as nondestructive tools for determining durum wheat yield. Agron. J. 2000, 91, 83–91. [Google Scholar] [CrossRef]
  15. Aparicio, N.; Villegas, D.; Araus, J.L.; Casadesús, J.; Royo, C. Relationship between growth traits and spectral vegetation indices in durum wheat. Crop Sci. 2002, 42, 1547–1555. [Google Scholar] [CrossRef]
  16. Babar, M.A.; Reynolds, M.P.; Van Ginkel, M.; Klatt, A.R.; Raun, W.R.; Stone, M.L. Spectral reflectance to estimate genetic variation for in-season biomass, leaf chlorophyll, and canopy temperature in wheat. Crop Sci. 2006, 46, 1046–1057. [Google Scholar] [CrossRef]
  17. Tattaris, M.; Reynolds, M.P.; Chapman, S.C. A direct comparison of remote sensing approaches for high-throughput phenotyping in plant breeding. Front. Plant Sci. 2016, 7, 1131. [Google Scholar] [CrossRef]
  18. Araus, J.L.; Cairns, J.E. Field high-throughput phenotyping: The new crop breeding frontier. Trends Plant Sci. 2014, 19, 52–61. [Google Scholar] [CrossRef]
  19. Araus, J.L.; Kefauver, S.C.; Zaman-Allah, M.; Olsen, M.S.; Cairns, J.E. Translating high-throughput phenotyping into genetic gain. Trends Plant Sci. 2018, 5, 451–466. [Google Scholar] [CrossRef] [Green Version]
  20. Trapp, J.J.; Urrea, C.A.; Zhou, J.; Khot, L.R.; Sankaran, S.; Miklas, P.N. Selective phenotyping traits related to multiple stress and drought response in dry bean. Crop Sci. 2016, 56, 1460–1472. [Google Scholar] [CrossRef] [Green Version]
  21. Shi, S.; Azam, F.I.; Li, H.; Chang, X.; Li, B.; Jing, R. Mapping QTL for stay-green and agronomic traits in wheat under diverse water regimes. Euphytica 2017, 213, 1–19. [Google Scholar] [CrossRef] [Green Version]
  22. Pauli, D.; Andrade-Sanchez, P.; Carmo-Silva, A.E.; Gazave, E.; French, A.N.; Heun, J.; Hunsaker, D.J.; Lipka, A.E.; Setter, T.L.; Strand, R.J.; et al. Field-based high-throughput plant phenotyping reveals the temporal patterns of quantitative trait loci associated with stress-responsive traits in cotton. G3 Genes Genomes Genet. 2016, 6, 865–879. [Google Scholar] [CrossRef] [Green Version]
  23. Condorelli, G.E.; Maccaferri, M.; Newcomb, M.; Andrade-Sanchez, P.; White, J.W.; French, A.N.; Sciara, G.; Ward, R.; Tuberosa, R. Comparative aerial and ground based high throughput phenotyping for the genetic dissection of NDVI as a proxy for drought adaptive traits in durum wheat. Front. Plant Sci. 2018, 9, 893. [Google Scholar] [CrossRef]
  24. Rebetzke, G.J.; Jimenez-Berni, J.A.; Bovill, W.D.; Deery, D.M.; James, R.A. High-throughput phenotyping technologies allow accurate selection of stay-green. J. Exp. Bot. 2016, 67, 4919–4924. [Google Scholar] [CrossRef] [PubMed] [Green Version]
  25. Tucker, C.J. Red and photographic infrared linear combinations for monitoring vegetation. Remote Sens. Environ. 1979, 8, 127–150. [Google Scholar] [CrossRef] [Green Version]
  26. Lukina, E.V.; Stone, M.L.; Raun, W.R. Estimating vegetation coverage in wheat using digital images. J. Plant Nutr. 1999, 22, 341–350. [Google Scholar] [CrossRef]
  27. Labus, M.P.; Nielsen, G.A.; Lawrence, R.L.; Engel, R.; Long, D.S. Wheat yield estimates using multi-temporal NDVI satellite imagery. Int. J. Remote Sens. 2002, 23, 4169–4180. [Google Scholar] [CrossRef]
  28. Ji, L.; Peters, A.J. Assessing vegetation response to drought in the northern Great Plains using vegetation and drought indices. Remote Sens. Environ. 2003, 87, 85–98. [Google Scholar] [CrossRef]
  29. Bennett, D.; Reynolds, M.; Mullan, D.; Izanloo, A.; Kuchel, H.; Langridge, P.; Schnurbusch, T. Detection of two major grain yield QTL in bread wheat (Triticum aestivum L.) under heat, drought and high yield potential environments. Theor. Appl. Genet. 2012, 125, 1473–1485. [Google Scholar] [CrossRef]
  30. Farquhar, G.D.; Richards, R.A. Isotopic composition of plant carbon correlates with water-use efficiency of wheat genotypes. Aust. J. Plant Physiol. 1984, 11, 539–552. [Google Scholar] [CrossRef]
  31. Farquhar, G. Carbon Isotope Discrimination And Photosynthesis. Annu. Rev. Plant Physiol. Plant Mol. Biol. 1989, 40, 503–537. [Google Scholar] [CrossRef]
  32. Araus, J.L.; Amaro, T.; Casadesús, J.; Asbati, A.; Nachit, M.M. Relationships between ash content, carbon isotope discrimination and yield in durum wheat. Aust. J. Plant Physiol. 1998, 25, 835–842. [Google Scholar] [CrossRef]
  33. Richards, R.A.; Rebetzke, G.J.; Condon, A.G.; van Herwaarden, A.F. Breeding opportunities for increasing the efficiency of water use and crop yield in temperate cereals. Crop Sci. 2002, 42, 111–121. [Google Scholar] [CrossRef]
  34. Farquhar, G.D.; Oleary, M.H.; Berry, J.A. On the relationship between carbon isotope discrimination and the inter-cellular carbon-dioxide concentration in leaves. Aust. J. Plant Physiol. 1982, 9, 121–137. [Google Scholar]
  35. Condon, A.G.; Richards, R.A.; Rebetzke, G.J.; Farquhar, G.D. Breeding for high water-use efficiency. J. Exp. Bot. 2004, 55, 2447–2460. [Google Scholar] [CrossRef] [Green Version]
  36. Araus, J.L.; Amaro, T.; Zuhair, Y.; Nachit, M.M. Effect of leaf structure and water status on carbon isotope discrimination in field-grown durum wheat. Plant Cell Environ. 1997, 20, 1484–1494. [Google Scholar] [CrossRef]
  37. Richards, R.A. Defining selection criteria to improve yield under drought. Plant Growth Regul. 1996, 20, 157–166. [Google Scholar] [CrossRef]
  38. Voltas, J.; Romagosa, I.; Lafarga, A.; Armesto, A.P.; Araus, J.L.; Sombrero, A. Genotype by environment interaction for grain yield and carbon isotope discrimination of barley in Mediterranean Spain. Aust. J. Agric. Res. 1999, 50, 1263–1271. [Google Scholar] [CrossRef]
  39. Rebetzke, G.J.; Condon, A.G.; Richards, R.A.; Farquhar, G.D. Selection for reduced carbon isotope discrimination increases aerial biomass and grain yield of rainfed bread wheat. Crop Sci. 2002, 42, 739–745. [Google Scholar] [CrossRef]
  40. Condon, A.G.; Richards, R.A.; Rebetzke, G.J.; Farquhar, G.D. Improving intrinsic water-use efficiency and crop yield. Crop Sci. 2002, 42, 122–131. [Google Scholar] [CrossRef] [PubMed]
  41. Araus, J.L.; Villegas, D.; Aparicio, N.; del Moral, L.F.G.; El Hani, S.; Rharrabti, Y.; Ferrio, J.P.; Royo, C. Environmental factors determining carbon isotope discrimination and yield in durum wheat under Mediterranean conditions. Crop Sci. 2003, 43, 170–180. [Google Scholar] [CrossRef]
  42. Araus, J.L.; Cabrera-Bosquet, L.; Serret, M.D.; Bort, J.; Nieto-Taladriz, M.T. Comparative performance of δ13C, δ18O and δ15N for phenotyping durum wheat adaptation to a dryland environment. Funct. Plant Biol. 2013, 40, 595–608. [Google Scholar] [CrossRef]
  43. Condon, A.; Richards, R. Broad sense heritability and genotype × environment interaction for carbon isotope discrimination in field-grown wheat. Aust. J. Agric. Res. 1992, 43, 921–934. [Google Scholar] [CrossRef]
  44. Rebetzke, G.J.; Condon, A.G.; Farquhar, G.D.; Appels, R.; Richards, R.A. Quantitative trait loci for carbon isotope discrimination are repeatable across environments and wheat mapping populations. Theor. Appl. Genet. 2008, 118, 123–137. [Google Scholar] [CrossRef]
  45. Foster, B.P.; Ellis, R.P.; Moir, J.; Talame, V.; Sanguineti, M.C.; Tuberosa, R.; This, D.; Teulat-Merah, B.; Ahmed, I.; Mariy, S.A.E.E.; et al. Genotype and phenotype associations with drought tolerance in barley tested in North Africa. Ann. Appl. Biol. 2004, 144, 157–168. [Google Scholar] [CrossRef]
  46. Laza, M.R.; Kondo, M.; Ideta, O.; Barlaan, E.; Imbe, T. Identification of quantitative trait loci for δ13C and productivity in irrigated lowland rice. Crop Sci. 2006, 46, 763–773. [Google Scholar] [CrossRef]
  47. Araus, J.L.; Slafer, G.A.; Royo, C.; Serret, M.D. Breeding for yield potential and stress adaptation in cereals. CRC Crit. Rev. Plant Sci. 2008, 27, 377–412. [Google Scholar] [CrossRef]
  48. Zadoks, J.C.; Chang, T.T.; Konzak, C.F. A decimal code for the growth stages of cereals. Weed Res. 1974, 14, 415–421. [Google Scholar] [CrossRef]
  49. Coplen, T.B. Explanatory glossary of terms used in expression of relative isotope ratios and gas ratios. In Comission on Isotopic Abundances and Atomic Weights; IUPAC Provisional Recommendations; U.S. Geological Survey: Reston, VA, USA, 2008. [Google Scholar]
  50. Mahey, R.K.; Singh, R.; Sidhu, S.S.; Narang, R.S. The use of remote sensing to assess the effects of water stress on wheat. Exp. Agric. 1991, 27, 423–429. [Google Scholar] [CrossRef]
  51. Cabrera-Bosquet, L.; Molero, G.; Stellacci, A.; Bort, J.; Nogués, S.; Araus, J. NDVI as a potential tool for predicting biomass, plant nitrogen content and growth in wheat genotypes subjected to different water and nitrogen conditions. Cereal Res. Commun. 2011, 39, 147–159. [Google Scholar] [CrossRef]
  52. Richards, R.A.; Lukacs, Z. Seedling vigour in wheat—Sources of variation for genetic and agronomic improvement. Aust. J. Agric. Res. 2002, 53, 41–50. [Google Scholar] [CrossRef]
  53. Govaerts, B.; Verhulst, N. The Normalized Difference Vegetation Index (NDVI) Greenseeker (TM) Handheld Sensor: Toward Integrated Evaluation of Crop Management; Part B: User Guide; Cimmyt: El Batán, Mexico, 2010. [Google Scholar]
  54. Sirault, X.R.R.; Condon, A.G.; Wood, J.T.; Farquhar, G.D.; Rebetzke, G.J. “Rolled-upness”: Phenotyping leaf rolling in cereals using computer vision and functional data analysis approaches. Plant Methods 2015, 11. [Google Scholar] [CrossRef] [PubMed] [Green Version]
  55. Marti, J.; Bort, J.; Slafer, G.A.; Araus, J.L. Can wheat yield be assessed by early measurements of Normalized Difference Vegetation Index? Ann. Appl. Biol. 2007, 150, 253–257. [Google Scholar] [CrossRef]
  56. Slafer, G.A.; Araus, J.L.; Royo, C.; Moral, L.F.G. Promising eco-physiological traits for genetic improvement of cereal yields in Mediterranean environments. Ann. Appl. Biol. 2005, 146, 61–70. [Google Scholar] [CrossRef]
  57. Duan, T.; Chapman, S.C.; Guo, Y.; Zheng, B. Dynamic monitoring of NDVI in wheat agronomy and breeding trials using an unmanned aerial vehicle. Field Crops Res. 2017, 210, 71–80. [Google Scholar] [CrossRef]
  58. Magney, T.S.; Eitel, J.U.H.; Huggins, D.R.; Vierling, L.A. Proximal NDVI derived phenology improves in-season predictions of wheat quantity and quality. Agric. For. Meteorol. 2016, 217, 46–60. [Google Scholar] [CrossRef]
  59. Fischer, R.A. The effect of duration of the vegetative phase in irrigated semi-dwarf spring wheat on phenology, growth and potential yield across sowing dates at low latitude. Field Crops Res. 2016, 198, 188–199. [Google Scholar] [CrossRef]
  60. Royo, C.; Aparicio, N.; Villegas, D.; Casadesus, J.; Monneveux, P.; Araus, J.L. Usefulness of spectral reflectance indices as durum wheat yield predictors under contrasting Mediterranean conditions. Int. J. Remote Sens. 2003, 24, 4403–4419. [Google Scholar] [CrossRef]
  61. Farquhar, G.D.; Hubick, K.T.; Condon, A.G.; Richards, R.A. Carbon Isotope fractionation and plant water-use efficiency. In Stable Isotopes in Ecological Research; Springer: Berlin/Heidelberg, Germany, 1989; ISBN 146128127X. [Google Scholar]
  62. Fischer, R.A.; Rees, D.; Sayre, K.D.; Lu, Z.-M.; Condon, A.G.; Saavedra, A.L. Wheat yield progress associated with higher stomatal conductance and photosynthetic rate, and cooler canopies. Crop Sci. 1998, 38, 1467–1475. [Google Scholar] [CrossRef]
  63. Roche, D. Stomatal conductance is essential for higher yield potential of C3 crops. CRC Crit. Rev. Plant Sci. 2015. [Google Scholar] [CrossRef]
  64. Evans, J.R. Nitrogen and photosynthesis in the flag leaf of wheat (Triticum aestivum L.). Plant Physiol. 1983, 72, 297–302. [Google Scholar] [CrossRef] [Green Version]
  65. Richards, A.R.; Condon, G.A. Challenges ahead in using carbon isotope discrimination in plant-breeding programs. In Stable Isotopes and Plant Carbon-Water Relations; James, R.E., Anthony, E.H., Graham, D.F., Eds.; Academic Press: London, UK, 1993; pp. 451–462. ISBN 978-0-12-233380-4. [Google Scholar]
  66. Cooper, P.J.M.; Gregory, P.J. Soil water management in the rain-fed farming systems of the Mediterranean region. Soil Use Manag. 1987, 3, 57–62. [Google Scholar] [CrossRef]
  67. Cantero-Martinez, C.; Villar, J.M.; Romagosa, I.; Fereres, E. Growth and yield responses of two contrasting barley cultivars in a Mediterranean environment. Eur. J. Agron. 1995, 4, 317–326. [Google Scholar] [CrossRef]
  68. Condon, A.; Richards, R.; Farquhar, G. Relationships between carbon isotope discrimination, water use efficiency and transpiration efficiency for dryland wheat. Aust. J. Agric. Res. 1993, 44, 1693–1711. [Google Scholar] [CrossRef]
  69. Pennacchi, J.P.; Carmo-Silva, E.; Andralojc, P.J.; Feuerhelm, D.; Powers, S.J.; Parry, M.A.J. Dissecting wheat grain yield drivers in a mapping population in the UK. Agronomy 2018, 8, 94. [Google Scholar] [CrossRef] [Green Version]
  70. Tuberosa, R. Phenotyping for drought tolerance of crops in the genomics era. Front. Physiol. 2012, 3, 347. [Google Scholar] [CrossRef] [Green Version]
  71. Tardieu, F. Any trait or trait-related allele can confer drought tolerance: Just design the right drought scenario. J. Exp. Bot. 2012, 63, 25–31. [Google Scholar] [CrossRef] [Green Version]
Figure 1. Monthly accumulated rainfall (cyan bars), irrigation (blue bars), evapotranspiration (closed circles, plain lines), and mean maximum and mean minimum temperatures (dashed and dotted lines, respectively) during the growing season from sowing until harvesting for biomass measurement (3–4 April 2017). Evapotranspiration during April refers only to the days until harvest.
Agronomy 10 01679 g001
Figure 2. Analysis of principal components (PCA) showing similarity and relationship between biomass, flowering time, and the stable carbon isotope composition (δ13C) of the flag leaf dry matter sampled before (δ13C control) and after (δ13C stress) drought conditions were imposed in the field (upper panel), and biomass, flowering time, and the Normalized Difference Vegetation Index (NDVI) using Sequoia (SE) and RedEdge (RE) sensors and flowering time (lower panel) measured in the 248 EDP on different days after planting. The percentage of variance by the two first axes (components 1 and 2) is included as an inset within each panel.
Agronomy 10 01679 g002
Figure 3. Pearson correlation coefficients of the relationship between the Normalized Difference Vegetation Index (NDVI) measured on different days using Sequoia (SE) and RedEdge (RE) sensors versus the biomass (upper panel), flowering time (FT) (middle panel), and stable carbon isotope compositions (δ13C) of the flag leaf dry matter before stress conditions were imposed in the field (δ13C control) and about two weeks after the last irrigation (δ13C stress) (lower panel) in a panel of 248 durum wheat elite advanced lines and cultivars from around the world. Level of significance p < 0.05; p < 0.01; p < 0.001.
Agronomy 10 01679 g003
Figure 4. Linear regression of the relationship between the plant biomass at mid grain filling and the stable carbon isotope composition (δ13C) in the flag leaf dry matter sampled before stress conditions were imposed (δ13C control) and two weeks after the last irrigation (δ13C stress). Level of significance, ** p < 0.01, *** p < 0.001.
Agronomy 10 01679 g004
Figure 5. Linear regression of the relationship between the plant biomass at mid grain filling and the stable carbon isotope composition (δ13C) in the flag leaf dry matter sampled before stress conditions were imposed (δ13C control, right panels) and two weeks after the last irrigation (δ13C stress, left panels) across the subset of genotypes exhibiting the same date of anthesis: 10 days after the earliest genotype (n = 76) and 17 days (n = 63). Level of significance, ns p > 0.05, ** p < 0.01, *** p < 0.001.
Agronomy 10 01679 g005
Figure 6. Linear regression of the relationship of the stable carbon isotope composition (δ13C) of the flag leaf dry matter (DM) sampled before stress conditions were imposed (δ13C control) and two weeks after the last irrigation (δ13C stress) against the different categories of flowering times (FT) assessed as days from the earliest genotypes and included in the panel of 248 genotypes. The raw values of 0 FT are not included. Level of significance, ** p < 0.01, *** p < 0001.
Agronomy 10 01679 g006
Figure 7. Linear regression of the relationship between the total nitrogen (Total N) concentration and the stable carbon isotope composition (δ13C) in the flag leaf dry matter sampled before stress conditions were imposed (δ13C control, right panels) and after two weeks of the last irrigation (δ13C stress, left panels). Relationships were studied by considering the subset of genotypes with a flowering time of 10 (n = 76) and 17 days (n = 63). Level of significance, ns p > 0.05.
Agronomy 10 01679 g007
Table 1. Average (AVG) and standard error (SE) for dry biomass, nitrogen biomass, flowering time range (difference between extreme genotypes), and the Normalized Difference Vegetation Index (NDVI). This index was assessed using Sequoia (SE) and RedEdge (RE) sensors and evaluated at different growth stages of the Zadoks scale in the 248 Elite Durum Panel (EDP) accessions. Mean values for NDVI measurements at different time points with different letter are significantly different according to the Tukey's honestly significnt difference test (p < 0.05). The mean squares of the ANOVA for the NDVI measurement at different time points are included at the bottom of the variable. Level of significance *** p < 0.001.
Agronomic Variables AVG SE
Biomass 2017 (Mg ha−1) 2.67 0.02
Flowering time range (days) 17.08 0.52
NDVI (Unmanned Aerial Vehicles)Zadoks (GS)
NDVI (SE) 13 Feb control310.548g0.002
NDVI (SE) 21 Feb control 0.706e0.002
NDVI (SE) 3 Mar control 0.656f0.002
NDVI (SE) 13 Mar control530.714d0.002
NDVI (RE) 21 Mar stress 0.829b0.001
NDVI (SE) 21 Mar stress 0.879a0.001
NDVI (RE) 28 Mar stress580.772c0.002
Mean Squares
NDVI measurements 3.02 ***
Table 2. Average (AVG) and standard error (SE) for the stable isotope composition of carbon (δ13C) and total carbon (Total C) and nitrogen (Total N) concentrations of the dry matter of aerial biomass sampled before (control) and after (stress) drought was imposed on the 248 EDP accessions. The outputs of the ANOVA for treatment effect (water availability) are included to the right of the variable. Level of significance ** p < 0.01, *** p < 0.001.
ControlStressANOVA
AVGSEAVGSEMean Squares
Total N (%)4.740.034.870.021.89 **
Total C (%)43.690.2144.350.1131.98 **
δ13C (‰)−26.570.04−26.290.039.35 ***
Table 3. Stepwise analysis for the entire 248 panel of durum wheat elite advanced lines and cultivars from around the world with biomass as a dependent variable, and the following independent variables: Carbon stable isotope composition (δ13C) and total nitrogen (Total N) concentration of the flag leaf dry matter sampled before stress conditions were imposed in the field (control) and two weeks after the last irrigation (stress), flowering time, and the Normalized Difference Vegetation Index (NDVI) using Sequoia (SE) and RedEdge (RE) sensors measured on different days after planting. The “global” stepwise analysis represents values obtained by considering accessions from all flowering times together. The 10, 12, 15, 17, and 25 days of flowering represent the stepwise analyses obtained with accessions within each flowering time classification.
VariabledfrMean SquaresFSignificance (p)
Global(−) δ13C stress2350.291.6021.260.000
(−) δ13C stress, (+) NDVI (SE) 21 Feb control2340.361.2016.850.000
Flowering time10 days(−) δ13C control750.380.7812.930.001
(−) δ13C control, (+) NDVI (SE) 21 Feb control740.440.518.750.000
12 days (+) Total N stress80.640.395.500.047
15 days(−) δ13C control80.740.259.640.015
17 days(−) δ13C stress620.320.497.120.010
25 days(−) NDVI (SE) 28 Mar stress240.500.507.840.010
(−) NDVI (RE) 28 Mar stress, (+) NDVI (SE) 21 Mar stress230.710.5211.970.000
(−) NDVI (RE) 28 Mar stress, (+) NDVI (SE) 21 Mar stress, (−) δ13C stress220.790.4211.950.000
Publisher’s Note: MDPI stays neutral with regard to jurisdictional claims in published maps and institutional affiliations.

