Integrating Cover Crops as a Source of Carbon for Anaerobic Soil Disinfestation
by
 , ,
, ,
Luca Vecchia
1,2, 
Francesco Di Gioia
1,*,
Antonio Ferrante
2 ,
,
Jason C. Hong
3,
Charles White
1 and
Erin N. Rosskopf
3 1
Department of Plant Science, The Pennsylvania State University, University Park, PA 16802, USA
2
Department of Agricultural and Environmental Sciences—Production, Landscape, Agroenergy, University of Milan, 20122 Milan, Italy
3
US Horticultural Research Laboratory, USDA-ARS, Fort Pierce, FL 34945, USA
*
Author to whom correspondence should be addressed.
Agronomy 2020, 10(10), 1614; https://doi.org/10.3390/agronomy10101614
Submission received: 27 August 2020
/
Revised: 16 October 2020
/
Accepted: 19 October 2020
/
Published: 21 October 2020
(This article belongs to the Special Issue Biofortification of Crops)
Abstract
:The adoption of anaerobic soil disinfestation (ASD), a biologically-based method for the management of soilborne pests and pathogens at the commercial scale strictly depends on the availability of effective and low-cost sources of carbon (C). A three-phase pot study was conducted to evaluate the performance of twelve cover crop species as alternative sources of C in comparison to molasses. Buckwheat produced the greatest above-ground and total plant dry biomass and accumulated the largest amount of total C. In the second phase, simulating the application of ASD in a pot-in-pot system, molasses-amended soil achieved substantially higher levels of anaerobicity, and lowered soil pH at 3 and 7 days after treatment application compared to soil amended with the cover crops tested. In the third phase of the study, after the ASD simulation, lettuce was planted to assess the impact of cover crops and molasses-based ASD on lettuce yield and quality. The treatments had limited effects on lettuce plant growth and quality as none of the treatments caused plant stunting or phytotoxicity. Tested cover crop species and molasses had a significant impact on the availability of macro and micro-elements in the soil, which in turn influenced the uptake of minerals in lettuce. Fast growing cover crops like buckwheat or oat, capable of accumulating high levels of C in a relatively short time, may represent a viable alternative to substitute or be combined with standard C sources like molasses, which could provide an on-farm C source and reduce cost of application. Further research is needed to assess the performance of cover crops at the field scale and verify their decomposability and efficacy in managing soil-borne pests and pathogens.
1. Introduction
The sustainable management of soil borne pests and pathogens is a significant challenge for specialty crop growers who need new integrated strategies to preserve soil health for the long term [1,2]. In the past, conventional growers have addressed these issues primarily by relying on the use of chemical soil fumigants, especially the use of methyl bromide [3], overlooking some of the long-term negative effects on soil health and the environment. Methyl bromide was commonly used as a soil fumigant due to its high efficacy against a wide spectrum of soilborne pests and pathogens, and for being relatively inexpensive and easy to use across a range of cropping systems. Nevertheless, being one of the most potent greenhouse gases, contributing to the depletion of the ozone layer and being toxic for humans, in 2005 with the Montreal Protocol methyl bromide was phased out for soil applications [4,5]. Few substitute chemical fumigants have been registered and to accommodate the increasing demand by consumers for more sustainable food production systems, the horticulture industry is seeking non-synthetic, less disruptive, and possibly integrated, alternative solutions for the management of soilborne pests and pathogens. Among the non-chemical alternatives, anaerobic soil disinfestation (ASD), is emerging as one of the most promising solutions to generate disease suppressive soils [2], being a biological method that is effective in managing a wide range of pathogens and pests in different cropping systems and under different environmental conditions [6,7,8]. The ASD treatment is initiated by amending the soil with a labile source of carbon (C), which stimulates rapid growth of the soil microbial population [9,10]. Feeding on the most labile fraction of C, in the presence of soil saturated with water and mulched with a plastic film, which helps limiting gas exchanges, the growing microbial population rapidly consumes oxygen in the soil turning it into an anaerobic environment. Keeping the soil under reducing conditions for a few days or weeks, the anaerobic decomposition of the C source by facultative and obligate anaerobic microbes leads to the production of organic acids, volatile organic compounds (VOCs), and the development of micro environmental conditions that are suppressive for soilborne pests and pathogens [8,11,12,13,14,15,16,17]. While ASD principles have been defined and the efficacy of the method against several soilborne pests has been demonstrated, more research is needed to optimize the application method and expand its adoption under less favorable environmental conditions [7,18]. Being a microbiologically based method, ASD efficacy is enhanced by higher temperatures, and research is needed to assess its efficacy in temperate regions such as the U.S. Mid-Atlantic region characterized by relatively low temperatures during the period when ASD would be applied.
Furthermore, a critical requirement of the ASD method is the accessibility of a locally available and relatively inexpensive source of labile C. Several C sources have been tested with positive results in different countries across a wide range of crops and environmental conditions [7,18,19]. Primary sources of C used for ASD applications are organic by-products of the agri-food industry, such as rice and wheat bran, molasses derived from the sugarcane industry, bioethanol, as well as crop residues and potentially also cover crops [18,20]. Unfortunately, there is not a source of C suitable for all the environments, and research is needed to identify optimal C sources in different locations on the basis of availability, cost, efficacy, and considering the potential effects on soil fertility and the environment [7,18,21,22,23,24]. In Pennsylvania and the U.S. Mid-Atlantic region, where cover crops are commonly used to minimize soil erosion over the winter or to enhance soil health during the summer [25], cover crops could represent a viable source of C for the application of ASD. Other authors have already proven the suitability of vegetable by-products or cover crops as a C source for ASD treatment [8,20,26,27,28]. Cover crops have the advantage of being produced directly on farm at relatively low cost and may be easily chopped and incorporated into the soil [13,20]. Moreover, integrating the benefit of cover crops with those of ASD could provide additional benefit in terms of soil health and overall sustainability of horticultural production systems. In fact, cover crops can provide several services, such as enhancing soil health and the sustainability of agricultural systems [25,29,30]. Cover crops are a great tool to interrupt monoculture systems, keeping the soil covered and possibly contributing to the reduction of inoculum of soilborne pests and pathogens [29,31,32]. Cover crops can increase agroecosystem biodiversity and improve air and water quality, generating great benefits for the environment [31,33]. Through the action of the roots, cover crops are also fundamental for soil health contributing to decreased soil erosion, reduced soil compaction, and improvement of soil structure. The biomass of cover crops also contributes to increased soil organic matter, catching nutrients that otherwise could be lost, and consequently enhancing the availability of nutrients for the following crop. Overall, the beneficial effects of cover crops may promote plant health and lead to increased crop yield [25,29,34]. Although more challenging than simply incorporating as soil organic amendments, integrating the multiple services of cover crops with the application of ASD could result in a synergistic effect, with additional benefits in terms of soil health and crop performance, while minimizing some potential environmental risks associated with the use of organic amendments which may lead to an excess of nutrients [18,35]. From this perspective, it is important to investigate the potential use of cover crops as a source of C for the application of ASD and identifying the species that are most suitable for the growing conditions typical of the U.S. Mid-Atlantic region. The ideal cover crop should be adapted to local pedoclimatic conditions, should consistently produce a high amount of fresh biomass in a relatively short time, and be highly decomposable [20,36]. Plants with a faster growth rate are preferred in order to decrease the time of soil occupation to the detriment of income-producing crops [36]. In selecting cover crops it is important to consider that plants belonging to different botanical families may offer different opportunities. Brassicas, for example, being rich in organosulfur compounds, may increase the efficacy of control against certain soilborne pests and pathogens through a biofumigation effect [37]. Poaceae instead are richer in carbon, while Leguminosae cover crops are characterized by relatively high N content, which could enhance the microbial activity and decomposability [38]. The objective of this study was to evaluate cover crops for ASD application by assessing their agronomic performance under controlled environmental conditions and their potential in producing carbon as compared to molasses a standard source of C used for ASD applications. To this purpose a three-phase pot study was conducted in the greenhouse (i) to evaluate the growth performance, the potential biomass production and amount of C produced by twelve different cover crops; (ii) to assess the efficacy of the cover crop biomass in generating soil anaerobic conditions in comparison with an untreated control and standard ASD applied using molasses as a C source; and (iii) to evaluate the effect of cover crop-based ASD treatments on soil fertility and the performances of a lettuce crop.
2. Materials and Methods
2.1. Experiment Location and Set up
A greenhouse pot experiment was established at the Pennsylvania State University Greenhouse Facility located at University Park, PA, USA (40°47′53.4″ N 77°51′35.8″ W) in the Spring of 2019. Twelve selected cover crop species were compared for their ability to produce fresh and dry biomass and their potential as C sources for anaerobic soil disinfestation applications. Treatments were arranged in a completely randomized block design with four replications. Each experimental unit consisted of eight pots. The experiment was conducted in a glasshouse complete of heating and cooling system and supplementary LED radiation. The greenhouse temperature was maintained between 18 °C and 35 °C.
2.2. Cover Crops Plant Material and Growing System
Cover crops were selected among the species adapted to summer conditions recommended for the Mid-Atlantic region [39] based on literature on their potential biomass production and decomposability as reported in Table 1. Seeds were acquired from Johnny’s Selected Seeds (Winslow, ME, USA); Peaceful Valley Farm (Grass Valley, CA, USA); Hancock Seeds Company (Dade City, FL, USA); and Albert Lea Seeds House (Albert Lea, MN, USA). Seeding rates shown in Table 1 were calculated based on recommended agronomic practices for each cover crop [39] and taking into account germination rate and percentage of purity for each batch of seed.
For each pot seeds were weighed at the defined rate on an analytical balance with a precision level of 0.0001 g (MS104TS/00 Mettler Toledo, Columbus, OH, USA) after measuring the 1000 seed weight for each cover crop. The twelve species were seeded by hand on 29 March 2019 in 7.33 L high-density polyethylene (HDPE) black pots of 24-cm diameter, 23-cm height, and with an area of 452.16 cm2 (C900, Nursery Supply Inc., Chambersburg, PA, USA). Pots were filled with a growing media mix composed by 65–75% Canadian sphagnum peat moss, perlite, and dolomite lime (Mix 4, Sun Gro Horticulture, Agawam, MA, USA). This commercial growing media was selected to assure standard conditions and fertility for all tested cover crops. The irrigation system was built using a high-density polyethylene 20 mm tube as the main pipe set across each replication. Drippers (Netafim, Tel Aviv, Israel), each with a delivery flow rate of 8 L h−1, were split with a four-way splitter and each pot was served by two emitters. Immediately after sowing all of the pots were watered manually.
Subsequently, starting at 8 DAS (days after sowing) the irrigation system was used for delivering water (3 min per day) with a timer (Single Dial Hose Faucet Timer 1-Outlet, Orbit Irrigation Products, North Salt Lake, UT, USA). Water supply gradually increased according to plant growth and subsequent water demand, reaching a maximum of 8 min of irrigation per day. Water used for irrigation had a pH of 8.24 and an electrical conductivity (EC) of 0.71 mS cm−1 at 21.2 °C measured with a HI991301 pH-EC meter (Hanna Instrument, Woonsocket, RI, USA). The equivalent of 40 kg ha−1 of N, 8.72 kg ha−1 of P and 33.2 kg ha−1 of K fertilizer was applied via fertigation before sowing to simulate the residual fertility potentially available in soil using a water soluble 20-10-20 general purpose fertilizer (Jack’s Professional, JR Peters Inc., Allentown, PA, USA). The soluble fertilizer was dissolved in water and added in the irrigation system using a 1:100 dosing pump (D25F1, Dosatron International Inc., Clearwater, FL, USA) creating a 200 ppm N solution. At 11 and 19 DAS cover crops were sprayed to control thrips (Overture, Pyridalyl, Valent USA LLC, Walnut Creek, CA, USA). At 32 DAS supplemental LED light was turned on from 6:00 to 20:00 if the solar radiation levels were below 1000 W m−2.
2.3. Biometric Assessment
Biometric assessments were performed at 32 DAS on one pot per experimental unit and at 46 DAS on two pots per experimental unit by measuring the fresh and dry biomass of each sampled pot, separating the above-ground and below-ground plant portion. All plants in a pot were cut with scissors and the fresh weight was measured using an analytical scale with a precision level of 0.01 g (MS12002TS/00 Mettler Toledo, Columbus, OH, USA). Sampled above-ground plant biomass was then placed in a paper bag and oven-dried at 65 °C until constant weight to measure the dry matter content. On the same day, root biomass was harvested from each pot, accurately dividing, and washing the roots from the growth medium. Washed roots were placed into aluminum containers and were oven-dried at 65 °C until constant weight to measure the root dry biomass. Shoot and root dry samples of both biometric assessments were ground, passed through a 0.5 mm sieve, and prepared for subsequent analyses.
2.4. Plant Tissue Total Carbon, Total Nitrogen, and Mineral Analysis
Dry plant tissue samples from both biometric assessments were analyzed for total carbon and total nitrogen using a CN auto-analyzer (NC Soil Flash EA1112, CE Elantech Inc., Lakewod, NJ, USA) according to the Dumas method which consists of the complete combustion of organic material and the analysis of the produced gaseous compounds. The results of this analysis were used to calculate the C:N ratio, which is considered an important indicator of the decomposability of organic amendments and thus the suitability of each cover crop as a C source for ASD application. Total C applied (TCA) was calculated by multiplying the C concentration with the dry biomass produced from each cover crop at 32 and 46 DAT. Dry plant tissues ground and sieved were sent to Waypoint Analytical Service Lab (Richmond, VA, USA) for elemental analysis. Plant mineral content (P, K, Ca, Mg, S, Na, Fe, Mn, Zn, B, Cu) was determined by inductively coupled plasma atomic emissions spectrometry (ICP-AES; iCAP 6500, Thermo Scientific, Waltham, MA, USA) after microwave-assisted digestion (MARS Express, CEM Corp., Matthews, NC, USA) according to U.S. EPA method 3052 (USEPA 1997) [40]. Nitrate nitrogen (NO3-N) was determined by ion chromatography (model QIC; Dionex Corp. Sunnyvale, CA, USA) after extraction from dry samples of 0.5 g with 20 mL of sodium carbonate (3.5 mmol L−1) and sodium bicarbonate (1.0 mmol L−1) solution as described by Di Gioia and co-authors (2017) [41,42]. For all the analyses, quality control standards and distilled-deionized water method blanks were used to ensure that the ion chromatography and the ICP-AES system were operating properly.
2.5. Simulation of ASD Treatment
At 48 DAS, on 16 May 2019 the remaining five pots of each experimental unit for three replications were used for the second phase of this study, in which using actual soil, eleven of the initial twelve cover crops (Berseem clover was discarded due to low germination and insufficient biomass production) were tested as C source in comparison with molasses and an untreated control, using a pot-in-pot system. First 195 (13 × 3 × 5 = 195) HDPE black pots (24 cm diameter, 23 cm height, and area of 452.16 cm2) with holes at the bottom (C900, Nursery Supply Inc., Chambersburg, PA, USA) were filled with soil and were then inserted into slightly larger HDPE black pots (8.52 L) with the same shape but without holes at the bottom (C1000, Nursery Supply Inc., Chambersburg, PA, USA). The soil, recovered from the Penn State Composting Facility, was classified as clay loam soil, which is typical of the region and had a pH of 7.78 and EC of 1.15 mS cm−1 at 19.6 °C. For all cover crops, the above-ground biomass of each pot was harvested at the soil level using scissors, weighed on an analytical scale and chopped with a double blade knife in small pieces to approximately 1–2 cm to simulate the chopping of a flail-mower. The fresh chopped plant biomass was then incorporated into the soil of each pot by hand-mixing the chopped plant biomass with the soil to simulate the incorporation with a soil tiller. The untreated control pots did not receive any amendment and the reference ASD standard treatment was amended with the equivalent to 5.6 m3 ha−1 (63.39 mL per pot) of blackstrap molasses (Double S Liquid Feed Services Inc., Danville, IL, USA). The molasses rate was calculated based on the reference standard rate ASD1 defined as optimal for field ASD applications in previous work [13]. After applying the C sources, all of the pots were top filled with soil to reduce any air gap at the top of the pot. The initial irrigation to saturate the soil with water was performed via drip irrigation with two-point sources per pot applying 1.83 L of water per pot. The amount of water was defined by measuring the maximum water holding capacity of the soil in the pot. In the case of pots amended with molasses, the same amount of water was applied manually using a graduated cylinder while diluting and applying the molasses. Immediately following irrigation, oxidation-reduction potential sensors (Pt combination electrodes with Ag/AgCl reference system, S500CD-ORP-HT/50/TL, Sensorex Inc., Garden Grove, CA, USA) and temperature sensors (S-TMB-M017, Onset Computer Corporation, Bourne, MA, USA) were placed in representative pots (one per pot) to continuously monitor variations in the soil redox potential and soil temperature, respectively. Soil redox potential and temperature sensors were placed at 15 and 10 cm depth, respectively. Finally, each pot was tarped with a black on white (40 × 40 cm) total impermeable film (TIF) (Raven Engineered Films, Sioux Falls, SD, USA) and sealed around the pot with a 18 cm × 1.6 cm rubber band (Uline, Pleasant Prairie, WI, USA) in order to minimize gas exchange, thus simulating the use of mulching film used in commercial fields. Pots were kept in the same greenhouse used to grow the cover crops, setting a minimum temperature of 18 °C. However, due to a sudden external temperature drop that might have affected the microbial activity, at 5 DAT the minimum temperature was set at 25 °C. During the ASD treatment, soil samples were collected at 1, 4, 7, 14, and 28 DAT each time from a different pot, leaving the pot with the sensors for the last sampling. Soil was sampled using a custom-made PVC pipe sampler and samples were placed into plastic bags and stored in a −20 °C freezer (Standard Auto Freezer, VWR International, Vienna, Austria) pending laboratory analyses. At 28 DAT the ASD treatment was terminated by removing the plastic cover and the pot without holes underneath each growing pot with holes at the bottom to facilitate gas exchange and water drainage.
2.6. Soil Monitoring and Laboratory Analysis
During the ASD treatment for 28 days, soil redox potential and temperature of each treatment were monitored continuously using ORP sensors (S500CD-ORP-HT/50/TL, Sensorex Inc., Garden Grove, CA, USA) connected to two multiplexer (AM16/32, Campbell Scientific, Logan, UT, USA) linked to two data loggers (CR1000X, Campbell Scientific, Logan, UT, USA). Soil ORP measures were taken every 30 s and the average was calculated every 30 min. Data were downloaded using a data logger support software (4.5 LoggerNet, Campbell Scientific, Logan, UT, USA). Anaerobic conditions were indicated by the soil redox potential below a critical redox potential (CEh), based on the average hourly values. Critical redox potential was calculated using the formula: CEh = 595 mV − (60 mV × soil pH) with soil pH determined at every soil sampling during the ASD treatment as described in previous work [35]. At the end of the 28-day treatment period, collected data were used to calculate the cumulative number of hours under anaerobic conditions. For redox potential (Eh) values below CEh, the absolute value of the difference between each hourly Eh value and CEh was summed to give a measure of cumulative mVhr under anaerobic conditions [17]. A soil temperature sensor (S-TMB-M017, Onset Computer Corporation, Bourne, MA, USA) was placed into one representative pot in the first replication for each treatment. These sensors were connected to four data loggers (HOBO H21-002, Onset Computer Corporation, Bourne, MA, USA). Data were downloaded and processed with data logger processing software (HOBOware, Onset Computer Corporation, Bourne, MA, USA). Data collected through the data loggers were organized and processed using Microsoft Excel (Microsoft, Redmond, WA, USA) in preparation for subsequent statistical analysis. Soil sampled at 1, 4, 7, 14, and 28 DAT were analyzed to measure soil pH and EC and to measure total C and total N. Mineral concentration was measured on dry soil samples at 1, 7, and 28 DAT. Soil pH and EC were measured at every sampling date mixing 15 mL of soil of each sample with 30 mL of deionized water according to the 1:2 v:v soil:water extraction method [35]. Soil:water mix were prepared into 50 mL vials and shaken for 30 min on an orbital shaker. Later, the solution was filtered using 185 mm diameter, Whatman grade 1 filter paper (1001-185, Whatman plc, Maidstone, UK). The pH and EC of the extracted and filtered solutions were analyzed using a pH and EC meter (Hanna Instruments, Smithfield, RI, USA). Dry soil samples were used to measure total C and total N by combustion using a CN auto-analyzer (NC Soil Flash EA1112, CE Elantech Inc., Lakewod, NJ, USA) following the Dumas method. Soil samples were sent to Waypoint Analytical Service Lab (Richmond, VA, USA) for soil mineral analysis (P, K, Ca, Mg, S, Na, Fe, Mn, Zn, B, Cu) after Mehilich-3 extraction by inductively coupled plasma atomic emissions spectrometry (ICP-AES; iCAP 6500, Thermo Scientific, Waltham, MA, USA). Mineral nitrogen was extracted through a 1:4 ratio (w:w) soil: 0.025 M KCl solution [42]. The filtered solution was then analyzed to determine NO3-N by ion chromatography, using an ICS 1000 (Dionex Corporation, Sunnyvale, CA, USA) with a conductivity detector with an IonPack AG14 pre-column and an IonPac AS14 separation column operating at 1800–1900 psi. The detector and suppressor were set at 17 mS and 24 milliamps, respectively. The required eluent consisted of 20 mL of 3.5 mmol L−1 of sodium carbonate and 1.0 mmol L−1 of sodium bicarbonate solution. Quality control standards and distilled-deionized water method blanks were used to ensure that the ion chromatography and the ICP-AES system were operating properly.
2.7. Lettuce Cultivation, Sampling, and Analysis
At the end of the ASD treatment, when the TIF and soil monitoring sensors were removed, the same pots were used for the third phase of the study, in which lettuce was planted to assess any potential effect in terms of plant growth and nutrient availability. Before planting lettuce, the soil was manually worked to 10 cm.
Green Salanova® lettuce (Lactuca sativa L.) purchased from Johnny’s Selected Seeds (Winslow, ME, USA) was selected as a test crop. On 8 May 2019, 250 seeds of good quality were sown into nursery plug trays with 105 holes filled with a growing media mix composed by 65–75% Canadian sphagnum peat moss, perlite, and dolomite lime (Mix 4, Sun Gro Horticulture, Agawam, MA, USA). Seeds were germinated in a growth chamber with controlled environment and temperature set at 24 °C. After germination, lettuce seedlings were watered daily, and at 16 and 29 DAS were fertigated using a nutrient solution containing 100 mg kg−1, 21 mg kg−1 of P, and 83 mg kg−1 of K prepared with a 20-10-20 general purpose fertilizer (Jack’s Professional, JR Peters Inc., Allentown, PA, USA). At 40 DAS, lettuce plants were transplanted into the ASD pots planting one plant per pot. Pots were fertigated via drip irrigation using the same irrigation system employed for the application of the ASD treatment and to grow the cover crops. A 1:100 dosing pump (D25F1, Dosatron International Inc., Clearwater, FL, USA) was connected to the irrigation system to distribute a water soluble 20-10-20 NPK general purpose fertilizer (Jack’s Professional, JR Peters Inc., Allentown, PA, USA) solution diluted in 30 L of water at a rate of 80 g L−1. Fertigation events were scheduled up to four times a day for 1 min. During the lettuce growth cycle, the greenhouse temperature was set between 18.3 °C and 22.7 °C and LED supplemental lighting was automatically activated when natural sunlight was below 1000 W m−2. At 64 DAS, lettuce was harvested and processed to measure fresh yield and conduct a biometric assessment. Fresh yield was measured on all five plants per experimental unit. Plants were harvested with a knife and immediately weighed to record the fresh weight after discarding old leaves. For each experimental unit, three representative plants were used to count the number of leaves and measure the leaf area using a leaf area meter (LI-3100C, LI-COR Bioscience, Lincoln, NE, USA). The same plant material was measured for fresh weight and then placed in labeled paper bags and oven-dried at 65 °C to measure the dry weight and estimate the plant dry matter content. Specific leaf area was calculated dividing the plant leaf area (cm2) by the plant dry weight (g), vice versa, the leaf dry mass per unit area was calculated dividing the plant dry weight (g) by the plant leaf area (m2).
Dry lettuce samples were ground with a laboratory mill and passed through a 1 mm sieve. Samples were then sent to USDA Horticultural Research Laboratory located in Fort Pierce, FL, USA, to determine total C and N content. Plant tissue samples were also sent to Waypoint Analytical Service Lab for mineral analysis using the methods and procedures previously described for the cover crop plant tissues.
2.8. Statistical Analysis
Collected data for all the measured parameters were subjected to one-way analysis of variance (ANOVA) using the GLM procedure in SAS Version 9.4 software (SAS Institute, Cary, NC, USA). Before conducting the ANOVA, homogeneity of variance and normality of distribution were assessed for all variables using the GLM procedure (Levene test) and the UNIVARIATE procedure (Shapiro-Wilk test) of SAS Version 9.4 software, respectively. When significantly different, means were separated using the Student–Newman–Keuls post hoc multiple comparison procedure at p = 0.05.
3. Results and Discussion
3.1. Cover Crop Fresh and Dry Biomass Production
Berseem clover, which had poor germination and produced inadequate biomass, was dropped from the analysis. The biometric assessment performed at 32 DAS revealed significant differences in biomass production between the remaining eleven cover crop species examined (Table 2; Figure S1).
Data presented in Figure S1 provide an estimate of the above ground fresh biomass yield variation among the different cover crops examined. At 32 DAS, significant differences (p = 0.0001) were observed in terms of above-ground, root, and total plant dry biomass as presented in Table 2.
In terms of dry root biomass, rye had the highest weight (547.93 kg ha−1) at 32 DAS followed by oat (420.21 kg ha−1). When comparing cover crops in terms of above-ground dry biomass, buckwheat produced the highest dry biomass (2894.3 kg ha−1) followed by forage radish, mustard, and rye. Combining roots and above-ground dry biomass, buckwheat and rye produced the highest amount of dry biomass along with mustard and forage radish, suggesting that mustard and forage radish had higher water content compared to buckwheat and rye. Comparing the shoot to root ratio (S:R) at 32 DAS, with a S:R between 3.9 and 4.4 the Graminaceae had the highest root biomass compared to all the other species. At 46 DAS significant differences were observed among cover crop species in terms of above-ground fresh biomass, root, above-ground and total plant dry biomass as reported in Figure S1 and Table 2.
As expected, plant fresh and dry biomass increased from 32 to 46 DAS. Even at 46 DAS forage radish (68.12 Mg ha−1) and mustard (64.16 Mg ha−1) produced the greatest above-ground fresh biomass, followed by oat (57.28 Mg ha−1) and buckwheat (47.13 Mg ha−1). Over 14 days, the Graminaceae and especially oat (with an average daily fresh biomass increase of 2480 kg ha−1 d−1) increased their biomass more than the other cover crops examined. Root dry biomass increased as well from 32 to 46 DAS, especially in forage radish, that developed the typical enlarged taproot reaching a S:R of 4.3. In terms of above-ground dry biomass, with 8312.7 kg ha−1, buckwheat was by far the top performer with an average daily dry biomass increase of 411.4 kg ha−1 d−1 over the last 14 days. Buckwheat was also the species producing the highest total plant dry biomass with an average daily growth rate of 194.4 kg ha−1 d−1. The amount of fresh and dry biomass accumulated in this study was, for most of the crops, consistent with data reported in the literature [39]. In the case of buckwheat however, observed values were slightly higher than the maximum production values reported in the literature, while sunn hemp, sorghum sudangrass, crimson clover, and field peas produced less than the minimum reported in the literature [39]. Such variations may be explained by the fact that a relatively higher seeding density was used, in the case of buckwheat, while for other crops that showed a lower performance, it is possible that the seed quality or the environmental conditions were sub-optimal. Given the importance of the amount of biomass produced, a strategy to increase the efficacy of cover crops as a source of C for ASD applications could be increasing the seeding density over the seeding rates normally used for cover crops.
3.2. Cover Crop and Molasses Total C, N, C:N Ratio, and Total C Applied
The results of total C and total N analysis and the relative C:N ratio of the cover crop plant tissues harvested at 32 and 46 DAS in comparison to the molasses are presented in Table 3.
At 32 DAS, total N concentration was on average about 3 to 5 times higher in cover crops than in molasses (1.05%). As expected Leguminosae crops had higher concentrations of total N compared to the other crops tested. Large variations among cover crops were observed also in terms of total C, which ranged between 41.1% in the case of sunn hemp and 34.7% in the case of forage radish. Examining the C:N ratio it was observed that at 32 DAS buckwheat had the highest C:N ratio (13.2%) among all cover crops, and even if much lower, it was the closest C:N ratio compared to molasses (35.42%). All the other cover crops had a significantly lower C:N ratio. At 46 DAS the total N concentration significantly decreased in all cover crops and ranged from 1.27% to 2.41% reaching values that were closer to the average total N concentration in molasses (1.05%). By contrast at 46 DAS, the total C concentration slightly increased in all of the cover crops, ranging from a minimum of 36.7% in forage radish to a maximum of 42.4% in field peas. Consequently, the C:N ratio of all of the cover crops changed substantially in the last 14 days. Interestingly, the buckwheat C:N ratio (33.45) was not significantly different from the molasses C:N ratio (35.42). All of the other cover crops had significantly lower C:N ratio compared to molasses and buckwheat, ranging from 17.65 in rye up to 26.86 in the case of mustard. A lower C:N ratio is normally associated with a higher decomposability rate considering that N may be a limiting factor for microbial growth. Nevertheless, for ASD applications, the amount of C seems to be critical and C:N ratio of 25:1 or 30:1 seems to be ideal for treatment, and also because with lower C:N ratio levels there could be an excess of N which may raise some environmental concerns [2,18,35]. Total C applied estimated at 32 and 46 DAS for all the cover crop species examined and molasses are presented in Table 3. Both at 32 and 46 DAS buckwheat had the highest estimated TCA among all the cover crop species, while sunn hemp and sorghum sudangrass consistently had the lowest values of TCA. Compared to molasses applied at the standard rate of 13.9 m3 ha−1 (ASD1), buckwheat, the best cover crop, provided only 16% and 48% of the TCA applied with molasses at 32 and 46 DAS, respectively. The results indicate that the TCA is substantially higher at 46 DAS compared to 32 DAS, therefore for most species it is worth growing the cover crops for two extra weeks. The results also suggest that in most cases cover crops may provide only a portion of the total C compared to molasses applied at the reference standard rate [13,17] and an integration with other sources of C may be necessary to achieve levels of TCA similar to those provided with ASD1-molasses based method.
3.3. Cover Crop Mineral Concentration and Potential Mineral Return to the Soil
The mineral concentrations of the cover crop plant tissues at 32 and 46 DAS are presented in Tables S1 and S2, respectively. At 32 DAS, significant variations among species were observed for all of the minerals analyzed, except for NO3-N and Fe. Among the macronutrients, P concentration was higher in cowpea, sunn hemp, sorghum sudangrass, and oat compared to all the other species. In the case of K, mustard, forage radish, oat, rye, and annual ryegrass had the highest concentration. The two Brassicaceae, mustard and forage radish, also had the highest concentrations of Ca, S, and Na. Within the micronutrients, sunn hemp had the highest concentration of Mn and B. Conversely, buckwheat, mustard, and sorghum sudangrass had the highest concentration of Zn, and annual ryegrass had high concentration of Cu. At 46 DAS the total N and the concentrations of K and P substantially decreased in comparison to the plants harvested at 32 DAS. Significant variations were observed among cover crops for all of the minerals except for Fe. Among macronutrients, P ranged from 0.63% in rye and sunn hemp to 0.46% in buckwheat, similarly K ranged from 4.93% in rye to 2.58% in buckwheat. Forage radish had the highest concentration of Ca, Mg, Na, and Zn. The two Brassicaceae consistently accumulated more S than other cover crops. Variations in the concentrations of Mn, B, and Cu were similar to those observed at 32 DAS. While the experiment simulated a cut and carry cover crop system, the cultivation of all the species in a peat-perlite mix under standard fertilization levels and controlled environmental conditions allowed to highlight the actual capacity of each cover crop species to take up different nutrients, which in turn may affect the potential loss of nutrients or the availability of nutrients for the following crop. In fact, the capacity of a species to scavenge more of one or more minerals may reduce the risk of loss into the environment and increase the availability of the same minerals for the following crop. Multiplying the mineral concentration by the amount of dry biomass produced by each cover crop, the total above-ground nutrient uptake of each cover crop was calculated and in turn represents what the plant may potentially return to the soil once chopped and incorporated in the soil at 32 and 46 DAS, respectively (Table 4 and Table 5). At 32 DAS due to the higher above-ground plant biomass, buckwheat accumulated the highest level of C, P, K, Mg, Mn, Zn, and B. Forage radish accumulated the highest amount of N, Ca, and Na. Mustard, in addition to a high content of K, accumulated the highest level of NO3-N and S followed by forage radish. At 46 DAS, the accumulation of nutrients was substantially higher due to the higher accumulation of plant dry biomass. Nevertheless, buckwheat, forage radish, and mustard were consistently the plants characterized by a higher overall accumulation of minerals.
3.4. Treatment Effect on Soil Redox Potential, Temperature, pH and Electrical Conductivity (EC)
Soil redox potential and temperature were monitored continuously during the entire ASD treatment period. Soil pH and EC were measured only in correspondence with soil sampling events at 1, 4, 7, 14, and 28 days after treatment (DAT). The soil temperature daily variation over four weeks is presented in Figure S2. Although the greenhouse was heated, a significant daily variation was observed between day and night. Nevertheless, soil temperature followed the same regular trend clearly influenced more by the temperature of the greenhouse than by the treatments, which had no effect on soil temperature during the entire ASD treatment period. The graph also reports the air temperature of the greenhouse, showing the same trend as the soil temperature, with a slightly higher daily variation compared to the temperature of the soil which is normally less subjected to such variations.
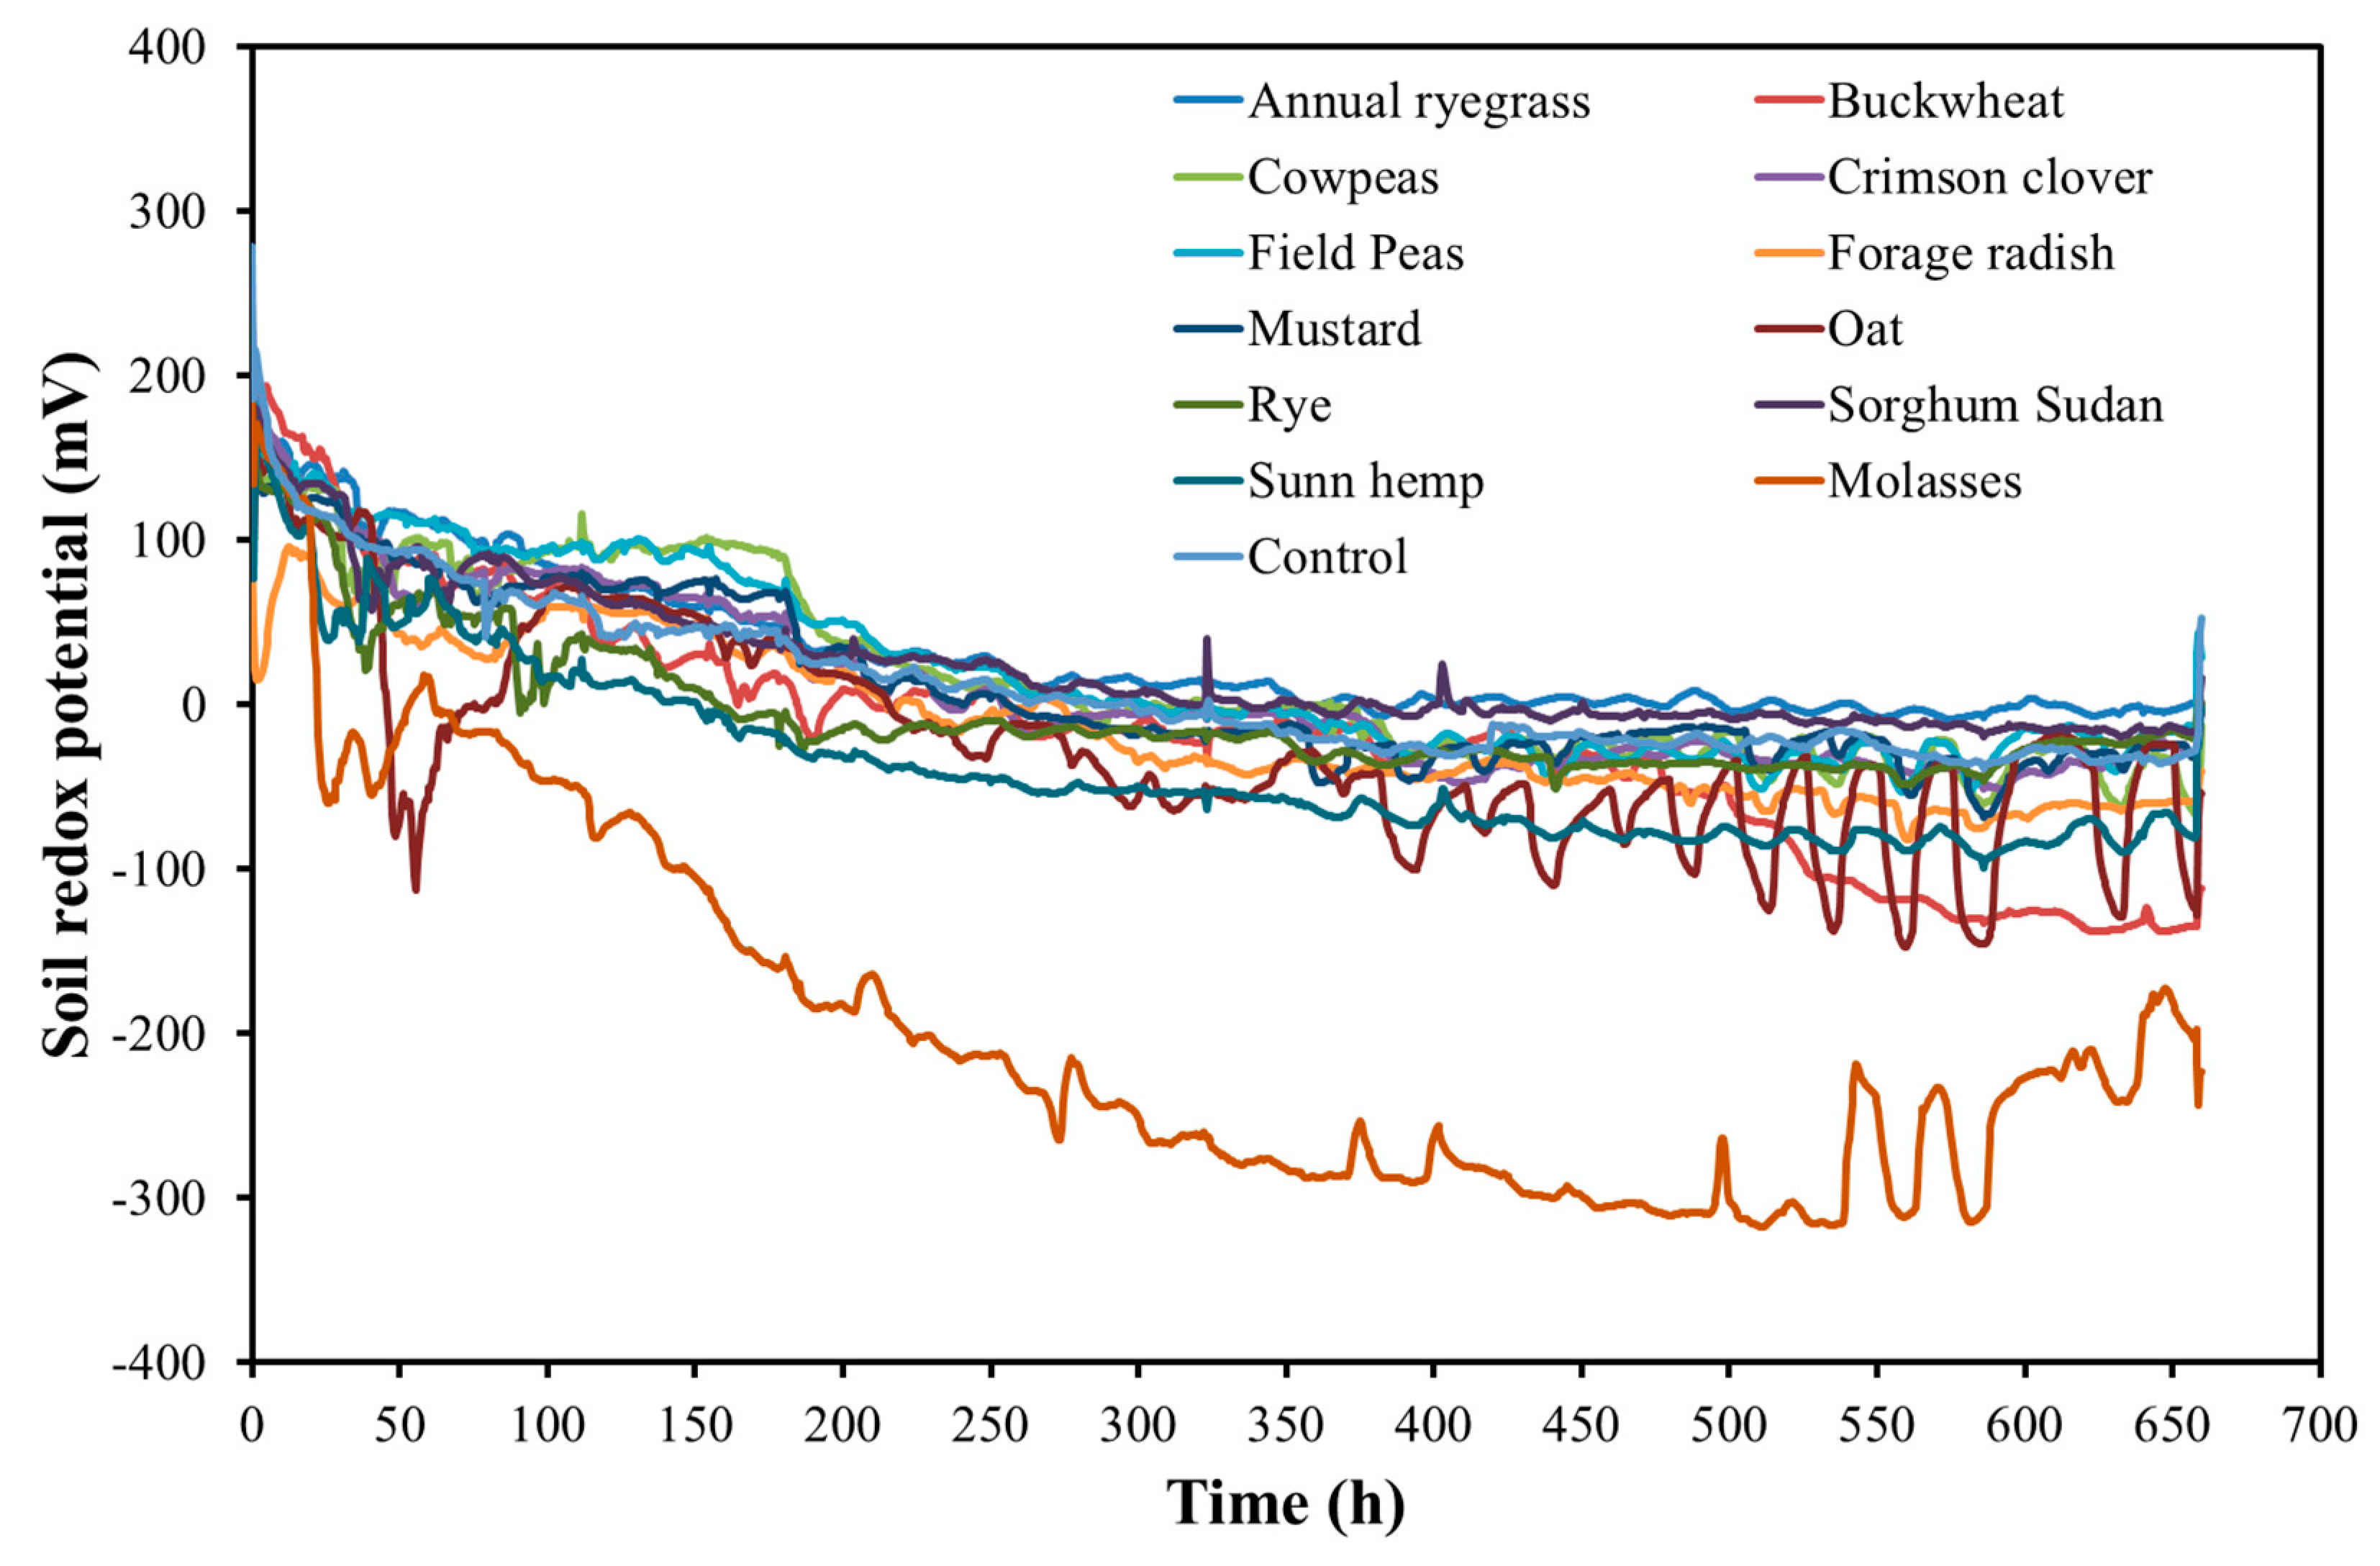
During the first five days, the minimum temperature of the greenhouse was erroneously set at 18 °C. Once corrected, when the minimum temperature was adjusted to 25 °C, an increase of the minimum temperature was clearly observed. The initial lower minimum temperature may have negatively affected the soil microbial activity, considering that based on the literature a minimum of 17 °C is recommended during the ASD treatment, especially during the first week. The greenhouse average temperature during the whole experiment was 26.5 °C while the soil average temperature was 28.1 °C, almost 2 °C higher. The soil redox potential (Eh) time course comparing soil amended with molasses, cover crops, and the untreated control over 28 days is presented in Figure 1, and clearly shows a reduction of Eh as soon as the ASD treatment started. While all the treatments, including the untreated control went anaerobic (Eh < 200 mV), after approximately 24 h, soil amended with molasses started achieving level of redox potential much lower (−300 mV) than those observed in all the cover crop amended soil (−100 mV in the best case), and molasses-amended soil remained highly anaerobic for most of the 28-day period.
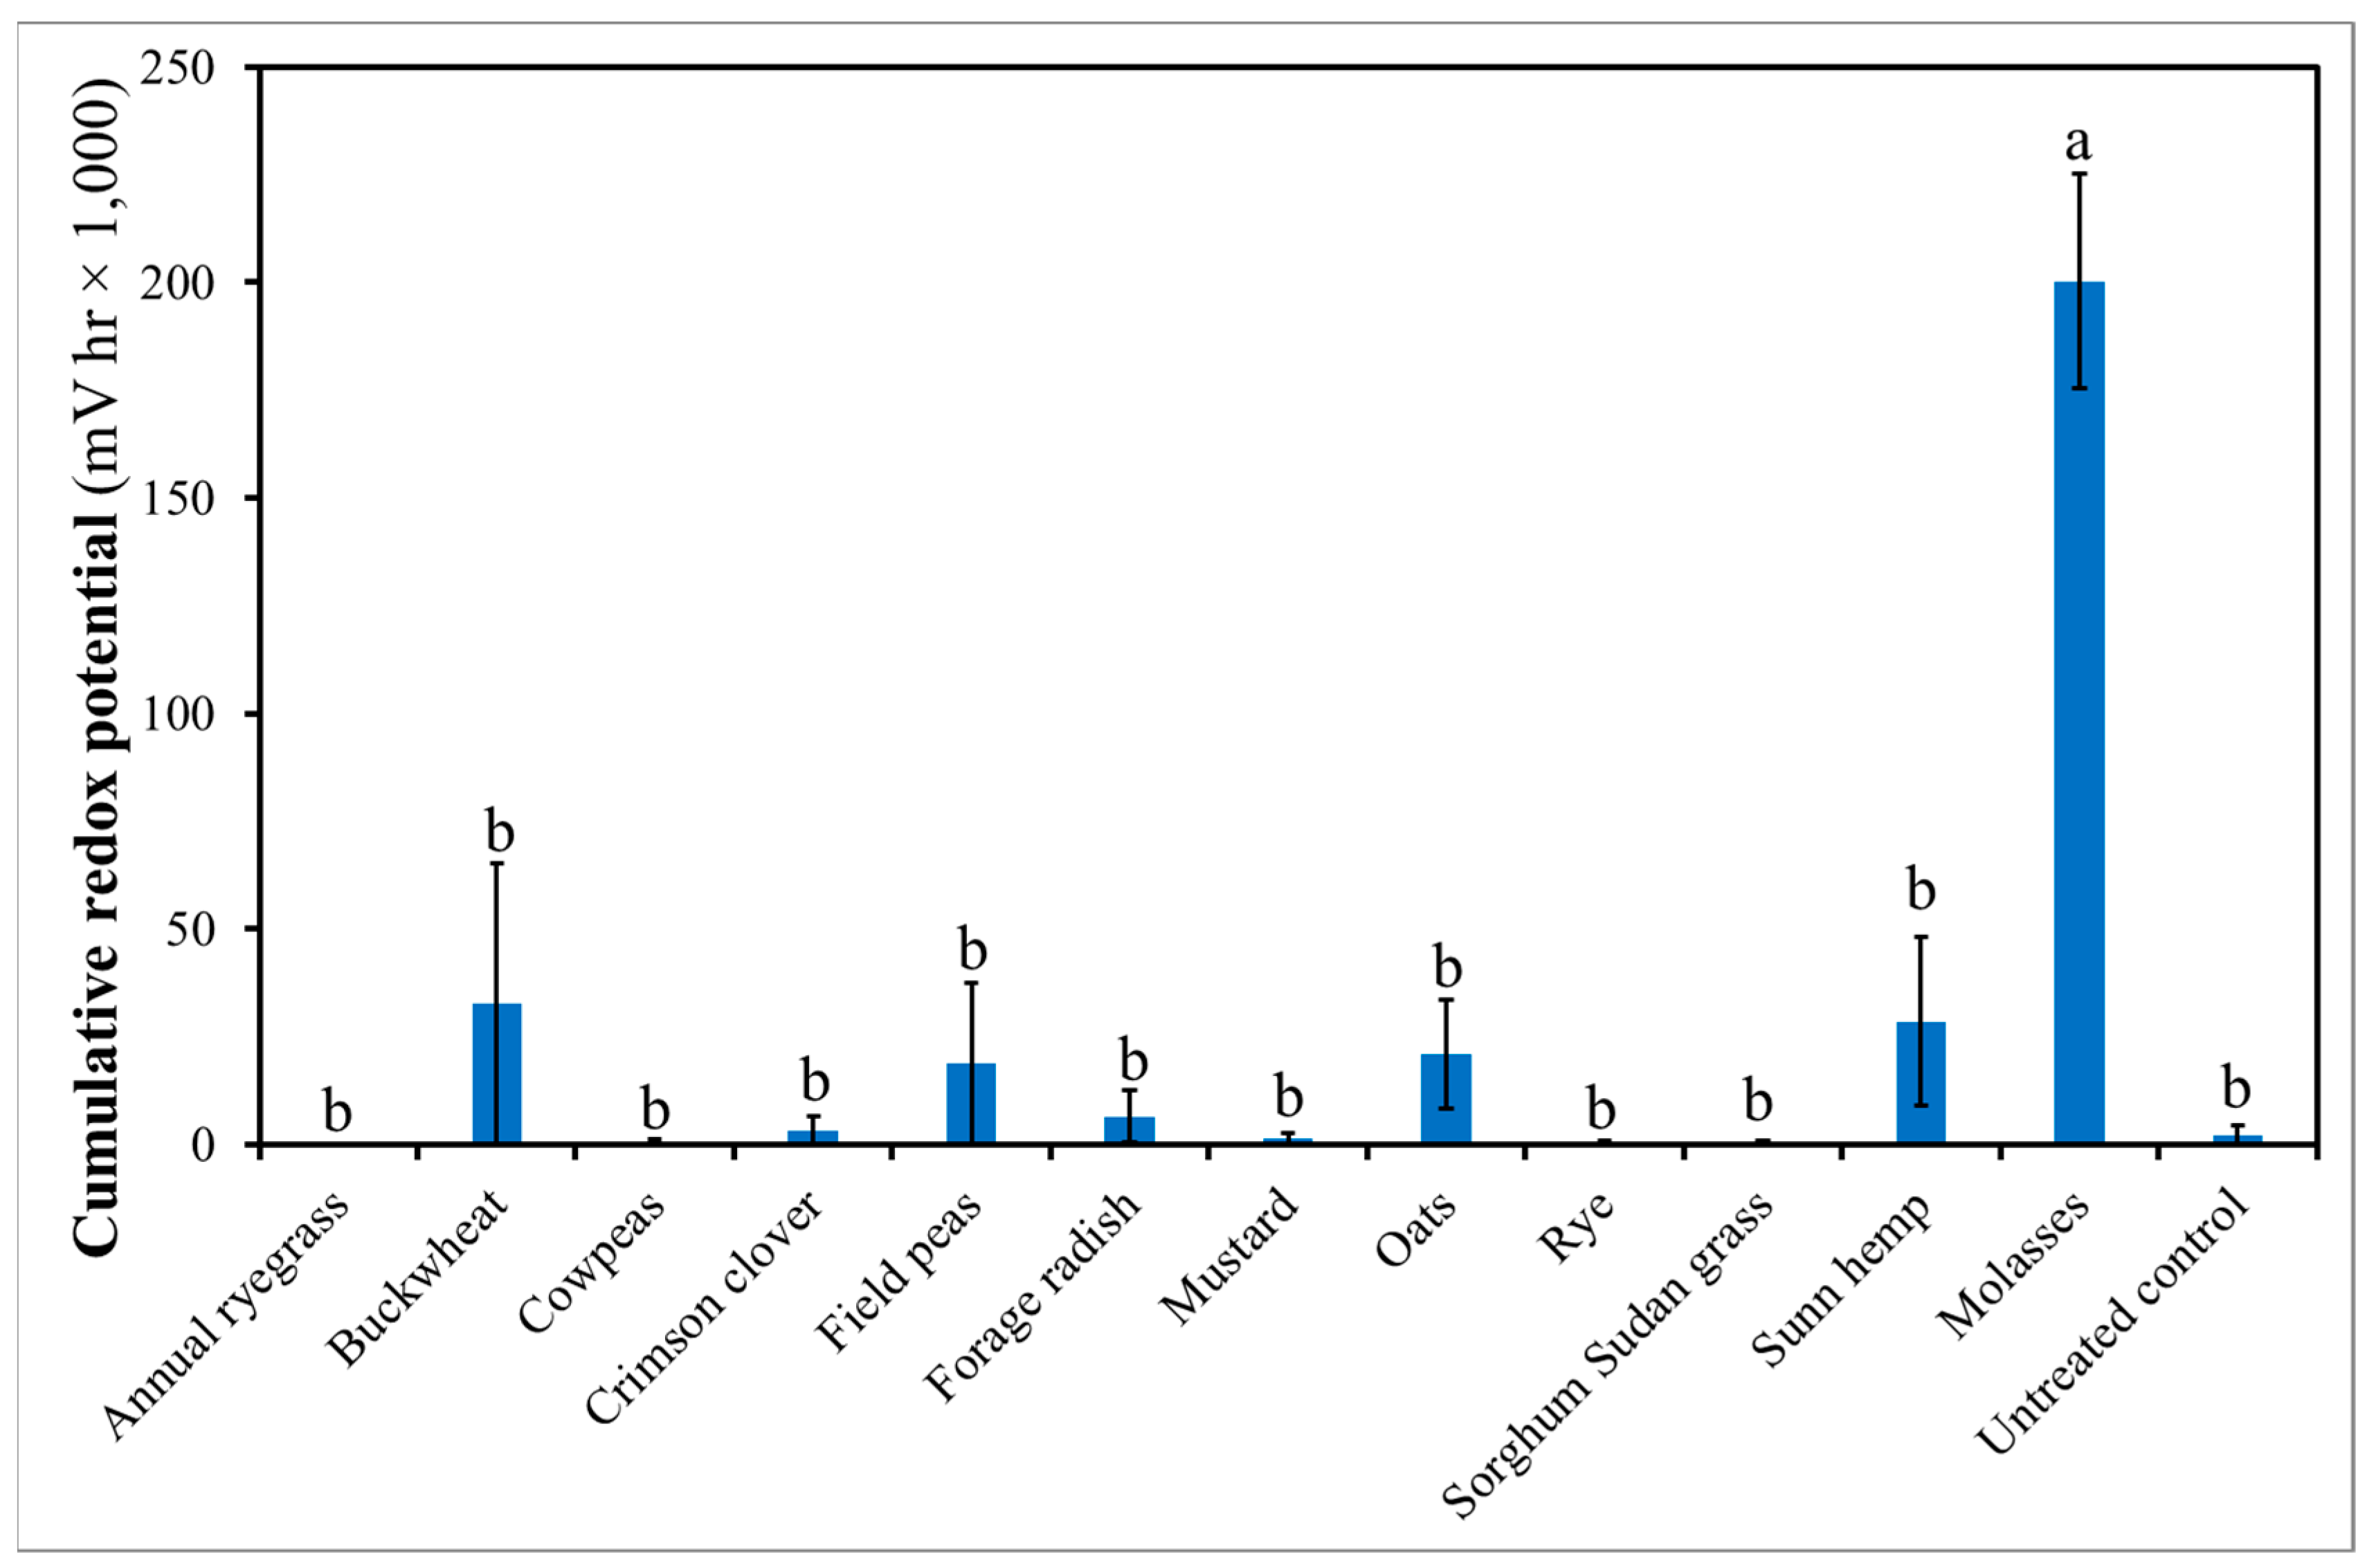
A decrease of anaerobicity was observed around 50 h after treatment initiation, which was due to a decrease of the temperature in the greenhouse associated with cold weather and an issue with the heating system, but after resetting the minimum greenhouse temperature at 25 °C, the general trend observed for all the treatments was a gradual decrease in soil redox potential. In more detail, the cover crops that reached the lower levels of Eh, and thus higher levels of anaerobicity were oat and buckwheat, followed by sunn hemp and forage radish. However, the soil redox potential time course, while a great tool to visualize the shift of anaerobic conditions over time, does not allow a clear comparison between tested treatments. For this, the cumulative soil redox potential (∑Eh) presented in Figure 2 indicates the number of mVhr over the entire four-week period. This measurement is a better indicator of the overall level of anaerobicity achieved and thus, could also be a better indicator of the efficacy of each cover crop tested in comparison to molasses. The level of ∑Eh achieved with the molasses was higher than that observed at field level for molasses based ASD treatments [13,17,21], which could be explained by the complete limitation of gas exchanges achieved in a pot system as compared to a field system [43] and is consistent with other studies conducted similarly [20]. This is also why the untreated control also became anaerobic without adding a C source. On the other hand, the levels of ∑Eh achieved amending the soil with the cover crops were on average well below 50,000 mVhr, which is considered a minimum threshold for an effective ASD treatment [2,8]. The significant difference in ∑Eh observed between molasses and the other cover crops may be discouraging, nevertheless, this experiment was designed to evaluate the strict effect of the selected cover crops in comparison to one of the best sources of C used for the application of ASD, using significantly higher levels of C. Moreover, cover crops were tested without any supplementary organic amendment such as composted poultry litter which seem to be critical to achieve higher levels of anaerobicity [13,17,20,21]. Therefore, a field scale comparison is needed before discounting the potential of cover crops as a source of C.
Despite the generally higher level of anaerobicity achieved with the quite hermetic pot-in-pot system used in this study, the level of anaerobicity achieved by each source of C tested seems to be related to the amount of biomass and C applied with the specific cover crop or with the molasses (Table 3 and Figure 2). These results confirm in fact that molasses is a good source of C for ASD applications as it diffuses throughout the soil matrix and can provide high amounts of readily available sugar to stimulate the soil microbial activity. On the other hand, despite its limitations, this study highlights some of the potential benefits and limitations associated with using cover crops as a source of C for ASD applications.
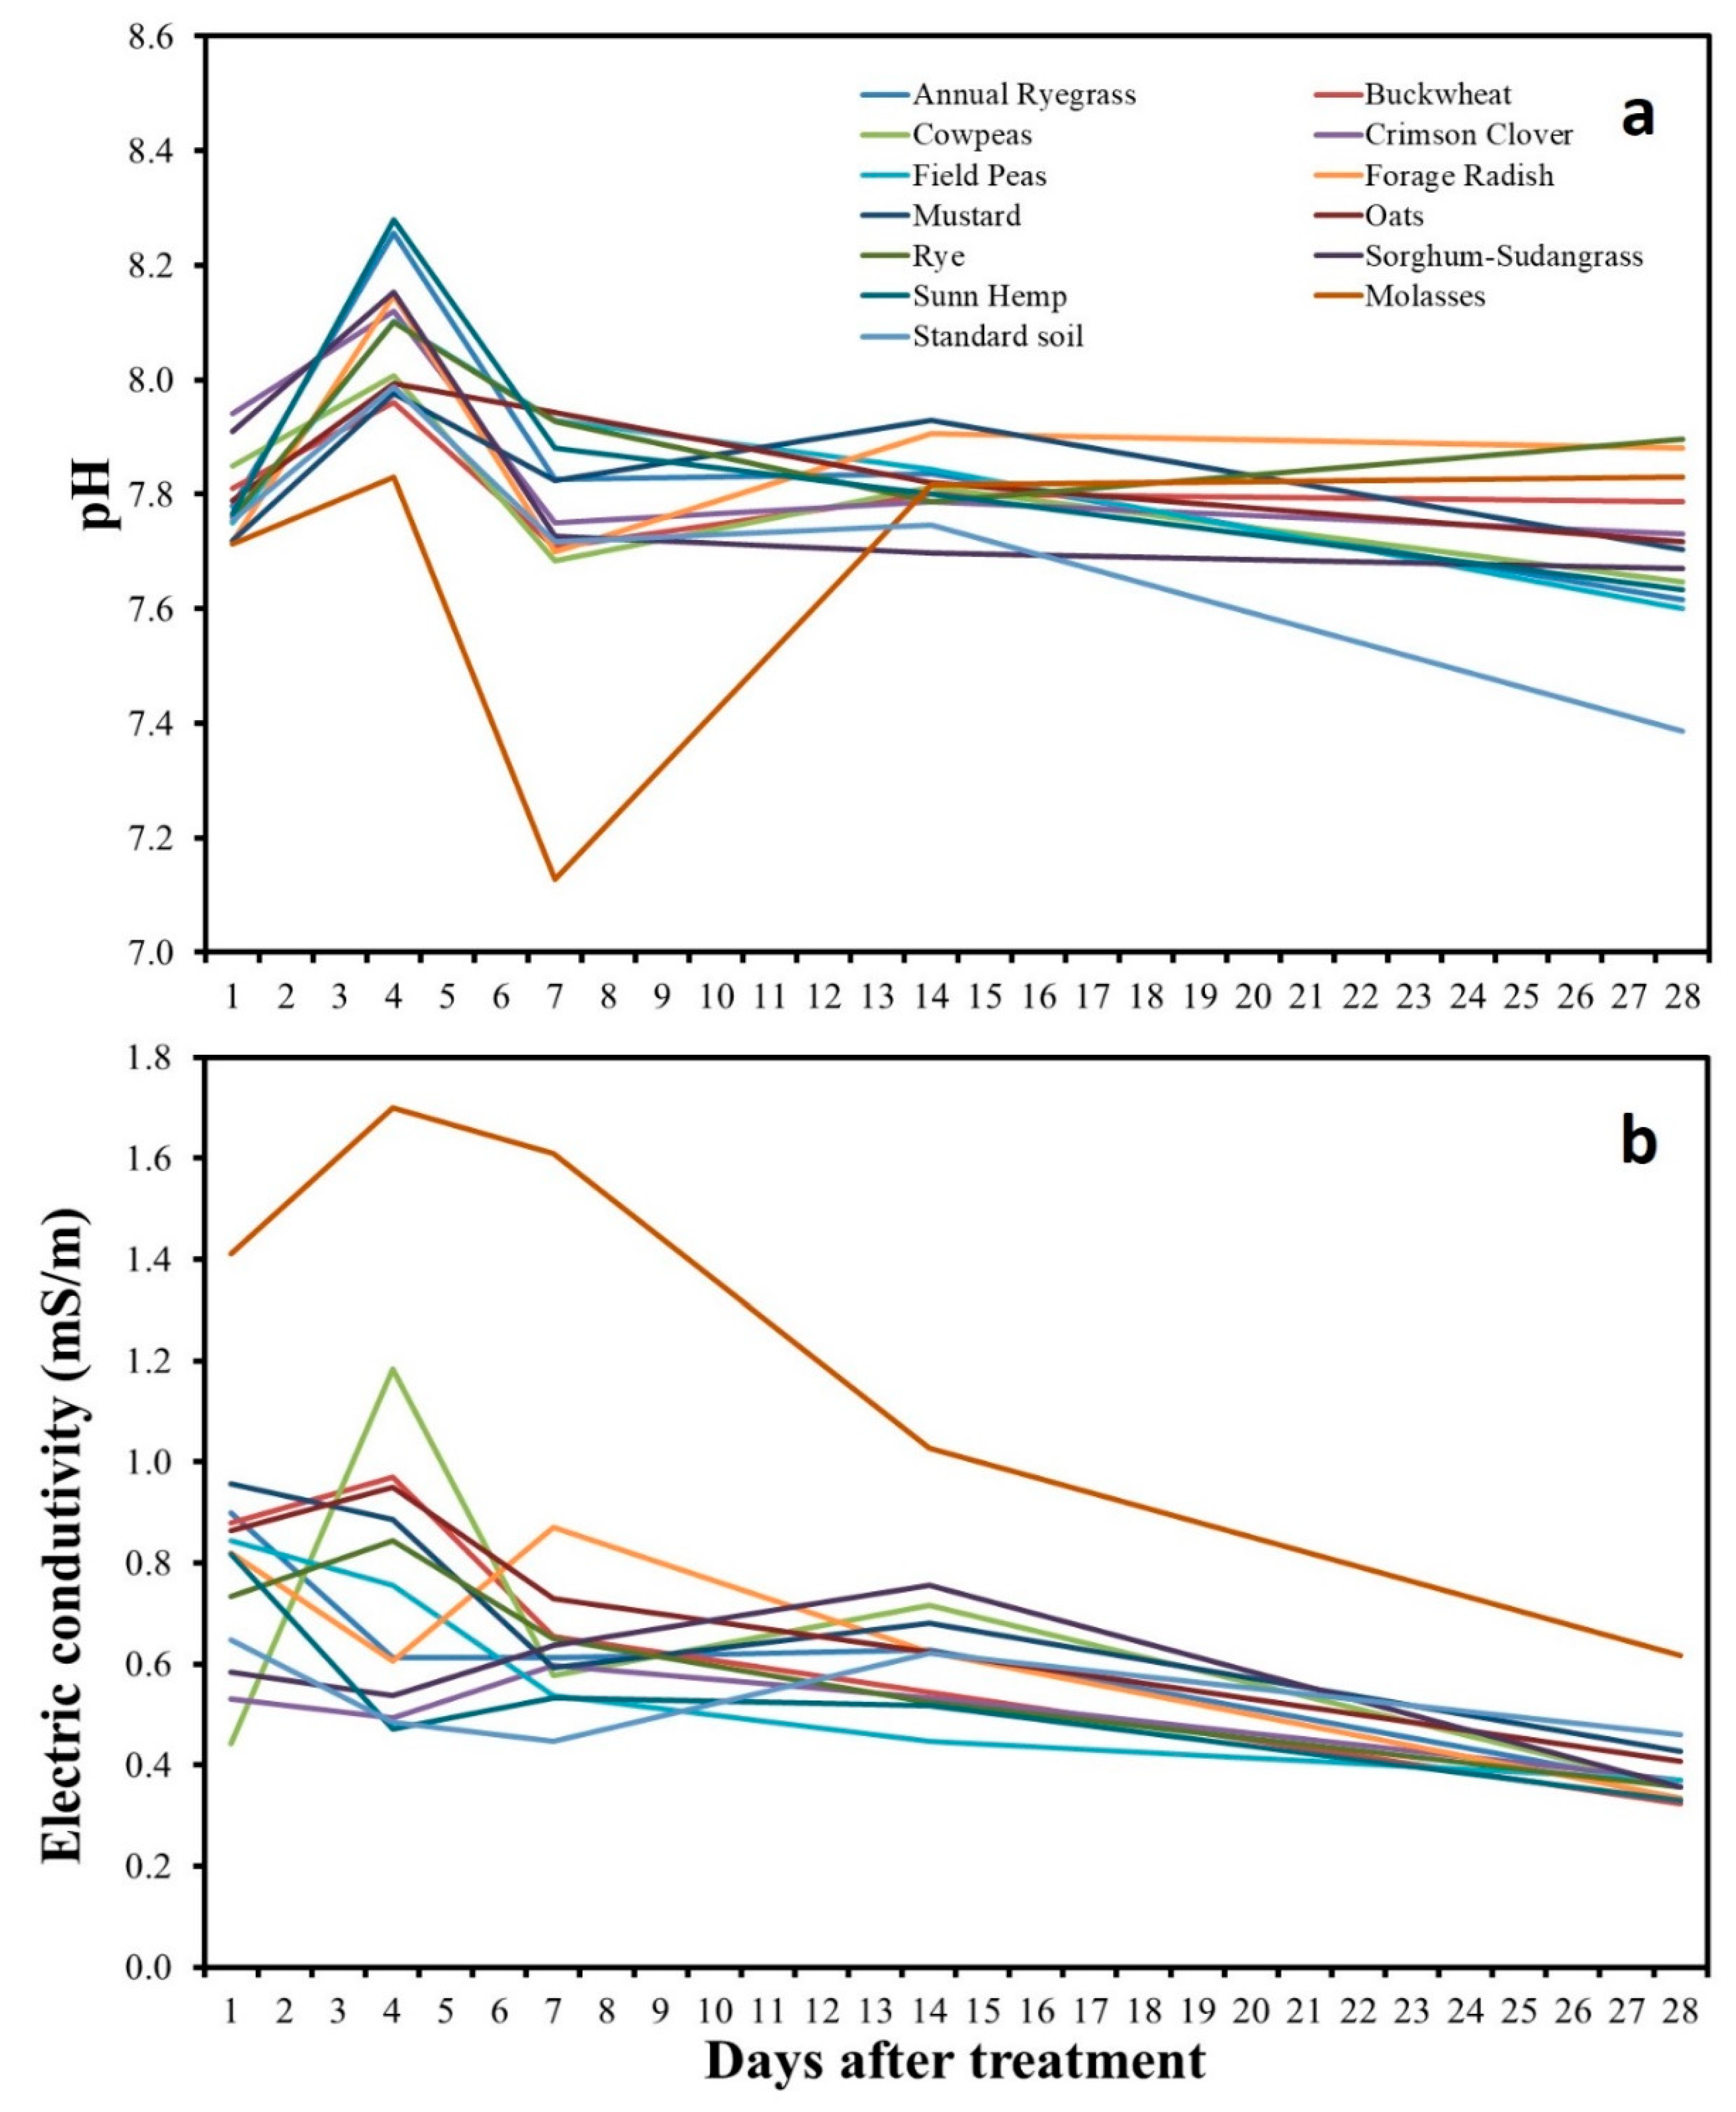
The soil pH time course observed during the four-week ASD treatment, as affected by the source of C applied, is presented in Figure 3a. After a slight initial increase of soil pH observed at 4 DAT, soil pH decreased from sampling dates 4 to 7 DAT, and then increased again after at 14 DAT. As observed for the electrical conductivity at 4 and 7 DAT, molasses application resulted in a different trend when compared to the other treatments and experienced a substantial decrease of soil pH compared to all the other treatments at 4 and 7 DAT. These results are consistent with the findings of previous studies that have reported a decrease of soil pH during the first week of the ASD treatment followed by a return of the soil pH to the initial level during the following weeks [18,35]. The significantly lower soil pH observed in molasses at 4 and 7 DAT in comparison to all of the cover crops tested is consistent with the soil redox potential time course or the cumulative Eh, and may be explained by the production and accumulation of organic acids during the anaerobic decomposition of the C source [2,15,44].
In Figure 3b the time course of the soil EC during the four-week ASD treatment as influenced by the source of C used is presented.
A general decrease of the soil EC was observed over time from the beginning toward the end of the experiment with a high EC peak at 4 DAT in the case of molasses which consistently had a substantially higher EC level compared to all the other treatments, which did not differentiate significantly from the untreated soil. The EC time course provides information on the overall contribution and potential release of nutrients of each cover crop or source of carbon [18,35].
3.5. Treatment Effect on Soil Mineral Content
The analysis of the mineral content in the soil at 1, 7, and 28 DAT revealed a significant effect of the C sources tested on the availability of nutrients (Table 6). Consistent with previous ASD studies, a decrease in the level of NO3-N was observed at 7 and 28 DAT in soil amended with all tested treatments compared to the untreated control, with the lowest values on NO3-N observed in the case of the molasses amended soil. Such results may be explained by the low level of nitrification usually observed in the soil under anaerobic conditions; yet, under anaerobic conditions, potential losses of NO3-N may occur via denitrification [2,18,35]. Moreover, the availability of high levels of labile C, stimulating a fast microbial growth may determine N immobilization and thus a decrease of mineral N in the soil [2,18,35]. As observed in previous ASD studies employing molasses as a C source, molasses resulted in a substantial increase of K content in the soil along with an increase of the level of S and Mn that was consistent at every sampling date. The highest level of P and Fe were also observed in soil amended with molasses at 28 DAT. Soil amended with cover crops had, on average, lower levels of nutrients compared to soil amended with the molasses, except for forage radish that resulted in a higher level of Na in the soil. This was consistent with the higher level of Na accumulated in the forage radish tissues at harvest. While the in situ incorporation of cover crop biomass would simply return to the soil pre-existing nutrients, the capacity of different cover crop species to selectively accumulate specific nutrients may affect their availability for the following crop. Alternatively, in a cut and carry cover crop system as tested in this study, the relatively lower level of nutrients generally observed in soil amended with cover crops compared to soil amended with molasses suggest that cover crops offer the opportunity to minimize any potential risk of nutrient loss compared to molasses, especially for K and P [18,35]. On the other hand, a lower level of those nutrients in soil amended with cover crops may negatively affect plant growth and crop yield.
3.6. Treatment Effect on Lettuce Growth and Mineral Profile
After the ASD treatment, lettuce was cultivated in the treated soil amended with different sources of C and the untreated control to assess the potential impact of the C sources examined on nutrient availability and plant growth and assess any possible risk of plant stunting or phytotoxicity. At harvest (24 DAP), no significant differences were observed among tested treatments in terms of lettuce leaf number, plant fresh weight, plant dry weight and dry matter content (Table 7). Significant differences were observed only for the leaf area, with lettuce plants grown in the soil amended with molasses showing a greater leaf area (2838 cm2 plant) compared to plants grown in soil amended with sorghum sudangrass, sunn hemp, cowpea, field peas, and annual ryegrass. Whereas no differences were observed between all the other C sources.
Small differences were observed also in terms of specific leaf area and leaf dry mass per unit area; however, no relevant differences in terms of plant growth and commercial quality were observed between all the treatments, nor symptoms of plant stunting or phytotoxicity were observed in any of the treatment tested. Examining the total carbon (C) content and the total nitrogen (N) content, lettuce plants grown in soil amended with molasses and field peas had a higher total C content compared to plants grown in untreated soil or amended with buckwheat, mustard, and rye. Plants grown in buckwheat had the highest total N content.
When comparing the C:N ratio, lettuce grown in soil amended with molasses had the highest value and buckwheat the lowest, while no significant differences were observed between any of the other treatments (Table 8).
Examining the concentration of macro- and micro-minerals of lettuce plants grown in ASD treated soil amended with different C sources, no differences were observed between treatments for all the minerals except for Na, Mn, and Zn (Table 9). Lettuce grown in soil amended with forage radish had the highest concentration of Na, while plants grown in soil amended with molasses had the highest concentration of Mn and Zn. At harvest, the lettuce nitrate content on a fresh weight basis ranged from 1855 and 2574 mg kg−1, however, no significant differences were observed between all tested treatments. Overall, the third phase of this study revealed that the sources of C tested had only minimum effects on plant growth and quality of Salanova lettuce, and no phytotoxicity was observed after any of the ASD treatments. The limited effect of the C sources tested on lettuce plant growth, quality, and mineral uptake observed in this study is partially in contrast with the findings of previous studies conducted on fresh-market tomatoes, which showed significant effects of the soil amendments in terms of plant growth, yield, and mineral content [13,17,21]. However, the limited impact observed on the lettuce may be explained by the relatively short cycle of the lettuce crop as well as by the balanced and gradual release of minerals associated with the amendment of the soil with cover crops.
4. Conclusions
Comparing the performances of twelve cover crops in a preliminary pot experiment conducted in the greenhouse under controlled conditions, a significant amount of variability was observed between different cover crop species in terms of fresh and dry biomass production as well as in terms of total C and total N content and mineral concentration. The results of the first experiment revealed that among the selected cover crops, buckwheat produced the highest above-ground and total plant dry biomass, accumulating the largest amount of total C in a relatively short time, thus showing good potential as a source of C for ASD applications. In the second phase of the study, simulating the application of ASD in a pot-in-pot system, and comparing eleven of the initial twelve cover crop species selected with molasses as C sources, it was observed that molasses-amended soil achieved a significantly higher level of anaerobicity and significantly lowered soil pH compared to soil amended with any of the cover crops tested. Nevertheless, it is hypothesized that the level of anaerobicity achieved could be associated with the amount of biomass and C provided by each amendment, and buckwheat and other species have potential as C sources. Further studies are warranted to verify this hypothesis and assess the performance of the most promising cover crops at field scale and potentially in combination with either dry or liquid molasses in order to increase available C, while reducing the cost associated with an entirely molasses-based ASD treatment [22]. The third part of the study aimed at assessing the impact of ASD applied using different cover crops or molasses as a C source on lettuce yield and quality revealed that tested treatments had limited effects on lettuce plant growth and quality and none of the treatments caused plant stunting or phytotoxicity. This study was conducted in the absence of lettuce soilborne pathogens to determine the potential impact of cover crops for ASD on plant nutrition and phytotoxicity. Based on the levels of anaerobicity achieved with cover crops alone, the next stage of research could involve combinations of cover crops with other sources of C to determine impacts on plant pathogens.
Supplementary Materials
The following are available online at https://www.mdpi.com/2073-4395/10/10/1614/s1, Figure S1: Above-ground fresh biomass of selected cover crops at 32 and 46 days after sowing (DAS). Values are means with standard errors (n = 4). Data were subjected to ANOVA and differences among means were determined by Student–Newman–Keuls post hoc multiple comparison procedure. Different letters within each DAS represent statistical differences for p < 0.05. Figure S2: Temperature of soil during anaerobic soil disinfestation treatment with molasses and selected cover crops over 28 days. Table S1: Mineral concentration of above-ground tissue of selected cover crop species at 32 days after sowing. Table S2: Mineral content of above-ground tissue of selected cover crop species at 46 days after sowing.
Author Contributions
Conceptualization, F.D.G., L.V. and E.N.R.; methodology, F.D.G., L.V., E.N.R., A.F. and C.W.; software, F.D.G. and L.V.; validation, F.D.G.; formal analysis, F.D.G.; investigation, L.V. and F.D.G.; resources, F.D.G., J.C.H. and E.N.R.; data curation, L.V. and F.D.G.; writing—Original draft preparation, L.V. and F.D.G.; writing—Review and editing, F.D.G., E.N.R., J.C.H., A.F., C.W.; visualization, L.V. and F.D.G.; supervision, F.D.G. and A.F.; project administration, F.D.G.; funding acquisition, F.D.G. and E.N.R. All authors have read and agreed to the published version of the manuscript.
Funding
This research was funded by the USDA Agricultural Research Service Areawide Project on Anaerobic Soil Disinfestation—Pennsylvania State University Agreement Number: 58-6034-8-018 and by the USDA National Institute of Food and Agriculture and Hatch Appropriations under Project #PEN04723 and Accession #1020664.
Acknowledgments
The authors wish to thank Scott Di Loreto, Chris Sanchez, Diane Lehr, Zakaria Nur, Peter D’Aiuto, Michael Hensley, Wesley Schonborn, Johnna Stafford, and Sara Houpt for their technical assistance.
Conflicts of Interest
The authors declare no conflict of interest. The funders had no role in the design of the study; in the collection, analyses, or interpretation of data; in the writing of the manuscript, or in the decision to publish the results.
References
- O’Brien, P.A. Biological control of plant diseases. Australas Plant Pathol. 2017, 46, 293–304. [Google Scholar] [CrossRef] [Green Version]
- Rosskopf, E.; Di Gioia, F.; Hong, J.C.; Pisani, C.; Kokalis-burelle, N. Organic amendments for pathogen and nematode control. Annu. Rev. Phytopathol. 2020, 58, 277–311. [Google Scholar] [CrossRef] [PubMed]
- Rosskopf, E.N.; Chellemi, D.O.; Kokalis-Burelle, N.; Church, G.T. Alternatives to methyl bromide: A florida perspective. Plant Health Prog. 2005, 6, 19. [Google Scholar] [CrossRef]
- Alexeeff, G.V.; Kilgore, W.W. Methyl bromide. Residue Rev. 1983, 88, 101–153. [Google Scholar] [CrossRef] [PubMed]
- Martin, F.N. Development of alternative strategies for management of soilborne pathogens currently controlled with methyl bromide. Annu. Rev. Phytopathol. 2003, 41, 325–350. [Google Scholar] [CrossRef] [PubMed] [Green Version]
- Shennan, C.; Muramoto, J.; Koike, S.; Baird, G.; Fennimore, S.; Samtani, J.; Bolda, M.; Dara, S.; Daugovish, O.; Lazarovits, G.; et al. Anaerobic soil disinfestation is an alternative to soil fumigation for control of some soilborne pathogens in strawberry production. Plant Pathol. 2018, 67, 51–66. [Google Scholar] [CrossRef]
- Rosskopf, E.N.; Di Gioia, F.; Hong, J.; Ozores-Hampton, M.; Zhao, X.; Black, Z.; Gao, Z.; Wilson, C.; Thomas, J.; Jones, J.; et al. Anaerobic soil disinfestation: Areawide project on obstacles and adoption. Acta Hortic. 2020, 1270, 23–36. [Google Scholar] [CrossRef]
- Rosskopf, E.N.; Serrano-Pérez, P.; Hong, J.; Shrestha, U.; Del, M.; Rodríguez-Molina, C.; Martin, K.; Kokalis-Burelle, N.; Shennan, C.; Muramoto, J.; et al. Anaerobic soil disinfestation and soilborne pest management. In Organic Amendments and Soil Suppressiveness in Plant Disease Management; Meghvansi, M.K., Varma, A., Eds.; Springer International Publishing: Dordrecht, The Netherlands, 2015; pp. 277–305. ISBN 9783319230757. [Google Scholar]
- Hong, J.; Di Gioia, F.; Jones, J.; Turechek, W.; Kokalis-Burelle, N.; Johns, C.W.; Finley, N.; Ozores-Hampton, M.; McCollum, G.; Rosskopf, E.N. Defining anaerobic soil disinfestation through changes in the microbiome. Acta Hortic. 2020, 97–110. [Google Scholar] [CrossRef]
- Guo, H.; Zhao, X.; Rosskopf, E.N.; Di Gioia, F.; Hong, J.C.; McNear, D.H. Impacts of anaerobic soil disinfestation and chemical fumigation on soil microbial communities in field tomato production system. Appl. Soil Ecol. 2018, 126, 165–173. [Google Scholar] [CrossRef]
- Momma, N. Biological soil disinfestation (BSD) of soilborne pathogens and its possible mechanisms. Jpn. Agric. Res. Q. 2008, 42, 7–12. [Google Scholar] [CrossRef] [Green Version]
- Butler, D.M.; Kokalis-Burelle, N.; Muramoto, J.; Shennan, C.; McCollum, T.G.; Rosskopf, E.N. Impact of anaerobic soil disinfestation combined with soil solarization on plant-parasitic nematodes and introduced inoculum of soilborne plant pathogens in raised-bed vegetable production. Crop Prot. 2012, 39, 33–40. [Google Scholar] [CrossRef]
- Di Gioia, F.; Ozores-Hampton, M.; Hong, J.; Kokalis-Burelle, N.; Albano, J.; Zhao, X.; Black, Z.; Gao, Z.; Moore, K.; Swisher, M.; et al. The effects of anaerobic soil disinfestation on weed and nematode control, fruit yield, and quality of florida fresh-market tomato. HortScience 2016, 51, 703–711. [Google Scholar] [CrossRef] [Green Version]
- Ueki, A.; Kaku, N.; Ueki, K. Role of anaerobic bacteria in biological soil disinfestation for elimination of soil-borne plant pathogens in agriculture. Appl. Microbiol. Biotechnol. 2018, 102, 6309–6318. [Google Scholar] [CrossRef]
- Hewavitharana, S.S.; Klarer, E.; Reed, A.J.; Leisso, R.; Poirier, B.; Honaas, L.; Rudell, D.R.; Mazzola, M. Temporal dynamics of the soil metabolome and microbiome during simulated anaerobic soil disinfestation. Front. Microbiol. 2019, 10, 1–17. [Google Scholar] [CrossRef] [Green Version]
- Li, Z.; Di Gioia, F.; Hwang, J.; Hong, J.; Ozores-Hampton, M.; Zhao, X.; Pisani, C.; Rosskopf, E.; Wilson, P.C. Dissipation of fomesafen in fumigated, anaerobic soil disinfestation-treated, and organic-amended soil in Florida tomato production systems. Pest Manag. Sci. 2019, 76, 628–635. [Google Scholar] [CrossRef]
- Guo, H.; Di Gioia, F.; Zhao, X.; Ozores-Hampton, M.; Swisher, M.E.; Hong, J.; Kokalis-Burelle, N.; DeLong, A.N.; Rosskopf, E.N. Optimizing anaerobic soil disinfestation for fresh market tomato production: Nematode and weed control, yield, and fruit quality. Sci. Hortic. 2017, 218, 105–116. [Google Scholar] [CrossRef] [Green Version]
- Di Gioia, F.; Hong, J.; Ozores-Hampton, M.; Zhao, X.; Wilson, C.; Thomas, J.; Li, Z.; Pisani, C.; Guo, H.; Paudel, B.R.; et al. Anaerobic soil disinfestation: Nutrient cycling and potential environmental impact. Acta Hortic. 2020, 1270, 51–62. [Google Scholar] [CrossRef]
- Shennana, C.; Muramoto, J.; Mazzola, M.; Momma, N.; Kobara, Y.; Lamers, J.; Rosskopf, E.N.; Kokalis-Burelle, N.; Butler, D.M. Anaerobic soil disinfestation for soil borne disease control in strawberry and vegetable systems: Current knowledge and future directions. Acta Hortic. 2014, 1044, 165–175. [Google Scholar] [CrossRef]
- Butler, D.M.; Rosskopf, E.N.; Kokalis-Burelle, N.; Albano, J.P.; Muramoto, J.; Shennan, C. Exploring warm-season cover crops as carbon sources for anaerobic soil disinfestation (ASD). Plant Soil 2012, 355, 149–165. [Google Scholar] [CrossRef]
- Paudel, B.R.; Di Gioia, F.; Zhao, X.; Ozores-Hampton, M.; Hong, J.C.; Kokalis-Burelle, N.; Pisani, C.; Rosskopf, E.N. Evaluating anaerobic soil disinfestation and other biological soil management strategies for open-field tomato production in Florida. Renew. Agric. Food Syst. 2018, 1–12. [Google Scholar] [CrossRef]
- Shi, L.; Wang, J.; Gao, Z.; Zhao, X.; Di Gioia, F.; Guo, H.; Hong, J.; Ozores-Hampton, M.; Rosskopf, E. Economic analysis of anaerobic soil disinfestation for open-field fresh-market tomato production in southwest and North Florida. Horttechnology 2019, 29, 777–787. [Google Scholar] [CrossRef] [Green Version]
- Muramoto, J.; Shennan, C.; Zavatta, M.; Baird, G.; Toyama, L.; Mazzola, M. Effect of anaerobic soil disinfestation and mustard seed meal for control of charcoal rot in California strawberries. Int. J. Fruit Sci. 2016, 16, 59–70. [Google Scholar] [CrossRef]
- Liu, L.; Kong, J.; Cui, H.; Zhang, J.; Wang, F.; Cai, Z.; Huang, X. Relationships of decomposability and C/N ratio in different types of organic matter with suppression of Fusarium oxysporum and microbial communities during reductive soil disinfestation. Biol. Control 2016, 101, 103–113. [Google Scholar] [CrossRef]
- Schipanski, M.E.; Barbercheck, M.; Douglas, M.R.; Finney, D.M.; Haider, K.; Kaye, J.P.; Kemanian, A.R.; Mortensen, D.A.; Ryan, M.R.; Tooker, J.; et al. A framework for evaluating ecosystem services provided by cover crops in agroecosystems. Agric. Syst. 2013, 125, 12–22. [Google Scholar] [CrossRef]
- Blok, W.J.; Lamers, J.G.; Termorshuizen, J.; Bollen, G.J. Control of soilborne plant pathogens by incorporating fresh organic amendments followed by tarping. Phytopathology 2000, 90, 253–259. [Google Scholar] [CrossRef] [Green Version]
- McCarty, D.G.; Eichler Inwood, S.E.; Ownley, B.H.; Sams, C.E.; Wszelaki, A.L.; Butler, D.M. Field evaluation of carbon sources for anaerobic soil disinfestation in tomato and bell pepper production in Tennessee. HortScience 2014, 49, 272–280. [Google Scholar] [CrossRef] [Green Version]
- Goud, J.-K.K.C.; Termorshuizen, A.J.; Blok, W.J.; Van Bruggen, A.H.C.C. Long-term effect of biological soil disinfestation on verticillium wilt. Plant Dis. 2004, 88, 688–694. [Google Scholar] [CrossRef] [Green Version]
- Snapp, S.S.; Swinton, S.M.; Labarta, R.; Mutch, D.; Black, J.R.; Leep, R.; Nyiraneza, J.; O’Neil, K. Evaluating cover crops for benefits, costs and performance within cropping system niches. Agron. J. 2005, 97, 322–332. [Google Scholar] [CrossRef] [Green Version]
- Finney, D.M.; White, C.M.; Kaye, J.P. Biomass Production and carbon/nitrogen ratio influence ecosystem services from cover crop mixtures. Agron. J. 2016, 108, 39–52. [Google Scholar] [CrossRef] [Green Version]
- Jose, S. Agroforestry for ecosystem services and environmental benefits: An overview. Agrofor. Syst. 2009, 76, 1–10. [Google Scholar] [CrossRef]
- Murrell, E.G.; Schipanski, M.E.; Finney, D.M.; Hunter, M.C.; Burgess, M.; LaChance, J.C.; Baraibar, B.; White, C.M.; Mortensen, D.A.; Kaye, J.P. Achieving diverse cover crop mixtures: Effects of planting date and seeding rate. Agron. J. 2017, 109, 259–271. [Google Scholar] [CrossRef]
- White, C.M.; Finney, D.M.; Kemanian, A.R.; Kaye, J.P. A model-data fusion approach for predicting cover crop nitrogen supply to corn. Agron. J. 2016, 108, 2527–2540. [Google Scholar] [CrossRef] [Green Version]
- Gabriel, J.L.; Garrido, A.; Quemada, M. Cover crops effect on farm benefits and nitrate leaching: Linking economic and environmental analysis. Agric. Syst. 2013, 121, 23–32. [Google Scholar] [CrossRef]
- Di Gioia, F.; Ozores-Hampton, M.; Zhao, X.; Thomas, J.; Wilson, P.; Li, Z.; Hong, J.; Albano, J.; Swisher, M.; Rosskopf, E. Anaerobic soil disinfestation impact on soil nutrients dynamics and nitrous oxide emissions in fresh-market tomato. Agric. Ecosyst. Environ. 2017, 240, 194–205. [Google Scholar] [CrossRef] [Green Version]
- Kokalis-Burelle, N.; Butler, D.M.; Rosskopf, E.N. Evaluation of cover crops with potential for use in anaerobic soil disinfestation (ASD) for susceptibility to three species of Meloidogyne. J. Nematol. 2013, 45, 272–278. [Google Scholar]
- Sarwar, M.; Kirkegaard, J.A. Biofumigation potential of brassicas II. Effect of environment and ontogeny on glucosinolate production and implications for screening. Plant Soil 1998, 201, 91–101. [Google Scholar] [CrossRef]
- Dinesh, R.; Suryanarayana, M.A.; Nair, A.K.; Ghoshal Chaudhuri, S. Leguminous cover crop effects on nitrogen mineralization rates and kinetics in soils. J. Agron. Crop Sci. 2001, 187, 161–166. [Google Scholar] [CrossRef]
- Clark, A. Managing Cover Crops Profitably; Sustainable Agriculture Research and Education (SARE): College Park, MD, USA, 2008; ISBN 1437903797. [Google Scholar]
- USEPA. Method 3052: Microwave Assisted Acid Digestion of Siliceous and Organically Based Matrices; USEPA: Washington, DC, USA, 1996.
- Di Gioia, F.; Gonnella, M.; Buono, V.; Ayala, O.; Santamaria, P. Agronomic, physiological and quality response of romaine and red oak-leaf lettuce to nitrogen input. Ital. J. Agron. 2017, 12, 47–58. [Google Scholar] [CrossRef] [Green Version]
- Di Gioia, F.; Gonnella, M.; Buono, V.; Ayala, O.; Cacchiarelli, J.; Santamaria, P. Calcium cyanamide effects on nitrogen use efficiency, yield, nitrates, and dry matter content of lettuce. Agron. J. 2017, 109, 354–362. [Google Scholar] [CrossRef]
- Di Gioia, F.; Ozores-Hampton, M.; Hong, J.C.; McCollum, G.; Rosskopf, E.N. ASD: Carbon rate effects on tomato plant growth and organic acid production. In Proceedings of the 2016 Annual International Research Conference on Methyl Bromide Alternatives and Emissions Reductions, Maitland, FL, USA, 8–10 November 2016; pp. 58-1–58-3. [Google Scholar]
- Momma, N.; Yamamoto, K.; Simandi, P.; Shishido, M. Role of organic acids in the mechanisms of biological soil disinfestation (BSD). J. Gen. Plant Pathol. 2006, 72, 247–252. [Google Scholar] [CrossRef]
Figure 1.
Soil redox potential time course over 28 days after treatment application.

Figure 2.
Cumulative redox potential at 28 days after treatment. Values are means with standard errors (n = 3). Data were subjected to ANOVA and differences among means were determined by Student–Newman–Keuls post hoc multiple comparison procedure. Different letters represent statistical differences for p < 0.05.

Figure 3.
Soil pH and electrical conductivity (EC) time course for 28 days after treatment application.
Figure 3.
Soil pH and electrical conductivity (EC) time course for 28 days after treatment application.


Table 1.
Botanical family, common name, scientific name, and broadcast seeding rate of the cover crop species examined.
Table 1.
Botanical family, common name, scientific name, and broadcast seeding rate of the cover crop species examined.
| Botanical Family | Common Name | Scientific Name | Broadcast Seed Rate (kg ha−1) |
|---|---|---|---|
| Leguminosae | Berseem clover | Trifolium alexandrinum L. | 22 |
| Cowpea | Vigna unguiculata (L.) Walp. | 135 | |
| Crimson clover | Trifolium incarnatum L. | 34 | |
| Field pea | Pisum sativum L. | 132 | |
| Sunn hemp | Crotalaria juncea L. | 56 | |
| Brassicaceae | Forage radish | Raphanus sativus L. var. longipinnatus | 22 |
| Mustard | Brassica juncea L. Czern. | 17 | |
| Polygonaceae | Buckwheat | Fagopyrum esculentum Möench | 101 |
| Graminaceae | Annual Ryegrass | Lolium multiflorum Lam | 34 |
| Oat | Avena sativa L. | 157 | |
| Rye | Secale cereale L. | 179 | |
| Sorghum-sudangrass hybrid | S. bicolor × S. vulgare var. sudanense | 56 |
Table 2.
Root, above-ground and total plant dry biomass of selected cover crop species 32 and 46 days after sowing (DAS) 1.
Table 2.
Root, above-ground and total plant dry biomass of selected cover crop species 32 and 46 days after sowing (DAS) 1.
| Cover Crop Species | 32 DAS | 46 DAS | ||||
|---|---|---|---|---|---|---|
| Root Dry Biomass | Above-Ground Dry Biomass | Total Plant Dry Biomass | Root Dry Biomass | Above-Ground Dry Biomass | Total Plant Dry Biomass | |
| kg ha−1 | ||||||
| Annual ryegrass | 299.1 bc | 1325.7 d | 1624.8 c | 1192.6 a | 3059.2 e | 4251.8 d |
| Buckwheat | 287.0 bc | 2894.3 a | 3181.2 a | 627.6 bc | 8312.7 a | 8940.2 a |
| Cowpeas | 165.9 c | 1100.8 d | 1266.7 cd | 485.5 c | 3279.1 e | 3764.5 de |
| Crimson clover | 175.8 c | 1014.1 de | 1189.9 cd | 501.5 c | 2974.0 e | 3475.5 def |
| Field peas | 127.7 c | 962.4 de | 1090.1 cde | 331.7 c | 2643.0 e | 2974.8 ef |
| Forage radish | 182.5 c | 2569.6 ab | 2752.1 ab | 1183.2 a | 5121.1 c | 6304.3 b |
| Mustard | 227.8 c | 2478.0 b | 2705.8 ab | 614.8 bc | 5944.6 b | 6559.4 b |
| Oats | 420.2 ab | 1822.1 c | 2242.3 b | 986.4 ab | 5243.3 c | 6229.7 b |
| Rye | 547.9 a | 2412.7 b | 2960.6 a | 1163.9 a | 4079.5 d | 5243.3 c |
| Sorghum Sudan grass | 158.7 c | 623.1 ef | 781.8 de | 706.6 bc | 1957.3 f | 2663.9 fg |
| Sunn hemp | 89.7 c | 476.6 f | 566.2 e | 443.4 c | 1633.3 f | 2076.7 g |
| p-value | 0.0001 | 0.0001 | 0.0001 | 0.0001 | 0.0001 | 0.0001 |
1 Reported values are averages of four replications. Means followed by different letters within each column are significantly different at α = 0.05 via Student-Newman-Keuls post-hoc test.
Table 3.
Total carbon (C), total nitrogen (N) content, C:N ratio, and total carbon applied (TCA) amending the soil with the above-ground portion of selected cover crop species and molasses 1.
Table 3.
Total carbon (C), total nitrogen (N) content, C:N ratio, and total carbon applied (TCA) amending the soil with the above-ground portion of selected cover crop species and molasses 1.
| Cover Crop Species | 32 Days After Sowing | 46 Days After Sowing | ||||||
|---|---|---|---|---|---|---|---|---|
| Total N (%) | Total C (%) | C:N | TCA (kg ha−1) | Total N (%) | Total C (%) | C:N | TCA (kg ha−1) | |
| Annual ryegrass | 4.64 b | 38.26 c | 8.35 cde | 507.3 e | 2.21 b | 39.51 c | 18.04 c | 1209.1 g |
| Buckwheat | 3.18 e | 39.55 b | 13.18 b | 1146.3 b | 1.27 f | 41.19 b | 33.45 a | 3424.8 b |
| Cowpea | 5.04 a | 38.33 c | 7.62 e | 421.3 ef | 1.70 de | 40.71 b | 24.45 b | 1333.2 g |
| Crimson clover | 4.47 bc | 39.74 b | 8.91 cde | 402.6 ef | 2.02 bc | 39.65 c | 19.82 c | 1178.6 g |
| Field peas | 4.83 ab | 40.25 ab | 8.36 cde | 386.7 ef | 1.90 cd | 42.39 a | 23.39 b | 1118.7 g |
| Forage radish | 3.90 d | 34.72 e | 9.08 cde | 892.2 c | 1.99 bc | 36.69 d | 18.62 c | 1879.0 f |
| Mustard | 4.46 bc | 35.28 e | 7.98 de | 877.3 c | 1.56 e | 40.99 b | 26.86 b | 2436.5 c |
| Oat | 4.60 b | 38.31 c | 8.33 cde | 696.3 d | 1.58 e | 41.32 b | 26.33 b | 2168.0 d |
| Rye | 4.07 d | 40.52 ab | 10.15 c | 978.8 c | 2.41 a | 41.64 b | 17.65 c | 1699.7 f |
| Sorghum Sudangrass | 4.16 cd | 40.54 ab | 9.75 cd | 250.3 fg | 1.69 de | 41.50 b | 24.94 b | 811.3 h |
| Sunn hemp | 5.09 a | 41.07 a | 8.09 cde | 195.8 g | 2.09 bc | 40.62 b | 19.51 c | 662.0 h |
| Molasses | 1.05 f | 36.54 d | 35.42 a | 7161.8 a | 1.05 g | 36.54 d | 35.42 a | 7161.8 a |
| p-value | 0.0001 | 0.0001 | 0.0001 | 0.0001 | 0.0001 | 0.0001 | 0.0001 | 0.0001 |
1 Reported values are averages of four replications. Means followed by different letters within each column are significantly different at α = 0.05 via Student-Newman-Keuls post hoc test.
Table 4.
Macro and micronutrient uptake and potential contribution to soil fertility of above-ground tissues of selected cover crop species at 32 days after sowing 1.
Table 4.
Macro and micronutrient uptake and potential contribution to soil fertility of above-ground tissues of selected cover crop species at 32 days after sowing 1.
| Cover Crop Species | N | NO3-N | P | K | Ca | Mg | S | Na | Fe | Mn | Zn | Bo | Cu |
|---|---|---|---|---|---|---|---|---|---|---|---|---|---|
| kg ha−1 | g ha−1 | ||||||||||||
| Annual ryegrass | 31.0 c | 13.4 ab | 10.7 cd | 96.3 c | 7.4 ef | 6.8 d | 4.9 cde | 3.7 c | 425.7 | 229.9 de | 94.2 ef | 12.1 d | 26.6 bc |
| Buckwheat | 30.8 c | 18.2 ab | 26.2 a | 166.8 a | 24.7 c | 32.0 a | 8.1 c | 1.5 d | 866.5 | 688.5 a | 273.2 a | 119.2 a | 29.6 ab |
| Cowpea | 28.4 c | 5.3 b | 13.8 c | 56.9 d | 20.0 cd | 10.1 d | 6.7 cd | 0.3 d | 366.4 | 444.4 bc | 79.3 f | 47.2 c | 7.9 e |
| Crimson clover | 31.0 c | 4.1 b | 7.1 de | 53.8 d | 14.7 de | 7.1 d | 5.1 cde | 4.1 c | 150.5 | 170.5 e | 65.0 f | 47.5 c | 9.4 e |
| Field peas | 33.3 c | 4.0 b | 9.5 de | 53.2 d | 13.3 e | 5.4 d | 3.5 de | 1.4 d | 233.9 | 156.6 e | 78.6 f | 17.5 d | 8.4 e |
| Forage radish | 56.9 a | 18.5 ab | 22.9 ab | 174.9 a | 52.4 a | 26.3 b | 24.5 b | 22.6 a | 406.1 | 490.9 bc | 178.4 c | 95.3 b | 21.3 d |
| Mustard | 48.3 ab | 33.5 a | 19.0 b | 186.0 a | 46.6 b | 20.4 c | 30.8 a | 10.4 b | 499.4 | 564.0 b | 232.1 b | 95.0 b | 24.2 cd |
| Oat | 43.8 b | 25.0 ab | 20.6 b | 135.0 b | 8.5 ef | 9.6 d | 8.4 c | 1.9 d | 275.2 | 365.4 cd | 138.6 d | 18.3 d | 25.5 bcd |
| Rye | 52.8 ab | 19.9 ab | 21.5 b | 160.2 a | 11.7 e | 11.0 d | 8.8 c | 1.0 d | 492.5 | 295.9 de | 120.4 de | 15.1 d | 32.9 a |
| Sorghum Sudan | 16.2 d | 2.3 b | 7.5 de | 36.8 de | 3.2 f | 3.8 d | 2.0 e | 0.2 d | 164.1 | 151.7 e | 57.2 f | 5.0 d | 10.5 e |
| Sunn hemp | 14.2 d | 2.2 b | 5.7 e | 18.2 e | 7.5 ef | 4.9 d | 2.5 de | 0.6 d | 95.1 | 212.4 de | 28.4 g | 22.2 d | 3.6 f |
| p-value | 0.0001 | 0.005 | 0.0001 | 0.0001 | 0.0001 | 0.0001 | 0.0001 | 0.0001 | 0.23 | 0.0001 | 0.0001 | 0.0001 | 0.0001 |
1 Reported values are averages of four replications. Means followed by different letters within each column are significantly different at α = 0.05 via Student-Newman-Keuls post-hoc test.
Table 5.
Macro and micronutrient uptake and potential contribution to soil fertility of above-ground tissues of selected cover crop species at 46 days after sowing 1.
Table 5.
Macro and micronutrient uptake and potential contribution to soil fertility of above-ground tissues of selected cover crop species at 46 days after sowing 1.
| Cover Crop Species | N | NO3-N | P | K | Ca | Mg | S | Na | Fe | Mn | Zn | Bo | Cu |
|---|---|---|---|---|---|---|---|---|---|---|---|---|---|
| kg ha−1 | g ha−1 | ||||||||||||
| Annual ryegrass | 30.7 c | 5.9 ab | 16.7 cd | 139.9 b | 17.8 e | 13.6 f | 9.1 def | 30.2 c | 299.1 cd | 663.2 c | 163.4 d | 26.1 g | 41.4 b |
| Buckwheat | 67.7 a | 6.3 ab | 38.2 a | 213.9 a | 78.1 b | 82.5 a | 15.0 cd | 3.3 e | 1226.2 a | 1192.9 a | 475.6 a | 226.3 a | 76.9 a |
| Cowpea | 50.5 b | 0.7 b | 19.0 c | 101.3 cd | 48.1 c | 27.4 d | 10.9 cdef | 0.9 e | 569.2 bcd | 769.4 bc | 143.8 d | 110.0 d | 20.7 c |
| Crimson clover | 50.8 b | 0.5 b | 14.4 de | 117.3 c | 47.8 c | 19.4 ef | 11.0 cdef | 15.8 d | 687.7 abcd | 353.2 d | 142.2 d | 123.2 d | 23.2 c |
| Field peas | 53.7 b | 1.2 b | 12.4 e | 89.7 d | 34.4 d | 12.6 f | 7.1 efg | 2.9 e | 426.5 cd | 262.3 d | 146.5 d | 46.5 f | 21.7 c |
| Forage radish | 70.7 a | 9.9 a | 28.1 b | 206.6 a | 110.1 a | 56.6 b | 33.1 b | 72.2 a | 1142.2 ab | 868.5 bc | 303.0 b | 179.3 b | 40.1 b |
| Mustard | 52.1 b | 9.0 ab | 28.5 b | 207.0 a | 79.2 b | 34.8 c | 43.0 a | 25.9 c | 831.2 abc | 916.2 b | 333.2 b | 155.7 c | 49.0 b |
| Oat | 42.3 b | 3.1 ab | 28.7 b | 205.2 a | 20.3 e | 21.6 de | 15.8 c | 59.5 b | 459.8 cd | 1156.5 a | 244.1 c | 47.2 f | 48.2 b |
| Rye | 48.0 b | 10.2 a | 25.4 b | 199.1 a | 24.3 e | 23.7 de | 11.5 cde | 2.0 e | 397.7 cd | 853.1 bc | 155.4 d | 30.7 fg | 48.9 b |
| Sorghum Sudan | 18.8 d | 0.2 b | 10.4 e | 81.2 d | 10.0 f | 12.6 f | 2.9 g | 0.4 e | 198.0 cd | 342.9 d | 109.9 de | 13.7 g | 21.9 c |
| Sunn hemp | 22.8 cd | 0.2 b | 10.2 e | 48.1 e | 26.8 de | 16.8 ef | 4.8 fg | 1.3 e | 165.1 d | 385.8 d | 77.4 e | 75.1 e | 9.5 d |
| p-value | 0.0001 | 0.0005 | 0.0001 | 0.0001 | 0.0001 | 0.0001 | 0.0001 | 0.0001 | 0.02 | 0.0001 | 0.0001 | 0.0001 | 0.0001 |
1 Reported values are averages of four replications. Means followed by different letters within each column are significantly different at α = 0.05 via Student-Newman-Keuls post hoc test.
Table 6.
Treatment effect on soil mineral content (mg kg-1) at 1, 7, and 28 days after treatment (DAT) application 1.
Table 6.
Treatment effect on soil mineral content (mg kg-1) at 1, 7, and 28 days after treatment (DAT) application 1.
| DAT | Carbon Source | NO3-N | P | K | Ca | Mg | S | Na | Fe | Mn | Zn | Cu | B |
|---|---|---|---|---|---|---|---|---|---|---|---|---|---|
| 1 | Annual ryegrass | 27.67 | 72.67 | 220.7 b | 2811.70 | 225.00 | 37.0 b | 46.67 b | 290.33 | 176.67 b | 5.73 | 4.43 | 0.70 |
| Buckwheat | 36.67 | 82.33 | 267.3 b | 2964.00 | 244.33 | 40.0 b | 43.67 b | 306.00 | 180.67 b | 6.33 | 4.67 | 0.77 | |
| Cowpeas | 17.00 | 74.33 | 200.0 b | 2837.30 | 196.67 | 31.0 b | 36.00 b | 287.00 | 162.00 b | 5.73 | 4.23 | 0.70 | |
| Crimson clover | 33.00 | 72.33 | 227.0 b | 2849.70 | 215.67 | 34.7 b | 44.33 b | 292.00 | 176.67 b | 6.00 | 4.50 | 0.73 | |
| Field peas | 36.67 | 73.00 | 194.0 b | 2889.00 | 197.00 | 31.3 b | 37.00 b | 294.00 | 182.33 b | 6.00 | 4.27 | 0.67 | |
| Forage radish | 16.67 | 83.00 | 270.0 b | 2705.30 | 231.33 | 49.0 b | 77.67 a | 303.67 | 180.00 b | 6.33 | 4.50 | 0.77 | |
| Mustard | 26.67 | 78.00 | 263.0 b | 2942.00 | 219.00 | 48.0 b | 60.00 ab | 289.67 | 192.00 b | 6.03 | 4.00 | 0.80 | |
| Oats | 8.00 | 81.67 | 262.0 b | 2710.00 | 211.00 | 33.3 b | 61.33 ab | 303.00 | 182.67 b | 6.20 | 4.53 | 0.73 | |
| Rye | 38.33 | 82.33 | 248.0 b | 2668.30 | 207.00 | 36.7 b | 39.33 b | 302.67 | 165.00 b | 6.03 | 4.23 | 0.70 | |
| Sorghum Sudan grass | 47.67 | 80.33 | 254.0 b | 2762.70 | 215.33 | 35.7 b | 51.33 b | 301.00 | 174.67 b | 6.60 | 4.33 | 0.73 | |
| Sunn hemp | 75.33 | 76.33 | 203.0 b | 2786.30 | 214.33 | 38.0 b | 42.00 b | 308.33 | 180.67 b | 6.07 | 4.70 | 0.70 | |
| Molasses | 32.00 | 77.00 | 528.7 a | 3071.00 | 262.00 | 100.0 a | 58.33 ab | 308.00 | 229.33 a | 7.03 | 4.53 | 0.77 | |
| Untreated control | 46.33 | 75.33 | 180.0 b | 2750.00 | 203.67 | 32.7 b | 34.67 b | 304.33 | 177.00 b | 5.97 | 4.47 | 0.70 | |
| p-value | 0.08 | 0.29 | 0.0001 | 0.98 | 0.06 | 0.0001 | 0.002 | 0.42 | 0.0001 | 0.49 | 0.93 | 0.77 | |
| 7 | Annual ryegrass | 15.33 b | 75.00 | 233.3 bc | 2717.70 | 206.7 b | 32.7 b | 49.7 ab | 297.67 | 196.0 b | 6.17 | 4.23 | 0.63 bc |
| Buckwheat | 13.00 b | 78.67 | 255.7 bc | 2781.30 | 229.0 b | 35.0 b | 45.0 ab | 294.67 | 209.3 b | 6.03 | 4.40 | 0.77 a | |
| Cowpeas | 21.00 b | 72.00 | 216.7 bc | 2718.00 | 215.7 bc | 30.0 b | 33.3 b | 313.00 | 192.3 b | 6.87 | 4.10 | 0.60 c | |
| Crimson clover | 23.33 b | 74.67 | 216.7 bc | 2624.30 | 213.0 b | 35.3 b | 46.0 ab | 300.67 | 186.3 b | 6.30 | 4.23 | 0.67 abc | |
| Field peas | 10.67 b | 78.00 | 216.7 bc | 2633.30 | 208.7 b | 33.0 b | 40.3 ab | 304.00 | 191.3 b | 6.40 | 4.50 | 0.73 ab | |
| Forage radish | 11.67 b | 77.00 | 287.0 b | 2802.70 | 248.7 ab | 42.3 b | 68.3 a | 323.67 | 224.0 b | 6.40 | 4.83 | 0.77 a | |
| Mustard | 19.00 b | 76.00 | 234.3 bc | 2686.30 | 207.7 b | 37.0 b | 49.0 ab | 321.00 | 201.0 b | 6.27 | 3.93 | 0.67 abc | |
| Oats | 17.33 b | 79.00 | 256.7 bc | 2820.70 | 210.3 b | 34.3 b | 64.0 ab | 308.00 | 215.3 b | 6.33 | 4.30 | 0.73 ab | |
| Rye | 18.33 b | 76.00 | 306.7 b | 3303.00 | 231.7 abc | 40.7 b | 52.7 ab | 298.33 | 215.0 b | 6.03 | 4.37 | 0.77 a | |
| Sorghum Sudan grass | 31.67 b | 80.67 | 260.7 bc | 3025.70 | 226.3 abc | 38.0 b | 56.0 ab | 311.33 | 176.7 b | 6.17 | 4.37 | 0.77 a | |
| Sunn hemp | 30.33 b | 76.67 | 235.0 bc | 2681.30 | 212.3 b | 33.0 b | 41.0 ab | 306.67 | 174.0 b | 6.03 | 4.37 | 0.67 abc | |
| Molasses | 6.67 b | 81.00 | 468.7 a | 2961.00 | 258.3 a | 81.0 a | 54.7 ab | 356.67 | 304.0 a | 6.90 | 4.60 | 0.77 a | |
| Untreated control | 75.00 a | 73.33 | 176.3 c | 2673.30 | 204.3 b | 30.3 b | 32.0 b | 315.00 | 163.7 b | 6.00 | 4.13 | 0.60 c | |
| p-value | 0.001 | 0.63 | 0.0001 | 0.07 | 0.03 | 0.0001 | 0.02 | 0.07 | 0.0001 | 0.89 | 0.24 | 0.005 | |
| 28 | Annual ryegrass | 17.0 b | 75.3 abc | 264.3 bc | 2841.70 | 224.3 ab | 44.0 b | 64.3 abc | 306.3 b | 186.7 b | 6.13 | 4.13 | 0.73 b |
| Buckwheat | 8.3 b | 77.0 abc | 281.3 bc | 2933.30 | 246.7 ab | 39.7 b | 50.3 bc | 335.3 b | 206.3 b | 6.50 | 4.67 | 0.83 ab | |
| Cowpeas | 13.3 b | 77.3 abc | 259.0 bc | 2943.30 | 233.3 ab | 42.3 b | 40.7 c | 321.7 b | 193.7 b | 6.63 | 4.60 | 0.77 b | |
| Crimson clover | 19.7 b | 73.7 bc | 269.0 bc | 3101.30 | 229.3 ab | 42.0 b | 53.0 bc | 311.3 b | 197.7 b | 6.47 | 4.33 | 0.83 ab | |
| Field peas | 28.7 b | 70.0 c | 213.7 c | 2575.00 | 202.0 b | 35.3 b | 40.0 c | 286.3 b | 167.3 b | 6.07 | 4.00 | 0.70 b | |
| Forage radish | 11.0 b | 78.3 abc | 299.3 ab | 2896.30 | 235.3 ab | 45.3 b | 76.0 ab | 315.7 b | 206.7 b | 6.43 | 4.47 | 0.80 ab | |
| Mustard | 9.3 b | 82.7 ab | 360.7 b | 3388.00 | 281.3 a | 64.3 a | 85.3 a | 335.3 b | 218.3 b | 7.67 | 4.67 | 0.97 a | |
| Oats | 6.7 b | 73.0 bc | 303.3 ab | 2851.30 | 231.3 ab | 41.7 b | 76.7 ab | 301.3 b | 210.7 b | 6.43 | 4.63 | 0.77 b | |
| Rye | 12.3 b | 70.0 c | 266.3 bc | 2659.00 | 209.3 b | 38.0 b | 41.0 c | 302.7 b | 184.0 b | 5.73 | 4.07 | 0.70 b | |
| Sorghum Sudan grass | 24.0 b | 81.0 ab | 288.0 bc | 3202.30 | 256.3 ab | 42.7 b | 54.7 bc | 315.7 b | 201.7 b | 7.37 | 4.77 | 0.83 ab | |
| Sunn hemp | 26.0 b | 81.7 ab | 254.3 bc | 3066.70 | 227.3 ab | 44.7 b | 56.3 bc | 305.7 b | 177.7 b | 6.57 | 4.07 | 0.80 ab | |
| Molasses | 4.0 b | 83.7 a | 507.0 a | 2704.70 | 255.0 ab | 70.3 a | 51.0 bc | 419.3 a | 288.7 a | 6.93 | 4.43 | 0.80 ab | |
| Untreated control | 87.3 a | 76.7 abc | 236.0 c | 3184.70 | 249.3 ab | 40.3 b | 42.0 c | 329.7 b | 190.7 b | 6.73 | 4.70 | 0.80 ab | |
| p-value | 0.0001 | 0.03 | 0.0001 | 0.06 | 0.03 | 0.0006 | 0.0003 | 0.0003 | 0.0003 | 0.07 | 0.12 | 0.01 | |
1 Reported values are averages of four replications. Means followed by different letters within each column are significantly different at α = 0.05 via Student-Newman-Keuls post hoc test.
Table 7.
Lettuce biometric assessment after 24 days from transplanting 1.
| Carbon Source | Leaf Number | Plant Fresh Weight | Plant Dry Weight | Leaf Area | Specific Leaf Area | Leaf dry Mass Per Unit Area | Dry Matter Content |
|---|---|---|---|---|---|---|---|
| g Plant−1 | g Plant−1 | cm2 Plant−1 | cm2 g−1 | g m−2 | g kg−1 | ||
| Annual ryegrass | 65.0 | 142.4 | 4.64 | 2450 b | 527.21 ab | 19.04 ab | 33.17 |
| Buckwheat | 66.7 | 145.1 | 4.84 | 2578 ab | 533.50 ab | 18.82 ab | 32.73 |
| Cowpea | 71.8 | 143.5 | 4.71 | 2515 b | 534.19 ab | 18.83 ab | 32.76 |
| Crimson clover | 70.6 | 150.1 | 4.76 | 2589 ab | 544.17 ab | 18.39 ab | 31.55 |
| Field peas | 71.7 | 152.0 | 4.91 | 2529 b | 514.63 ab | 19.51 ab | 32.34 |
| Forage radish | 65.4 | 146.1 | 4.82 | 2593 ab | 538.45 ab | 18.62 ab | 32.74 |
| Mustard | 66.8 | 144.8 | 4.77 | 2615 ab | 548.56 ab | 18.29 ab | 33.04 |
| Oat | 66.2 | 146.6 | 4.80 | 2689 ab | 558.71 a | 18.00 b | 33.16 |
| Rye | 63.1 | 148.0 | 4.79 | 2541 ab | 531.02 ab | 18.89 ab | 32.45 |
| Sorghum sudangrass | 66.2 | 143.2 | 4.59 | 2372 b | 515.75 ab | 19.47 ab | 32.62 |
| Sunn hemp | 69.3 | 145.6 | 4.92 | 2472 b | 503.41 b | 20.05 a | 33.71 |
| Molasses | 69.8 | 149.8 | 5.11 | 2838 a | 554.36 ab | 18.12 b | 33.75 |
| Untreated control | 64.3 | 148.5 | 4.83 | 2570 ab | 531.82 ab | 18.84 ab | 33.11 |
| p-value | 0.20 | 0.68 | 0.14 | 0.002 | 0.02 | 0.02 | 0.57 |
1 Reported values are averages of three replications. Means followed by different letters within each column are significantly different at α = 0.05 via Student-Newman-Keuls post hoc test. Specific leaf area was calculated dividing the plant leaf area (cm2) by the plant dry weight (g), vice versa, the leaf dry mass per unit area was calculated dividing the plant dry weight (g) by the plant leaf area (m2).
Table 8.
Total carbon (C), total nitrogen (N), and C:N ratio at harvest (24 DAP) of Salanova lettuce grown on anaerobic soil disinfestation treated soil amended with alternative C sources 1.
Table 8.
Total carbon (C), total nitrogen (N), and C:N ratio at harvest (24 DAP) of Salanova lettuce grown on anaerobic soil disinfestation treated soil amended with alternative C sources 1.
| Carbon Source | Total C (%) | Total N (%) | C:N |
|---|---|---|---|
| Annual ryegrass | 33.85 ab | 5.11 ab | 6.62 abc |
| Buckwheat | 33.08 b | 5.30 a | 6.26 b |
| Cowpea | 33.88 ab | 5.10 ab | 6.65 abc |
| Crimson clover | 33.40 ab | 4.94 b | 6.76 ab |
| Field peas | 34.42 a | 5.08 ab | 6.79 ab |
| Forage radish | 33.38 ab | 4.92 b | 6.79 ab |
| Mustard | 32.91 b | 5.13 ab | 6.42 bc |
| Oat | 33.68 ab | 4.98 b | 6.77 ab |
| Rye | 33.13 b | 5.03 b | 6.60 abc |
| Sorghum sudangrass | 33.40 ab | 5.12 ab | 6.53 abc |
| Sunn hemp | 33.45 ab | 5.00 b | 6.73 ab |
| Molasses | 34.28 a | 4.95 b | 6.93 a |
| Untreated control | 33.05 b | 5.16 ab | 6.41 bc |
| p-value | 0.04 | 0.0001 | 0.0006 |
1 Reported values are averages of three replications. Means followed by different letters within each column are significantly different at α = 0.05 via Student-Newman-Keuls post hoc test.
Table 9.
Macro and micronutrient concentration at harvest (24 days after planting) of Salanova lettuce grown on anaerobic soil disinfestation treated soil amended with various C sources 1.
Table 9.
Macro and micronutrient concentration at harvest (24 days after planting) of Salanova lettuce grown on anaerobic soil disinfestation treated soil amended with various C sources 1.
| Carbon Source | NO3-N | P | K | Ca | Mg | S | Na | Fe | Mn | Zn | Bo | Cu |
|---|---|---|---|---|---|---|---|---|---|---|---|---|
| mg kg−1 | % | % | % | % | % | % | mg kg−1 | mg kg−1 | mg kg−1 | mg kg−1 | mg kg−1 | |
| Annual ryegrass | 15,067 | 0.55 | 9.26 | 1.60 | 0.37 | 0.36 | 0.30 ab | 208.67 | 74.00 b | 42.00 c | 33.00 | 11.67 |
| Buckwheat | 17,867 | 0.55 | 9.16 | 1.61 | 0.39 | 0.35 | 0.25 b | 193.00 | 75.67 b | 45.67 bc | 31.33 | 11.67 |
| Cowpea | 13,167 | 0.63 | 9.99 | 1.73 | 0.44 | 0.38 | 0.28 b | 253.33 | 83.00 b | 45.67 bc | 35.33 | 12.33 |
| Crimson clover | 13,267 | 0.69 | 10.85 | 1.80 | 0.46 | 0.41 | 0.32 ab | 206.67 | 84.00 b | 46.00 bc | 37.67 | 12.67 |
| Field peas | 17,100 | 0.60 | 9.25 | 1.86 | 0.41 | 0.37 | 0.26 b | 274.33 | 81.67 b | 45.00 bc | 33.33 | 11.67 |
| Forage radish | 15,033 | 0.61 | 10.24 | 1.70 | 0.41 | 0.38 | 0.41 a | 296.33 | 88.00 b | 54.67 ab | 35.00 | 12.00 |
| Mustard | 14,833 | 0.58 | 9.58 | 1.64 | 0.42 | 0.36 | 0.33 ab | 266.67 | 85.00 b | 51.33 abc | 32.67 | 12.33 |
| Oat | 15,267 | 0.56 | 9.38 | 1.77 | 0.38 | 0.36 | 0.36 ab | 215.00 | 79.67 b | 46.67 bc | 33.33 | 11.67 |
| Rye | 16,800 | 0.58 | 9.65 | 1.77 | 0.41 | 0.38 | 0.26 b | 367.33 | 83.00 b | 47.00 bc | 33.33 | 12.33 |
| Sorghum sudangrass | 14,667 | 0.58 | 9.34 | 1.76 | 0.40 | 0.36 | 0.28 b | 158.67 | 71.00 b | 46.00 bc | 32.33 | 10.67 |
| Sunn hemp | 15,100 | 0.58 | 9.12 | 1.71 | 0.38 | 0.35 | 0.25 b | 207.00 | 70.33 b | 43.00 bc | 31.67 | 10.33 |
| Molasses | 12,500 | 0.53 | 9.28 | 1.63 | 0.40 | 0.38 | 0.23 b | 194.00 | 120.67 a | 59.67 a | 32.00 | 12.67 |
| Untreated control | 15,700 | 0.66 | 10.34 | 1.94 | 0.49 | 0.38 | 0.30 ab | 206.67 | 78.67 b | 47.00 bc | 35.00 | 12.00 |
| p-value | 0.32 | 0.26 | 0.46 | 0.54 | 0.19 | 0.51 | 0.01 | 0.40 | 0.003 | 0.002 | 0.36 | 0.75 |
1 Reported values are averages of three replications. Means followed by different letters within each column are significantly different at α = 0.05 via Student-Newman-Keuls post hoc test.
Publisher’s Note: MDPI stays neutral with regard to jurisdictional claims in published maps and institutional affiliations. |
© 2020 by the authors. Licensee MDPI, Basel, Switzerland. This article is an open access article distributed under the terms and conditions of the Creative Commons Attribution (CC BY) license (http://creativecommons.org/licenses/by/4.0/).
Share and Cite
MDPI and ACS Style
Vecchia, L.; Di Gioia, F.; Ferrante, A.; Hong, J.C.; White, C.; Rosskopf, E.N. Integrating Cover Crops as a Source of Carbon for Anaerobic Soil Disinfestation. Agronomy 2020, 10, 1614. https://doi.org/10.3390/agronomy10101614
AMA Style
Vecchia L, Di Gioia F, Ferrante A, Hong JC, White C, Rosskopf EN. Integrating Cover Crops as a Source of Carbon for Anaerobic Soil Disinfestation. Agronomy. 2020; 10(10):1614. https://doi.org/10.3390/agronomy10101614
Chicago/Turabian StyleVecchia, Luca, Francesco Di Gioia, Antonio Ferrante, Jason C. Hong, Charles White, and Erin N. Rosskopf. 2020. "Integrating Cover Crops as a Source of Carbon for Anaerobic Soil Disinfestation" Agronomy 10, no. 10: 1614. https://doi.org/10.3390/agronomy10101614
Note that from the first issue of 2016, this journal uses article numbers instead of page numbers. See further details here.