Article

Chemical and Biological Properties of Sandy Loam Soil in Response to Long-Term Organic–Mineral Fertilisation in a Warm-Summer Humid Continental Climate

by
Iwona Jaskulska
1,*,
Joanna Lemanowicz
2,
Barbara Breza-Boruta
3,
Anetta Siwik-Ziomek
2,
Maja Radziemska
4,
Jaskulski Dariusz
1 and
Mateusz Białek
5
1
Department of Agronomy, Faculty of Agriculture and Biotechnology, UTP University of Science and Technology, Profesora Sylwestra Kaliskiego 7, 85-796 Bydgoszcz, Poland
2
Department of Biogeochemistry and Soil Science, UTP University of Science and Technology in Bydgoszcz, Bernardyńska 6, 85-029 Bydgoszcz, Poland
3
Department of Microbiology and Food Technology, Faculty of Agriculture and Biotechnology, UTP University of Science and Technology, Bernardyńska 6, 85-029 Bydgoszcz, Poland
4
Institute of Environmental Engineering, Warsaw University of Life Sciences, Nowoursynowska 159, 02-776 Warsaw, Poland
5
Research & Development Centre, Kościelna 1, Śmielin, 89-110 Sadki, Poland
*
Author to whom correspondence should be addressed.
Agronomy 2020, 10(10), 1610; https://doi.org/10.3390/agronomy10101610
Submission received: 7 September 2020 / Revised: 13 October 2020 / Accepted: 16 October 2020 / Published: 20 October 2020

Abstract

:
In 2019, 71 years after the establishment of a static fertiliser experiment, the chemical and biological properties of Luvisol soil with sandy-loam grain-size composition were determined. Soil samples were taken from six fertilised treatments: half-dose nitrogen, phosphorus and potassium in mineral fertilisers (½ NPK); full-dose nitrogen, phosphorus, potassium (NPK); manure fertilisation + nitrogen, phosphorus, potassium, magnesium and liming (FYM NPK Mg Ca); manure + mineral fertilisers without magnesium and liming (FYM NPK); manure + nitrogen and phosphorus (FYM NP); manure + nitrogen and potassium (FYM NK). The soil was tested in two layers at depths of 0–20 cm and 20–40 cm. Soil samples were tested for: pH in 1 M KCl (pH); electrical conductivity (EC); organic carbon content (OC); content of available phosphorus (Pa), potassium (Ka), magnesium (Mga) and sulphate sulphur (S-SO4); total number of bacteria (Bt), cellulolytic microorganisms (Bc), fungi (Ff) and actinomycetes (Ac); and alkaline phosphatase (AlP), acid phosphatase (AcP) and arylsulphatase (ArS) activity. The fertilisation that most favourably affected the chemical and biological properties of the soil was FYM NPK Mg Ca. This fertilisation increased: pH and EC; OC, Ka and Mga contents; Bt and Bc abundance; and AlP activity relative to all the methods of mineral and organic–mineral fertilisation that did not include all the ingredients of mineral fertilisers. On the other hand, the least favourable soil properties were formed by ½ NPK fertilisation in the 0–20 cm layer, and by the long-term use of mineral fertilisers only in the 20–40 cm layer.

1. Introduction

Long-term experiments are a very important method in agricultural research. They are conducted all over the world [1,2,3] and some last over even a century [4,5]. Numerous long-term experiments, assess how temporal and spatial changes in the physical [6,7], chemical [8,9] and biological properties of soil [10,11] are determined under the influence of organic [12] and mineral fertilisers [13], including liming [14]. Experiments usually include multiple combinations of organic and mineral fertilisation [15,16], often in combination with other agrotechnical practises [17].
Fertilisation is the main agricultural technology to shape soil productivity, plant biomass composition, yields and the functioning of agricultural ecosystems [18,19,20]. As sources of nutrients and effectors of changes in soil properties, fertilisers also affect the biogeochemical cycle in the environment [21,22]. These changes can both positively and negatively affect soil fertility and productivity [23]. The impact of fertilisation on soil depends on, among other things, fertiliser type, dose, method of application, habitat conditions, and agricultural technologies [24]. Fertilisation affects soil properties both directly and indirectly. Some soil properties change soon after fertilisers are applied, and others only after many years [25]. The long-term application of mineral fertilisers and manure extensively changes soil’s chemical properties, e.g., soil reaction, salinity, cation exchange capacity, organic carbon content and soil nutrient status. Fertilisation, depending on the method, affects the content of mainly absorbable forms of macronutrients and micronutrients in the soil. Fertilisers are also a source of secondary nutrients, including sulphur [26,27].
Long-term fertilisation affects microorganism abundances, structure and dynamics of the soil microbial community, because microorganisms are a sensitive element of an agricultural ecosystem [28,29]. Long-term balanced organic and mineral fertilisation has a generally positive effect on populations of bacteria, actinobacteria and fungi. It increases their metabolic activity, which accelerates the decomposition of organic matter and the circulation of nutrients and also increases their availability to plants [30].
One-sided fertilisation, especially mineral fertilisation and fertilisation that is imbalanced in terms of nutrients, can cause microbial imbalance in the soil. This reduces biodiversity, biomass and microbiological activity. The composition and structure of the microorganism community are modified. The use of high doses of nitrogen fertilisers particularly reduces the number of certain types of bacteria [31,32]. This applies to, for example, bacteria from the genera Arthrobacter, Azotobacter and Streptomyces. Fungi of the Deuteromycetes class begin to dominate in microbiocenoses [33,34]. Excess nitrogen leads to toxic compounds including ammonia and nitrosamine accumulating in the soil, which reduces the occurrence of many groups of microorganisms and causes soil acidification [35,36]. Low soil pH increases the presence of fungi, including toxin-forming species of the genera Aspergillus, Fusarium and Penicillium. The metabolites that they release—mainly mycotoxins—are toxic to other soil organisms [37].
Microbiological indicators, i.e., microorganism abundances and enzymatic activity, can be used to determine the direction and rate of changes occurring in the soil environment. Soil enzymes play an important role in catalysing biochemical reactions [38]. They indicate changes in the intensity of processes taking place in the soil and correlate with its physical and chemical properties [39,40]. The main source of enzymes in soil is the biomass of microorganisms, and of plants and animal residues. The enzymes produced by microorganisms are imparted into the soil or remain in the cells. According to Klose et al. [41], about 45% of total arylsulphatase activity is extracellular, while 55% is associated with microbial biomass in the soil. The impact that fertilisation has on the enzymatic activity of soil depends on its type and texture, as well as on how and when it is applied [42]. Organic fertilisers generally increase the number of microorganisms and the soil enzyme activity [43]. In contrast, mineral fertilisers have a weaker effect on the activity of soil enzymes, and can even reduce it [44]. The enzymes that react to even small changes in the soil environment caused by agricultural use, including fertilisation, are phosphatases [45].
The ambiguous results of previous studies justify the continuation of long-term experiments. They are a valuable source of material for scientific analysis and for formulating recommendations for agricultural practice. The objective of this study was to determine changes in the chemical and biological properties of light soil (Luvisol) in a warm-summer humid continental climate under the long-term influence (70+ years) of varied organic and mineral fertilisation.

2. Materials and Methods

2.1. Experiment Location and Layout

The subject of the study was a long-term static fertiliser experiment. The experiment was set up in 1948 in Mochełek near Bydgoszcz, Poland (95 m a.s.l., 53°13′ N, 17°51′ E). The experimental site has a Dfb climate (cold, without dry season, warm summer) [46]. The average annual sum of precipitation is 485 mm, and the average air temperature is 8.1 °C. The soil (Luvisol) belongs to the granulometric sub-group sandy loam with grain-size compositions of: sand 61.1%, silt 33.6%, clay 5.3% in the 0–20 cm layer; and sand 61.5%, silt 33.3% and clay 5.2% in the 20–40 cm layer. In the more than 70 years of the multi-treatments experiment, some changes have been made to fertilisation methods, fertiliser doses and crop rotation. The main change was the introduction in 2011 of mineral fertilisation at half NPK dose at a site that had not been fertilised since the beginning of the experiment [47]. The studies compared six methods of organic and mineral fertilisation, each on four plots. These were experimental units (experiment in four replications) with the following treatments: half-dose of nitrogen, phosphorus and potassium fertilisation in mineral fertilisers (½ NPK); full-dose nitrogen, phosphorus and potassium mineral fertilisation (NPK); manure fertilisation plus nitrogen, phosphorus, potassium, magnesium in mineral fertilisers and liming (FYM NPK Mg Ca); manure plus mineral fertilisation without magnesium or liming (FYM NPK); manure plus nitrogen and phosphorus (FYM NP); manure plus nitrogen and potassium (FYM NK). After 2002, the average annual mineral fertilisation was: N—96 kg ha−1 (ammonium nitrate 34% N), P—38 kg ha−1 (superphosphate 46% P2O5), K—100 kg ha−1 (potassium chloride 60% K2O), Mg—12 kg ha−1 (magnesium sulphate 16% MgO) and Ca—0.86 t ha−1 (carbonate lime 45% CaO). Manure was used once per crop rotation, on average every four years at an annual dose of 7.0 t ha−1. The fertiliser doses depended on the plant species and years of study. They changed according to progress in breeding and agricultural technology. Over the last two decades, irregular crop rotation has involved, among others: winter rape (Brassica napus L.), winter wheat (Triticum aestivum L.), pea (Pisum sativum L.), spring barley (Hordeum vulgare L.), oats (Avena sativa L.), and maize (Zea mays L.). In accordance with the scheme, manure was used in addition to mineral fertilisation on the appropriate experimental plots. This was a mixed cattle and pig manures whose nutrient content was not laboratory tested. More detail on the experiment can be found in earlier monographs [47,48].

2.2. Soil Samples

Soil samples were taken in autumn of 2019 after harvesting peas and before sowing winter wheat. Ten soil primary samples were collected in each experimental plot for all the treatments. The soil from the single plot was combined and, after thorough mixing, a pooled sample was created. On each plot, soil samples were taken from two layers, at depths of 0–20 cm (tilled layer/tillage depth) and 20–40 cm (just below the tilled layer), respectively. The same soil sampling procedure was performed on each of the 4 plots of the given fertilisation treatment (field experiment in 4 replications). Microbiological determinations were carried out on soil samples whose air-water properties had been specific up to the time of collection. Soil samples for chemical analysis were air-dried and sieved through a 2-mm mesh.

2.3. Chemical Analysis and Microbiological Evaluation

Chemical analysis of the soil included: pH in 1 M KCl (pH) by potentiometric method—PN-ISO 10,390 [49], electrical conductivity (EC) determined in deionised water in a 1:5 soil:water extract. The content of organic carbon (OC) was assayed with Vario Max CN analyser (Elementar, Germany). The content of available forms of phosphorus (Pa)—PN-R-04023 [50] and potassium (Ka) were defined with the Egner–Riehm method, DL—PN-R-04022 [51], as well as the content of magnesium available to plants (Mga) following the Schachtschabel method—PN-R-04020 [52]. The sulphate sulphur (S-SO4) content was determined by turbidimetric method according to Bardsley–Lancaster [53]. The activity of selected enzymes representing the class of hydrolases: alkaline phosphatase (E.C. 3.1.3.1)—AlP and acid phosphatase (E.C. 3.1.3.2)—AcP, was determined by the method of Tabatabai and Bremner [53]. The enzymatic indicator of soil pH was also calculated, such as AlP/AcP [54]. Arylsulphatase (ArS) activity (EC 3.1.6.1) was determined colorimetrically according to Tabatabai and Bremner [55], taking the amount of p-nitrophenol released during one hour incubation as the unit of activity.
Microbiological analyses in the collected soil samples involved the determination of the number of heterotrophic bacteria (Bt), cellulose hydrolysing microorganisms (Bc), filamentous fungi (Ff) and actinobacteria (Ac). Ten grams of each soil sample was added to 90 mL of Ringer’s solution. After homogenisation for 30 min, tenfold serial dilutions were made (10−1 to 10−6). Then, inoculations of the prepared soil solutions were made on proper culture media. To determine the total number of bacteria, standard nutrient agar was used and for filamentous fungi Rose–Bengal agar containing 30 μg·mL−1 streptomycin was used [56]. Cellulolytic microorganisms were isolated on the agar medium with CMC-Na (0.1% sodium carboxymethylcellulose), according to Gupta et al. [57]. The actinobacteria were isolated on modified yeast extract—glucose medium (YGA) with 100 nystatin μg·mL−1 [58]. Incubation of the bacteria, cellulolytic microorganisms and fungi was carried out at 25 °C for five days, while incubation of the actinobacteria was carried out at 28 °C for ten days. The determined number of microorganisms expressed as colony-forming units (CFUs) were given per 1 g of dry matter soil.

2.4. Data Analysis

The results of analyses of individual soil properties were statistically verified. Analysis of variance (two-way ANOVA) was used. The first factor in the analysis was fertilisation and the second was depth of soil sampling. The F-test was used to assess the significance of the factors’ influence and their interactions, and Tukey’s post hoc test at p < 0.05 to compare the mean values of features. Soil pH was not analysed due to the logarithmic scale of this trait. The analysis of variance was preceded by an estimation of the normality of the data distribution. The Shapiro-Wilk test was used. Due to the multiplicity of chemical and biological soil characteristics that subject to change as a result of the impact of the six methods of long-term fertilisation, multidimensional analyses were performed. Using principal component analysis (PCA), two groups of features (PC1 and PC2) were distinguished that strongly shaped soil properties, and the strength of their impact and mutual correlations were graphically represented. The similarity of impact of individual methods of long-term fertilisation on the totality of chemical and biological soil properties was assessed by cluster analysis using Ward’s method and presented in a dendrogram. Due to the different ranges of absolute quantities of individual soil characteristics, multidimensional analyses were performed on standardised data. Statistical analysis of the results was carried out using the Statistica.PL 12 [59] software package.

3. Results

Over 70 years of applying varied organic and mineral fertilisation has resulted in strong acidification of the soil in both the 0–20 cm and the 20–40 cm layer (Table 1). Organic and mineral fertilisation without potassium or phosphorus (FYM NP, FYM NK) had the strongest acidifying effect. The highest pH value was obtained for soil fertilised with manure and mineral fertilisers (FYM NPK Mg Ca). This same soil was also the most saline, 0.273 mS cm−1 in the 0–20 cm layer and 0.400 mS cm−1 in the 20–40 cm layer. In the 0–20 cm layer, electrical conductivity was lowest in soil fertilised with: a half dose of NPK fertilisers (which pre-2011 had been unfertilised soil), a full dose of NPK, and FYM NK. In the lower layer, the lowest EC value was observed for soil fertilised with ½ NPK and FYM NP. Any other method of long-term fertilisation significantly increased the electrical conductivity.
Long-term fertilisation with manure and mineral fertilisers, as compared to exclusive mineral fertilisation, increased the organic carbon content in the soil to a depth of 40 cm. The content of organic carbon in both layers was significantly higher in soil fertilised with FYM NPK Mg Ca than in soil fertilised with manure but with an incomplete set of mineral fertilisers, and significantly higher than soil fertilised with mineral-only fertilisers. The content of organic carbon was significantly lower at a depth of 20–40 cm than in the 0–20 cm layer.
Omitting phosphorus or potassium from organic–mineral fertilisation (FYM NK and FYM NP, respectively) significantly reduced the content of available forms of these macronutrients in both soil layers in comparison with mineral-only fertilisation (NPK), even at half dose (½ NPK). Applying manure alongside mineral fertilisation containing phosphorus (FYM NPK and FYM NP) significantly increased the content of available phosphorus in soil more than mineral-only fertilisation (NPK). Fertilisation using manure with potassium affected the content of its absorbable form in soil similarly, provided that the organic–mineral fertilisation contained all the basic ingredients, i.e., FYM NPK or FYM NPK Mg Ca. With the small dose of mineral fertilisers (½ NPK), the content of available potassium in the soil at a depth of 0–20 cm and 20–40 cm did not differ significantly. Other methods of long-term fertilisation resulted in a greater content of bioavailable macronutrients, including magnesium, in the upper soil layer. The greatest amount of available magnesium was found in soil fertilised for many years with FYM NPK Mg Ca, and in the upper layer in particular.
Fertilisation with manure plus mineral fertilisers increased the content of available magnesium in soil more than did mineral-only fertilisation. The highest levels of sulphate sulphur (VI) was found in the soil fertilised with FYM NPK Mg Ca and FYM NK. A beneficial effect on S-SO4 content compared with mineral-only fertilisation (NPK) was found in the surface 0–20 cm layer for FYM NK, FYM NPK fertilisation, and in both layers for FYM NPK Mg Ca.
Long-term organic and mineral fertilisation differentiated microorganism abundances in the soil (Table 2). The greatest quantities of total bacteria (11.2 × 10⁶ cfu g−1 dm soil), filamentous fungi (32.0 × 10⁴ cfu g−1 dm soil) and cellulolytic microorganisms (36.7 × 10⁵ cfu g−1 dm soil) were found in soil fertilised with manure plus mineral fertilisers (FYM NPK Mg Ca). Microorganisms of these groups occurred in larger numbers in the 0–20 cm layer than at 20–40 cm. Only actinomycetes occurred in greater numbers in the soil of the lower layer at most fertilizing sites, except FYM NPK Mg Ca. The occurrence of actinomycetes in the soil was favoured by limited mineral fertilisation (½ NPK) and by full organic–mineral fertilisation with liming (FYM NPK Mg Ca). Leaving any individual mineral out from organic–mineral fertilisation decreased the abundance of all groups of microorganisms in the soil as compared to FYM NPK Mg Ca. Only the abundance of fungi did not differ significantly in soil fertilised with FYM NPK Mg Ca and FYM NPK. Also, increasing the dose of mineral fertilisers from a half dose (½ NPK) to a full dose (NPK) reduced the number of microorganisms in the soil.
Long-term organic and mineral fertilisation significantly affected the activity of the soil phosphatases responsible for phosphorus transformation in soil (Table 3). Alkaline phosphatase activity was on average 70% lower than acid phosphatase. The activity of both phosphatases was lower in soil fertilised exclusively with mineral fertilisers (½ NPK, NPK) than in soil fertilised with manure–mineral fertilisers. Arylsulphatase activity in soil taken from both layers to a depth of 40 cm was in the wide range of 0.060–0.239 μM pNP g−1 h−1. The highest averaged activity of this enzyme across the two combined layers—0.224 μM pNP g−1 h−1—was determined in soil fertilised with FYM NPK Mg Ca. This was 257% the lowest arylsulphatase activity, which was determined in soil fertilised with ½ NPK. The enzyme activity in the upper soil layer of 0–20 cm was generally significantly higher than in 20–40 cm layer. Only in the soil fertilised with FYM NPK Mg Ca and FYM NPK was arylsulphatase activity higher in the lower layer than in the upper layer, while the acid phosphatase activity in the soil fertilised with FYM NPK did not differ significantly between layers.
The enzymatic pH index calculated as the ratio of AlP to AcP was lowest for soil fertilised with ½ NPK (0.24 for 0–20 cm; 0.21 for 20–40 cm) and NPK (0.27 and 0.26 respectively) (Figure 1). The enzymatic pH indicator was higher in soil fertilised with manure plus mineral fertilisers, especially FYM NPK Mg Ca in the upper layer.
Multidimensional analysis of the long-term impact of different fertilisation regimes on soil properties at a depth of 0–20 cm indicates that the first principal component was shaped primarily by: alkaline and acid phosphatase activity, soil EC, available magnesium content and organic carbon. In turn, the largest contributors to the second principal component are: number of total bacteria, number of cellulolytic microorganisms and actinobacteria, arylsulphatase activity, and soil pH (Figure 2A). The occurrence of bacteria, cellulolytic microorganisms and actinobacteria correlated most positively with soil pH. On the other hand, the content of absorbable magnesium and phosphorus as well as the activity of phosphatases increased with an increase in organic carbon content.
In the lower 20–40 cm layer the first component was determined in particular by the content of organic carbon and available magnesium, fungal abundance, EC and arylsulphatase activity. The second principal component was shaped to the greatest extent by soil pH and abundance of bacteria and actinobacteria. These characteristics were strongly positively correlated (Figure 2B). The content of organic carbon in this soil layer correlated positively with number of fungi, EC and the content of available forms of nutrients.
The dendrogram (Figure 3A) allows us to distinguish three clusters of long-term fertilisation methods that interact similarly with the studied chemical and biological properties of the topsoil on the whole. The fertilisation methods that differ most from all three clusters are FYM NPK Mg Ca and ½ NPK. The third cluster consists of all fertilisation methods involving manure with an incomplete set of mineral fertilisers, and exclusive mineral fertilisation.
Of all the fertilisation methods FYM NPK Mg Ca fertilisation and NPK and ½ NPK mineral fertilisation differed the most in shaping soil properties of the lower 20–40 cm layer (Figure 3B).

4. Discussion

A historical analysis of changes in soil properties in the described experiment indicates that the environmental conditions in which it is being carried out and agricultural activity both contribute to high soil acidity [47,48]. Soil acidity is associated with fertilisation method. Such changes are also observed in other long-term experiments, especially on light soils, and maintaining an optimal pH for plants requires regular liming [60]. In the presented experiment the highest pH value was also found in soil fertilised with manure plus mineral fertilisers and regular liming (FYM NPK Mg Ca). According to Zhang [61] and Zhou et al. [62] limited use of organic fertilisers and excessive nitrogen fertilisation are the main agricultural causes of soil acidification. The importance of this soil property for its productivity results from the indirect effects of acidification and the effects of regulating pH taking into account plant requirements. The soil reaction affects the solubility of minerals and their availability to plants [63]. It is also a basic factor regulating many biological processes in soil [64]. According to Zhang et al. [65] long-term fertilisation affects not only the pH, but also the EC of the soil. Along with the fertilisers, easily soluble salts are introduced into the soil, which can be carried into the soil profile along with water [66]. Salinity is most harmful to plants in the germination and emergence phase, and during water deficits in the soil. The soil in the described experiment can be considered non-salinated, its EC was below 0.4 mS cm−1. Although fertilisation, and not only industrial activities [67], can cause soil contamination [68].
Manure, an organic fertiliser with quite a balanced C:N ratio, is a source of organic carbon that is easily taken up by soil organisms. Its application relatively quickly increases the abundance and activity of microorganisms. This leads to the rapid decomposition of organic material, the release of nutrients and, in the longer term, to the formation of soil organic matter and favourable changes in the physical properties of soil [69]. The indirect effect of manure is equally as important as appropriate mineral fertilisation, which increases plant productivity and the amount of plant remains returned to the soil [70]. This complex direct and indirect effect of organic–mineral fertilisation may explain why, in our research, organic carbon content was higher in the soil subjected to manure fertilisation than in the soil subjected to mineral-only fertilisation, and contents of digestible forms of nutrients were higher under the influence of long-term use of full-dose NPK than for ½ NPK.
Long-term fertilisation has strongly diversified the content of available forms of nutrients in the soil. Depending on the method of fertilisation and depth, the soil’s richness in phosphorus, potassium and magnesium according to PN-R-04023 [50], PN-R-04022 [51] and PN-R-04020 [52], respectively, ranged from very high to very low. The content of available forms of nutrients was within wide limits of 87.7–158.7 mg P kg−1, 82.7–204.0 mg K kg−1 and 7.7–24.4 mg Mg kg−1. The impact of fertilisation on sulphate sulphur (VI) content was weaker. Depending on fertilisation and depth, its content in soil was 11.8–16.0 mg kg−1. According to Lipiński et al. [71] this is the average content, and 70% of farmland soil in Poland contains 5.0–20.0 mg S-SO4 kg−1. The present tests confirm the important role of organic fertilisation in determining soil properties. In the long-term experiment presented, regular use of manure as a source of nutrients increased their content in soil, as compared to mineral-only fertilisation, especially at the lower dose. This also concerned sulphate sulphur (VI). The content of sulphate sulphur in samples of FYM NPK Mg Ca fertilised soil was 10.7% and 20.8% higher than in soil fertilised with NPK and ½ NPK, respectively. However, according to Förster et al. [72] the impact of organic fertilisation on the sulphur content in soil also depends heavily on the type of fertiliser.
The results of long-term field experiments published to date [10,11,32,73,74], including a 113-year fertiliser experiment [37] show large changes in bacterial and fungal communities under the influence of fertilisation. These works describe both the positive and negative impacts of organic and mineral fertilisers on soil microbial communities. In our own research, FYM NPK Mg Ca fertilisation had a particularly beneficial effect on the development of various groups of microorganisms. What was not entirely expected, meanwhile, was the relatively large number of microorganisms, and especially actinobacteria, in ½ NPK fertilised soil. However, similar results were obtained by Wang et al. [29] in an experiment with 17 years of organic and mineral fertilisation. Studies by those authors showed fewer actinobacteria in long-term fertilised soil than in non-fertilised soil. The authors explained this phenomenon by the fact that the actinobacteria include numerous oligotrophs that have a low demand for nutrients. In addition, actinobacteria are sensitive to soil acidity and many studies have shown a positive correlation between their occurrence and soil pH [36]. In our own research, too, the greatest quantities of actinobacteria were isolated from the soil with the highest pH values. Additionally, cellulolytic microorganisms participating in the degradation of cellulose and lignin were most abundant in the soil fertilised with FYM NPK Mg Ca and ½ NPK. Manure fertilisation was not beneficial for these, as Jacoby et al. [75] and Tang et al. [76] inidicate, if it was not supplemented with all the basic mineral fertilisers. The occurrence of individual groups of microorganisms was also adversely affected by fertilisation exclusively with a full dose of NPK. The abundance and activity of microorganisms is thus associated not with just one component of agricultural technology or just one soil property, but with their complex and, in particular, interactive effect. Studies by Pietri and Brookes [77] indicate soil pH has strong relationships with the content of C and N and the biomass of microorganisms. In the cited studies, microbial biomass and activity stabilised at soil pH of between 5 and 7. In our own research, a strong positive correlation between soil pH and bacteria abundance was confirmed by PCA analysis. However, Cho et al. [78] conclude that pH is not necessarily the only or most important soil property determining the presence of microorganisms: the organic matter content of the soil may also be important. A meta-analysis of the results from 64 long-term experiments [36] shows that, as a result of mineral fertilisation, the soil’s content of organic carbon and biomass of microorganisms increased by 15.1%. The cited authors suggest that it is organic carbon that is the main factor determining the presence of microorganisms. At the same time, the authors indicate that the direct and indirect impact of mineral fertilisation on microorganism biomass also depends on soil pH. In soil with a pH below 5, fertilisation reduces microorganism biomass, while at higher pH it has a positive effect. In our research, the soil with the pH closest to 5 was that fertilised with FYM NPK Mg Ca and ½ NPK. Thus, the soil pH may have determined the similarity in abundance of bacteria and cellulolytic microorganisms for these experimental treatments. By contrast, the soil fertilised with the full dose of NPK had a lower pH, and microorganisms was also fewer. This dependence may also explain why the number of different groups of microorganisms was greater in the soil fertilised with ½ NPK than with full-dose NPK. Meanwhile, manure, as a source of carbon and nutrients (including sulphur), and soil-alkalising liming (FYM NPK Mg Ca) both created conditions favourable to the activity of microorganisms, causing the high activity of arylsulphatase and phosphatases, and the high enzymatic index. PCA analysis showed a positive correlation between enzyme activity and organic carbon content, especially in the lower layer (where its content was low).
Manure has a positive effect on the activity and durability of soil enzymes [79,80], which may be due to greater availability of the substrate in fertilised soils [81]. This fertiliser increases the organic carbon content in the soil, as confirmed by the results of the tests carried out, and it regulates the concentration of soil solutions, and reduces the adverse effect of high salt concentrations on plants and soil microorganisms [82]. Therefore, long-term manure fertilisation, especially with NPK Mg and Ca, created soil conditions that increased the activity of phosphatases and arylsulphatase. In turn, mineral-only fertilisation generally limits the activity of soil enzymes, including the phosphatases that are important in phosphorus biogeochemistry [83]. Lower phosphatase activity in mineral fertilised soil is caused by the application of inorganic phosphorus [84]. Soil phosphatase activity is also strictly regulated by soil pH. Acid reaction (pH 4–6) is optimal for AcP, and alkaline (pH 8–10) for AlP. Higher acid phosphatase activity in the studied soil results from the fact that phosphomonoesterases are enzymes that are very sensitive to changes in soil reaction [55], and the soil reaction in the present experiment was acidic and very acidic. The activity of enzymes, with the exception of acid phosphatase, as shown by Różyło and Bohacz [85], is positively correlated with the content of nutrients in the soil. In the studies of the cited authors, the application of the biogas digestate and mineral mining waste increased the activity of soil enzymes. In the authors’ own research, the activity of enzymes was also the highest in soil fertilised with manure and NPK Mg, Ca. The activity of enzymes also depended on the soil layers, and more precisely on the properties and conditions occurring at different depths. The long-term application of fertilisers to the surface layer of the soil, the lack of deep soil cultivation and the low precipitation in the study area resulted in the pH value and nutrient content being higher in the 0–20 cm layer than in the 20–40 cm layer. The organic carbon content in the upper layer was as much as about 50% higher. Enzyme activity is positively correlated with organic carbon content [86], which may explain the higher activity of arylsulphatase and phosphatases in the surface layer. There is more oxygen in the top layer, which is also beneficial for most bacteria and fungi. Some actinomycetes are anaerobic. This could have resulted in a greater abundance of actinomycetes in the 20–40 cm layer than in the surface layer.

5. Conclusions

Long-term agricultural activity in this region of annual precipitation below 500 mm has led to heavy acidification of the Luvisol soil, which has a sandy–loam grain size distribution, and to a decrease in soil organic matter. In these environmental and agricultural management conditions, the fertilisation that most favourably affected soil pH and organic carbon content was the use of manure and liming once per crop rotation in combination with the annual use of nitrogen, phosphorus, potassium and magnesium in mineral fertilisers. This fertilisation, in comparison with other methods of mineral and organic–mineral fertilisation, also positive affected EC, available potassium and magnesium contents, abundance of bacteria and cellulolytic microorganisms, and alkaline phosphatase activity. This method of fertilisation should be recommended for agricultural practice. However, liming, optimal doses of mineral fertilisers and the frequency of application of manure or other organic fertilisers should increase both the pH and the content of soil organic matter because after 71 years the soil is acidic and the organic carbon content is less than 0.63 g C kg−1 dm soil. At the same time, rational mineral fertilisation in combination with organic fertilisation could, by increasing the content of available nutrients, increase plant productivity, including the amount of plant residues produced as a humus precursor. However, the study shows that on light soil and in a warm-summer humid continental climate, the use of mineral fertilisation alone creates unfavourable soil conditions in both the 0–20 cm and 20–40 cm layer. The long-term absence of manure from fertilisation adversely affected the chemical and biological properties of the soil, in particular reducing the activity of soil enzymes. Multidimensional analysis also indicates that long-term omission of any individual nutrient in organic–mineral fertilisation adversely affects soil’s chemical and biological properties. Therefore, the overriding conclusion from research on the long-term soil experiment is that sustainable organic and mineral fertilisation with periodic liming is part of good agricultural practice for sandy loam soil in a warm-summer humid continental climate. However, the assessment of the chemical and biological properties of the soil indicates that even fertilisation with manure, mineral fertilisers and liming, the best method under these environmental conditions, should be improved.

Author Contributions

Conceptualization, I.J. and J.D.; methodology, I.J., J.D. and M.R.; investigation, I.J., J.L., A.S.-Z., B.B.-B. and M.B.; data curation—compiled and analyzed the results, J.D. and I.J.; writing—original draft preparation, I.J., J.D., J.L., A.S.-Z., B.B.-B. and M.R.; review and editing, I.J., J.D., J.L., A.S.-Z., B.B.-B., M.R. and M.B. All authors have read and agreed to the published version of the manuscript.

Funding

This research received no external funding.

Conflicts of Interest

The authors declare no conflict of interest.

References

  1. Zhao, B.-Q.; Li, X.-Y.; Li, X.-P.; Shi, X.-J.; Huang, S.-M.; Wang, B.-R.; Zhu, P.; Yang, X.-Y.; Liu, H.; Chen, Y.; et al. Long-term fertilizer experiment network in China: Crop yields and soil nutrient trends. Agron. J. 2010, 102, 216–230. [Google Scholar] [CrossRef]
  2. Hmielowski, T. The value of long-term data in agricultural systems. CSA News 2017, 62, 4–7. [Google Scholar] [CrossRef] [Green Version]
  3. Johnston, A.E.; Poulton, P.R. The importance of long-term experiments in agriculture: Their management to ensure continued crop production and soil fertility; the Rothamsted experience. Eur. J. Soil Sci. 2018, 69, 113–125. [Google Scholar] [CrossRef] [Green Version]
  4. Liang, Y.; Wu, L.; Clark, I.M.; Xue, K.; Yang, Y.; Van Nostrand, J.D.; Deng, Y.; He, Z.; McGrath, S.; Storkey, J.; et al. Over 150 years of long-term fertilization alters spatial scaling of microbial biodiversity. mBio 2015, 6, e00240-15. [Google Scholar] [CrossRef] [PubMed] [Green Version]
  5. Kidd, J.; Manning, P.; Simkin, J.; Peacock, S.; Stockdale, E. Impacts of 120 years of fertilizer addition on a temperate grassland ecosystem. PLoS ONE 2017, 12, e0174632. [Google Scholar] [CrossRef] [PubMed]
  6. Suwara, I.; Pawlak-Zaręba, K.; Gozdowski, D.; Perzanowska, A. Physical properties of soil after 54 years of long-term fertilization and crop rotation. Plant Soil Environ. 2016, 62, 389–394. [Google Scholar] [CrossRef] [Green Version]
  7. Šimanský, V.; Jonczak, J. Formation of soil structure in long-term fertilised sandy soil: Role of the manganese oxides. Bull. Geogr. Phys. Geogr. Ser. 2019, 17, 31–37. [Google Scholar] [CrossRef] [Green Version]
  8. Mazur, Z.; Mazur, T. The influence of long-term fertilization with slurry, manure and NPK on the soil content of trace elements. J. Elem. 2016, 21, 131–139. [Google Scholar] [CrossRef]
  9. Ahmed, W.; Jing, H.; Kaillou, L.; Qaswar, M.; Khan, M.N.; Jin, C. Changes in phosphorus fractions associated with soil chemical properties under long-term organic and inorganic fertilization in paddy soils of southern China. PLoS ONE 2019, 14, e0216881. [Google Scholar] [CrossRef] [PubMed]
  10. Luo, P.; Han, X.; Wang, Y.; Han, M.; Shi, H.; Liu, N.; Bai, H. Influence of long-term fertilization on soil microbial biomass, dehydrogenase activity, and bacterial and fungal community structure in a brown soil of northeast China. Ann. Microbiol. 2015, 65, 533–542. [Google Scholar] [CrossRef] [Green Version]
  11. Eo, J.; Park, K.C. Long-term effects of imbalanced fertilization on the composition and diversity of soil bacterial community. Agric. Ecosyst. Environ. 2016, 231, 176–182. [Google Scholar] [CrossRef]
  12. Li, C.; Ma, S.; Shao, Y.; Zhang, L. Effects of long-term organic fertilization on soil microbiologic characteristics, yield and sustainable production of winter wheat. J. Integr. Agric. 2018, 17, 210–219. [Google Scholar] [CrossRef] [Green Version]
  13. Czarnecki, S.; Düring, R.A. Influence of long-term mineral fertilization on metal contents and properties of soil samples taken from different locations in Hesse, Germany. Soil 2015, 1, 23–33. [Google Scholar] [CrossRef] [Green Version]
  14. Jaskulska, I.; Jaskulski, D.; Kobierski, M. Effect of liming on the change of some agrochemical soil properties in a long-term fertilization experiment. Plant Soil Environ. 2014, 60, 146–150. [Google Scholar] [CrossRef] [Green Version]
  15. Černý, J.; Balík, J.; Kulhánek, M.; Časová, K.; Nedvěd, V. Mineral and organic fertilization efficiency in long-term stationary experiments. Plant Soil Environ. 2010, 56, 28–36. [Google Scholar] [CrossRef] [Green Version]
  16. Bhatt, M.K.; Labanya, R.; Joshi, H.C. Influence of long-term chemical fertilizers and organic manures on soil fertility—A Review. Univers. J. Agric. Res. 2019, 7, 177–188. [Google Scholar] [CrossRef]
  17. Triberti, L.; Nastri, A.; Baldoni, G. Long-term effects of crop rotation, manure and mineral fertilisation on carbon sequestration and soil fertility. Eur. J. Agron. 2016, 74, 47–55. [Google Scholar] [CrossRef]
  18. Lemanowicz, J. Mineral fertilisation as a factor determining selected sorption properties of soil against the activity of phosphatases. Plant Soil Environ. 2013, 59, 439–445. [Google Scholar] [CrossRef] [Green Version]
  19. Jaskulska, I.; Jaskulski, D.; Piekarczyk, M.; Kotwica, K.; Gałęzewski, L.; Wasilewski, P. Magnesium content in the leaves of winter wheat in a long-term fertilization experiment. Plant Soil Environ. 2015, 61, 208–212. [Google Scholar] [CrossRef] [Green Version]
  20. Yousaf, M.; Li, J.; Lu, J.; Ren, T.; Cong, R.; Fahad, S.; Li, X. Effects of fertilization on crop production and nutrient-supplying capacity under rice-oilseed rape rotation system. Sci. Rep. 2017, 7, 1270. [Google Scholar] [CrossRef]
  21. Guo, J.H.; Liu, X.J.; Zhang, Y.; Shen, J.L.; Han, W.X.; Zhang, W.F.; Christie, P.; Goulding, K.W.; Vitousek, P.M.; Zhang, F.S. Significant acidification in major Chinese croplands. Science 2010, 327, 1008–1010. [Google Scholar] [CrossRef] [PubMed] [Green Version]
  22. Siwik-Ziomek, A.; Lemanowicz, J. The content of carbon, nitrogen, phosphorus and sulphur in soil against the activity of selected hydrolases as affected by crop rotation and fertilization. Zemdirb. Agric. 2014, 101, 367–372. [Google Scholar] [CrossRef] [Green Version]
  23. Roba, T.B. Review on: The effect of mixing organic and inorganic fertilizer on productivity and soil fertility. OALib 2018, 5, 1–11. [Google Scholar] [CrossRef]
  24. Vašak, F.; Černy, J.; Buranova, Š.; Kulhanek, M.; Balik, J. Soil pH changes in long-term field eksperiments with different fertilizing systems. Soil Water Res. 2015, 10, 19–23. [Google Scholar] [CrossRef] [Green Version]
  25. Ge, S.; Zhu, Z.; Jiang, Y. Long-term impact of fertilization on soil pH and fertility in an apple production system. J. Soil Sci. Plant Nutr. 2018, 18, 282–293. [Google Scholar] [CrossRef] [Green Version]
  26. Scherer, H.W. Sulfur in soils. J. Plant Nutr. Soil Sci. 2009, 172, 326–335. [Google Scholar] [CrossRef]
  27. Hemalatha, S.V.; Radhika, K.; Maragatham, S.; Katharine, S.P. Influence of long-term fertilization on soil fertility—A review. J. Agric. Allied Sci. 2013, 2, 30–36. [Google Scholar]
  28. Murugan, R.; Kumar, S. Influence of long-term fertilisation and crop rotation on changes in fungal and bacterial residues in a tropical rice-field soil. Biol. Fertil. Soils 2013, 49, 847–856. [Google Scholar] [CrossRef]
  29. Wang, Z.; Liu, Y.; Zhao, L.; Zhang, W.; Liu, L. Change of soil microbial community under long-term fertilization in a reclaimed sandy agricultural ecosystem. PeerJ 2019, 7, e6497. [Google Scholar] [CrossRef]
  30. Elbl, J.; Maková, J.; Javoreková, S.; Medo, J.; Kintl, A.; Lošák, T.; Lukas, V. Response of microbial activities in soil to various organic and mineral amendments as an indicator of soil quality. Agronomy 2019, 9, 485. [Google Scholar] [CrossRef] [Green Version]
  31. Zhou, J.; Guan, D.W.; Zhou, B.K.; Zhao, B.S.; Ma, M.C.; Qin, J.; Jiang, X.; Chen, S.; Gao, F.; Shen, D.; et al. Influence of 34-years of fertilization on bacterial communities in an intensively cultivated black soil in northeast China. Soil Biol. Biochem. 2015, 90, 42–51. [Google Scholar] [CrossRef]
  32. Zhong, Y.Q.; Yan, W.M.; Shangguan, Z.P. Impact of long-term N additions upon coupling between soil microbial community structure and activity, and nutrient-use efficiencies. Soil Biol. Biochem. 2015, 91, 151–159. [Google Scholar] [CrossRef]
  33. Natywa, M.; Sawicka, A.; Wolna-Maruwka, A. Microbial and enzymatic activity in the soil under maize crop in relation to differentiated nitrogen fertilization. Water Environ. Rural Areas 2010, 10, 111–120. [Google Scholar]
  34. Cinnadurai, C.; Gopalaswamy, G.; Balachandar, D. Diversity of cultivable Azotobacter in the semi-arid alfisol receiving long-term organic and inorganic nutrient amendments. Ann. Microbiol. 2013, 63, 1397–1404. [Google Scholar] [CrossRef]
  35. Barabasz, W.; Albinska, D.; Jaskowska, M.; Lipiec, J. Biological effects of mineral nitrogen fertilization on soil microorganisms. Pol. J. Environ. Stud. 2002, 11, 193–198. [Google Scholar]
  36. Geisseler, D.; Scow, K. Long-term effects of mineral fertilizers on soil microorganisms—A review. Soil Biol. Biochem. 2014, 75, 54–63. [Google Scholar] [CrossRef]
  37. Francioli, D.; Schulz, E.; Lentendu, G.; Wubet, T.; Buscot, F.; Reitz, T. Mineral vs. organic amendments: Microbial community structure, activity and abundance of agriculturally relevant microbes are driven by long-term fertilization strategies. Front. Microbiol. 2016, 7, 1446. [Google Scholar] [CrossRef] [Green Version]
  38. Tabatabai, M.A.E.; Weaver, R.I.; Augle, S.; Bottomly, P.J.; Bezdieck, D.; Smith, S.; Tabatabai, M.A.; Wollum, A. Methodes of soil analysis. Part 2. Microbiological and biochemical properties. Soil Sci. Soc. Am. 1994, 5, 775–833. [Google Scholar]
  39. Bowles, T.M.; Acosta-Martínez, V.; Calderón, V.; Jackson, L.E. Soil enzyme activities, microbial communities, and carbon and nitrogen availability in organic agroecosystems across an intensively-managed agricultural landscape. Soil Biol. Biochem. 2014, 68, 252–262. [Google Scholar] [CrossRef]
  40. Piotrowska-Długosz, A. Significance of enzymes and their application in agriculture. In Biocatalysis; Husain, Q., Ullah, M., Eds.; Springer: Cham, Switzerland, 2017; pp. 277–308. [Google Scholar]
  41. Klose, S.; Tabatabai, M.A. Arylsulfatase activity of microbial biomass in soils. Soil Sci. Soc. Am. J. 1999, 63, 569–574. [Google Scholar] [CrossRef]
  42. Mbuthia, L.W.; Acosta-Martínez, V.; DeBruyn, J.; Schaeffer, S.; Tyler, D.; Odoi, E.; Mpheshea, M.; Walkes, F.; Eash, N. Long term tillage, cover crop, and fertilization effects on microbial community structure, activity: Implications for soil quality. Soil Biol. Biochem. 2015, 89, 24–34. [Google Scholar] [CrossRef]
  43. Piotrowska-Długosz, A.; Wilczewski, E. Soil phosphatase activity and phosphorus content as influenced by catch crops cultivated as green manure. Pol. J. Environ. Stud. 2014, 23, 157–165. [Google Scholar]
  44. Zhou, X.; Zhang, Y.; Downing, A. Non-linear response of microbial activity across a gradient of nitrogen addition to a soil from the Gurbantunggut Desert, northwestern China. Soil Biol. Biochem. 2012, 47, 67–77. [Google Scholar] [CrossRef]
  45. Chen, Y.; Liu, J.; Liu, S. Effect of long-term mineral fertilizer application on soil enzyme activities and bacterial community composition. Plant Soil Environ. 2018, 64, 571–577. [Google Scholar]
  46. Peel, M.C.; Finlayson, B.L.; McMahon, T.A. Updated world map of the Köppen-Geiger climate classification. Hydrol. Earth Syst. Sci. 2007, 11, 1633–1644. [Google Scholar] [CrossRef] [Green Version]
  47. Marks, M.; Jastrzębska, M.; Kostrzewska, M.K. Long-Term Experiments in Agricultural Studies in Poland; Wydawnictwo Uniwersytetu Warmińsko-Mazurskiego: Olsztyn, Poland, 2018; p. 280. [Google Scholar]
  48. Jaskulska, I. History of the Experimental Station of the University of Science and Technology—70 years of a static fertilisation experiment in Mochełek. In 100 Years of Agricultural Experimentation at the Faculty of Agriculture and Biology Warsaw University of Life Sciences—WULS; Łabętowicz, J., Radecki, A., Eds.; Wydawnictwo SGGW: Warszawa, Poland, 2020; pp. 95–104. [Google Scholar]
  49. PN-ISO 10390. Chemical and Agricultural Analysis—Determining Soil pH; Polish Standards Committee: Warszawa, Poland, 1997. [Google Scholar]
  50. PN-R-04023. Chemical and Agricultural Analysis—Determination of the Content of Available Phosphorus in Mineral Soils; Polish Standards Committee: Warszawa, Poland, 1996. [Google Scholar]
  51. PN-R-04022. Chemical and Agricultural Analysis—Determination of the Content Available Potassium in Mineral Soils; Polish Standards Committee: Warszawa, Poland, 1996. [Google Scholar]
  52. PN-R-04020. Chemical and Agricultural Analysis. Determination of the Content Available Magnesium; Polish Standards Committee: Warszawa, Poland, 1994. [Google Scholar]
  53. Bardsley, C.E.; Lancaster, J.D. Determination of reserve sulfur and soluble sulfates in soils 1. Soil Sci. Soc. Am. J. 1960, 24, 265–268. [Google Scholar] [CrossRef]
  54. Tabatabai, M.A.; Bremner, J.M. Use of p–nitrophenol phosphate for assay of soil phosphatase activity. Soil Biol. Biochem. 1969, 1, 301–307. [Google Scholar] [CrossRef]
  55. Dick, W.A.; Cheng, L.; Wang, P. Soil acid alkaline phosphatase activity as pH adjustment indicators. Soil Biol. Biochem. 2000, 32, 1915–1919. [Google Scholar] [CrossRef]
  56. Atlas, R.M. Handbook of Microbiological Media, 4th ed.; CRC Press: Boca Raton, FL, USA; Taylor & Francis Group: Abingdon, UK, 2010. [Google Scholar]
  57. Gupta, P.; Samant, K.; Sahu, A. Isolation of cellulose-degrading bacteria and determination of their cellulolytic potential. Int. J. Microbiol. 2012, 2012, 578925. [Google Scholar] [CrossRef] [Green Version]
  58. Crawford, D.L.; Lynch, J.M.; Whipps, J.M.; Ousley, M.A. Isolation and characterization of actinomycetes antagonists of a fungal root pathogen. Appl. Environ. Microbiol. 1996, 59, 3899–3905. [Google Scholar] [CrossRef] [Green Version]
  59. Statistica, Data Analysis Software System, Version 12; TIBCO Software Inc.: Palo Alto, CA, USA, 2019; Available online: https://www.tibco.com/products/data-science (accessed on 15 January 2019).
  60. Debreczeni, K.; Kismányoky, T. Acidification of soils in long-term field experiments. Commun. Soil Sci. Plant Anal. 2005, 36, 321–329. [Google Scholar] [CrossRef]
  61. Zhang, Y.C. Research of Long-Term Fertilization on Soil Acidification. Ph.D. Thesis, Nanjing Agriculture University, Nanjing, China, 2012. [Google Scholar]
  62. Zhou, X.; Zhou, S.; Xu, G.; Colinet, G. Evolution characteristics and influence factors of acidification in paddy soil of Southern China. Sci. Agric. Sin. 2015, 23, 4811–4817. [Google Scholar]
  63. Guo, X.; Li, H.; Yu, H.; Li, W.; Ye, Y.; Biswa, A. Drivers of spatio-temporal changes in paddy soil pH in Jiangxi Province, China from 1980 to 2010. Sci. Rep. 2018, 8, 2702. [Google Scholar] [CrossRef] [PubMed]
  64. Wu, Y.; Zeng, J.; Zhu, Q.; Zhang, Z.; Lin, X. pH is the primary determinant of the bacterial community structure in agricultural soils impacted by polycyclic aromatic hydrocarbon pollution. Sci Rep. 2017, 7, 40093. [Google Scholar] [CrossRef] [Green Version]
  65. Zhang, L.; Chen, W.; Burger, M.; Yang, L.; Gong, P.; Wu, Z. Changes in soil carbon and enzyme activity as a result of different long-term fertilization regimes in a greenhouse field. PLoS ONE 2015, 10, e0118371. [Google Scholar] [CrossRef] [Green Version]
  66. Lemanowicz, J. Activity of selected enzymes as markers of ecotoxicity in technogenic salinization soils. Environ. Sci. Pollut. Res. 2019, 26, 13014–13024. [Google Scholar] [CrossRef] [PubMed] [Green Version]
  67. Radziemska, M.; Bęś, A.; Gusiatin, Z.M.; Majewski, G.; Mazur, Z.; Bilgin, A.; Jaskulska, I.; Brtnický, M. Immobilization of potentially toxic elements (PTE) by mineral-based amendments: Remediation of contaminated soils in post-industrial sites. Minerals 2020, 10, 87. [Google Scholar] [CrossRef] [Green Version]
  68. Rashmi, I.; Roy, T.; Kartika, K.S.; Pal, R.; Coumar, V.; Kala, S.; Shinoji, K.C. Organic and inorganic fertilizer contaminants in agriculture: Impact on soil and water resources. In Contaminants in Agriculture; Naeem, M., Ansari, A., Gill, S., Eds.; Springer: Cham, Switzerland, 2020. [Google Scholar]
  69. Liu, E.; Yan, C.; Mei, X.; Zhang, Y.; Fan, T. Long-term effect of manure and fertilizer on soil organic carbon pools in dryland farming in Northwest China. PLoS ONE 2013, 8, e56536. [Google Scholar] [CrossRef] [Green Version]
  70. Bitew, Y.; Alemayehu, M. Impact of crop production inputs on soil health: A review. Asian J. Plant Sci. 2017, 16, 109–131. [Google Scholar] [CrossRef] [Green Version]
  71. Lipiński, W.; Terelak, H.; Motowicka-Terelak, T. Propozycja liczb granicznych zawartości siarki siarczanowej w glebach mineralnych na potrzeby doradztwa nawozowego. Rocz. Glebozn. 2003, 54, 7984. [Google Scholar]
  72. Förster, S.; Welp, G.; Scherer, H.W. Sulfur specification in bulk soil as influenced by long-term application of mineral and organic fertilizers. Plant Soil Environ. 2012, 58, 316–321. [Google Scholar] [CrossRef] [Green Version]
  73. Guo, Z.; Han, J.; Li, J.; Xu, Y.; Wang, X.; Li, Y. Effects of long-term fertilization on soil organic carbon mineralization and microbial community structure. PLoS ONE 2019, 14, 0216006. [Google Scholar]
  74. Fierer, N.; Lauber, C.L.; Ramirez, K.S.; Zaneveld, J.; Bradford, M.A.; Knight, R. Comparative metagenomic, phylogenetic and physiological analyses of soil microbial communities across nitrogen gradients. ISME J. 2012, 6, 1007–1017. [Google Scholar] [CrossRef] [PubMed] [Green Version]
  75. Jacoby, R.; Peukert, M.; Succurro, A.; Koprivova, A.; Kopriva, S. The role of soil microorganisms in plant mineral nutrition—Current knowledge and future directions. Front. Plant Sci. 2017, 8, 1617. [Google Scholar] [CrossRef] [Green Version]
  76. Tang, H.; Xu, Y.; Xiao, X.; Li, C.; Li, W.; Cheng, K.; Pan, X.; Sun, G. Impacts of long-term fertilization on the soil microbial communities in double-cropped paddy fields. J. Agric. Sci. 2018, 156, 857–864. [Google Scholar] [CrossRef]
  77. Pietri, J.C.; Brookes, P.C. Relationships between soil pH and microbial properties in a UK arable soil. Soil Biol. Biochem. 2008, 40, 1856–1861. [Google Scholar] [CrossRef]
  78. Cho, S.; Kim, M.; Lee, Y. Effect of pH on soil bacterial diversity. J. Ecol. Environ. 2016, 40, 10. [Google Scholar] [CrossRef] [Green Version]
  79. Parham, J.A.; Deng, S.P.; Raun, W.R.; Jonson, G.V. Long term cattle manure application in soil, I. Effect on soil phosphorus levels, microbial biomass C, and dehydrogenase and phosphatase activities. Biol. Fertil. Soils 2002, 35, 328–337. [Google Scholar]
  80. Adetunji, A.T.; Lewu, F.B.; Mulidzi, R.; Ncube, B. The biological activities of β-glucosidase, phosphatase and urease as soil quality indicators: A review. J. Soil Sci. Plant Nutr. 2017, 17, 794–807. [Google Scholar] [CrossRef] [Green Version]
  81. Saha, S.; Prakash, V.; Kundu, S.; Kumar, N.; Lal Mina, B. Soil enzymatic activity as affected by long term application of farmyard manure and mineral fertilizer under a rainfed soybean–wheat system in N-W Himalaya. Eur. J. Soil Biol. 2008, 44, 309–315. [Google Scholar] [CrossRef]
  82. Liang, Q.; Chen, H.; Gong, Y.; Yang, H.; Fan, M.; Kuzyakov, Y. Effects of 15 years of manure and mineral fertilizers on enzyme activities in particle-size fractions in a North China Plain soil. Eur. J. Soil Biol. 2014, 60, 112–119. [Google Scholar] [CrossRef]
  83. Nannipieri, P.; Giagnoni, L.; Landi, L.; Renella, G. Role of phosphatase enzymes in soil. In Phosphorus in Action; Series: Soil Biol. Bünemann, E.K., Oberson, A., Frossard, E., Eds.; Springer: Berlin/Heidelberg, Germany, 2011; Volume 26, pp. 215–243. [Google Scholar]
  84. Bohme, L.; Bohme, F. Soil microbiological and biochemical properties affected by plant growth and different long-term fertilization. Eur. J. Soil Biol. 2006, 42, 1–12. [Google Scholar] [CrossRef]
  85. Różyło, K.; Bohacz, J. Microbial and enzyme analysis of soil after the agricultural utilization of biogas digestate and mineral mining waste. Int. J. Environ. Sci. Technol. 2020, 17, 1051–1062. [Google Scholar] [CrossRef] [Green Version]
  86. Filipek-Mazur, B.; Pużyńska, K.; Tabak, M.; Pużyński, S. Enzymatic activity of soil under spelt grown in an organic farming system in Poland’s temperate climate. Agronomy 2020, 10, 930. [Google Scholar] [CrossRef]
Figure 1. Enzymatic pH index of soil (AlP/AcP) depending on the treatment of long-term fertilisation: half-dose nitrogen, phosphorus and potassium in mineral fertilisers (½ NPK); full-dose nitrogen, phosphorus, potassium (NPK); manure + nitrogen, phosphorus, potassium, magnesium and liming (FYM NPK Mg Ca); manure + mineral fertilisers without magnesium and liming (FYM NPK); manure + nitrogen and phosphorus (FYM NP); manure + nitrogen and potassium (FYM NK). a, b, c, d—lowercase letters indicate a significant difference between the fertilisation treatments for two depths; A, B—capital letters indicate a significant difference between the depths for fertilisation treatments.
Agronomy 10 01610 g001
Figure 2. PCA analysis (principal component analysis) of soil properties: pH in 1 M KCl (pH); electrical conductivity (EC); organic carbon content (OC); content of available phosphorus (Pa), potassium (Ka), magnesium (Mga), sulphur (S-SO4); total number of bacteria (Bt), cellulolytic microorganisms (Bc), fungi (Ff) and actinomycetes (Ac); activity of alkaline phosphatase (AlP), acid phosphatase (AcP) arylsulphatase (ArS) at a depth of 0–20 cm—(A) and 20–40 cm—(B).
Agronomy 10 01610 g002
Figure 3. Dendrogram of fertilizing treatments for two layers 0–20 cm (A) and 20–40 cm (B): half-dose nitrogen, phosphorus and potassium in mineral fertilisers (½ NPK); full-dose nitrogen, phosphorus, potassium (NPK); manure + nitrogen, phosphorus, potassium, magnesium and liming (FYM NPK Mg Ca); manure + mineral fertilisers without magnesium and liming (FYM NPK); manure + nitrogen and phosphorus (FYM NP); manure + nitrogen and potassium (FYM NK).
Agronomy 10 01610 g003
Table 1. Chemical properties of soil depending on the treatment of long-term fertilisation: half-dose nitrogen, phosphorus and potassium in mineral fertilisers (½ NPK); full-dose nitrogen, phosphorus, potassium (NPK); manure + nitrogen, phosphorus, potassium, magnesium and liming (FYM NPK Mg Ca); manure + mineral fertilisers without magnesium and liming (FYM NPK); manure + nitrogen and phosphorus (FYM NP); manure + nitrogen and potassium (FYM NK). Mean values, (±standard deviation), mean square, LSD, n = 4.
Depth (cm)FertilisationMean
½ NPKNPKFYM NPK Mg CaFYM NPKFYM NPFYM NK
pHKCl
0–204.74 (0.17)4.44 (0.33)5.04 (0.23)4.61 (0.29)4.24 (0.28)4.39 (0.28)4.58 (0.35)
20–404.96 (0.26)4.47 (0.38)5.21 (0.18)4.56 (0.27)4.34 (0.29)4.36 (0.26)4.65 (0.41)
Mean4.85 (0.23)4.46 (0.30)5.13 (0.21)4.59 (0.25)4.28 (0.26)4.37 (0.24)4.61 (0.38)
Mean square: fertilisation = 0.616; depth = 0.046; interaction = 0.019
Electrical Conductivity—EC (mS cm−1)
0–200.183 (0.005)0.181 (0.005)0.273 (0.004)0.225 (0.003)0.230 (0.002)0.183 (0.005)0.212 (0.035)
20–400.200 (0.002)0.262 (0.005)0.400 (0.007)0.284 (0.005)0.189 (0.005)0.223 (0.002)0.260 (0.068)
Mean0.192 (0.010)0.221 (0.047)0.337 (0.073)0.254 (0.034)0.210 (0.023)0.203 (0.024)0.236 (0.062)
Mean square: fertilisation = 0.012; depth = 0.013; interaction = 0.003
LSD: fertilisation = 0.016; depth = 0.004; depth/fertilisation = 0.009; fertilisation/depth = 0.019
Organic Carbon—OC (g C kg−1 dm soil)
0–200.46 (0.01)0.49 (0.02)0.63 (0.04)0.57 (0.01)0.56 (0.02)0.54 (0.01)0.54 (0.06)
20–400.30 (0.02)0.28 (0.01)0.38 (0.02)0.33 (0.02)0.32 (0.02)0.31 (0.01)0.34 (0.04)
Mean0.38 (0.09)0.39 (0.11)0.51 (0.14)0.45 (0.13)0.44 (0.13)0.43 (0.12)0.44 (0.12)
Mean square: fertilisation = 0.017; depth = 0.590; interaction = 0.002
LSD: fertilisation = 0.03; depth = 0.01; depth/fertilisation = 0.02; fertilisation/depth = 0.05
Phosphorus—Pa (mg P kg−1 dm soil)
0–20110.3 (4.8)129.3 (0.2)139.6 (2.3)158.7 (4.0)147.0 (1.2)99.6 (0.6)130.8 (21.0)
20–40105.4 (5.7)117.8 (2.7)125.9 (5.8)133.4 (1.4)126.9 (2.8)87.7 (2.3)116.2 (16.2)
Mean107.9 (5.6)123.5 (6.4)132.8 (8.4)146.0 (13.8)137.0 (11.0)93.7 (6.6)123.5 (20.0)
Mean square: fertilisation = 3055.881; depth = 2552.387; interaction = 102.699
LSD: fertilisation = 7.1; depth = 1.3; depth/fertilisation = 3.2; fertilisation/depth = 7.9
Potassium—Ka (mg K kg−1 dm soil)
0–20128.8 (1.3)153.7 (0.4)204.0 (4.3)166.9 (1.7)87.5 (1.8)149.7 (0.5)148.4 (37.1)
20–40127.8 (1.5)136.9 (0.6)164.6 (1.0)163.0 (0.1)82.8 (0.3)136.9 (0.3)135.3 (28.5)
Mean128.3 (1.3)145.3 (9.7)184.3 (22.9)165.0 (2.4)85.1 (2.9)143.3 (7.4)141.9 (33.0)
Mean square: fertilisation = 4606.249; depth = 1030.315; interaction = 201.386
LSD: fertilisation = 4.2; depth = 1.8; depth/fertilisation =4.5; fertilisation/depth = 6.7
Magnesium—Mga (mg Mg kg−1 dm soil)
0–2010.5 (0.76)12.4 (0.08)24.4 (0.03)20.5 (0.67)18.5 (1.58)14.3 (0.01)16.8 (4.99)
20–407.7 (0.11)12.3 (0.09)17.8 (0.08)17.4 (0.02)15.7 (0.21)12.6 (0.21)13.9 (3.58)
Mean9.1 (1.58)12.3 (0.08)21.1 (3.52)18.9 (1.73)17.1 (1.83)13.5 (0.89)15.3 (4.52)
Mean square: fertilisation = 161.408; depth = 96.958; interaction = 9.381
LSD: fertilisation = 1.0; depth = 0.3; depth/fertilisation = 0.7; fertilisation/depth = 1.3
Sulphur—S-SO4 (mg S-SO4 kg−1 dm soil)
0–2012.1 0.1812.3 (0.06)14.1 (0.14)14.4 (0.52)12.5 (0.52)16.0 (0.60)13.6 (1.46)
20–4011.9 0.2413.8 (0.56)14.9 (0.80)11.8 (0.21)12.9 (0.20)12.8 (0.69)13.0 (1.18)
Mean12.0 0.2213.1 (0.86)14.5 (0.67)13.1 (1.46)12.7 (0.42)14.4 (1.81)13.3 (1.34)
Mean square: fertilisation = 7.400; depth = 3.845; interaction = 7.271
LSD: fertilisation = 0.5; depth = 0.4; depth/fertilisation = 0.9; fertilisation/depth = 1.1
Table 2. Number of microorganisms in soil depending on the treatment of long-term fertilisation: half-dose nitrogen, phosphorus and potassium in mineral fertilisers (½ NPK); full-dose nitrogen, phosphorus, potassium (NPK); manure + nitrogen, phosphorus, potassium, magnesium and liming (FYM NPK Mg Ca); manure + mineral fertilisers without magnesium and liming (FYM NPK); manure + nitrogen and phosphorus (FYM NP); manure + nitrogen and potassium (FYM NK). Mean values, (±standard deviation), mean square, LSD, n = 4.
Depth (cm)FertilisationMean
½ NPKNPKFYM NPK Mg CaFYM NPKFYM NPFYM NK
Total Bacteria—Bt (cfu × 106 g−1 dm soil)
0–2012.9 (0.91)5.7 (0.52)12.4 (1.35)6.4 (0.49)4.3 (0.41)5.0 (0.89)7.8 (3.65)
20–406.3 (0.52)5.6 (1.29)10.0 (0.94)2.6 (0.47)5.0 (0.89)4.9 (0.72)5.7 (2.40)
Mean9.6 (3.50)5.6 (0.94)11.2 (1.67)4.5 (2.02)4.6 (0.77)4.9 (0.79)6.8 (3.24)
Mean square: fertilisation = 101.960; depth = 74.420; interaction = 23.293
LSD: fertilisation = 0.7; depth = 0.4; depth/fertilisation = 1.1; fertilisation/depth = 1.4
Cellulolytic microorganisms—Bc (cfu × 105 g−1 dm soil)
0–2032.7 (3.06)24.3 (1.15)37.3 (1.15)18.0 (1.00)27.3 (2.52)18.7 (0.57)26.4 (7.37)
20–4033.7 (4.04)16.0 (2.00)36.0 (1.73)18.0 (0.29)21.7 (1.15)15.0 (1.00)23.4 (8.78)
Mean33.2 (3.35)20.2 (4.79)36.7 (1.51)18.0 (0.66)24.5 (3.56)16.8 (2.14)24.9 (8.13)
Mean square: fertilisation = 410.444; depth = 81.000; interaction = 19.133
LSD: fertilisation = 2.3; depth =1.8; depth/fertilisation = 4.3; fertilisation/depth = 5.3
Filamentous fungi—Ff (cfu × 104 g−1 dm soil)
0–2031.7 (2.08)26.3 (4.04)34.0 (1.73)35.0 (0.90)30.0 (1.00)32.0 (1.00)31.5 (3.41)
20–4023.0 (1.73)24.7 (1.53)30.0 (0.58)28.0 (2.00)23.7 (1.15)22.3 (2.08)25.3 (3.25)
Mean27.3 (5.05)25.5 (2.88)32.0 (2.32)31.5 (4.11)26.8 (3.60)27.2 (5.49)28.4 (4.54)
Mean square: fertilisation = 43.311; depth = 348.444; interaction = 13.244
LSD: fertilisation = 2.9; depth = 1.5; depth/fertilisation = ns; fertilisation/depth = ns
Actinobacteria—Ac (cfu × 105 g−1 dm soil)
0–2025.0 (3.46)9.0 (1.00)32.7 (2.52)11.0 (1.73)15.0 (1.73)12.1 (0.12)17.5 (8.95)
20–4033.0 (2.65)22.6 (1.40)24.0 (2.65)8.3 (0.58)17.0 (1.00)19.3 (2.08)20.7 (7.84)
Mean29.0 (5.18)15.8 (7.51)28.3 (5.28)9.7 (1.86)16.0 (1.67)15.7 (4.19)19.1 (8.45)
Mean square: fertilisation = 365.304; depth = 95.062; interaction = 97.112
LSD: fertilisation = 4.8; depth = 1.1; depth/fertilisation = 2.7; fertilisation/depth = 5.6
Table 3. Activity of soil enzymes depending on the treatment of long-term fertilisation: half-dose nitrogen, phosphorus and potassium in mineral fertilisers (½ NPK); full-dose nitrogen, phosphorus, potassium (NPK); manure + nitrogen, phosphorus, potassium, magnesium and liming (FYM NPK Mg Ca); manure + mineral fertilisers without magnesium and liming (FYM NPK); manure + nitrogen and phosphorus (FYM NP); manure + nitrogen and potassium (FYM NK). Mean values, (±standard deviation), mean square, LSD, n = 4.
Depth (cm)FertilisationMean
½ NPKNPKFYM NPK Mg CaFYM NPKFYM NPFYM NK
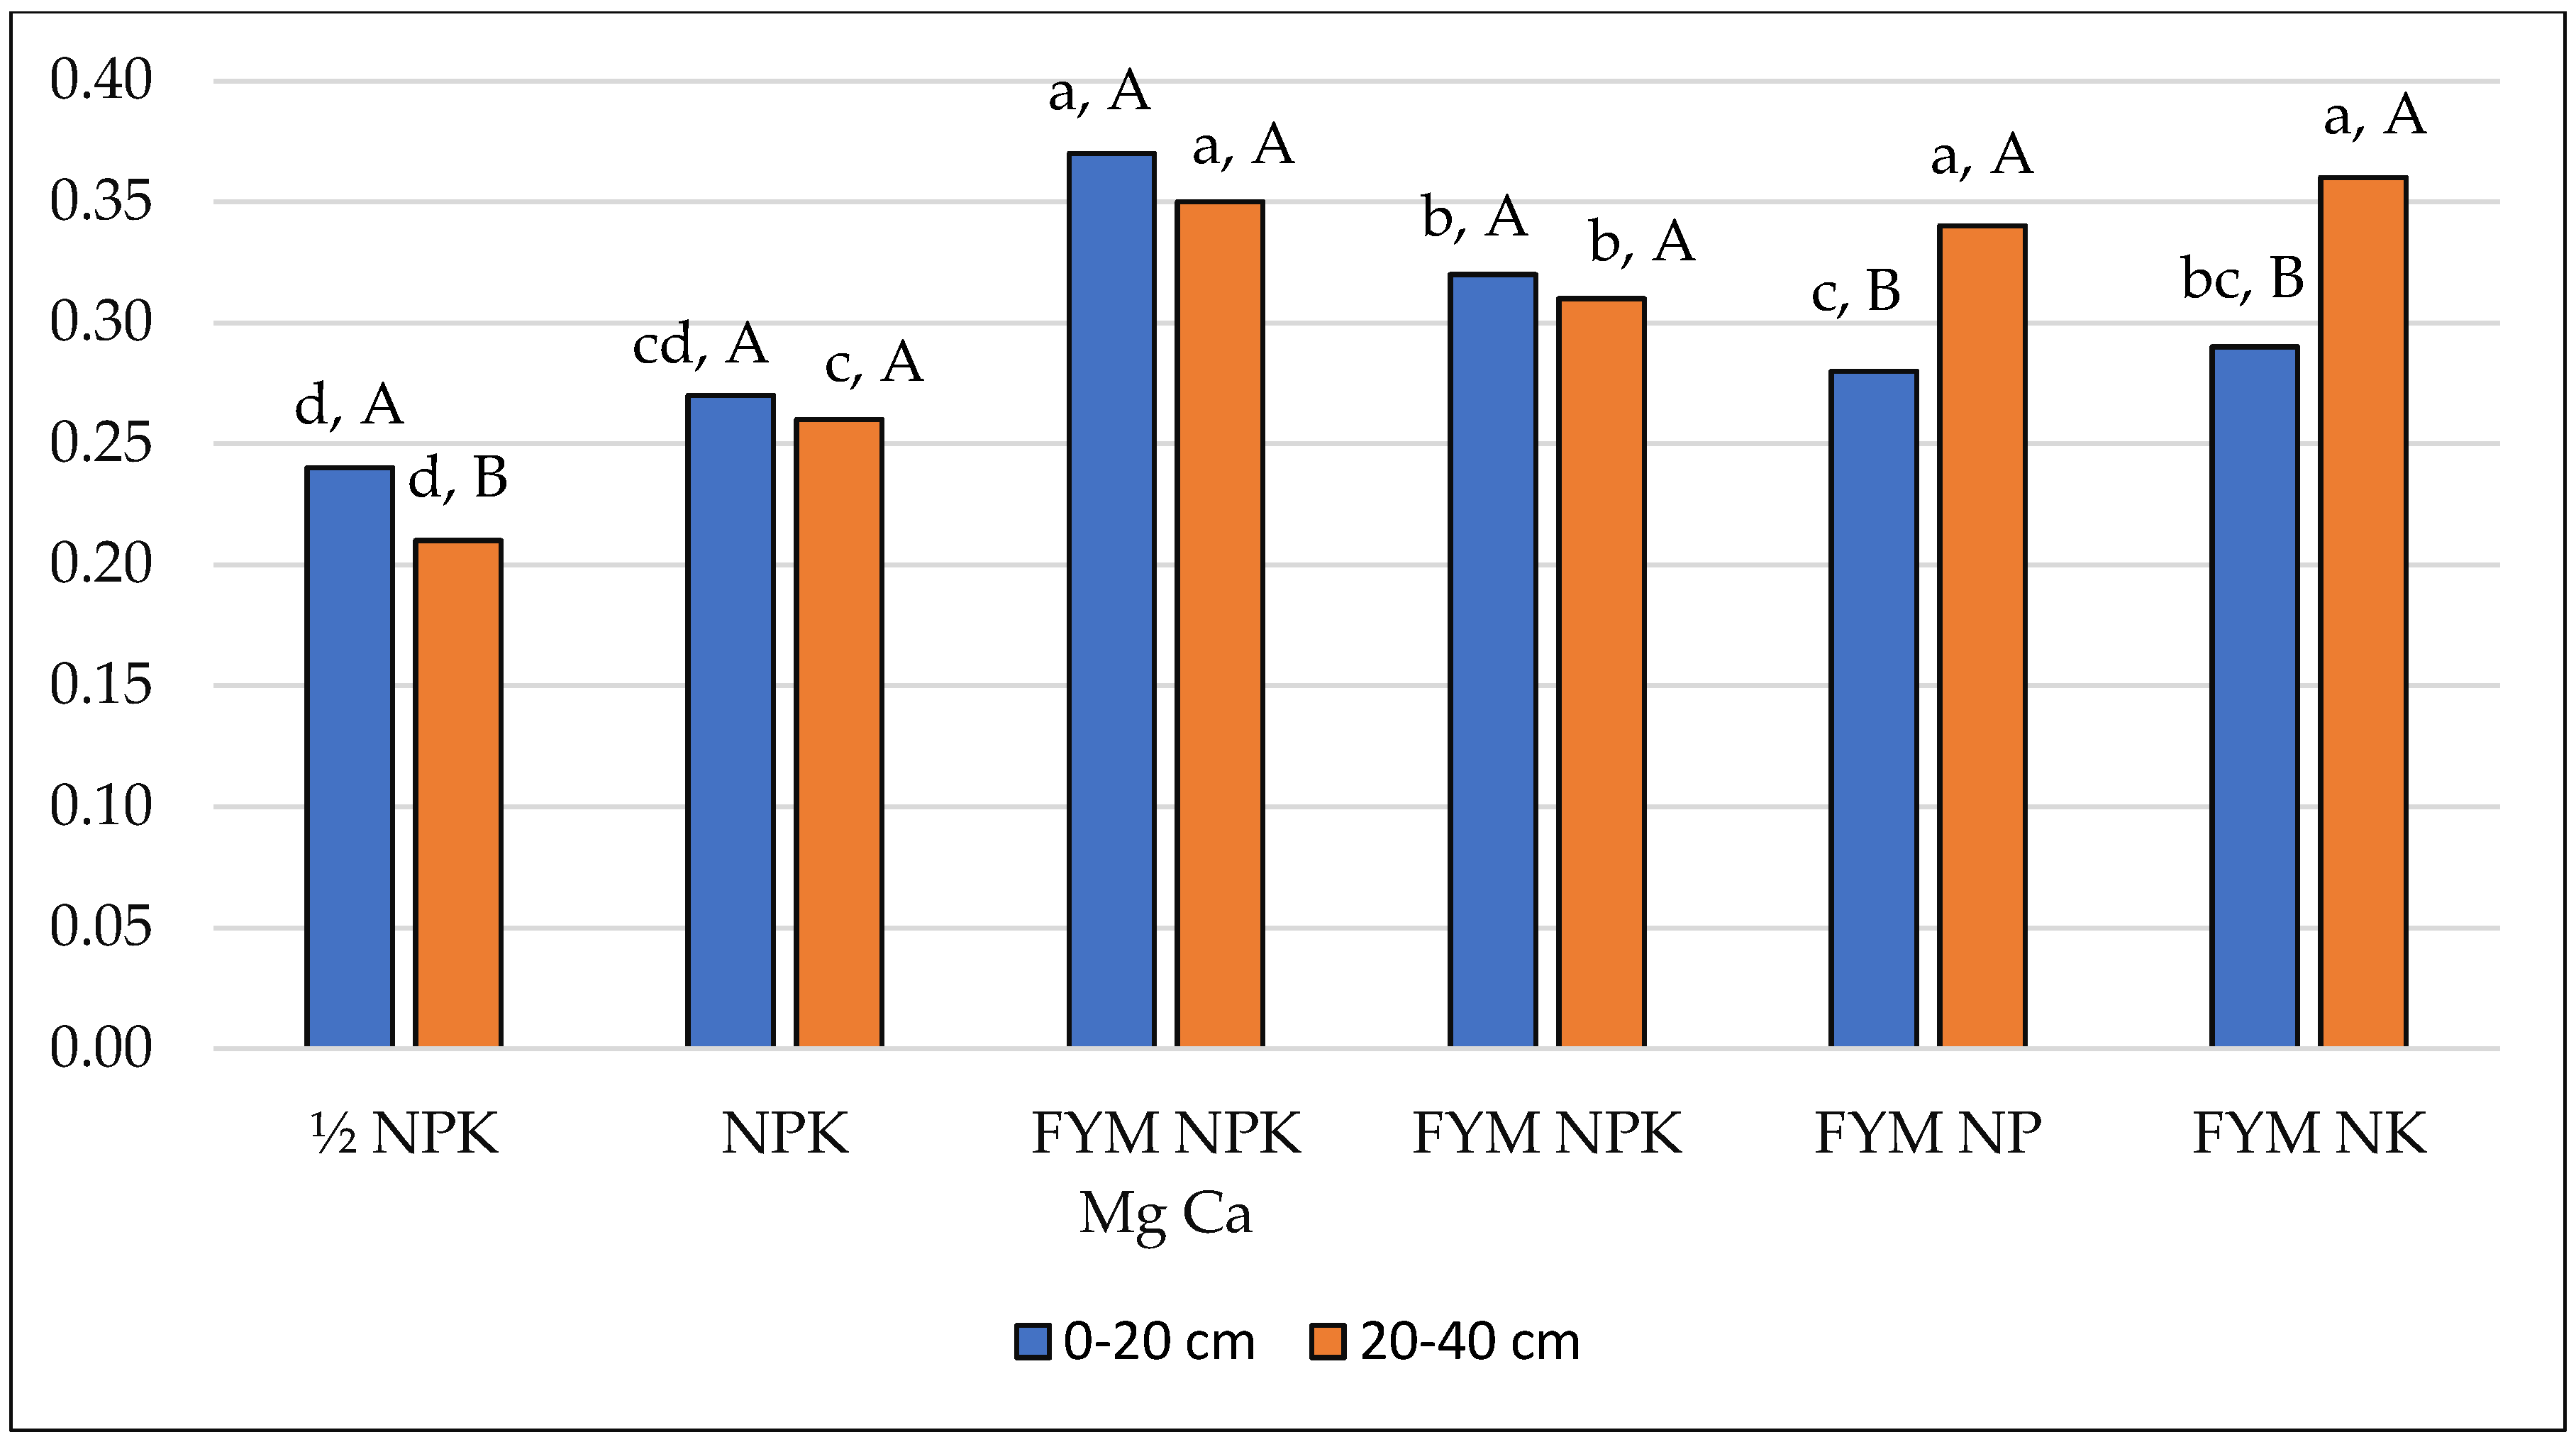
Alkaline Phosphatase—AlP (mM pNP kg−1 h−1)
0–200.237 (0.004)0.256 (0.022)0.457 (0.007)0.329 (0.006)0.304 (0.012)0.309 (0.006)0.315 (0.075)
20–400.168 (0.004)0.218 (0.004)0.339 (0.016)0.305 (0.012)0.333 (0.008)0.345 (0.006)0.285 (0.066)
Mean0.203 (0.037)0.237 (0.025)0.398 (0.040)0.317 (0.016)0.319 (0.067)0.327 (0.014)0.300 (0.076)
Mean square: fertilisation = 0.043; depth = 0.040; interaction = 0.003
LSD: fertilisation = 0.018; depth = 0.006; depth/fertilisation = 0.015; fertilisation/depth = 0.024
Acid Phosphatase—AcP (mM pNP kg−1 h−1)
0–200.972 (0.007)0.949 (0.009)1.252 (0.053)1.040 (0.018)1.079 (0.019)1.071 (0.023)1.060 (0.104)
20–400.812 (0.036)0.824 (0.017)0.978 (0.015)0.993 (0.011)0.977 (0.035)0.965 (0.040)0.925 (0.082)
Mean0.892 (0.095)0.887 (0.073)1.115 (0.161)1.017 (0.029)1.028 (0.063)1.018 (0.069)0.993 (0.115)
Mean square: fertilisation = 0.031; depth = 0.110; interaction = 0.006
LSD: fertilisation = 0.103; depth = 0.022; depth/fertilisation = 0.055; fertilisation/depth = 0.121
Arylsulphatase—ArS (μM pNP g−1 h−1)
0–200.113 (0.018)0.183 (0.027)0.208 (0.035)0.194 (0.013)0.232 (0.014)0.225 (0.008)0.193 (0.045)
20–400.060 (0.003)0.070 (0.008)0.239 (0.010)0.218 (0.006)0.208 (0.002)0.169 (0.004)0.161 (0.073)
Mean0.087 (0.032) 0.127 (0.063)0.224 (0.029)0.206 (0.016)0.220 (0.016)0.197 (0.029)0.177 (0,062)
Mean square: fertilisation = 0.026; depth = 0.012; interaction = 0.006
LSD: fertilisation = 0.024; depth = 0.009; depth/fertilisation = 0.023; fertilisation/depth = 0.034
Publisher’s Note: MDPI stays neutral with regard to jurisdictional claims in published maps and institutional affiliations.

