Article

Changes in Pisum sativum L. Plants and in Soil as a Result of Application of Selected Foliar Fertilizers and Biostimulators

by
Hanna Sulewska
1,
Alicja Niewiadomska
2,
Karolina Ratajczak
1,*,
Anna Budka
3,
Katarzyna Panasiewicz
1,
Agnieszka Faligowska
1,
Agnieszka Wolna-Maruwka
2 and
Leszek Dryjański
4
1
Department of Agronomy, Poznań University of Life Sciences, 11 Dojazd Str, 60-632 Poznań, Poland
2
Department of General and Environmental Microbiology, Poznan University of Life Sciences, 50 Szydłowska Str., 60-656 Poznań, Poland
3
Department of Mathematical and Statistical Methods, Poznan University of Life Sciences, 28 Wojska Polskiego Str., 60-637 Poznań, Poland
4
Agrii Poland Ltd., 233 Obornicka Str., 60-650 Poznań, Poland
*
Author to whom correspondence should be addressed.
Agronomy 2020, 10(10), 1558; https://doi.org/10.3390/agronomy10101558
Submission received: 14 September 2020 / Revised: 5 October 2020 / Accepted: 8 October 2020 / Published: 13 October 2020
(This article belongs to the Special Issue Site-Specific Nutrient Management)

Abstract

:
The aim of this study was to assess the effect of selected biostimulators and foliar fertilizers on plant development, plant yield, soil fertility and soil biochemical activity (dehydrogenases, phosphatases, catalases) during the cultivation of pea (Pisum sativum L.). A field experiment was conducted between 2016 and 2018 at the Gorzyń Experimental and Educational Station, Poznań University of Life Sciences in Poland. The following treatments were tested: (1) control; (2) Titanit; (3) Optysil; (4) Metalosate potassium; (5) Rooter; (6) Bolero Mo; (7) Adob Zn IDHA; (8) Adob B and (9) Adob 2.0 Mo. Adob Zn IDHA stimulated yields, especially under average moisture conditions and less so in drought conditions, and the differences compared to control amounted 8.36 and 4.3%, respectively. The results showed a close relationship between the effects of the biostimulators and foliar fertilizers and weather conditions during the study. It was not possible to determine whether any of the biostimulators or foliar fertilizers had a positive effect on pea seed yield in any year. Similarly, it was difficult to clearly determine the effect of the biostimulators and fertilizers on biochemical activity in the soil, although soil enzyme activity was influenced most by application of the Bolero Mo fertilizer. In all study years, biological nitrogen fixation was always greater after the application of a biostimulator/fertilizer treatment.

1. Introduction

The value of pea (Pisum sativum L.) as a crop can be assessed in two ways. Firstly, as the seeds contain 20–24% protein, they are a valuable food and feed source [1]. Secondly, the crop residues that remain in the field after cultivation favourably affect the physical, chemical and biochemical properties of the soil [2]. Currently, European Union (EU) rules for integrated plant cultivation and the so-called greening [3] are perfectly tailored for this species in respect to the above requirements. According to the Agriculture Restructuring and Modernization Agency (ARIMR), the area of pea cultivation in Poland was 56,164 ha in 2019.
For many years, the agricultural practice in EU countries, adapting to introduced directives, has been to use environmentally friendly technologies to reduce the use of pesticides and to eliminate their active substances in the environment [4]. Thus, it is increasingly difficult for producers to limit biotic plant stress, such as pests, disease and weed infestation.
In addition, climate change, especially the periods of drought that increasingly occur during the growing season, has created many problems for growers [5], although some solutions are available, e.g., improvement of water retention by increasing the proportion of organic matter in the soil, limiting (unproductive) evaporation from the soil with agrotechnical methods, as well as the use of biostimulators [6,7]. While many definitions exist, a biostimulator is generally defined as “any substance or microorganism applied to plants with the aim to enhance nutrition efficiency, abiotic stress tolerance and/or crop quality traits, regardless of its nutrient content” [8]. However, it should be noted that biostimulators are not fertilizers in the sense that they do not contain nutrients intended to be delivered to the plant. Nevertheless, they may facilitate nutrient acquisition, e.g., by mobilizing elements in the rhizosphere or by developing new routes of nutrient acquisition, such as fixation of atmospheric nitrogen through the recruitment of bacterial endosymbionts [8].
The use of biostimulators in the cultivation of various plant species, including Fabaceae, has been shown to have contradictory effects, with some studies reporting a beneficial effect [9,10], while others have shown no effect [8,11]. As such, it can be assumed that the variation in effects come not only from the composition of the individual products but also from the timing of the application and the time between application and the occurrence of biotic or abiotic stress [12,13].
The sustainability of the soil ecosystem can be evaluated with biologically-based indicators, and soil enzymes have been effectively utilized as indicators of soil quality across a range of farming systems [14]. Improved knowledge of how soil enzymes function, and the factors that influence activity is vital to enhance soil management and quality, and food production. Soil enzymes catalyze and expedite organic matter decomposition and regulate nutrient cycling, and can, therefore, be used as a biological index for soil quality. In practice, soil enzymes can be simply integrated, are easily quantified, and are much more sensitive to soil management changes (than other soil quality indicators). Their activities are influenced by a range of factors, e.g., soil depth, type, temperature, moisture content, pH level, quality and quantity of available substrates, and management regimes. However, the activity of an individual enzyme is not reflective of soil quality as single enzyme activities are not representative of the rate of all metabolic processes (except if they catalyze a single specific reaction). Therefore, to accurately determine the level of soil quality, a number of enzyme activities should be evaluated. Catalases and dehydrogenases are found in the soil as essential parts of complete living microbial cells. They can be used as a measure of general microbial activity in the soil and, therefore, can be employed to derive a biological indicator of fertility (BIF). As members of the oxidoreductases class, these enzymes fulfil the most important functions in the environment [15]. Hydrolases are another important group of soil enzymes and include phosphatases, which participate in the phosphorus cycle.
The vast availability of fertilizers and biostimulants leads to an independent assessment of their value in terms of plant-soil interaction. This is the reason of the aim of the study to determine the effect of selected biostimulators and foliar fertilizers on the development and yield of pea, and to evaluate the fertility and biochemical activity (dehydrogenases, phosphatases, catalases) of the soil that they are grown on.

2. Material and Methods

2.1. Experimental Design

Between 2016–2018, experiment was conducted each year at the Gorzyń Experimental and Educational Station, Poznań University of Life Sciences (N—52.56692, E—015.90933, 69 m AMSL) to assess plant reactions and soil microbiological changes after the application of selected biostimulators and foliar fertilizers during the cultivation of pea (‘Tarchalska’ variety). The experiment was a randomised block design with four replications and 36 plots (plot size 14 m × 1.5 m (21 m2)).
The research factor was the use of biostimulators or foliar fertilizers with 9 levels:
(1)
Control—plants were not treated with biostimulators or foliar fertilizers.
(2)
Titanit.
(3)
Optysil.
(4)
Metalosate potassium.
(5)
Rooter.
(6)
Bolero Mo.
(7)
Adob Zn IDHA.
(8)
Adob B.
(9)
Adob 2.0 Mo.
Each biostimulator and fertilizer was applied in a timely manner, according to the manufacturer’s recommendations (Table 1).
A chlorophyll fluorescence meter (OS5p, Opti-Sciences, Inc., Hudson, NY, USA) with a photosynthetic active radiation (PAR) clip was used to measure the following parameters: F0—minimum fluorescence, Fm—maximum fluorescence, Fv—variable fluorescence and Y—quantum yield of photosynthetic energy, which are necessary to calculate the maximum photochemical efficiency of photosystem II (Fv/Fm), according to the formula (Fv/Fm = Fm − F0/Fm). Settings for the fluorometer protocols were selected according to Sulewska et al. [16] as follows: modulation source: red; modulation intensity: 25; detector gain: 08; saturation flash intensity: 30; flash count: 001; flash rate: 255 (s). A chlorophyll meter CCM-200 was used to determine the Chlorophyll Content Index (CCI). Leaf Area Index (LAI) was determined with a SunScan Canopy Analysis System type SSI (Delta-T Devices, Cambridge, UK). The agrotechnical and cultivation treatments were carried out in accordance with the principles of good agricultural and experimental practice for this species [17]. Agrotechnical treatments and the dates of their implementation in the individual years of the study are presented in Table 2.
We used the white-flowered pea variety ‘Tarchalska’ from Danko (Poland). According to the FAO/WRB classification, the soil at the study site was classified as a typical luvisol soil formed from light loamy sands, deposited in a shallow layer on light loam (Haplic Luvisols) [18]. Potassium, manganese, copper and iron contents were average; phosphorus, magnesium, boron and zinc contents were high; and molybdenum content was very low (Table 3). Soil pH was 6.5, which indicates that the soil was slightly acidic, and humus content was also low.

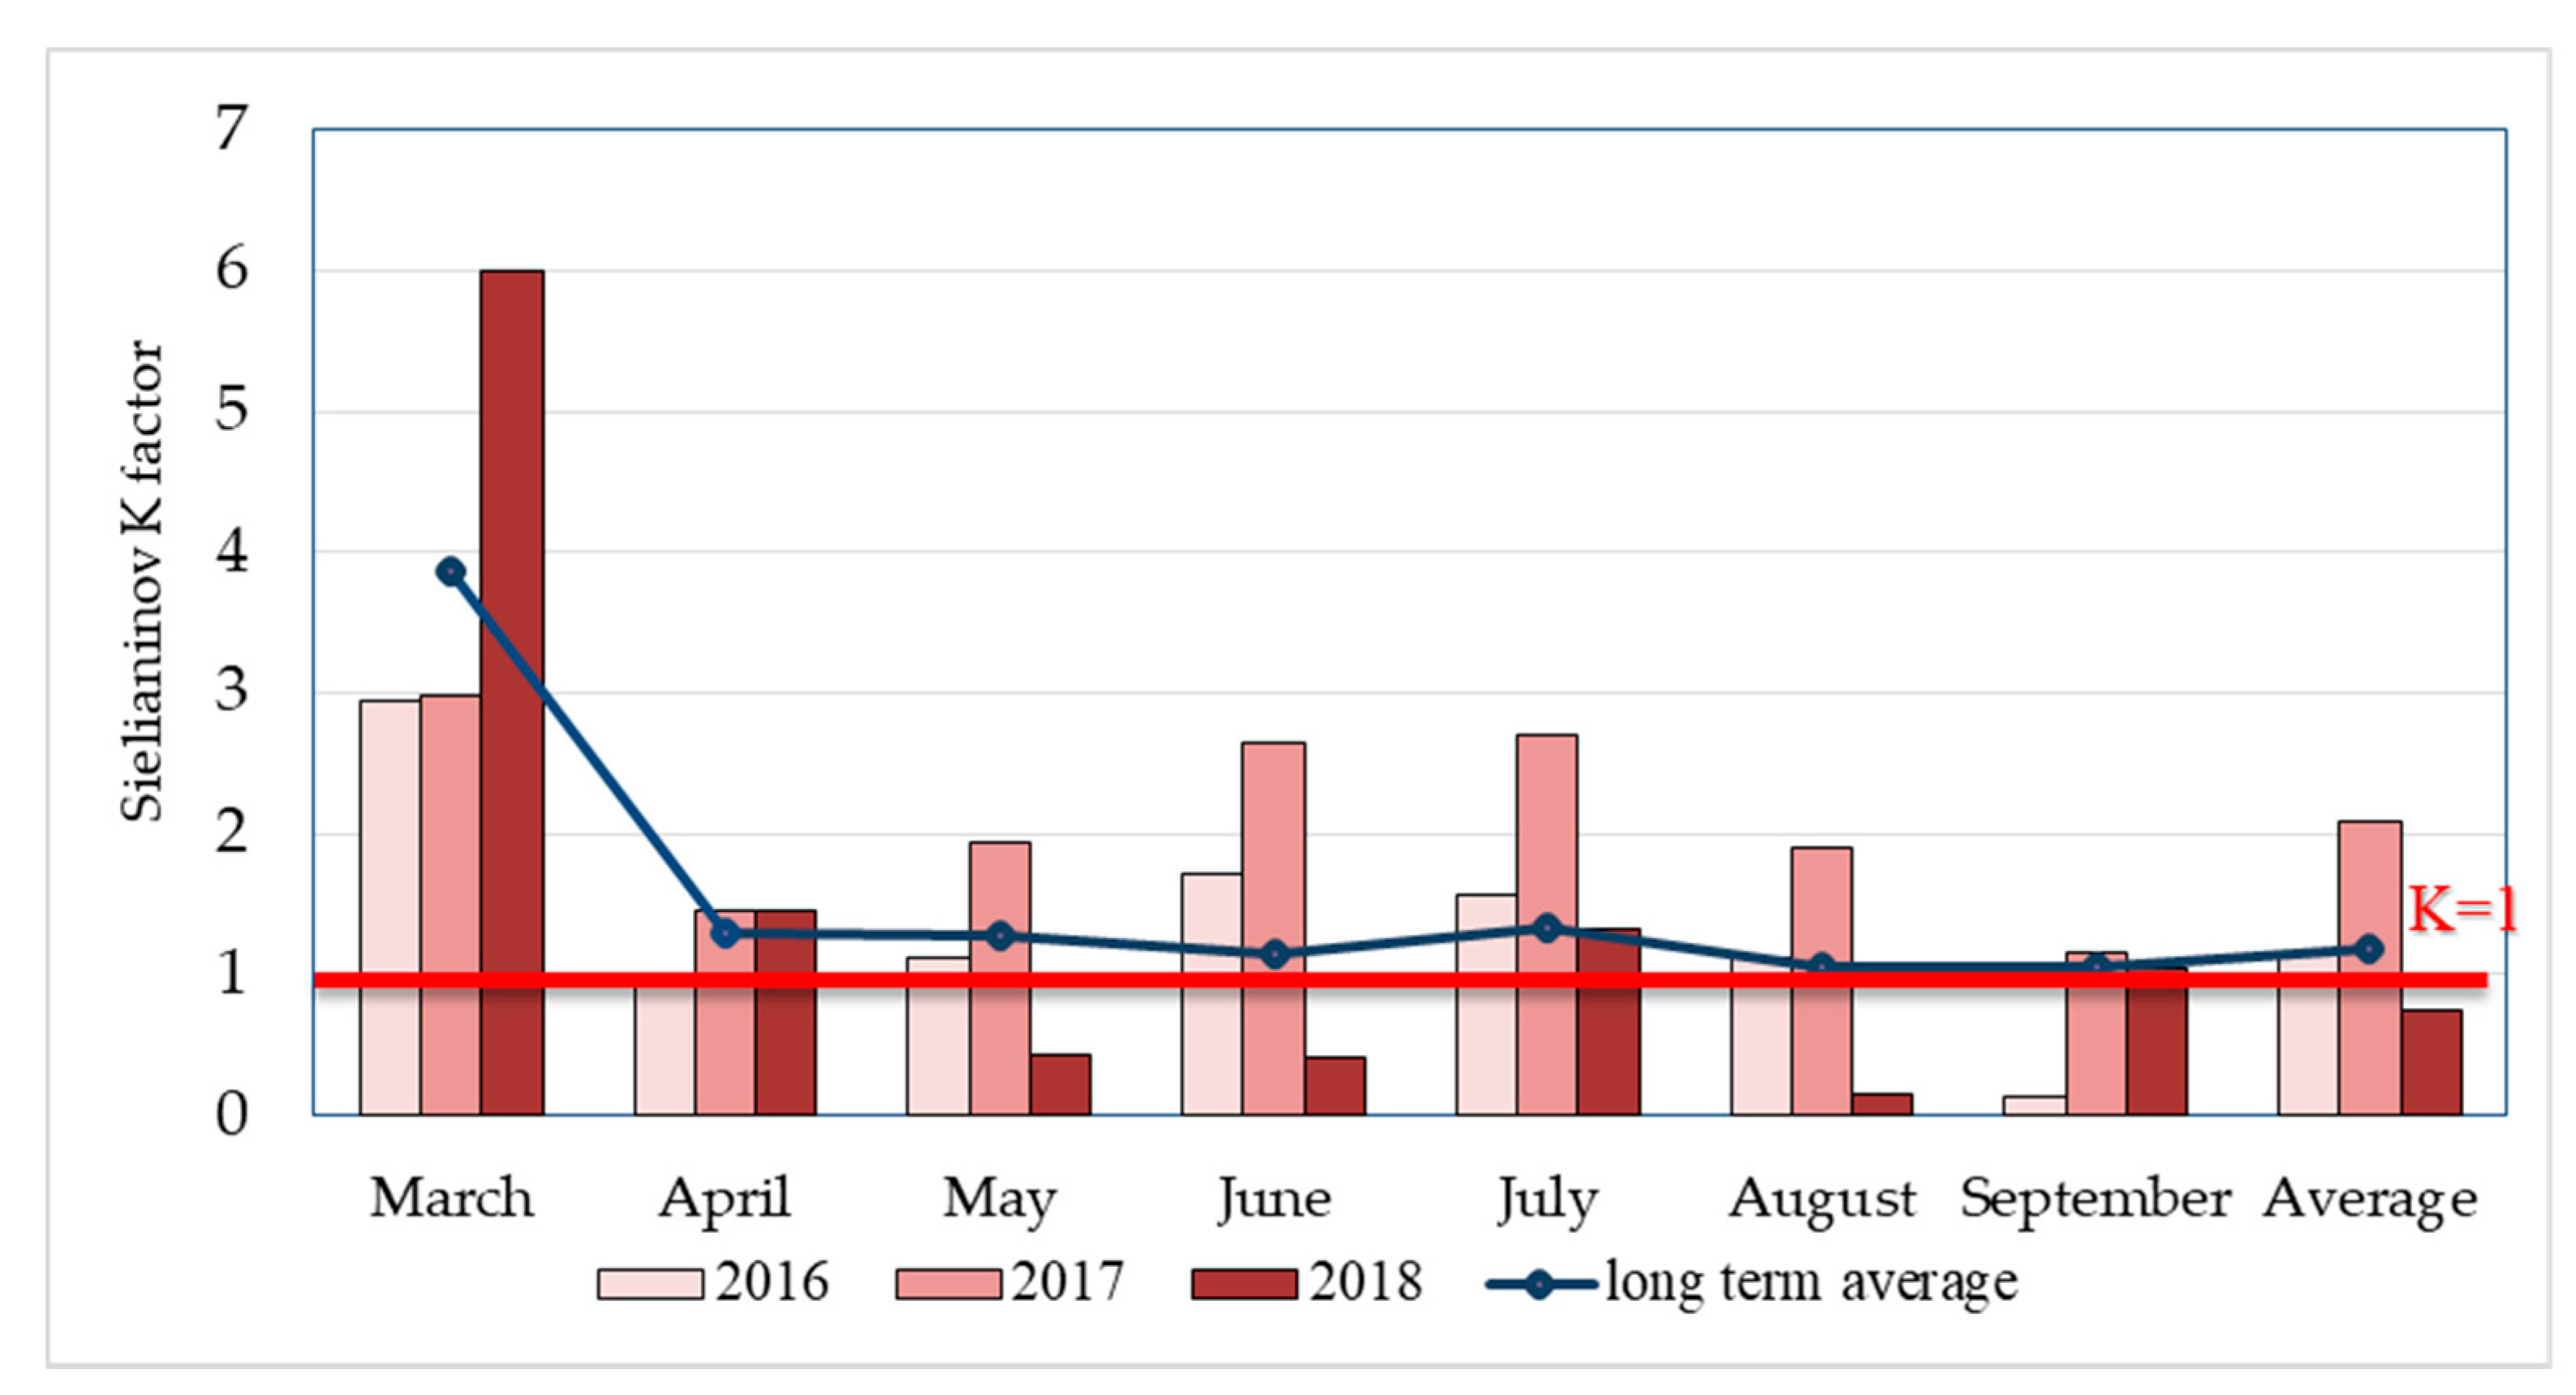
2.2. Weather Conditions

Weather conditions during the growing seasons (2016–2018) are presented using the hydrothermal index, according to Sielianinov [19] (Figure 1). Variability in weather conditions during the study was reflected in the index values. Low index values (multi-year average) were recorded in March 2016 and 2017, April 2016, 2017 and 2018, May 2016 and 2018, June and July 2018, August 2018 and September 2016 and 2018. More favourable moisture conditions during the growing season were observed in 2016 and 2017, compared to the much drier 2018 growing season (May: K = 0.43, June: K = 0.41).
At the commencement of the flowering phase, the level of diazotrophy (as expressed by nitrogenase activity) was measured with the acetylene-ethylene reduction (ARA) method [20]. Five plants were randomly selected from the experimental treatment plots and were placed into tightly sealed 2000 mL vials. To achieve a 10% (v/v) acetylene concentration in the gas phase (air), purified acetylene (C2H4) was then injected into each vial. After one hour, 1 mL of gas was withdrawn and stored in small glass vials (each vial sealed with a rubber septum and aluminum seal). Ethylene concentration was quantified using a gas chromatograph CHROM 5 (Laboratorni Přistroje, Praha, Czech Republic). Dinitrogenase activity was quantified as the amount of acetylene reduced to ethylene (expressed as nMC2H4 plant−1 h−1) and is presented here as the average value of five replications (from each measurement).

2.3. Soil Sampling for Biochemical Analysis

The soil samples that were collected from the upper 0–20 cm layer were used for biochemical analyzes. During the study period, the samples were collected at four terms during each growing season: 1st term—plant emergence (BBCH 5–10), 2nd term—full plant growth (BBCH 35–40), 3rd term—plant inflorescence (BBCH 51–59), 4th term—after harvest.
Soil samples were collected from 5 locations in each experimental plot (in four replications for each of the nine treatments). In total, 36 soil samples (weight per sample: 1 kg) were collected.

2.4. Soil Enzymatic Activity

Soil enzyme activity in the treatments was measured as follows:
Dehydrogenases (EC 1.1.1.)—with 1% TTC (triphenyltetrazolium chloride) as a substrate after 24-h incubation at 30 °C, at a wavelength of 485 nm, expressed as μmol triphenylformazan (TPF) 24 h−1 g−1dm of soil; colorimetry measurements [21];
Acid and alkaline phosphatase (EC 3.1.3.2)—with sodium p-nitrophenyl phosphate as a substrate after 1-h incubation at 37 °C, at a wavelength of 400 nm; expressed as μmol para-nitrophenol (PNP) h−1 g−1dm of soil (Novospac spectrophotometer); spectrophotometry measurements [22];
Catalase (EC 1.11.1.6)—with 0.3% hydrogen peroxide as a substrate after 20 min incubation at room temperature (about 20 °C); titrated with 0.02 M potassium permanganate until its colour was light pink; expressed as μmol H2O2 min−1 g−1dm of soil; manometrically measurements [23].

2.5. Biological Index of Fertility (BIF)

BIF was determined by employing dehydrogenase activity (DHA) and catalase activity (CAT) [24] using the formula: (DHA + kCAT)/2, where k is the proportionality factor (= 0.01).

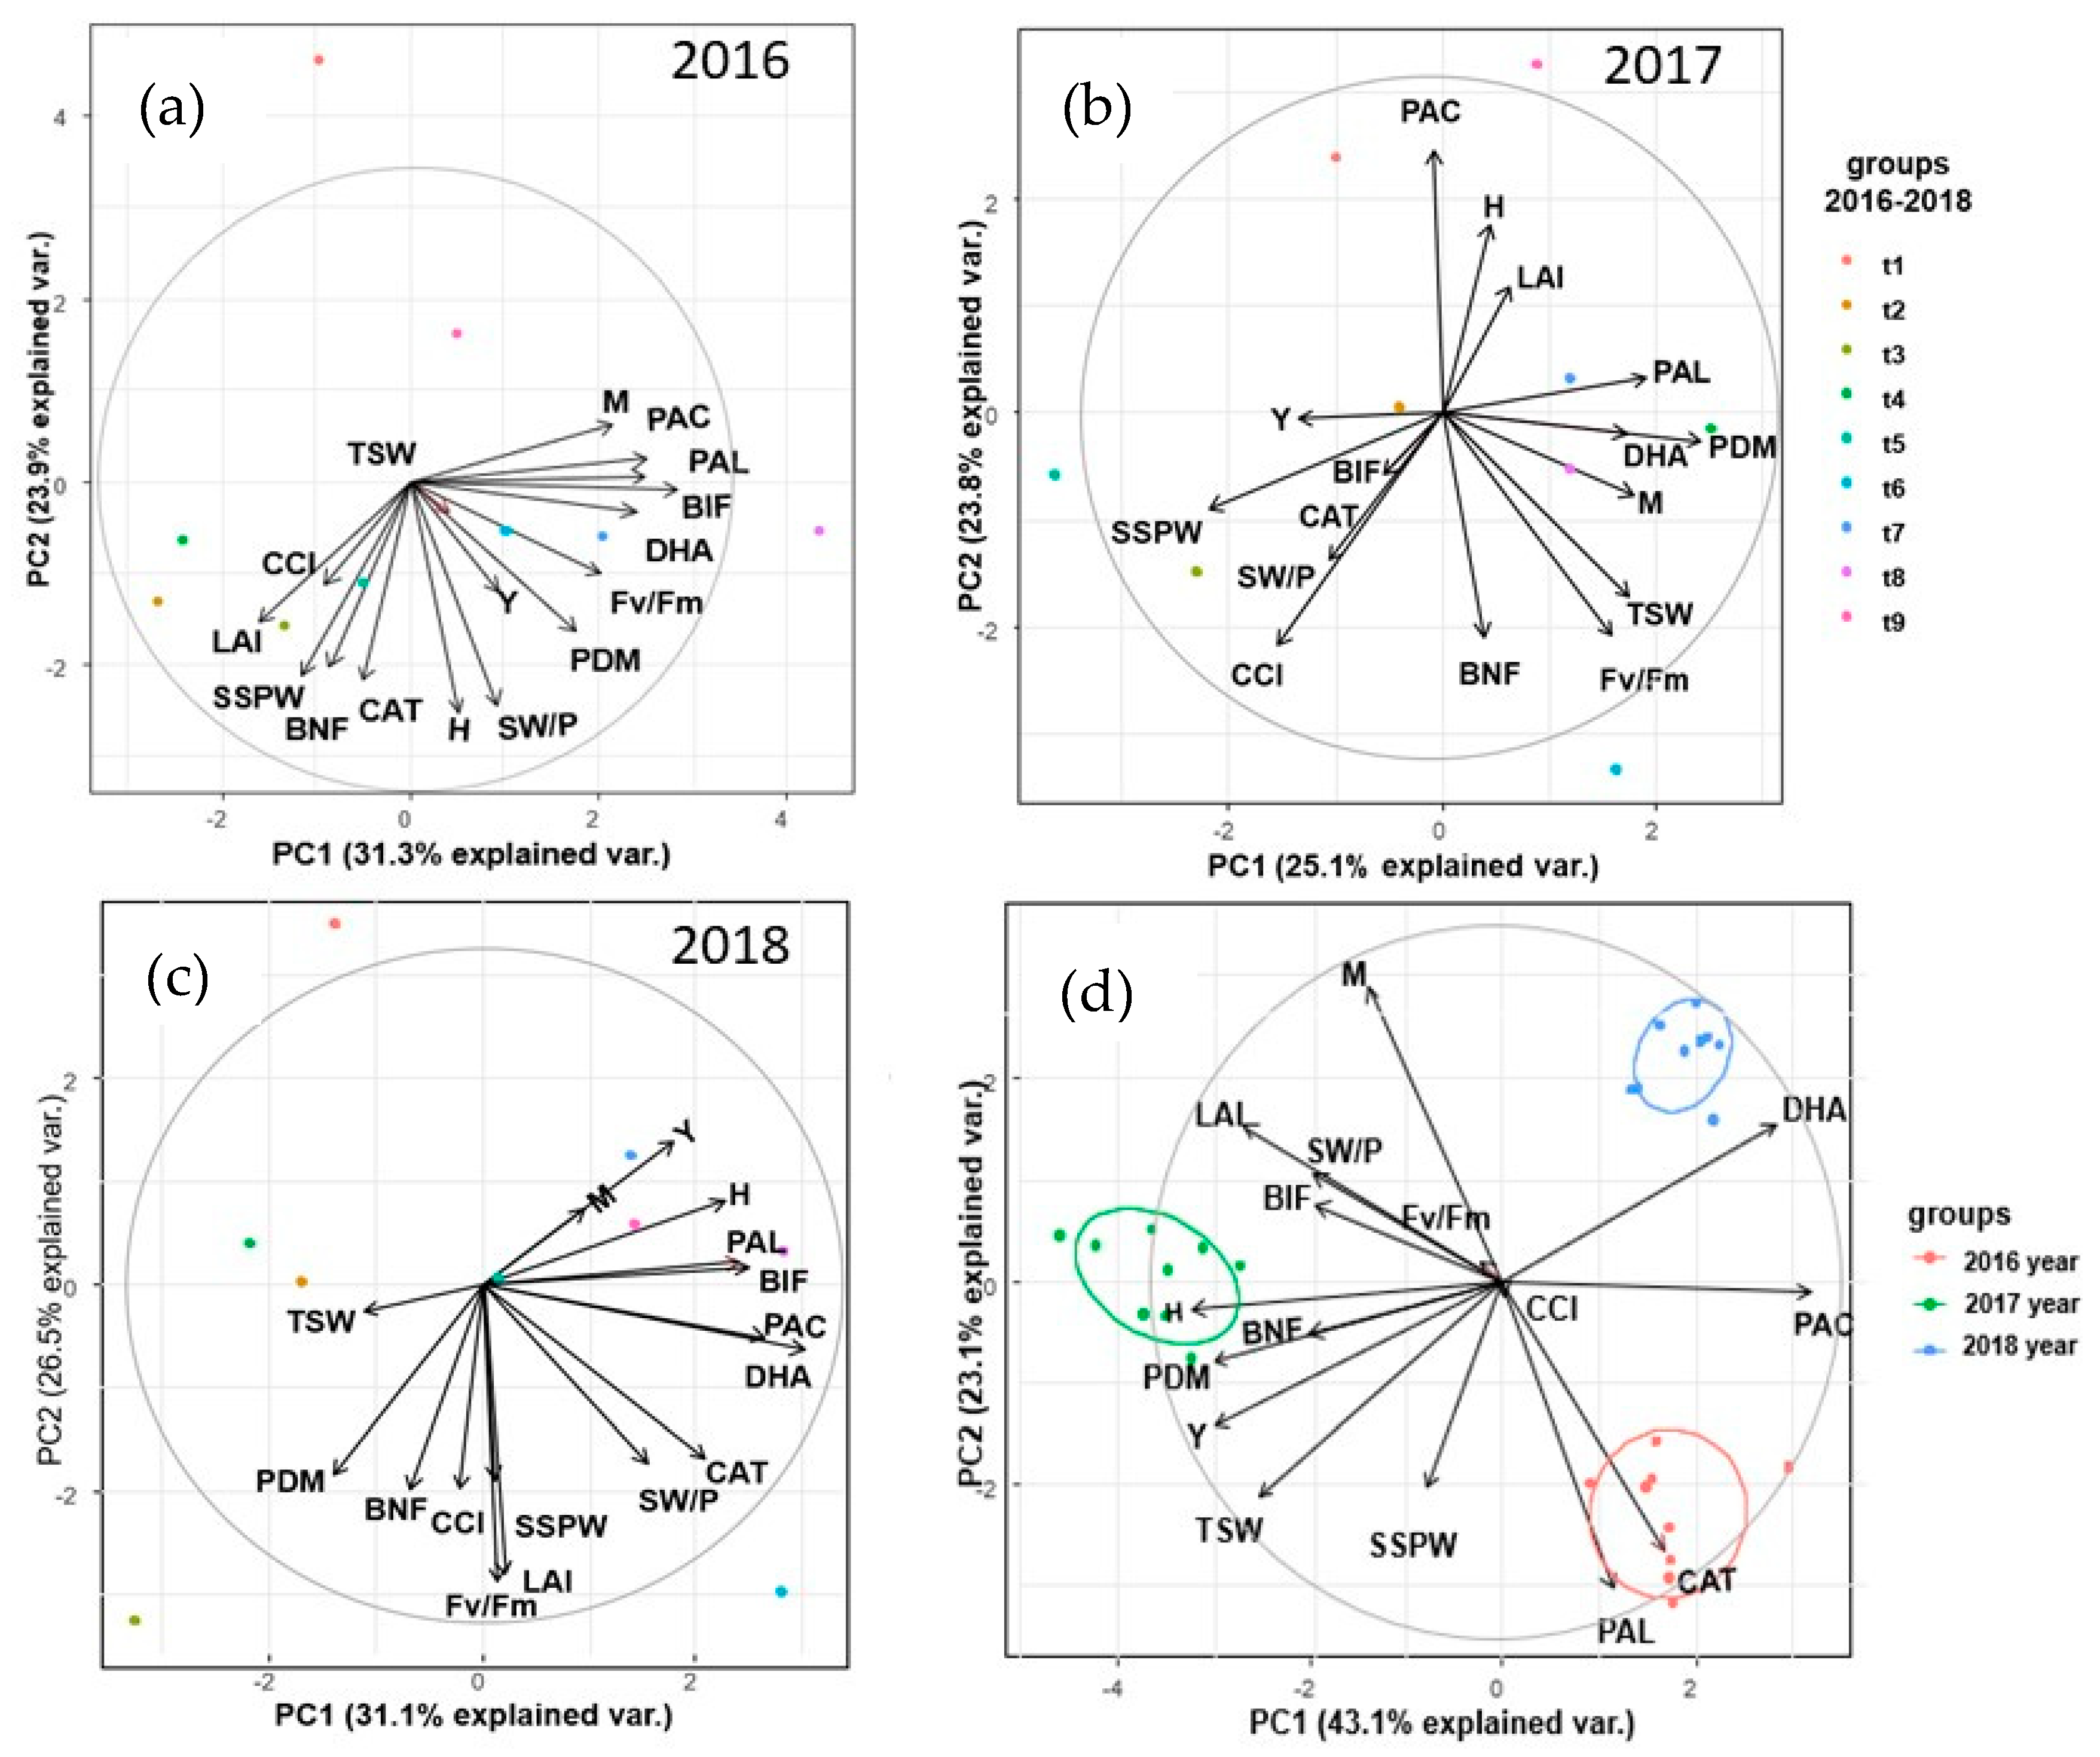
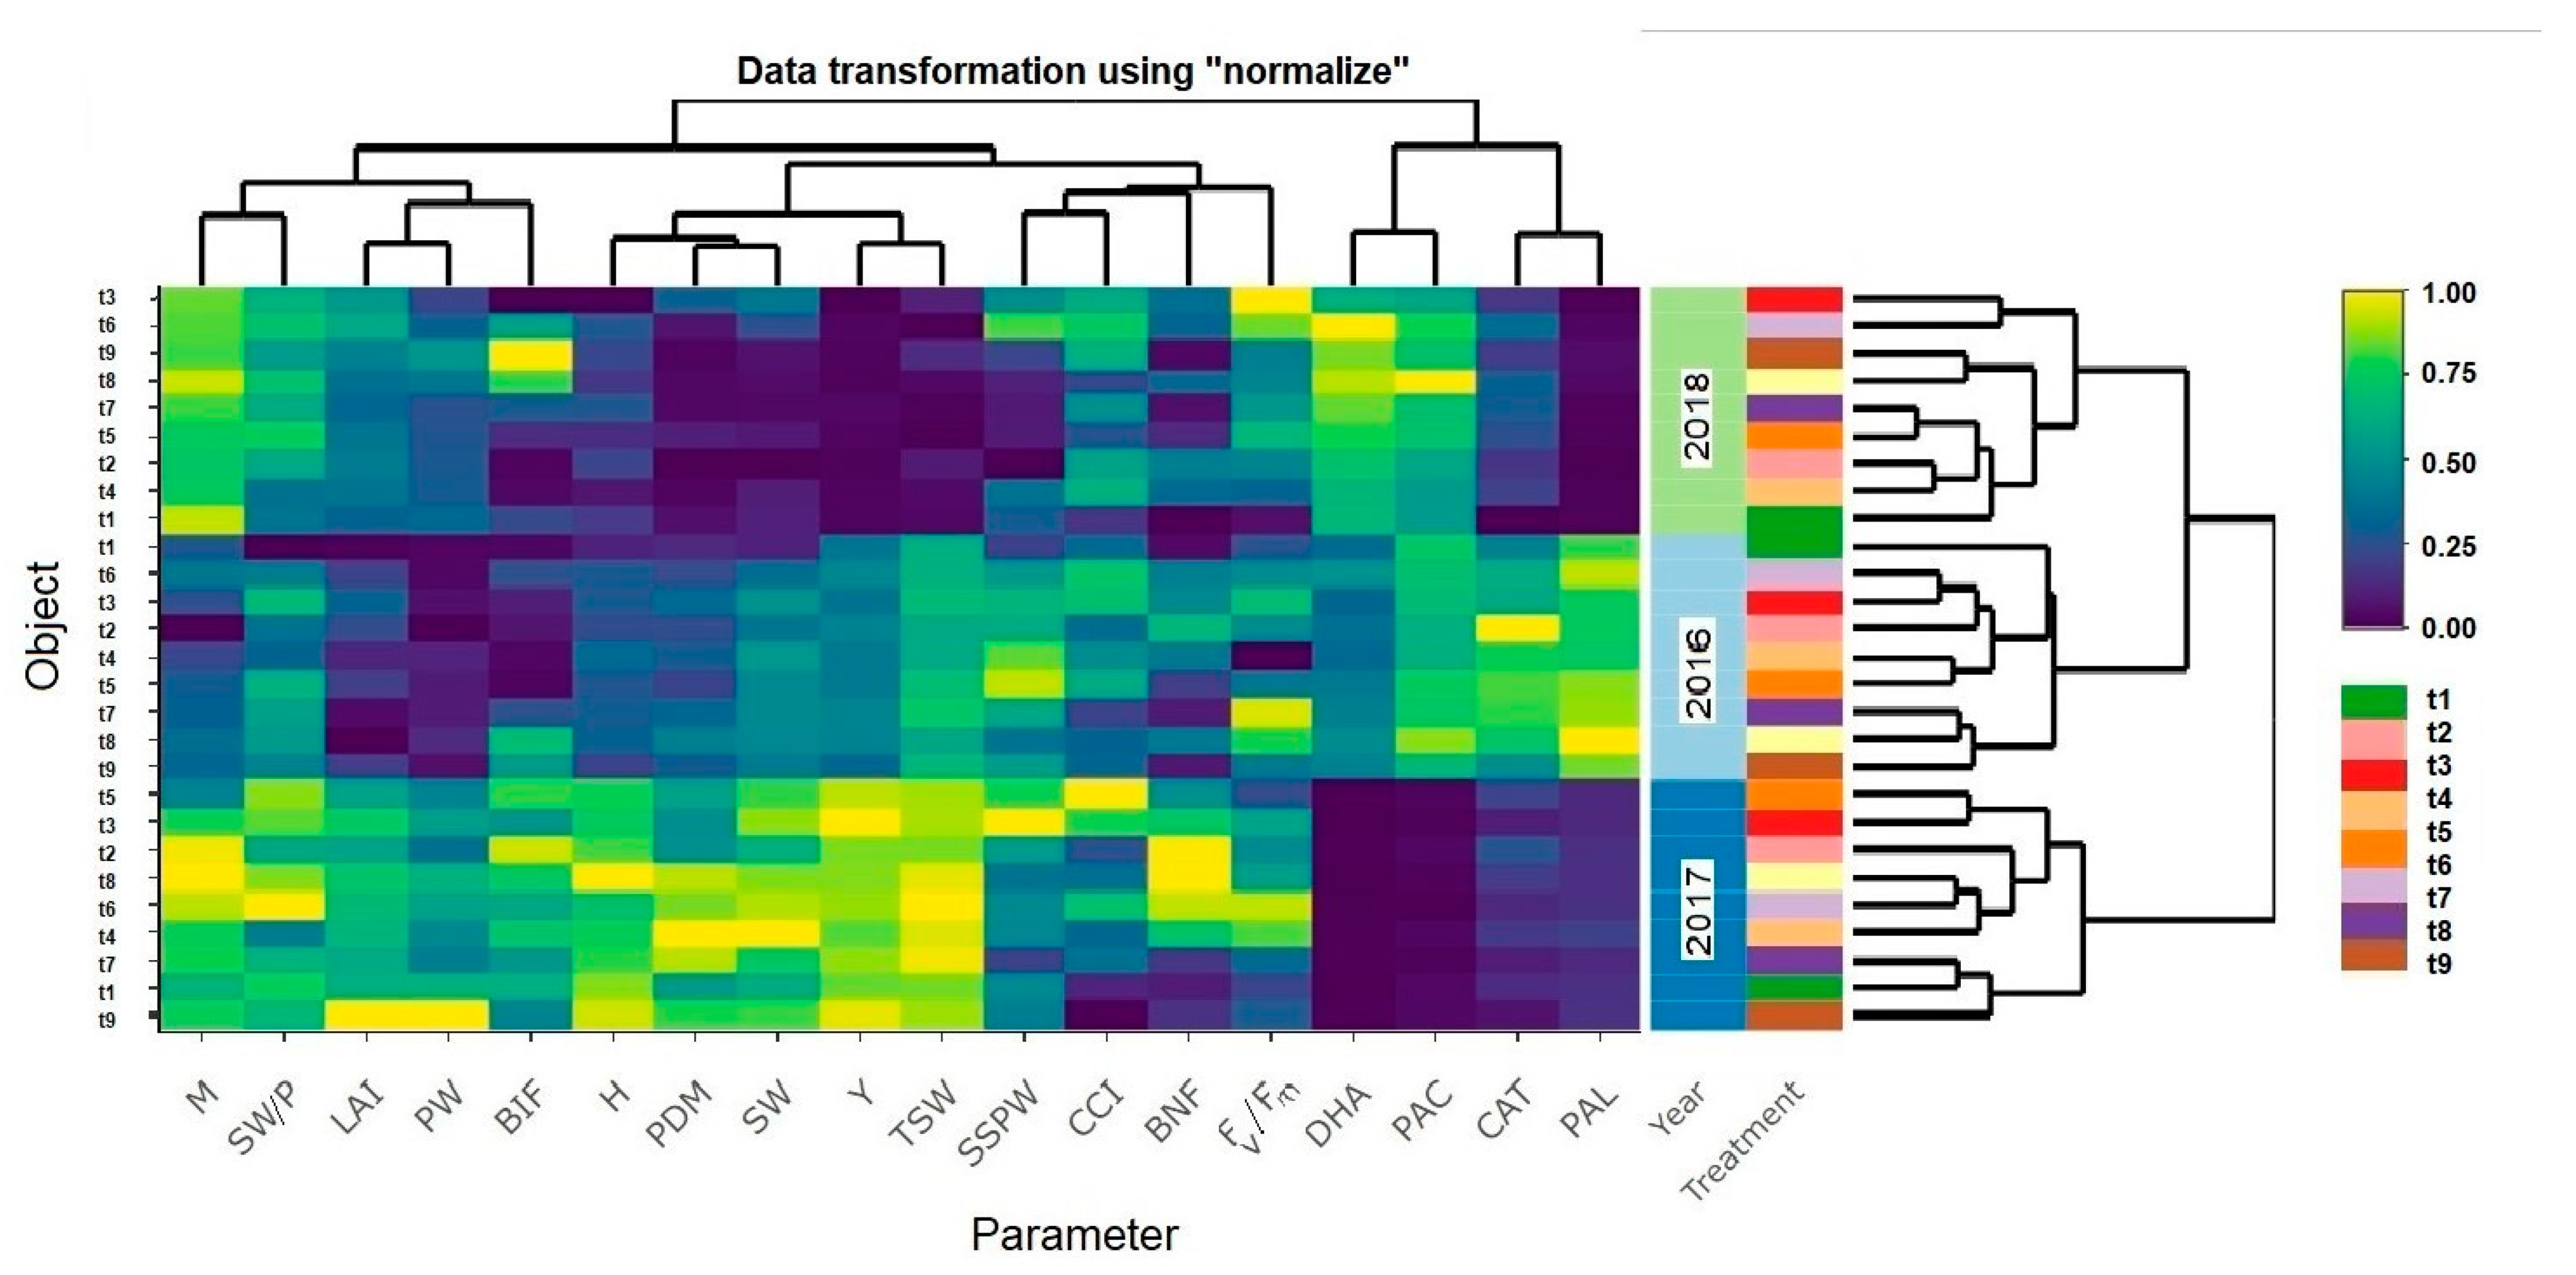
2.6. Statistical Analyses

R and Statistica 12.0 (StatSoft Inc., Poland, Krakow) software packages were used for all statistical analyses. The effects of the experimental factor (biostimulant/fertilizer), and the development phase term (based on the BBCH scale) on enzymatic activity in the soil were tested with three-way ANOVA (Tables S1–S5). Nitrogenase activity and agronomic parameters were tested using two-way ANOVA (Tables S6–S16). Homogeneous subsets of mean were identified by means of Duncan’s test, at a significance level of α = 0.05.
As year was a variable, we used soil biochemical activity parameters (model 1) and agronomic parameters, together with biological nitrogen fixation (BNF) (model 2) ANOVA mixed models. The impact of two or three explanatory variables on the response variable, respectively, was assessed. In both cases, the following models were used:
y i j k l = μ + α i + β j + γ k + ( β γ ) j k + ( α β ) i j + ( α γ ) i k + ( α β γ ) i j k + e i j k l ( model   1 )
y i k l = μ + α i + γ k + ( α γ ) i k + e i k l ( model   2 )
where: µ—is the overall average value,   α i —is the effect of the operation of the random factor of year at level i (i = 1, 2, 3), β j —is the effect of the action of the fixed factor term at level j (= 1, 2 …, 4), γ k —is the effect of the fixed fertilization factor at level j (= 1, 2 …, 9 j (= 1, 2 …, 9), with appropriate interactions of these factors, and e i j k l —is the residual error.
In cases where the interaction of year with the other factors was significant, an analysis was carried out for each year separately. To estimate the cause-and-effect relationship between the studied soil biochemical activity parameters and agronomic parameters, principal component analysis (PCA) was used for each year separately, as well as for combined years. PCA was performed with the use of an appropriately scaled correlation matrix. PCA analysis was used to demonstrate the similarities between independent variables and determines the components that are a linear combination of the variables considered. Accurate analysis of the principal components allows the identification of the initial variables that are the reference system for the remaining variables.
A heat map (using the heatmaply function in R), was proposed as a graphical presentation of appropriately transformed data of soil biochemical activity parameters, agronomic parameters, and biological nitrogen fixation (BNF). Data transformation using ‘normalise’ was used to compare and group different data.
Fertilization data were represented by colours. Cluster analysis allowed for the grouping of both soil biochemical activity and agronomic parameters after the application of biostimulators, and the effect of the fertilizers/biostimulators so that the degree of connection between the applied fertilization treatments within one group was the largest, while the degree of connection between groups was the smallest.
Grouping of tree diagrams was obtained by using the Ward Hierarchical Clustering method and the Euclidean distance measurement.

3. Results

3.1. Yield, Biometric and Physiological Traits of the Pea Plants

The effects of the biostimulators and foliar fertilizers on the pea plants were variable between years and depended on weather conditions (Table 4). In 2016, which was characterized by average precipitation levels during the growing season, the greatest increase in yield (compared to the control) was observed after application of Bolero Mo or Adob Zn IDHA and amounted to 0.36 and 0.28 t ha−1, respectively. In 2017, which was characterized by good water availability throughout the entire growing season, a significant increase in seed yield (compared to the control) was observed after the application of Rooter, Adob 2.0 Mo, and Optysil, and amounted to 0.39, 0.62 and 0.80 t ha−1 respectively. In 2018, which was characterized by very poor water supply during the critical period for pea development, seed yields were very low. In the event of drought stress, none of the tested biostimulators and fertilizers contributed to a significant increase in yield (Table 4).
Features such as seed moisture content at harvest (Table 5), pod weight per plant and seed weight in one pod were affected more by weather conditions during the study period than by the application of biostimulators and fertilizers. A significant reduction or increase (compared to the control) in the values of these features was not found across years as a result of the use of a biostimulator or foliar fertilizer, therefore, tables with these results are not included in the paper.
Similarly, the 1000 seed weight changed more strongly under the influence of weather conditions during the study period than from the treatments (Table 6). In 2016, a significantly higher 1000 seed weight value was observed after the pea crop was fertilized with Adob Zn IDHA, with an increase in yield of 11.5 g (compared to the control). In 2017, the increase in yield was 18.1 g, after application of Bolero Mo, while no differences were observed between treatments in the drier 2018.
In 2016, seed weight per plant was significantly greater than in the control treatment after the application of Metalosate Potassium, Optysil and Rooter. In the drier 2018, seed weight per plant was significantly greater after the application of Bolero Mo and Optysil, while in 2017, when the plants were supplied with sufficient water, seed weight per plant increased after application of the treatments, although none were statistically significant (Table 7).
The share of seed in whole plant weight changed significantly under the influence of the biostimulators and fertilizers in two (2017 and 2018) of the three years (Table 8). In the wetter 2017, no differences were found after the application of any of the treatments (compared to the control), while in the drier 2018, a significant increase of 20.2 percentage points occurred only after the application of Bolero Mo. Plant height was another feature that changed more between years than from the influence of the treatments (Table 9). A significant increase in plant height was only found in 2016, which followed the application of Adob Zn IDHA, Adob B, and Metalosate potassium, and was 10.3, 10.8 and 13.5 cm respectively. Plant dry mass was significantly greater in 2016 after Adob B application, in 2017 after Adob Zn IDHA application, Adob B, and Metalosate potassium applications, and in the drier 2018 after spraying with Optysil (Table 10).
Application of biostimulators and foliar fertilizers significantly changed the CCI (Table 11). In 2016 and 2017, the Rooter, Optysil and Bolero Mo treatments significantly stimulated CCI compared to the control treatment, while in the drier conditions of 2018, the application of all treatments, except Rooter and Adob B, significantly increased the CCI value. It should also be noted that the CCI was slightly modified by the weather conditions between years.
Chlorophyll fluorescence (Fv/Fm parameter) describes the physiological state of a plant and provides a measure of its stress level. In the measurements carried out at the beginning of the maturation phase (BBCH 78) in 2016, plants fertilized with Adob Zn IDHA or Adob B were in a significantly better condition than the control plants. In 2017, plants fertilised with Bolero Mo or Metalosate potassium or were also less stressed, as were the plants that received an application of Optysil, Rooter or Bolero Mo in 2018 (Table 12).
The LAI value was also significantly modified following the application of the biostimulators and fertilizers, and also differed between years, with the highest values observed in 2017 (Table 13), which was characterized by good water availability throughout the entire growing season. The use of Optysil and Adob 2.0 Mo in each of the years of the study significantly increased the LAI value compared to the control. In 2016, the use of all treatments, with the exception of Adob Zn, IDHA and Adob B, resulted in significantly increased LAI values compared to the control, and the largest increase in LAI in the study was observed after application of Optysil. In 2017, Adob 2.0 Mo performed even better than Optysil.
The two-way analysis of variance showed that the application of foliar fertilization/bio-stimulants had a significant influence on enzymatic activity and on BIF values. Only the term of the study (development phase, based on BBCH scale) had a highly significant influence on enzymatic activity and on BIF. Two-way analysis of variance showed that the application of foliar fertilization/bio-stimulants had a significant influence on nitrogenase activity.

3.2. Biological Nitrogen Fixation

Field analyses of BNF showed that the fertilizer and biostimulant applications significantly enhanced nitrogenase activity during pea cultivation (Table 14). In all the treatments, nitrogenase exhibited higher activity than in the control. During the study period, greatest BNF activity was recorded in 2017, while the greatest nitrogenase activity was noted after the application of Tytanit, when the activity of the enzyme was five times higher than in 2016 and 2018, and six times higher in 2017 than in the control plot. Apart from the control treatment, the lowest BNF value was noted after the application of Adob 2.0 Mo.

3.3. Soil Enzymatic Activity

Soil enzymatic activity analysis, which was closely related to the plant development phase (BBCH) significantly influenced the level of dehydrogenase activity in the soil. In all study years, the lowest value was recorded during the emergence of the plants, while the greatest value was observed at the beginning of the flowering phase (Table 15).
In addition, the greatest dehydrogenase activity was observed in all years after Bolero Mo application (compared to the control). In contrast, the lowest value was noted after the application of Optysil foliar fertilizer in 2016 and 2018, as well as in 2017 after the application of the Rooter biostimulator. It was also observed across all study years that, dehydrogenase activity was always greater after the application of the treatments (compared to the control) in the second term of the analysis, when the plants were in full vegetation phase. Similar relationships were also observed during the flowering period for most treatments, however, reduced activity was noted after the application of Optysil in 2016, Adob B in 2017, and Optysil, Metalosate potassium or Adob Zn IDHA in 2018.
Analyses of acid phosphatase activity showed that the function of this enzyme was also closely related to the developmental phase of the plant, and its greatest activity was observed during the third term of analysis; at the beginning of the flowering phase in 2016 and 2018 (Table 16). At this time, a greater level of enzyme activity was only observed (compared to the control) after the application of Adob B foliar fertilizer. In 2017, the greatest values were recorded after the application of Metalosate potassium during the second term of analyses (the development phase BBCH 35–40). It should be noted that the lower level of activity of phosphatase (compared to the control) at the beginning of the flowering phase (i.e., when demand for phosphorus is greatest) was observed after the application of most of the treatments, Specifically, the lowest activity level was observed after the application of the Bolero Mo biostimulator in 2016 and 2017, and the foliar fertilizer Adob Zn IDHA in 2018.
The greatest alkaline phosphatase activity level was observed in 2016 (Table 17). Similar relationships were observed as with acid phosphatase. In 2016 and 2018, the greatest activity was also noted at the beginning of the flowering phase (BBCH 59), while the greatest activity in 2017 was observed during the BBCH 35–40 phase.
The lowest level of activity occurred during the emergence of the plants (BBCH 5–10). In both 2016 and 2018, the highest phosphatase activity level was observed after the application of Adob B fertilizer; 3.299 and 0.225 μmol PNP h−1 g−1dm of soil, respectively, while in 2017 the greatest value was observed after the application of Metalosate potassium; 0.485 μmol PNP h−1 g−1dm of soil (Table 17).
The greatest catalase enzyme activity value was also recorded in 2016 and 2018 at the beginning of flowering phase. In 2017, the highest metabolic activity occurred in the period after plant harvest (Table 18). The biostimulators and foliar fertilizers used in most of the experimental treatments stimulated the level of catalase activity in relation to the control treatment. The highest level of catalase enzyme activity was recorded after the application of the Tytanit biostimulator in 2016, and after the application of the Adob B foliar fertilizer in 2018. In 2017, the greatest activity was observed after the applications of Tytanit and Bolero Mo (Table 18).
The BIF value was determined based on dehydrogenase and catalase activity. A high value was observed during the flowering phase of the plants compared to the emergence phase, in all experimental treatments. However, the highest level was recorded in 2016 and 2017 after the harvest of the plants; 33.907 and 33.306, respectively (Table 19). In 2018, the highest BIF value was 55.813 and was observed at the beginning of the flowering phase.
Principal Component Analysis (PCA) in Figure 2a–c shows that the applied biostimulators/fertilizers differed in their influence on the agronomic and microbiological parameters in individual years. Figure 2d illustrates the influence of all the factors under analysis (treatment) on the indicators in a given year. In 2016 all the treatments applied in the experiment had strong positive influence on the activity of catalase (CAT) and alkaline phosphatase (PAL), as compared with the other parameters. In 2017 the biostimulants/fertilizers significantly influenced the BNF, H, PDN, Y and BIF, whereas in 2018 they influenced only the dehydrogenase activity (DHA). PCA explained a significant part of the variability in each study year, and also over the three-year study period. In 2016, approximately 60% of the total variability was explained by the first two principal components (Axis 1: 30.4%, Axis 2: 28.5%) (Figure 2a). It was observed that, to a greater or lesser extent, each of the biostimulators/fertilizer treatments affected the studied parameters (Figure 2a). In addition, there was a strong correlation between the basic soil biochemical parameters studied here [dehydrogenase activity (DHA), alkaline phosphatase activity (PAL), biological index fertilizer BIF, acid phosphatase activity (PAC) and soil moisture (M), and the strong effect of the applied Adob B (t8) on the parameters indicated above. In turn, BNF was closely correlated with catalase activity (CAT), LAI and share of seed in whole plant weight (SSPW). In 2016, the foliar fertilizers Optysil (t3) and Metalosate Potassium (t4), and the Rooter biostimulator (t5) had the greatest impact on the above-mentioned parameters.
In 2017, PCA explained approximately 50% of the variation (Axis 1: 25%, Axis 2: 24.4%) (Figure 2b). A strong relationship between BIF, catalase activity and share of seed in whole plant weight (SSPW) was noted. The level of activity of these parameters was influenced by the Tytanit and Rooter biostimulators. In 2017, a strong relationship was also observed between biochemical soil activity parameters and agronomic parameters, such as plant dry mass (PDM), seed weight per plant (SW), seed moisture (M) and the physiological parameter Fv/Fm.
In 2018, as in 2016, all tested parameters were more or less affected by the applied foliar fertilizer and biostimulator treatments. In that year, PCA explained almost 60% of the total variability (Axis 1: 31.4%, Axis 2: 26%) (Figure 2c). The studied biochemical soil parameters (DHA, PAL, PAC, BIF) were closely correlated with each other. The most important influence on soil metabolism was the application of Bolero B (t6), Adob B and Adob 2.0 Mo fertilizers. In turn, Adob Zn IDHA and Adob 2.0 Mo. foliar fertilizers influenced agronomic parameters, such as yield (Y) and seed moisture (M).
PCA for each pea fertilization treatment in all the study years is shown in Figure 2d, and highlights the differentiated effect of the applied fertilizers/biostimulator treatments on the tested soil biochemical and agronomic parameters during the study period. In 2018, regardless of the fertilization treatment, a high level of dehydrogenase activity was observed, while in 2016, a high level of phosphatase and catalase activity was observed.
The heat map and dendrogram presented in Figure 3 illustrates the large variation in activity level of the studied parameters and clearly demonstrates the correlation between the biochemical soil activity parameters and the examined agronomic parameters. Taking into account all the parameters tested in the study, the effect of the fertilizers/biostimulators was similar in 2016 and 2018, but differed in 2017. The research conducted in 2017 indicated that the fertilizer/biostimulator treatments had a stimulating effect on plant yield at low soil enzymatic activity (catalase, phosphatase, dehydrogenase). Only BIF, based on the level of metabolic activity of dehydrogenase and catalase, and BNF were highest in 2017. Different relationships were observed in 2016 and 2018, where a correspondingly higher level of biochemical activity in the soil was observed, and agronomic parameters exhibited lower values.
Regardless of the study year, the heat map indicates similar relationships between the soil biochemical activity parameters and the agronomic parameters. Soil fertility index (BIF) was correlated with pod weight per plant (PW) and LAI, as well as with seed weight in one pod (SW/P). In turn, yield (Y) was correlated with 1000 seed weight (TSW) and plant height (H), and BNF was correlated with the share of seed in whole plant weight (SSPW), CCI, and Fv/Fm. Lastly, phosphatase activity was correlated with catalase, dehydrogenase and acid phosphatase activity.

4. Discussion

4.1. Yield, Biometric and Physiological Traits

In this study, the yields of the ‘Tarchalska’ variety were higher in 2017, and lower in 2016 and 2018 than yields in the official Research Centre for Testing Plant Varieties and Registration (COBORU) trials [25], which in 2016, 2017 and 2018 amounted to 3.69, 4.93 and 3.00 t ha−1, respectively.
The effectiveness of biostimulators and foliar fertilizers was closely related to weather conditions, because the different treatments significantly stimulated pea yield each year. Only the Adob Zn IDHA fertilizer increased pea seed yield in two out of the three study years; by 9.1% in 2016, and by 4.5% in 2018.
In 2016, the application of chelated zinc in the Adob Zn IDHA fertilizer increased 1000 seed weight and plant height, and reduced stress in the plants (as expressed by the Fv/Fm parameter). With an ample water supply in 2017, the effect of its action was to increase plant dry mass, but in the drier 2018 it only affected CCI. Zinc is taken up by a plant in small amounts and according to Stevenson and Cole [26] there are 27 to 150 mg of Zn kg−1 biomass in healthy plants. It participates in all major functions in the plant and is the microelement that most limits crop yield [27,28].
Indeed, Niewiadomska et al. [29] noted an increase in white lupin yield by 13.0% after the application of Adob Zn IDHA. Our results are partly consistent with the findings of Raj and Raj [30] regarding the beneficial effects of Zn on yield, physiological parameters, plant height in legumes, and with other research that showed a slight increase in yield after application of this fertilizer [31,32]. In addition, foliar spraying of Zn on Vigna sinensis [33] and Celosia [34] plants was shown to cause a significant increase in chlorophyll content. Also, El-Sallami and Gad [35] found that foliar spraying of zinc on plants of the Asteraceae family increased plant height, the number of leaves, and fresh and dry matter, which was partially confirmed by our own research. Mostafi et al. [36] also reported that the greatest 1000 seed weight value for soybean seeds was recorded after spraying with a zinc-iron mixture. Gomaa [37] also observed the stimulating effects of boron or zinc on plant growth.
In our study, pea seed yield in 2016 (a year with average weather conditions for the region) increased by 11.7%, after using the fertilizer containing boron and molybdenum (Bolero Mo), by 8.8% after application of Titanit and by 8.5% after application of Adob B (compared to the control). In turn, the molybdenum contained in Adob Mo stimulated yield in the wetter 2017. In earlier studies on white lupin, the application of boron with molybdenum (Bolero Mo), and also molybdenum alone (Adob 2.0 Mo) did not affect the seed yield [29], although, as in our study, it clearly stimulated LAI.
In the above-mentioned white lupin studies, the addition of molybdenum alone in a foliar fertilizer significantly increased the Fv/Fm parameter value, indicating a reduction in plant stress (compared to the control), and the CCI index. In our study, the Fv/Fm parameter value was stimulated by boron and molybdenum fertilization (Bolero Mo) in two out of three years, and the CCI increased in value each year after using Bolero Mo, and after application of Adob Mo in the drier 2018. Molybdenum is a cofactor for the nitrate reductase enzyme involved in nitrogen assimilation [38]. In bean plants living with Rhizobium bacteria, the demand for molybdenum is greater than in other plants, and its deficiency limits the number and dry mass of root papillae [39]. Our results are contrary to Omer et al. [40], where the various molybdenum applications did not modify any of the studied characteristics of lentil (Lens culinaris Medik.) plants, except for the height of the plant.
Fertilization of peas with boron alone (Adob B) gave weaker effects than in combination with molybdenum (Bolero Mo), both in terms of yield and in influencing physiological parameters, which in turn stimulated plant height in 2016 and dry plant weight in two of the years. These results are partly consistent with the work by Madna [41], where boron application increased the height of field bean plants, the leaf area of a single plant, total dry plant weight, number of pods per plant, number of seeds in a pod, seed weight of one plant and 1000 seed weight. Also, Mahmoud et al. [42] found that the application of boron significantly increased field bean plant height, total dry matter, number of pods per plant, number of seeds in the pod and seed yield.
In a previous study conducted by Sulewska et al. [43], a nitrogen and boron fertilizer (Adob B) had the strongest stimulatory effect on the growth of pea plants, and also derived the highest CCI values. Boron application was also shown to lead to an increase in the height of seed pea plants, flowering and the number of pods [44]. Moghazy et al. [45] demonstrated the stimulating effect of boron on the vegetative growth of green peas, i.e., plant length, number of leaves, number of stems, fresh plant mass, as did Niewiadomska et al. [29] for height, CCI and LAI values in white lupin plants. Fageria et al. [46] showed that boron application can significantly increase common bean yield. Boron is an essential microelement in the cultivation of bean plants, because it plays an important role in the development of flowers, reduces the fall of pod buds [47], and also increases the establishment of nodules [48]. The uptake of boron by crops is small, but its deficiency has been reported in many soils globally [49,50].
While Titanit was shown to increase seed yield in 2016, it did not change biometric features, although it increased LAI values in two of the study years, and also increased the CCI values in 2018. These results are consistent with research by Malinowska and Kalembasa [51], in which titanium was shown to activate metabolic processes, as well as accelerate the process of photosynthesis and nutrient uptake. Our results are partly in agreement with Grenda [52], where titanium application led to an increase in chlorophyll content and photosynthesis efficiency in rape plants, yield and thousand seed weight in wheat plants, and sugar content in sugar beet roots. The use of titanium (Titanit) with white lupin [29] produced better results than with peas: increased the height of white lupin plants, the number of pods with seeds per 1 m2, reduced stress (Fv/Fm), and similarly increased the CCI and LAI values.
In 2017, when the plants were well supplied with water the best results were obtained with Optysil, Adob 2.0 Mo and Rooter, and the increase in yield was 15.4%, 11.9% and 7.5% respectively. Silicon can affect the metabolism and physiological functions of plants, especially under stress [53]. However, the active silicon contained in Optysil strongly stimulated pea yield only in the year (2016) with the average weather conditions for the region. A similar yield increase (15.1%) was shown in earlier studies on white lupin [29]. Other authors have also reported the beneficial effect of silicon on the yield of other plant species: monocotyledons that include rice [53], and sugar beet roots [54]. Silicon can be taken from the soil solution, constituting up to 10% dry matter (DM). However, rejective uptake of this micronutrient has been found in some species, especially bean species [55]. These plants are not able to accumulate silicon, and they absorb it more slowly than water, hence they contain less than when passively taking the element from the soil, and so cannot benefit from its positive effect. Therefore, it is possible that foliar application of a treatment containing active silicon enabled the uptake of this microelement by the peas plants in the wet 2017, and by white lupin in previous studies [29], which was externalized by a higher seed yield. In our study, the use of Optysil, aside from crop yield, significantly increased plant height by 16.0% (compared to the control) but did not improve any of the other assessed traits.
The drought that prevailed during the growing season in 2018 greatly limited the development and yield of the pea plants. Its influence was so pronounced that it limited the effectiveness of the biostimulators and fertilizers. The positive effect of the Rooter biostimulator in terms of root growth, biomass accumulation has been demonstrated by Kowalczyk and Zielony [56] and the product has also been shown to strongly affect the yield of tomatoes [57] and nappa cabbage [58]. Our research partly confirms these findings, because Rooter stimulated LAI and CCI values, increased the Fv/Fm parameter values and seed weight per plant, and also lowered the seed moisture content before harvest, but did not modify the other parameters tested.

4.2. Biological Nitrogen Fixation

Biostimulators are a source of substances and/or microorganisms that have an impact on the metabolic processes that occur in the plants [11]. Foliar fertilizers and biostimulators, which contain micro and macroelements caused an increase in BNF in the pea plants in this study. Various microelements, including boron, cobalt, molybdenum and iron, influence the level of molecular nitrogen binding by bacteria entering symbiosis with plants.
Molybdenum and iron are two metalloproteins that form a bacteroid enzyme complex – nitrogenase, which allows plants to bind molecular nitrogen [59]. During the process of nitrogen binding, molybdenum has two yield-forming functions: stimulation of (a) the number of root nodules and (b) the number of flowers/pods on the plant. Molybdenum is most readily available for plants in alkaline soils, while uptake by plants is prevented by drought and by an excessive concentration of sulphate anions in the soil [60]. In our study, a significantly increased level of BNF was observed after application of foliar fertilizers containing molybdenum.
Boron is an important microelement in BNF. In our study, a significantly increased BNF was observed after application of the foliar fertilizer that contained boron (Adob B), although, it was the lowest BNF value recorded, in comparison to the other fertilizers/biostimulators used.
The Tytanit biostimulator highly stimulated the BNF process and exhibited the best effect in all study years. The effect of titanium on plants is to modify the activity of enzymes, such as catalase, peroxidase, lipoxygenase or nitrate reductase [61]. It increases chlorophyll content in the leaves, which translates into increased cereal and vegetable crop yields. Kováčik et al. [62] noted that the use of Mg-Titanite (MgTi) in the form of titanium ascorbate in the growth phases BBCH 29 and BBCH 32 stimulated the formation of terrestrial winter wheat phytomass and increased the content of total chlorophyll in the leaves. It is known that the process of BNF is closely correlated with photosynthetic intensity, which in turn is dependent on chlorophyll content. The biological fixation of atmospheric nitrogen depends on many environmental conditions, such as water content and temperature [63].

4.3. Biochemical Activity

Enzymatic activity is one of the best indicators for assessing biological activity in the soil, and the following enzymes are widely used: dehydrogenase, phosphatase, urease and protease [64]. In the literature, numerous authors [65,66,67] report that dehydrogenases do not accumulate in the soil, but only in the cytoplasm and characteristic structures formed from the cytoplasmic membranes of living microorganisms. Being intracellular enzymes, they can be indicative of the presence of physiologically active soil microorganisms, which provides information on the respiratory activity of the entire soil microbiota, especially bacteria and Actinomycetes [68]. Numerous studies on dehydrogenases and their association with soil factors indicate that they are useful and sensitive indicators of soil changes [69,70,71].
In our study, a significant stimulating effect from the use of biostimulators and foliar fertilizers on dehydrogenase activity was observed. High dehydrogenase activity was observed during the full growing season of the pea crop (onset of flowering), and may be associated with increased secretion by the root system during this period, which subsequently leads to increased numbers of microorganisms. Similar results were obtained by Siwik-Ziomek and Szczepanek [72], who analyzed the impact of inorganic fertilization (NPK and S) and the Kelpak biostimulator on dehydrogenase activity in the soil during the cultivation of winter rapeseed. In their study, they observed an increase in dehydrogenase and catalase activity in the period from flowering to ripening. In addition, they showed that the use of the Kelpak biostimulator and sulphur application resulted in a significant stimulating modification of catalase and dehydrogenase activity. Moreover, Brzezińska et al. [68] noted that dehydrogenase activity is associated with the activity of other soil enzymes, for example catalase and β-glucosidase, as well as with the presence of nitrogen. Prashantha [73] indicated that, among other elements, boron increases the activity of dehydrogenases. In contrast, Niewiadomska et al. [29] reported the positive effect of molybdenum on the production of these enzymes by white lupin plant root nodules, and discussed the possibility of a positive correlation between titanium concentration and soil biochemistry.
Phosphatases are also important enzymes for the soil environment. Many authors report that phosphatases are good indicators of the potential for organic phosphorus mineralization and soil biological activity [74,75], and these enzymes are characterized by high susceptibility to changing soil conditions [76]. The main sources of phosphatase in the soil environment are mainly soil microorganisms, plant roots and soil fauna.
Aon and Colaneri [77] observed correlations between organic matter content and acid/alkaline phosphatase activity. Margalef et al. [78] noted that phosphatase activity is higher in soils with a low phosphorus content. A lack of phosphorus in our fertilization treatments increased acid phosphatase activity. A study conducted by Niewiadomska et al. [79], which assessed the effect of fertilizer application (PRP SOL) containing phosphorus, potassium, zinc, boron and molybdenum in the cultivation of yellow lupin, showed that the decrease in acid phosphatase activity was caused by the activation of compounds inaccessible to the plants. Fukuda et al. [80] reported that plants typically produce acid phosphatases when the amount of available phosphorus in the soil is low.
In our study, the largest significant decrease in the level of acid phosphatase activity was observed after application of the Bolero Mo biostimulator in 2016 and 2017, and by the Adob Zn IDHA foliar fertilizer in 2017. The results observed for most of the other experimental treatments at the beginning of the flowering phase were also promising in terms of phosphorus availability due to the action of fertilizers/biostimulators used, as evidenced by the reduced level of the enzyme activity in the soil compared to the control treatment.
In our study, different levels of alkaline phosphatase activity were observed after the application of foliar fertilizers and biostimulators. The increase in the activity of this enzyme could have been the result of the increased activity of soil microorganisms on organic phosphorus compounds (e.g., phytins) secreted into the soil by the pea plants. Phosphatase activity in the soil depends on available phosphorus content, which suggests that alkaline and acid phosphatase participate in the regulation of the nutrient economy [81].
The results observed in this study in regard to catalase activity show the significant stimulating effect of the treatments. Catalase is a well-documented enzyme in scientific literature and has the best-known chemical structure. It is an enzyme from the group of oxidoreductases (E.C.1.11.1.6), found in microorganisms, plants and animals. In the soil environment, it is present in the cells of all microorganisms that use oxygen for respiratory processes (aerobes, facultative anaerobes). Obligatory anaerobes show very little or no catalase activity. It is considered one of the main enzymes with antioxidant activity and works mainly to remove excess hydrogen peroxide (H2O2) by converting water and oxygen in all aerobic organisms [82]. Brzezińska et al. [72] showed a significant relationship between catalase activity and the oxygenation of soils. The stimulating effect of biostimulators on the activity of this enzyme was demonstrated by Niewiadomska et al. [29] in a study conducted during the cultivation of soybean and white lupin, while Stępniewska et al. [83] showed significant positive correlations between soil catalase activity and organic matter content, biomass, oxygen absorption, carbon dioxide secretion, as well as dehydrogenase, glucosidase, amidase, and phosphodiesterase activity.
As the results of our study on the activity of all enzymes tested in the experiment show, it is noteworthy that in all years of the experiment the highest dehydrogenase activity was observed during the flowering period of the plants, regardless of the biostimulators/fertilizers used. There were similar dependencies observed for the acid and alkaline phosphatases and catalase in 2016 and 2018. There were no such dependencies in 2017, when the highest phosphatase activity was noted during the period of full growth of the plants, i.e., at phases BBCH 35–40, whereas the highest catalase activity was observed after the plants had been harvested.
It is very likely that the significant increase in the activity of the enzymes tested in the experiment during the flowering of pea plants was caused by secretions of the root system. The substances contained in root secretions and in the dying cells of root tissues are rich sources of nutrients and energy for various groups of microorganisms. Hupe et al. [84] proved that the phase of pea development had significant influence on the dynamics of nutrients in the plant’s root zone, and consequently, on the soil enzyme activity. The researchers observed strong rhizodeposition of carbon and nitrogen in the period ranging from the emergence of plants to their flowering. They noted significant inhibition of nitrogen rhizodeposition after the flowering period and attributed this effect to the displacement of nitrogen in the plants. The reduced amount of organic nitrogen substances in relation to carbon in the rhizosphere after the flowering of the plants explains the reduced metabolic level of the enzymes analyzed in the experiment.

5. Conclusions

The results of the study showed that the effect of biostimulators and foliar fertilizers was closely related to weather conditions, and so it was not possible to clearly indicate whether there was a positive effect from the treatments on pea seed yield in each year. Adob Zn IDHA was the only fertilizer that stimulated yields, especially under average moisture conditions and less so in drought conditions in two of three years of the study. Among tested biostimulants and fertilizers, a repeatable in years increase of the yield in both, dry and wet years, was obtained after the application of Adob Zn IDHA foliar fertilizer. In addition, this fertilizer stimulated vegetative development of the plants, i.e., plant height in the average year and plant dry mass in the wetter year.
Similarly, in regard to the enzymatic parameters tested, it cannot be clearly determined which biostimulator treatments was best for pea cultivation and improved soil biochemical activity. A significant relationship between the effect of applied biostimulators and the development phase of the plant, as well as the year of the study was indicated. Depending on the year, the positive effect of Bolero Mo application on dehydrogenase, acid phosphatase and catalase activity, and Adob B application on alkaline phosphatase activity was noted. The BNF level was best influenced by the Titanit biostimulator, but it should be noted that all the treatments used in this study were found to stimulate this parameter.

Supplementary Materials

The following are available online at https://www.mdpi.com/2073-4395/10/10/1558/s1, Table S1: Effects of experimental treatments on DHA; three-way ANOVA results, Table S2: Effects of experimental treatments on PAC; three-way ANOVA results, Table S3: Effects of experimental treatments on PAL; three-way ANOVA results, Table S4: Effects of experimental treatments on CAT; three-way ANOVA results, Table S5: Effects of experimental treatments on BIF; three-way ANOVA results, Table S6: Effects of experimental treatments on Y; two-way ANOVA results, Table S7: Effects of experimental treatments on M; two-way ANOVA results, Table S8: Effects of experimental treatments on TSW; two-way ANOVA results, Table S9: Effects of experimental treatments on SSPW; ANOVA results, Table S10: Effects of experimental treatments on H; two-way ANOVA results, Table S11: Effects of experimental treatments on SW/P; two-way ANOVA results, Table S12: Effects of experimental treatments on CCI; two-way ANOVA results, Table S13: Effects of experimental treatments on Fv/Fm; two-way ANOVA results, Table S14: Effects of experimental treatments on PDM; two-way ANOVA results, Table S15: Effects of experimental treatments on LAI; two-way ANOVA results, Table S16: Effects of experimental treatments on BNF; two-way ANOVA results.

Author Contributions

H.S., A.N., K.R., K.P., A.F. and A.W.-M. conceived and designed the experiments; H.S., A.N., K.R., K.P., A.F., A.W.-M., and L.D. performed the field experiments and analyzed the data; A.B. carried out the statistical analysis; H.S., A.N., wrote the paper; H.S., A.N., K.R. revised the manuscript. All authors have read and agreed to the published version of the manuscript.

Funding

This research was funded by Polish Ministry of Agriculture and Rural Development project number HOR 3.3/2011–2015 And The APC was funded by Ministry of Science and Higher Education programme Project No. 005/RID/2018/19.

Acknowledgments

This study was made possible by a grant from the Polish Ministry of Agriculture and Rural Development, Project: Improving domestic sources of plant protein, their production, trading and use in animal feed, project No. HOR 3.3/2011–2015 and within the framework of Ministry of Science and Higher Education programme as ‘Regional Initiative Excellence’ in years 2019–2022, Project No. 005/RID/2018/19.

Conflicts of Interest

The authors declare no conflict of interest.

References

  1. Wang, N.; Daun, J.K. Effect of variety and crude protein content on nutrients and certain antinutrients in field peas (Pisum sativum). J. Sci. Food Agric. 2004, 84, 1021–1029. [Google Scholar] [CrossRef]
  2. N’Dayegamiye, A.; Whalen, J.K.; Tremblay, G.; Nyiraneza, J.; Grenier, M.; Drapeau, A.; Bipfubusa, M. The benefits of legume crops on corn and wheat yield, nitrogen nutrition, and soil properties improvement. Agron. J. 2015, 107, 1653–1665. [Google Scholar] [CrossRef]
  3. Michalk, K. The legal framework for short rotation coppice in Germany in the context of the ‘greening’of the EU’s common agricultural policy. In Bioenergy from Dendromass for the Sustainable Development of Rural Areas; Wiley-VCH: Hoboken, NJ, USA, 2015; pp. 367–374. [Google Scholar]
  4. Hillocks, R.J. Farming with fewer pesticides: EU pesticide review and resulting challenges for UK agriculture. Crop Prot. 2012, 31, 85–93. [Google Scholar] [CrossRef]
  5. Vermeulen, S.J.; Aggarwal, P.K.; Ainslie, A.; Angelone, C.; Campbell, B.M.; Challinor, A.J.; Lau, C. Options for support to agriculture and food security under climate change. Environ. Sci. Policy 2012, 15, 136–144. [Google Scholar] [CrossRef]
  6. Parry, M.A.J.; Flexas, J.; Medrano, H. Prospects for crop production under drought: Research priorities and future directions. Ann. App. Biol. 2005, 147, 211–226. [Google Scholar] [CrossRef]
  7. Drobek, M.; Frąc, M.; Cybulska, J. Plant Biostimulants: Importance of the Quality and Yield of Horticultural Crops and the Improvement of Plant Tolerance to Abiotic Stress—A Review. Agronomy 2019, 9, 335. [Google Scholar] [CrossRef] [Green Version]
  8. Du Jardin, P. Plant biostimulants: Definition, concept, main categories and regulation. Sci. Hortic. 2015, 196, 3–14. [Google Scholar] [CrossRef] [Green Version]
  9. Colla, G.; Rouphael, Y.; Canaguier, R.; Svecova, E.; Cardarelli, M. Biostimulant action of a plant-derived protein hydrolysate produced through enzymatic hydrolysis. Front. Plant Sci. 2014, 5, 448. [Google Scholar] [CrossRef] [Green Version]
  10. Yakhin, O.I.; Lubyanov, A.A.; Yakhin, I.A.; Brown, P.H. Biostimulants in plant science: A global perspective. Front. Plant Sci. 2017, 26, 2049. [Google Scholar] [CrossRef] [Green Version]
  11. Kunicki, E.; Grabowska, A.; Sekara, A.; Wojciechowska, R. The effect of cultivar type, time of cultivation, and biostimulant treatment on the yield of spinach (Spinacia oleracea L.). Folia Hortic. Ann. 2010, 22, 9–13. [Google Scholar] [CrossRef] [Green Version]
  12. Ferreira, M.I.; Lourens, A.F. The efficacy of liquid seaweed extract on the field canola plants. S. Afr. J. Plant Soil 2002, 19, 159–161. [Google Scholar] [CrossRef]
  13. Sultana, V.; Ehteshamul-Haque, S.; Ara, J.; Athar, M. Comparative efficacy of Brown, Green and red Seaweeds in the control of Root infesting fungi and okra. Int. J. Environ. Sci. Technol. 2005, 21, 75–81. [Google Scholar]
  14. Piotrowska-Dlugosz, A.; Charzynski, P. The impact of the soil sealing degree on microbial biomass, enzymatic activity, and physicochemical properties in the ekranic technosols of Toruń (Poland). J. Soil Sediment. 2015, 15, 47–59. [Google Scholar] [CrossRef] [Green Version]
  15. Ahemad, M.; Khan, S.M. Functional aspects of plant growth promoting Rhizobacteria: Recent Advancements. Insight Microbiol. 2011, 1, 39–54. [Google Scholar] [CrossRef]
  16. Sulewska, H.; Ratajczak, K.; Panasiewicz, K.; Kalaji, H.M. Can pyraclostrobin and epoxiconazole protect conventional and stay-green maize varieties grown under drought stress? PLoS ONE 2019, 14, e0221116. [Google Scholar] [CrossRef]
  17. Strażyński, P.; Mrówczyński, M. (Eds.) Metodyka Integrowanej Ochrony i Produkcji Grochu dla Doradców; Instytut Ochrony Roślin-Państwowy Instytut Badawczy: Poznań, Poland, 2016. [Google Scholar]
  18. IUSS Working Group WRB. World Reference Base for Soil Resources 2006, First Update 2007; World Soil Resources Reports No. 103; FAO: Rome, Italy, 2007. [Google Scholar]
  19. Molga, M. Agrometeorology; PWRiL: Warsaw, Poland, 1986. (In Polish) [Google Scholar]
  20. Sawicka, A. The ecological aspects of dinitrogen fixation. In Annals of the University of Agriculture in Poznan; Dissertations Scientific: Poznań, Poland, 1983; Volume 134. [Google Scholar]
  21. Thalmann, A. Zur Methodik der Bestimmung der Dehydrogenase aktivität im Boden mittels triphenytetrazoliumchlorid (TTC). Landwirtsch Forsch 1968, 21, 249–258. [Google Scholar]
  22. Tabatabai, M.A.; Bremner, J.M. Use of p-nitrophenyl phosphate for assay of soil phosphatase activity. Soil Biol. Biochem. 1969, 1, 301–307. [Google Scholar] [CrossRef]
  23. Johnson, J.L.; Temple, K.L. Some Variables Affecting the Measurement of “Catalase Activity” in Soil 1. Soil Sci. Soc. Am. 1964, 28, 207–209. [Google Scholar] [CrossRef]
  24. Stefanic, F.; Ellade, G.; Chirnageanu, J. Researches concerning a biological index of soil fertility. In Proceedings of the 5th Symposium of Soil Biology, Bucharest, Romania, 28 June–3 July 1981; Nemes, M.P., Kiss, S., Papacostea, P., Stefanic, C., Rusan, M., Eds.; Romanian National Society of Soil Science: Bucharest, Romania, 1984; pp. 35–45. [Google Scholar]
  25. COBORU. Available online: http://www.coboru.pl/PlikiWynikow/14_2016_WPDO_12_GRS.pdf (accessed on 27 May 2020).
  26. Stevenson, F.J.; Cole, M.A. Cycles of Soil: Carbon, Nitrogen, Phosphorus, Sulfur, Micronutrients, 2nd ed.; John Wiley & Sons: Hoboken, NJ, USA, 1999. [Google Scholar]
  27. Fageria, N.K.; Baligar, V.C. Growth components and zinc recovery efficiency of upland rice genotypes. Pesq. Agropec. Bras. 2005, 40, 1211–1215. [Google Scholar] [CrossRef] [Green Version]
  28. Duffy, B. Zinc and plant disease. In Mineral Nutrition and Plant Disease; Datnoff, L.E., Elmer, W.H., Huber, D.M., Eds.; APS Press: St. Paul, MN, USA, 2007; pp. 155–175. [Google Scholar]
  29. Niewiadomska, A.; Sulewska, H.; Wolna-Maruwka, A.; Ratajczak, K.; Waraczewska, Z.; Budka, A. The Influence of Bio-Stimulants and Foliar Fertilizers on Yield, Plant Features, and the Level of Soil Biochemical Activity in White Lupine (Lupinus albus L.) Cultivation. Agronomy 2020, 10, 150. [Google Scholar] [CrossRef] [Green Version]
  30. Raj, A.B.; Raj, S.K. Zinc and boron nutrition in pulses: A review. J. App. Nat. Sci. 2019, 11, 673–679. [Google Scholar] [CrossRef]
  31. Sulewska, H.; Ratajczak, K. Chemical composition of selected preparations supporting plant development and evaluation of their activity in soybean cultivation. Chem. Indus. 2017, 96, 1352–1355. [Google Scholar]
  32. Kuniya, N.; Chaudhary, N.; Patel, S. Effect of sulphur and zinc application on growth, yield attributes, yield and quality of summer cluster bean [Cyamopsis tetragonoloba (L.)] in light textured soil. IJCS 2018, 6, 1529–1532. [Google Scholar]
  33. Hassanein, M.S.; Shalaby, M.A.F.; Rashad, E.M. Improving growth and yield of some faba bean cultivars by using some plant growth promoters in newly cultivated land. Ann. Agric. Sci. Moshtohor. 2000, 38, 2141–2155. [Google Scholar]
  34. Tobbal, Y.F.M. Physiological Studies on the Effect of Some Nutrients and Growth Regulators on Plant Growth and Metabolism. Ph.D. Thesis, Faculty of Science Al-Azhar University, Cairo, Egypt, 2006. [Google Scholar]
  35. El-Sallami, I.H.; Gad, M.M. Growth and flowering responses of New York aster (Aster novibelgii L.) to a slow release fertilizer and foliar applied zinc. Assuit J. Agric. Sci. 2005, 36, 121–136. [Google Scholar]
  36. Mostafavi, K. Grain yield and yield components of soybean upon application of different micronutrient foliar fertilizers at different growth stages. Int. J. Agric. Res. Rev. 2012, 2, 389–394. [Google Scholar]
  37. Gomaa, A.O. Studies on the response of Matthiola incana plants to some growth conditions. 2-In Field: Effect of foliar spray with zinc sulphate, calcium and paclobutrazol on growth and flowering. Egypt. J. Appl. Sci. 2003, 18, 291–318. [Google Scholar]
  38. Hansch, R.; Mendel, R.R. Physiological functions of mineral micronutrients (Cu, Zn, Mn, Fe, Ni, Mo, B, Cl). Curr. Opin. Plant. Biol. 2009, 12, 259–266. [Google Scholar] [CrossRef] [PubMed]
  39. Brkić, S.; Milaković, Z.; Kristek, A.; Antunović, M. Pea yield and its quality depending on inoculation, nitrogen and molybdenum fertilization. Plant Soil Environ. 2004, 50, 39–45. [Google Scholar] [CrossRef] [Green Version]
  40. Omer, F.A.; Abbas, D.N.; Khalaf, A.S. Effect of molybdenum and potassium application on nodulation, growth and yield of lentil (Lens culinaris MEDIC). Pak. J. Bot. 2016, 48, 2255–2259. [Google Scholar]
  41. Madny, A.E.M. Response of Some Field Crops Grown under Newly Reclaimed Soil Conditions to Boron Fertilization. Ph.D. Thesis, Faculty of Science Al-Azhar University, Cairo, Egypt, 2004. [Google Scholar]
  42. Shaaban, M.M.; Abdalla, F.E.; Abou El-Nour, E.A.A.; El-Saady, A.M. Boron nitrogen interaction effect on growth and yield of faba bean plants grown under sandy soil conditions. Int. J. Agric. Res. 2006, 1, 322–330. [Google Scholar]
  43. Sulewska, H.; Ratajczak, K.; Niewiadomska, A.; Koziara, W.; Panasiewicz, K.; Faligowska, A. Preparaty zawierające tytan, krzem, bor, cynk i molibden w uprawie łubinu białego i grochu siewnego. Przem chem. 2018, 97, 1182–1185. [Google Scholar] [CrossRef]
  44. Kumar, R.; Kumar, S.S.; Pandey, A.C. Effect of seed soaking in nitrogen, phosphorus, potassium and boron on growth yield of garden pea (Pisum sativum L.). Ecol. Environ. Conserv. 2006, 14, 383–386. [Google Scholar]
  45. Moghazy, A.M.; Saed, S.M.E.; Awad, E.M.S. The influence of boron foliar spraying with compost and mineral fertilizers on growth, green pods and seed yield of pea. Nat. Sci. 2014, 12, 50–57. [Google Scholar]
  46. Fageria, N.K.; Baligar, V.C.; Zobel, R.W. Yield, nutrient uptake and soil chemical properties as influenced by liming and boron application in common bean in a No–Tillage system. Commun. Soil Sci. Plan. 2007, 38, 1637–1653. [Google Scholar] [CrossRef]
  47. Subasinghe, S.; Dayatilake, G.A.; Senaratne, R. Effect of B, Co and Mo on nodulation, growth and yield of cowpea (Vigna unguiculata). Trop. Agric. Res. Ext. 2003, 6, 108–112. [Google Scholar]
  48. Bonilla, I.; Perez, H.; Cassab, G.; Lara, M.; Sanchez, F. The effect of boron deficiency on development in determinate nodules: Changes in cell wall pectin contents and nodule polypeptide expression. In Boron in Soils and Plants. Developments in Plant and Soil Sciences; Bell, R.W., Rerkasem, B., Eds.; Springer: Dordrecht, The Netherlands, 1997; Volume 76. [Google Scholar]
  49. Fageria, N.K.; Baligar, V.C.; Clark, R.B. Micronutrients in crop production. Adv. Agron. 2002, 77, 185–268. [Google Scholar]
  50. Ross, J.R.; Slaton, N.A.; Brye, K.R.; Delong, R.E. Boron fertilization influences on soybean yield and leaf and seed born concentration. Agron. J. 2006, 98, 198–205. [Google Scholar] [CrossRef]
  51. Malinowska, E.; Kalembasa, S. The yield and content of Ti, Fe, Mn, Cu in celery leaves (Apium graveolens L. var. dulce mill. pers.) as a result of Tytanit application. Acta Sci. Pol. Hortorum Cultus 2012, 11, 69–80. [Google Scholar]
  52. Grenda, A. Tytanit—An activator of metabolic processes. Chem. Sustain. Agric. 2003, 4, 263–269. [Google Scholar]
  53. Sacała, E. Role of silicon in plant resistance to water stress. J. Elementol. 2009, 14, 619–630. [Google Scholar] [CrossRef]
  54. Artyszak, A.; Gozdowski, D.; Kuchcińska, K. The effect of silicon foliar fertilization in sugar beet–Beta vulgaris (L.) ssp. vulgaris conv. crassa (Alef.) prov. altissima (Döll). Turk. J. Field Crops 2015, 20, 115–119. [Google Scholar] [CrossRef]
  55. Liang, Y.; Si, J.; Römheld, V. Silicon uptake and transport is an active process in Cucumis sativus. New Phytol. 2005, 167, 797–804. [Google Scholar] [CrossRef] [PubMed]
  56. Kowalczyk, K.; Zielony, T. Effect of Goteo treatment on yield and fruit quality of tomato grown on rock wool. In Monographs Series: Biostimulators in Modern Agriculture: Solanaceous Crops; Dąbrowski, Z.T., Ed.; Editorial House Wieś Jutra: Warsaw, Poland, 2008; pp. 21–26. [Google Scholar]
  57. Gajc-Wolska, J. The Influence of Grafting and Biostimulators on the Yield and Fruit Quality of Greenhouse Tomato CV. (Lycopersicon esculentum Mill.) Grown in the Field. Veg. Crops Res. Bull. 2010, 72, 63–70. [Google Scholar] [CrossRef] [Green Version]
  58. Gajewski, M.; Gos, K.; Bobruk, J. The influence of Goëmar Goteo biostimulator on yield and quality of two Chinese cabbage cultivars. In Monographs Series: Biostimulators in Modern Agriculture: Vegetable Crops; Dąbrowski, Z.T., Ed.; Editorial House Wieś Jutra: Warsaw, Poland, 2008; pp. 21–27. [Google Scholar]
  59. Zboińska, M. W jaki sposób rośliny pobierają i asymilują azot? Eduk. Biol. Środowiskowa 2018, 2, 19–31. [Google Scholar]
  60. Weisany, W.; Raei, Y.; Allahverdipoor, K.H. Role of some of mineral nutrients in biological nitrogen fixation. Bull. Environ. Pharmacol. Life Sci. 2013, 2, 77–84. [Google Scholar]
  61. Sládková, A.; Száková, J.; Havelcová, M.; Najmanová, J.; Tlustoš, P. The contents of selected risk elements and organic pollutants in soil and vegetation within a former military area. Soil Sediment. Contam. Int. J. 2015, 24, 325–342. [Google Scholar] [CrossRef]
  62. Kováčik, P.; Havrlentová, M.; Šimanský, V. Growth and Yield Stimulation of Winter Oilseed Rape (Brasssica Napus, L.) by Mg-Titanit Fertiliser. Agriculture 2014, 1, 132–141. [Google Scholar]
  63. Rousk, K.; Sorensen, P.L.; Michelsen, A. What drives biological nitrogen fixation in high arctic tundra: Moisture or temperature? Ecosphere 2018, 9, e02117. [Google Scholar] [CrossRef]
  64. Niewiadomska, A.; Majchrzak, L.; Borowiak, K.; Wolna-Maruwka, A.; Waraczewska, Z.; Budka, A.; Gaj, R. The Influence of Tillage and Cover Cropping on Soil Microbial Parameters and Spring Wheat Physiology. Agronomy 2020, 10, 200. [Google Scholar] [CrossRef] [Green Version]
  65. Moeskops, B.; Buchan, D.; Sleutel, S.; Herawaty, L.; Husen, E.; Saraswati, R.; Setyorini, D.; De Neve, S. Soil microbial communities and activities under intensive organic and conventional vegetable farming in West Java, Indonesia. Appl. Soil Ecol. 2010, 45, 112–120. [Google Scholar] [CrossRef]
  66. Wolińska, A.; Stępniewska, Z. Dehydrogenase Activity in the Soil Environment. In Dehydrogenases; Canuto, R.A., Ed.; Intech: Rijeka, Croatia, 2020; Chapter 8; pp. 183–210. [Google Scholar]
  67. Januszek, K.; Błońska, E.; Długa, J.; Socha, J. Dehydrogenase activity of forest soils depends on the assay used. Int. Agrophys. 2014, 29, 47–59. [Google Scholar] [CrossRef] [Green Version]
  68. Brzezińska, M.; Włodarczyk, T.; Stępniewski, W.; Przywara, G. Soil oxygen status and catalase activity. Acta Agrophys. 2005, 5, 555–565. [Google Scholar]
  69. Bastida, F.; Kandeler, E.; Moreno, J.L.; Ros, M.; García, C.; Hernández, T. Application of Fresh and Composted Organic Wastes Modifies Structure, Size and Activity of Soil Microbial Community under Semiarid Climate. Appl. Soil Ecol. 2008, 40, 318–329. [Google Scholar] [CrossRef]
  70. Salazar, S.; Sanchez, L.; Alvarez, J.; Valverde, A.; Galindo, P.; Igual, J.; Peix, A.; Santa-Regina, I. Correlation Among Soil Enzyme Activities Under Different Forest System Management Practices. Ecol. Eng. 2011, 37, 1123–1131. [Google Scholar] [CrossRef]
  71. Gałązka, A.; Gawryjołek, K.; Perzyński, A.; Gałązka, R.; Księżak, J. Changes in Enzymatic Activities and Microbial Communities in Soil under Long-Term Maize Monoculture and Crop Rotation. Pol. J. Environ. Stud. 2017, 26, 39–46. [Google Scholar] [CrossRef]
  72. Siwik-Ziomek, A.; Szczepanek, M. Soil Extracellular Enzyme Activities and Uptake of N by Oilseed Rape Depending on Fertilization and Seaweed Biostimulant Application. Agronomy 2019, 9, 480. [Google Scholar] [CrossRef] [Green Version]
  73. Prashantha, G.M.; Prakash, S.S.; Umesha, S.; Chikkaramappa, T.; Subbarayappa, C.T.; Ramamurthy, V. Direct and residual effect of zinc and boron on soil enzyme activities at harvest in finger millet-groundnut cropping system. J. Pharm. Phytochem. 2019, 8, 2447–2451. [Google Scholar]
  74. Dick, W.A.; Cheng, L.; Wang, P. Soil acid and alkaline phosphatase activity as pH adjustment indicators. Soil Biol. Biochem. 2000, 32, 1915–1919. [Google Scholar] [CrossRef]
  75. Schneider, K.; Turrion, M.B.; Grierson, P.F.; Gallardo, J.F. Phosphatase activity, microbial phosphorus, and fine root growth in forest soils in the Sierra de Gata, western Spain. Biol. Fert. Soils 2001, 34, 151–155. [Google Scholar] [CrossRef]
  76. Bielińska, E.; Mocek-Płóciniak, A. Impact of the tillage system on the soil enzymatic activity. Arch. Environ. Prot. 2012, 38, 75–82. [Google Scholar] [CrossRef]
  77. Aon, M.A.; Colaneri, A.C. Temporal and spatial evolution of enzymatic activities and physical-chemical properties in an agricultural soil. Appl. Soil Ecol. 2001, 18, 155–270. [Google Scholar]
  78. Margalef, O.; Sardans, J.; Fernández-Martínez, M.; Molowny-Horas, R.; Janssens, I.A.; Ciais, P.; Goll, D.; Richter, A.; Obersteiner, M.; Asensio, D.; et al. Global patterns of phosphatase activity in natural soils. Sci. Rep. 2017, 2, 1337. [Google Scholar] [CrossRef] [PubMed] [Green Version]
  79. Niewiadomska, A.; Sulewska, H.; Wolna-Maruwka, A.; Ratajczak, K.; Głuchowska, K.; Waraczewska, Z.; Budka, A. An Assessment of the Influence of Co-Inoculation with Endophytic Bacteria and Rhizobia, and the Influence of PRP SOL and PRP EBV Fertilisers on the Microbial Parameters of Soil and Nitrogenase Activity in Yellow Lupine (Lupinus luteus L.) Cultivation. Pol. J. Environ. Stud. 2018, 6, 2687–2702. [Google Scholar] [CrossRef]
  80. Fukuda, T.; Osaki, M.; Shinano, T.; Wasaki, J. Cloning and Characterization of Two Secreted Acid Phosphatases from Rice Call, Plant Nutrition: Food Security and Sustainability of Agro-Ecosystems through Basic and Applied Research; Kluwer Academic Publisher: New York, NY, USA, 2001; pp. 34–35. [Google Scholar]
  81. Adetunji, A.T.; Lewu, F.B.; Mulidzi, R.; Ncube, B. The biological activities of β-glucosidase, phosphatase and urease as soil quality indicators: A review. J. Soil Sci. Plant. Nutr. 2017, 17, 794–807. [Google Scholar] [CrossRef] [Green Version]
  82. Chelikani, P.; Ramana, T.; Radhakrishnan, T.M. Catalase: A repertoire of unusual features. Indian J. Clin. Biochem. 2005, 20, 131–135. [Google Scholar] [CrossRef] [PubMed] [Green Version]
  83. Stępniewska, Z.; Wolińska, A.; Ziomek, J. Response of soil catalase activity to chromium contamination. J. Environ. Sci. 2009, 21, 1142–1147. [Google Scholar] [CrossRef]
  84. Hupe, A.; Schulz, H.; Bruns, C.; Haase, T.; Heß, J.; Joergensen, R.G.; Wichern, F. Even flow? Changes of carbon and nitrogen release from pea roots over time. Plant Soil 2018, 431, 143–157. [Google Scholar] [CrossRef]
Figure 1. Sielianinov index (K) during the growing seasons 2016–2018 (recorded at the Agrometeorological Observatory in Gorzyń, Poland). Sielianinov K Index: <0.5—drought, 0.5–1.0—semi-drought, 1.0–1.5—zone of optimal moisture, >1.5—excessive moisture.2.3. Influence of Fertilizers on Nitrogenase Activity (Diazotrophy).
Agronomy 10 01558 g001
Figure 2. Principal components analysis for pea fertilization treatments in: (a) 2016, (b) 2017, (c) 2018, (d) 2016–2018 years. Abbreviations: Y—Yield, M—Seed moisture %, TSW—1000 seed weight, SW—Seed weight per plant, SW/P—seed weight in 1 pod PW—Pod weight per plant, SSPW—Share of seed in whole plant weight, H—plant height, CCI—chlorophyll content index, Fv/Fm—maximum photosynthetic efficiency of PSII, PDM—plant dry mass, LAI—leaf area index, BIF—biological index of fertility, BNF—biological nitrogen fixation, DHA—dehydrogenase activity, CAT-catalase activity, PAL—alkaline phosphatase level, PAC—acid phosphatase level. Treatment: t1—control—no biostimulators, t2—Tytanit; t3—Optysil; t4—Metalosate potassium; t5—Rooter; t6—Bolero Mo; t7—Adob Zn IDHA; t8—Adob B; t9—Adob 2.0 Mo; PC1—first principal component; PC2—second principal component.
Agronomy 10 01558 g002
Figure 3. Relationship between the biometric, physiological characteristics of the pea plants and enzymatic activity in the soil, biological index of fertility (BIF), and nitrogenase activity. Abbreviations: M—Seed moisture %, SW/P—seed weight in 1 pod, LAI—leaf area index, PW—Pod weight per plant, BIF—biological index of fertility, H—plant height, PDM—plant dry mass, SW—Seed weight per plant, Y—Yield, TSW—1000 seed weight, SSPW—Share of seed in whole plant weight, CCI—chlorophyll content index, BNF—biological nitrogen fixation Fv/Fm—maximum photosynthetic efficiency of PSII, DHA—dehydrogenase activity, PAC—acid phosphatase level, CAT—catalase activity, PAL—alkaline phosphatase level. Treatment: t1—control—no biostimulators, t2—Tytanit; t3—Optysil; t4—Metalosate potassium; t5—Rooter; t6—Bolero Mo; t7—Adob Zn IDHA; t8—Adob B; t9—Adob 2.0 Mo.
Agronomy 10 01558 g003
Table 1. Timing of application and dosage of biostimulators and fertilizers applied in the study.
Biostimulator and Foliar FertilizerTerm and Dose of BiostimulatorsBiostimulator and Fertilizer Characteristics
BiostimulatorsTytanitI: BBCH 13–14
II: BBCH 31–32
0.3 0.3 dm3 ha−1
Liquid, mineral stimulant containing titanium (Ti). It increases the yield, volume and development of plants, improves yield quality parameters and increases plants’ natural resistance to stress.
Composition: 8.5 g Ti (dm3)−1
RooterBBCH 13–14
1 dm3 ha−1
Biostimulator—it stimulates the growth of the root system, accelerates regeneration and improves the uptake of soil minerals.
Composition: P2O5 13.0%; K2O 5.0%
Foliar fertilizersOptysilI: BBCH 16–18
II: BBCH 52–55
III: BBCH 71–73
0.5 dm3 ha−1
Liquid, silicon antistressor stimulating the growth and development of plants, activating their natural immune system, and increasing tolerance to unfavourable cultivation conditions.
Composition: 200 g SiO2 (dm3)−1
Metalosate potassiumI: BBCH 11–13
II: BBCH 18–20
III: BBCH 31–32
3 dm3 ha−1
Liquid foliar fertilizer containing an easily absorbable form of potassium, which supplements potassium deficiency in plants with amino acids.
Composition: K2O 24%
Bolero MoBBCH 58
1.5 dm3 ha−1
Liquid foliar fertilizer containing boron and molybdenum to supplement deficiency in plants.
Composition: B 8.2%; Mo 0.8%
Adob Zn IDHABBCH 58
1 dm3 ha−1
Foliar fertilizer containing zinc (Zn) fully chelated by biodegradable chelating agent IDHA.
Composition: Zn 100 g kg−1 (weight percentage content 10, chelated by IDHA)
Adob BBBCH 55–58
2 dm3 ha −1
Liquid, highly concentrated foliar fertilizer containing boron that regulates auxin activity and participates in cell division.
Composition: N 78 g kg−1; B 150 g kg−1
Adob 2.0 MoBBCH 11–13
0.15 dm3 ha −1
Liquid, single-component fertilizer which increases the rate and efficiency of use of nitrogen by plants and improves interaction with iron.
Composition: Mo 20%
BBCH—A uniform decimal code for growth stages of crops and weeds, IDHA—chelating agent.
Table 2. Type and date of agrotechnical treatments carried out in the study.
Treatment201620172018
Tilling set04.0403.0405.04
Sowing date04.0404.0407.04
Herbicide spraying05.04
Afalon Dyspersyjny 1.1 L/ha
04.04
Stomp Aqua 455 CS 2.6 L/ha
09.04
Stom Aqua 455 CS 2.6 L/ha
Herbicide spraying13.05
Basagran 480 SL 2.6 L/ha
26.05
Panthera 040 EC 1.75 L/ha
16.05—Fusilade forte 150 EC 1.7 L/ha
Insecticide spraying_17.05 and 29.05 Dursban 480 EC 1.25 L/ha15.05 and 13.06 Superkill 500 EC 0.06 L/ha
Fungicide spraying30.05
Gwarant 500 SL 2.0 L/ha
05.06. and 24.06 Azoksystrobina 250 SC 1.0 L/ha_
Fungicide spraying30.06
Korazzo 250 SC 1.0 L/ha
12.07
Signum 33 WG 0.8 kg/ha + Piorun 200 SC 0.2 L/ha
22.05
Korazzo 050 SC 1.2 L/ha
Harvest date19.0731.0729.06
CS—capsule suspension, SL—soluble concentrate, EC—emulsifiable concentrate, SC—concentrate in the form of a concentrated suspension.
Table 3. Soil characterization at the study site.
Mineral Componentmg·kg−1Soil Abundance
Manganese164.1average
Zinc15.4high
Copper2.6average
Iron728.0average
Boron10.2high
Molybdenumbelow testing limitsvery low
Phosphorus8.64 mg P/100 g soilhigh
Potassium12.28 mg K/100 g soilaverage
Magnesium5.3 mg mg/100 g soilhigh
Humus content0.8%poor
C-org %0.48
pH in 1 M KCl6.5slightly acid
Table 4. The influence of biostimulator and fertilizer treatments on crop yield (t ha−1).
Experimental CombinationYear of Analysis
201620172018
Control—no biostimulator or foliar fertilizers applied to the plants3.07 c5.21 cd1.33 ab
Tytanit3.34 ab5.31 cd1.26 ab
Optysil3.00 cd6.01 a1.21 b
Metalosate potassium3.12 c5.15 d1.30 ab
Rooter3.13 bc5.60 b1.34 ab
Bolero Mo3.43 a5.42 bc1.34 ab
Adob Zn IDHA3.35 a5.40 bc1.39 a
Adob B3.33 ab5.33 cd1.29 ab
Adob 2.0 Mo2.79 d5.83 a1.30 ab
Different letters denote significant differences at level α = 0.05.
Table 5. The influence of biostimulator and fertilizer treatments on seed moisture content (%).
Experimental CombinationYear of Analysis
201620172018
Control—no biostimulators or foliar fertilizers applied to the plants12.6 ab14.0 ab15.0 a
Tytanit11.6 b15.2 a14.3 a
Optysil12.5 ab14.5 ab14.7 a
Metalosate potassium12.4 ab14.4 ab14.3 a
Rooter12.6 ab13.2 b14.3 a
Bolero Mo13.0 a15.0 a14.6 a
Adob Zn IDHA12.7 ab14.5 ab14.6 a
Adob B12.9 a15.3 a15.0 a
Adob 2.0 Mo12.8 a14.4 ab14.6 a
Different letters denote significant differences at level α = 0.05.
Table 6. The influence of biostimulator and fertilizer treatments on the 1000 seed weight (g).
Experimental CombinationYear of Analysis
201620172018
Control—no biostimulators or foliar fertilizers applied to the plants258.9 bcd284.7 b189.6 a
Tytanit255.3 cd285.2 b195.3 a
Optysil264.7 abc290.5 ab197.1 a
Metalosate potassium255.6 cd296.9 ab190.7 a
Rooter265.4 ab290.0 ab185.6 a
Bolero Mo259.7 bcd302.8 a185.3 a
Adob Zn IDHA270.4 a299.8 ab186.6 a
Adob B254.4 d298.1 ab189.9 a
Adob 2.0 Mo261.7 abcd289.0 ab201.4 a
Different letters denote significant differences at level α = 0.05.
Table 7. The influence of biostimulator and fertilizer treatments on seed weight per plant (g).
Experimental CombinationYear of Analysis
201620172018
Control—no biostimulators or foliar fertilizers applied to the plants1.56 b4.33 a1.55 c
Tytanit3.08 ab4.40 a0.98 c
Optysil3.78 a5.01 a3.16 a
Metalosate potassium3.89 a5.39 a1.51 c
Rooter3.54 a5.42 a1.44 c
Bolero Mo2.90 ab5.71 a2.31 b
Adob Zn IDHA3.56 ab5.79 a1.20 c
Adob B3.51 ab5.96 a1.24 c
Adob 2.0 Mo3.20 ab6.49 a1.32 c
Different letters denote significant differences at level α = 0.05.
Table 8. The influence of biostimulator and fertilizer treatments on the share of seed in whole plant weight (%).
Experimental CombinationYear of Analysis
201620172018
Control—no biostimulators or foliar fertilizers applied to the plants37.9 a48.6 ab41.4 b
Tytanit53.8 a51.4 ab30.4 b
Optysil55.2 a68.9 a49.2 ab
Metalosate potassium62.3 a48.0 ab44.9 ab
Rooter66.0 a60.5 ab33.8 b
Bolero Mo50.9 a48.4 ab61.6 a
Adob Zn IDHA53.1 a38.0 b33.6 b
Adob B45.0 a44.8 ab34.2 b
Adob 2.0 Mo51.5 a46.6 ab38.8 b
Different letters denote significant differences at level α = 0.05.
Table 9. The influence of biostimulator and fertilizer treatments on plant height (cm).
Experimental CombinationYear of Analysis
201620172018
Control—no biostimulators or foliar fertilizers applied to the plants49.8 b92.3 ab54.0 abc
Tytanit56.9 ab89.1 ab55.7 ab
Optysil59.3 ab85.6 ab43.8 d
Metalosate potassium63.3 a86.5 ab47.7 cd
Rooter58.9 ab87.3 ab51.5 bcd
Bolero Mo59.4 ab83.0 b59.3 a
Adob Zn IDHA60.1 a88.6 ab59.1 ab
Adob B60.6 a100.0 a53.4 abc
Adob 2.0 Mo55.2 ab96.3 ab56.1 ab
Different letters denote significant differences at level α = 0.05.
Table 10. The influence of biostimulator and fertilizer treatments on plant dry mass (g).
Experimental CombinationYear of Analysis
201620172018
Control—no biostimulators or foliar fertilizers applied to the plants4.57 b8.93 bc3.78 b
Tytanit5.71 ab8.47 c3.19 b
Optysil6.85 ab8.45 c6.43 a
Metalosate potassium6.24 ab13.89 a3.43 b
Rooter5.36 ab9.29 bc4.25 b
Bolero Mo5.70 ab12.25 abc3.90 b
Adob Zn IDHA6.70 ab12.94 ab3.59 b
Adob B7.78 a12.98 ab3.59 b
Adob 2.0 Mo6.18 ab11.66 abc3.39 b
Different letters denote significant differences at level α = 0.05.
Table 11. The influence of biostimulator and fertilizer treatments on the Chlorophyll Content Index (CCI).
Experimental CombinationYear of Analysis
201620172018
Control—no biostimulators or foliar fertilizers applied to the plants16.6 cd12.8 cd13.5 c
Tytanit16.6 cd15.1 cd20.3 b
Optysil22.4 a23.8 ab20.9 ab
Metalosate potassium18.8 bc16.3 c21.4 ab
Rooter20.9 ab27.4 a15.2 c
Bolero Mo22.8 a22.5 b23.1 a
Adob Zn IDHA14.3 d17.1 c19.2 b
Adob B16.0 cd16.9 c14.5c
Adob 2.0 Mo16.2 cd11.0 d21.4 ab
Different letters denote significant differences at level α = 0.05.
Table 12. The influence of the biostimulator and fertilizer treatments on chlorophyll fluorescence (Fv/Fm).
Experimental CombinationYear of Analysis
201620172018
Control—no biostimulators or foliar fertilizers applied to the plants0.743 cd0.738 c0.723 c
Tytanit0.763 a-d0.763 abc0.760 abc
Optysil0.783 abc0.773 abc0.813 a
Metalosate potassium0.718 d0.795 ab0.748 bc
Rooter0.755 bcd0.740 bc0.780 ab
Bolero Mo0.763 a-d0.805 a0.798 ab
Adob Zn IDHA0.808 a0.750 abc0.768 abc
Adob B0.793 ab0.770 abc0.760 abc
Adob 2.0 Mo0.755 bcd0.745 bc0.758 abc
Different letters denote significant differences at level α = 0.05.
Table 13. The influence of the biostimulator and fertilizer treatments on leaf area index (LAI).
Experimental CombinationYear of Analysis
201620172018
Control—no biostimulators or foliar fertilizers applied to the plants1.78 e3.44 cd2.61 e
Tytanit2.40 ab3.33 d2.86 cd
Optysil2.60 a3.78 b3.19 b
Metalosate potassium2.05 cd3.52 bcd2.79 cde
Rooter2.28 bc3.33 d2.80 cde
Bolero Mo2.30 b3.58 bcd3.39 a
Adob Zn IDHA1.88 de3.39 d2.63 e
Adob B1.75 e3.71 bc2.73 de
Adob 2.0 Mo2.28 bc4.48 a2.93 c
Different letters denote significant differences at level α = 0.05.
Table 14. The influence of biostimulator and fertilizer applications on biological nitrogen fixation (BNF; nMC2H4 plant−1 h−1).
Experimental CombinationYear of Analysis
201620172018
Control—no biostimulators or foliar fertilizers applied to the plants46.5 d62.3 f34.0 d
Tytanit244.0 a351.0 a169.0 a
Optysil183.5 b268.5 c147.5 b
Metalosate potassium161.5 b263.8 c143.0 b
Rooter95.8 c192.3 d74.5 c
Bolero Mo168.8 b328.0 b136.3 b
Adob Zn IDHA61.0 cd86.8 e51.5 d
Adob B164.3 b353.4 a141.0 b
Adob 2.0 Mo57.3 cd82.4 ef43.9 d
Different letters denote significant differences at level α = 0.05.
Table 15. The influence of biostimulator and fertilizer applications on dehydrogenase activity (μmol triphenyl formazane (TPF) 24 h−1 g−1dm of soil.
Experimental CombinationTerm of Analysis/BBCH
I/BBCH5-10II/BBCH35-40III/BBCH51-59IV/After Harvest
2016
10.0021 no0.0046 mn0.0195 c0.0071 i–m
20.0021 no0.0073 h–m0.0195 c0.0060 j–m
30.0018 no0.0056 lm0.0153 de0.0088 h–k
40.0020 no0.0066 i–m0.0183 cd0.0059 k–m
50.0015 o0.0089 h–k0.0200 bc0.0088 h–k
60.0018 no0.0095 f–i0.0295 a0.0091 h–j
70.0015 no0.0091 g–i0.0189 c0.0124 ef
80.0016 no0.0078 h–l0.0267 a0.0103 f–h
90.0018 no0.0056 lm0.0230 b0.0122 fg
2017
10.0054 a–c0.0005 c0.0068 a–c0.0022 bc
20.0062 a–c0.0037 a–c0.0095 a–c0.0003 c
30.0031 a–c0.0010 c0.0109 ab0.0014 bc
40.0062 a–c0.0014 bc0.0099 a–c0.0003 c
50.0021 bc0.0018 bc0.0024 bc0.0007 c
60.0035 a–c0.0019 bc0.0111 ab0.0123 a
70.0023 bc0.0057 a–c0.0054 a–c0.0081 a–c
80.0017 bc0.0024 bc0.0014 bc0.0054 a–c
90.0076 a–c0.0086 a–c0.0008 c0.0080 a–c
2018
10.0041 no0.0090 mn0.0379 d0.0141 i–m
20.0042 no0.0144 h–m0.0381 d0.0119 j–m
30.0036 no0.0109 lm0.0288 e0.0173 h–k
40.0039 no0.0130 i–m0.0352 d0.0116 k–m
50.0029 o0.0175 h–k0.0393 cd0.0173 h–k
60.0034 no0.0188 f–i0.0578 a0.0179 g–j
70.0030 no0.0181 g–i0.0358 d0.0247 ef
80.0032 no0.0154 h–l0.0506 b0.0204 f–h
90.0035 no0.0109 lm0.0446 bc0.0240 e–g
Different letters denote significant differences at level α = 0.05, (1) control—no biostimulators or foliar fertilizers applied to the plants; (2) Tytanit; (3) Optysil; (4) Metalosate potassium; (5) Rooter; (6) Bolero Mo; (7) Adob Zn IDHA; (8) Adob B; (9) Adob 2.0 Mo.
Table 16. The influence of biostimulator and fertilizer applications on acid phosphatase activity μmol (p-nitrophenol) PNP h−1 g−1dm of soil.
Experimental CombinationTerm of Analysis/BBCH
I/BBCH 5–10II/BBCH 35–40III/BBCH 51–59IV/After Harvest
2016
10.424 k1.059 g–j3.476 b0.954 ij
20.353 k1.198 f–j2.654 e0.968 h–j
30.384 k1.049 g–j3.170 b–d0.974 h–j
40.372 k1.217 f–j2.793 de0.868 j
50.355 k1.398 fg3.198 bc1.122 f–j
60.476 k1.340 f–h2.541 e1.268 f–l
70.379 k1.463 e2.901 c–e1.182 f–j
80.329 k1.233 f–j3.929 a1.378 fg
90.290 k0.940 ij2.850 c–e1.399 fg
2017
10.195 h–k0.398 ab0.353 a–d0.216 g–k
20.191 i–k0.384 a–c0.283 c–j0.281 c–j
30.151 k0.310 a–g0.279 c–j0.233 e–k
40.166 k0.403 a0.279 c–j0.277 d–j
50.203 g–k0.396 ab0.246 d–k0.236 e–k
60.202 g–k0.289 b–j0.234 e–k0.199 h–k
70.166 k0.333 a–e0.331 a–f0.184 jk
80.221 f–k0.303 a–h0.298 a–i0.216 g–k
90.311 a–g0.303 a–h0.338 a–e0.223 f–k
2018
10.181 l0.904 kl2.454 b1.119 i–k
20.181 l1.440 e–k1.905 b–g1.407 f–k
30.244 l1.092 jk2.125 b–f1.464 e–k
40.196 l1.298 g–k1.965 b–g1.132 h–k
50.190 l1.753 b–j2.233 b–d1.581 c–k
60.197 l1.882 b–h2.337 bc1.892 b–h
70.186 l1.806 b–j1.877 b–i1.817 b–j
80.230 l1.537 d–k3.983 a2.015 b–g
90.224 l1.087 jk2.183 b–e2.236 b–d
Different letters denote significant differences at level α = 0.05, (1) control—no biostimulators or foliar fertilizers applied to the plants; (2) Tytanit; (3) Optysil; (4) Metalosate potassium; (5) Rooter; (6) Bolero Mo; (7) Adob Zn IDHA; (8) Adob B; (9) Adob 2.0 Mo.
Table 17. The influence of the biostimulators and fertilizers on alkaline phosphatase activity μmol (p-nitrophenol) PNP h−1 g−1dm of soil.
Experimental CombinationTerm of Analysis
I/BBCH5–10II/BBCH35–40III/BBCH51–59IV/After Harvest
2016
10.316 m0.760 kl2.711 b0.834 i–l
20.283 m0.964 g–k2.302 d0.786 j–l
30.282 m0.803 i–l2.352 d0.925 h–l
40.286 m0.939 g–l2.311 d0.729 l
50.254 m1.144 e–g2.601 bc1.002 f–j
60.326 m1.145 e–g2.743 b1.088 f–h
70.267 m1.189 ef2.393 cd1.213 ef
80.244 m1.007 f–i3.299 a1.205 ef
90.234 m0.749 kl2.574 bc1.308 e
2017
10.173 i–k0.319 b–d0.250 c–i0.238 d–i
20.169 i–k0.345 b0.262 b–h0.205 f–k
30.178 h–k0.201 g–k0.234 d–j0.237 d–i
40.222 e–j0.485 a0.294 b–g0.269 b–h
50.124 k0.310 b–e0.238 d–i0.174 i–k
60.227 d–j0.343 bc0.202 g–k0.210 f–k
70.142 jk0.246 d–i0.208 f–k0.274 b–g
80.141 jk0.296 b–f0.244 d–i0.276 b–g
90.168 i–k0.297 b–f0.244 d–i0.280 b–g
2018
10.013 h0.017 h0.163 b–d0.043 f–h
20.013 h0.007 h0.124 cd0.023 h
30.011 h0.022 h0.119 b–e0.025 h
40.016 h0.017 h0.151 cd0.035 gh
50.017 h0.027 h0.119 b–e0.048 e–h
60.005 h0.028 gh0.190 bc0.099 d–g
70.005 h0.023 h0.113 d–f0.109 d–f
80.003 h0.021 h0.225 ab0.133 cd
90.010 h0.018 h0.139 cd0.270 a
Different letters denote significant differences at level α = 0.05, (1) control—no biostimulators or foliar fertilizers applied to the plants; (2) Tytanit; (3) Optysil; (4) Metalosate potassium; (5) Rooter; (6) Bolero Mo; (7) Adob Zn IDHA; (8) Adob B; (9) Adob 2.0 Mo.
Table 18. The influence of the biostimulators and fertilizers on catalase activity (µmol H2O2 min−1 g −1 dm of soil).
Experimental CombinationTerm of Analysis/BBCH
I/BBCH5–10II/BBCH35–40III/BBCH51–59IV/After Harvest
2016
122.692 gh28.276 gh44.846 ef19.767 gh
220.580 gh42.620 f72.124 a20.974 gh
325.691 gh23.572 gh55.345 c–f33.000 gh
421.507 gh35.703 gh72.429 a23.249 gh
527.440 gh39.026 gh67.390 a–c33.525 gh
622.283 gh26.695 gh57.982 b–d30.047 gh
727.466 gh34.392 gh68.860 ab32.881 gh
823.013 gh34.076 gh59.076 b–d41.569 g
914.933 h21.821 gh54.870 de25.644 gh
2017
122.726 z21.723 z25.257 y33.962 k
222.666 z32.811 l28.155 p44.407 a
314.366 z17.502 z26.240 w36.803 f
426.387 u16.629 z29.289 o38.730 e
514.196 z27.569 r39.211 c36.601 h
617.732 z16.554 z27.184 s39.308 b
710.839 z9.009 z39.033 d36.630 g
818.267 z26.443 t32.289 m35.145 i
910.784 z13.189 z31.404 n34.014 j
2018
113.477 t21.286 p31.711 k10.259 w
214.370 t37.776 hi38.910 g19.011 r
323.299 o26.861 m37.363 i22.729 o
48.146 y38.546 gh52.811 d16.344 s
516.411 s36.202 j47.716 e24.500 n
614.388 t40.710 f61.607 b27.577 m
714.346 t41.326 f52.351 d24.559 n
812.352 u30.921 kl64.465 a27.635 m
94.7124 z30.413 l54.256 c22.517 o
Different letters denote significant differences at level α = 0.05, (1) control—no biostimulators or foliar fertilizers applied to the plants; (2) Tytanit; (3) Optysil; (4) Metalosate potassium; (5) Rooter; (6) Bolero Mo; (7) Adob Zn IDHA; (8) Adob B; (9) Adob 2.0 Mo.
Table 19. The influence of the biostimulators and fertilizers on the biological indicator of fertility (BIF).
Experimental CombinationTerm of Analysis
I/BBCH5–10II/BBCH35–40III/BBCH51–59IV/After Harvest
2016
12.288 hi4.080 g–i14.337 c–e7.223 f–i
21.940 i4.112 g–i15.117 cd8.370 f–i
31.343 i4.810 g–i17.358 bc5.401 g–i
42.688 hi4.310 g–i16.451 cd2.561 hi
53.338 g–i5.935 f–i11.409 de9.616 f–i
62.518 i5.029 g–i17.223 bc13.776 c–e
71.038 i5.299 g–i17.445 bc14.522 c–e
80.758 i4.982 g–i28.795 b18.148 bc
91.773 i5.730 g–i15.690 cd33.907 a
2017
117.047 z16.292 z18.946 y25.472 k
217.002 z24.610 l21.121 p33.306 a
310.776 z13.127 z19.686 w27.603 f
419.794 u12.472 z21.972 o29.047 e
510.648 z20.678 r29.409 c27.451 h
613.300 z12.416 z20.393 s29.487 b
78.130 z6.759 z29.277 d27.477 g
813.701 z19.833 t24.217 m26.361 i
98.092 z9.896 z23.553 n25.514 j
2018
12.899 h3.881 h37.256 bc9.892 f–h
22.877 h1.609 h28.433 cd8.802 gh
32.451 h4.944 h27.258 d5.918 h
43.708 h3.903 h34.924 cd10.260 e–h
53.785 h6.069 h27.597 d11.215 e–h
61.223 h6.479 h43.747 ab22.826 d–g
71.115 h5.272 h26.276 de24.911 d–f
80.799 h4.694 h51.813 a30.487 cd
92.290 h4.205 h32.277 cd31.161 cd
Different letters denote significant differences at level α = 0.05, (1) control—no biostimulators or foliar fertilizers applied to the plants; (2) Tytanit; (3) Optysil; (4) Metalosate potassium; (5) Rooter; (6) Bolero Mo; (7) Adob Zn IDHA; (8) Adob B; (9) Adob 2.0 Mo.

