Selection of Tomato and Cucumber Accessions for Waterlogging Sensitivity through Morpho-Physiological Assessment at an Early Vegetative Stage


Abstract
1. Introduction
2. Materials and Methods
2.1. Plant Materials and Cultivation
2.2. Stress Treatment
2.3. Growth Analysis
2.4. Chlorophyll a Fluorescence Analysis
2.5. Statistical Analysis
3. Results
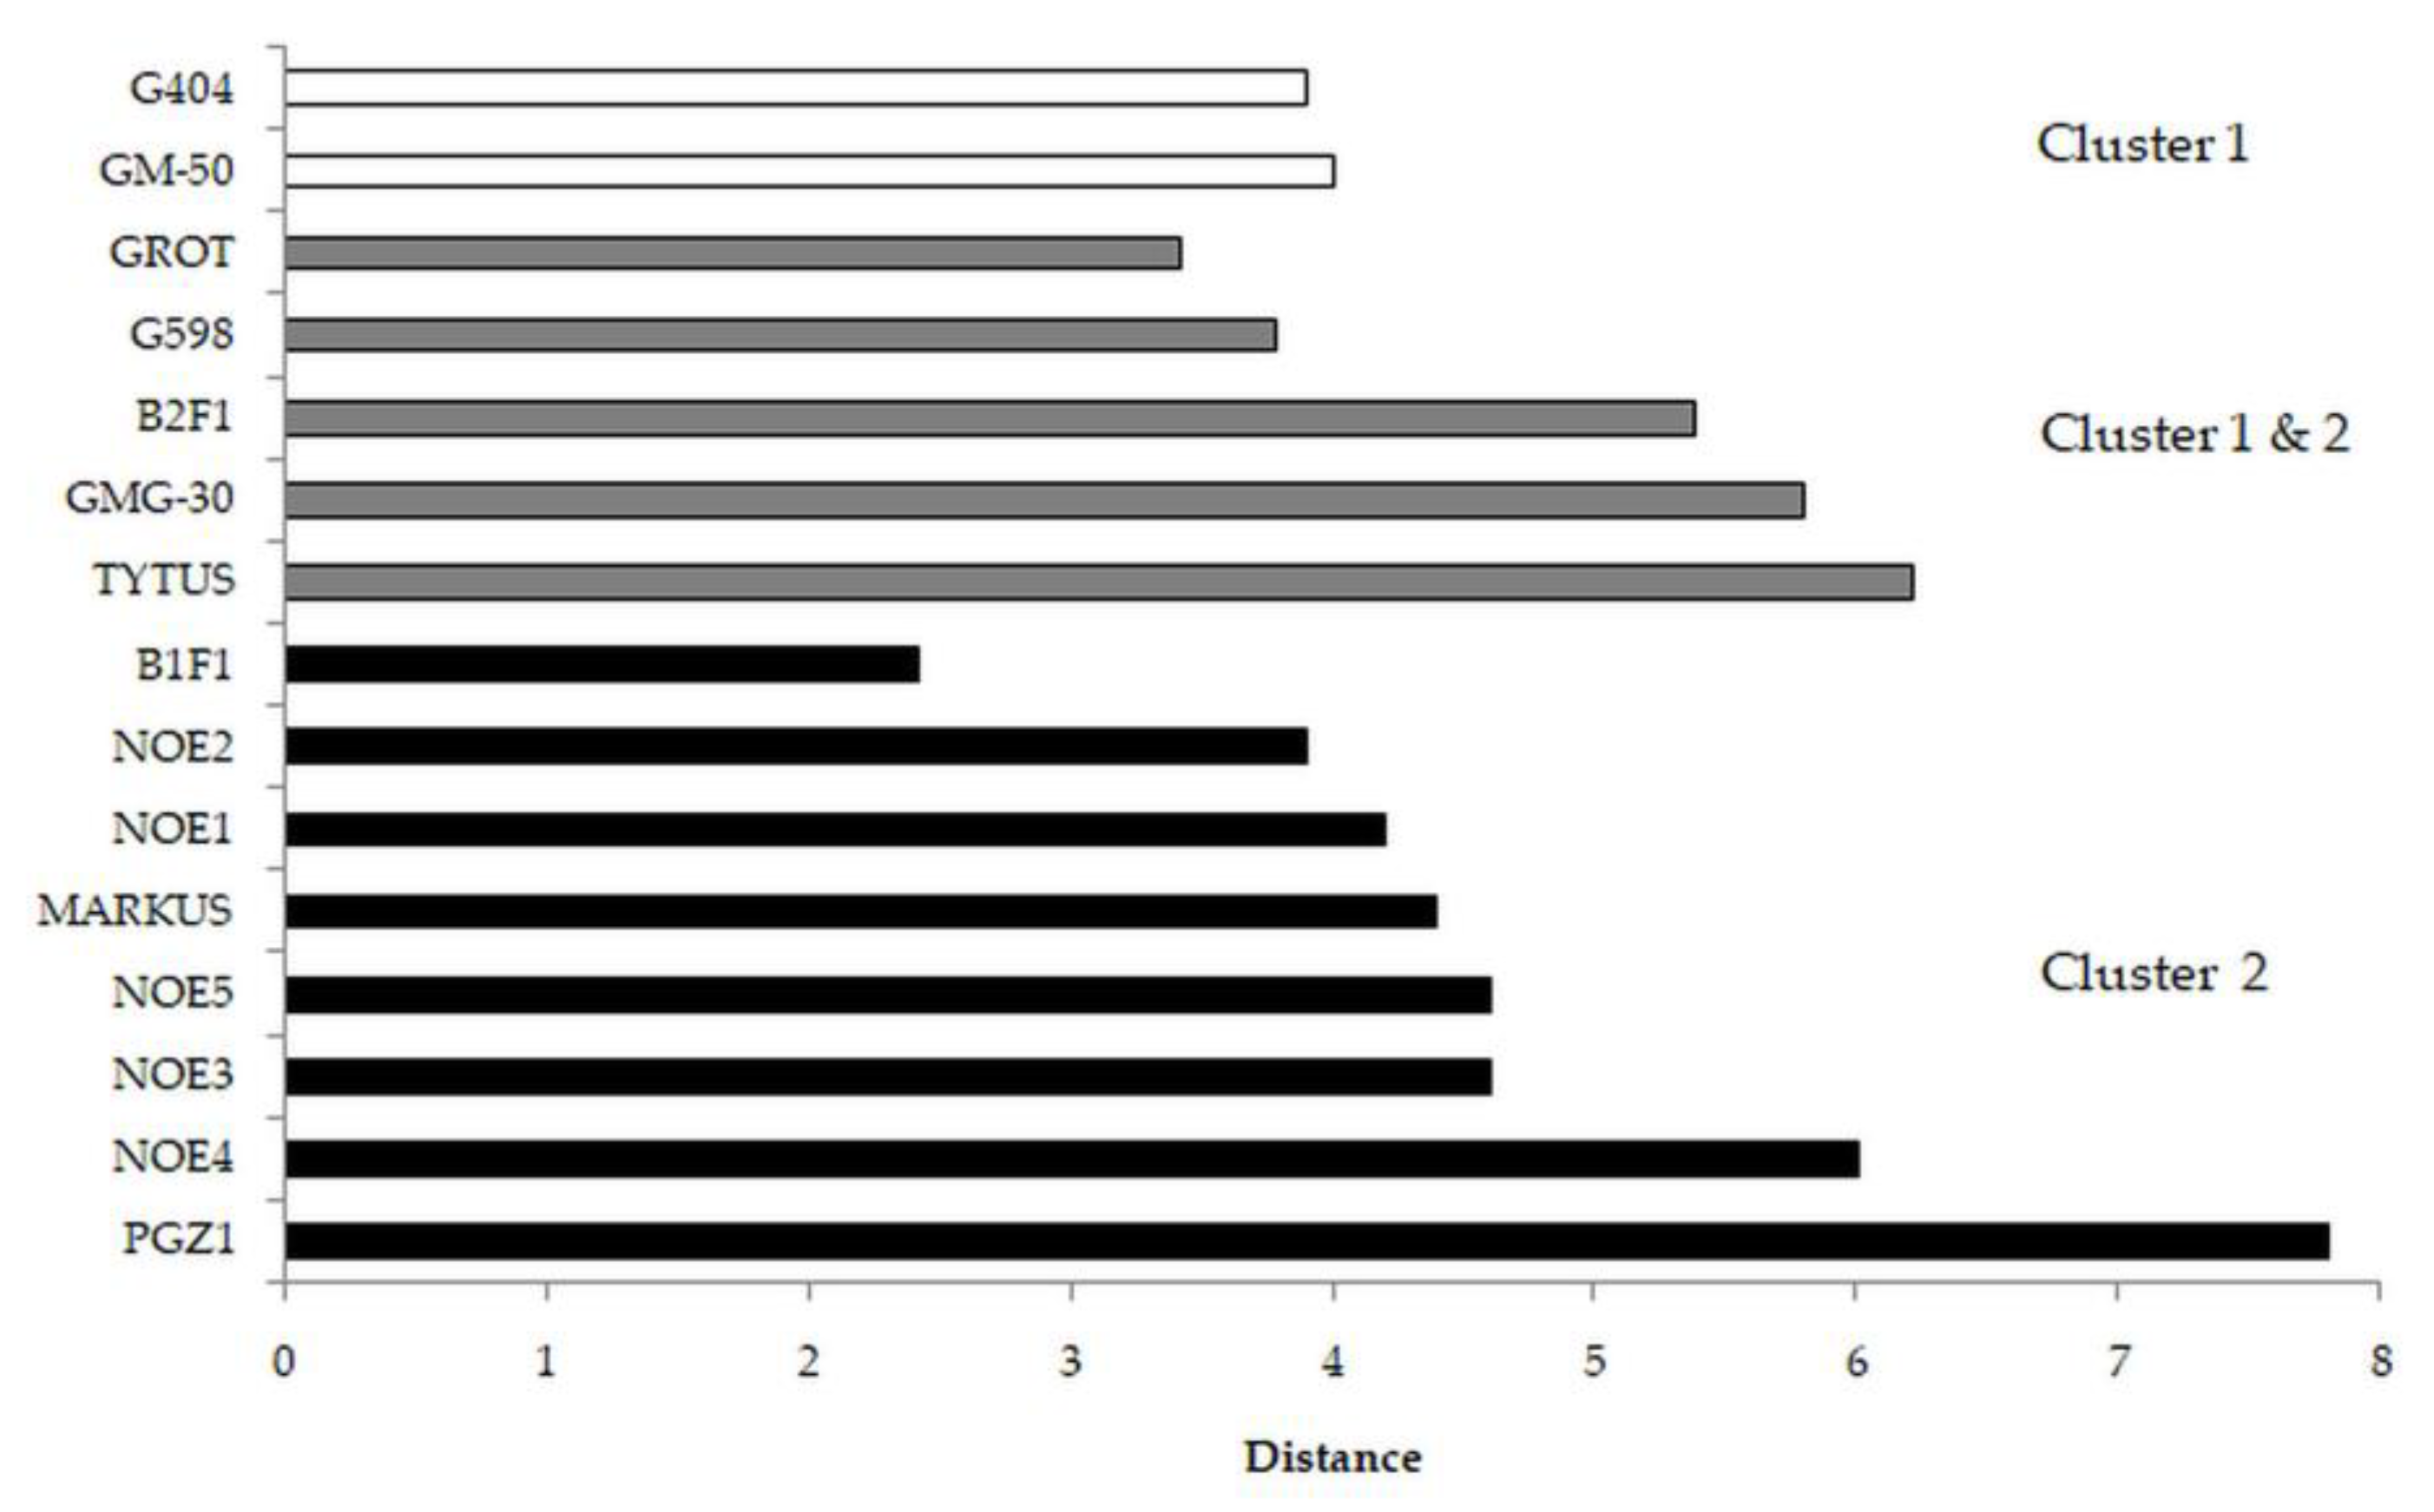
3.1. Cucumber
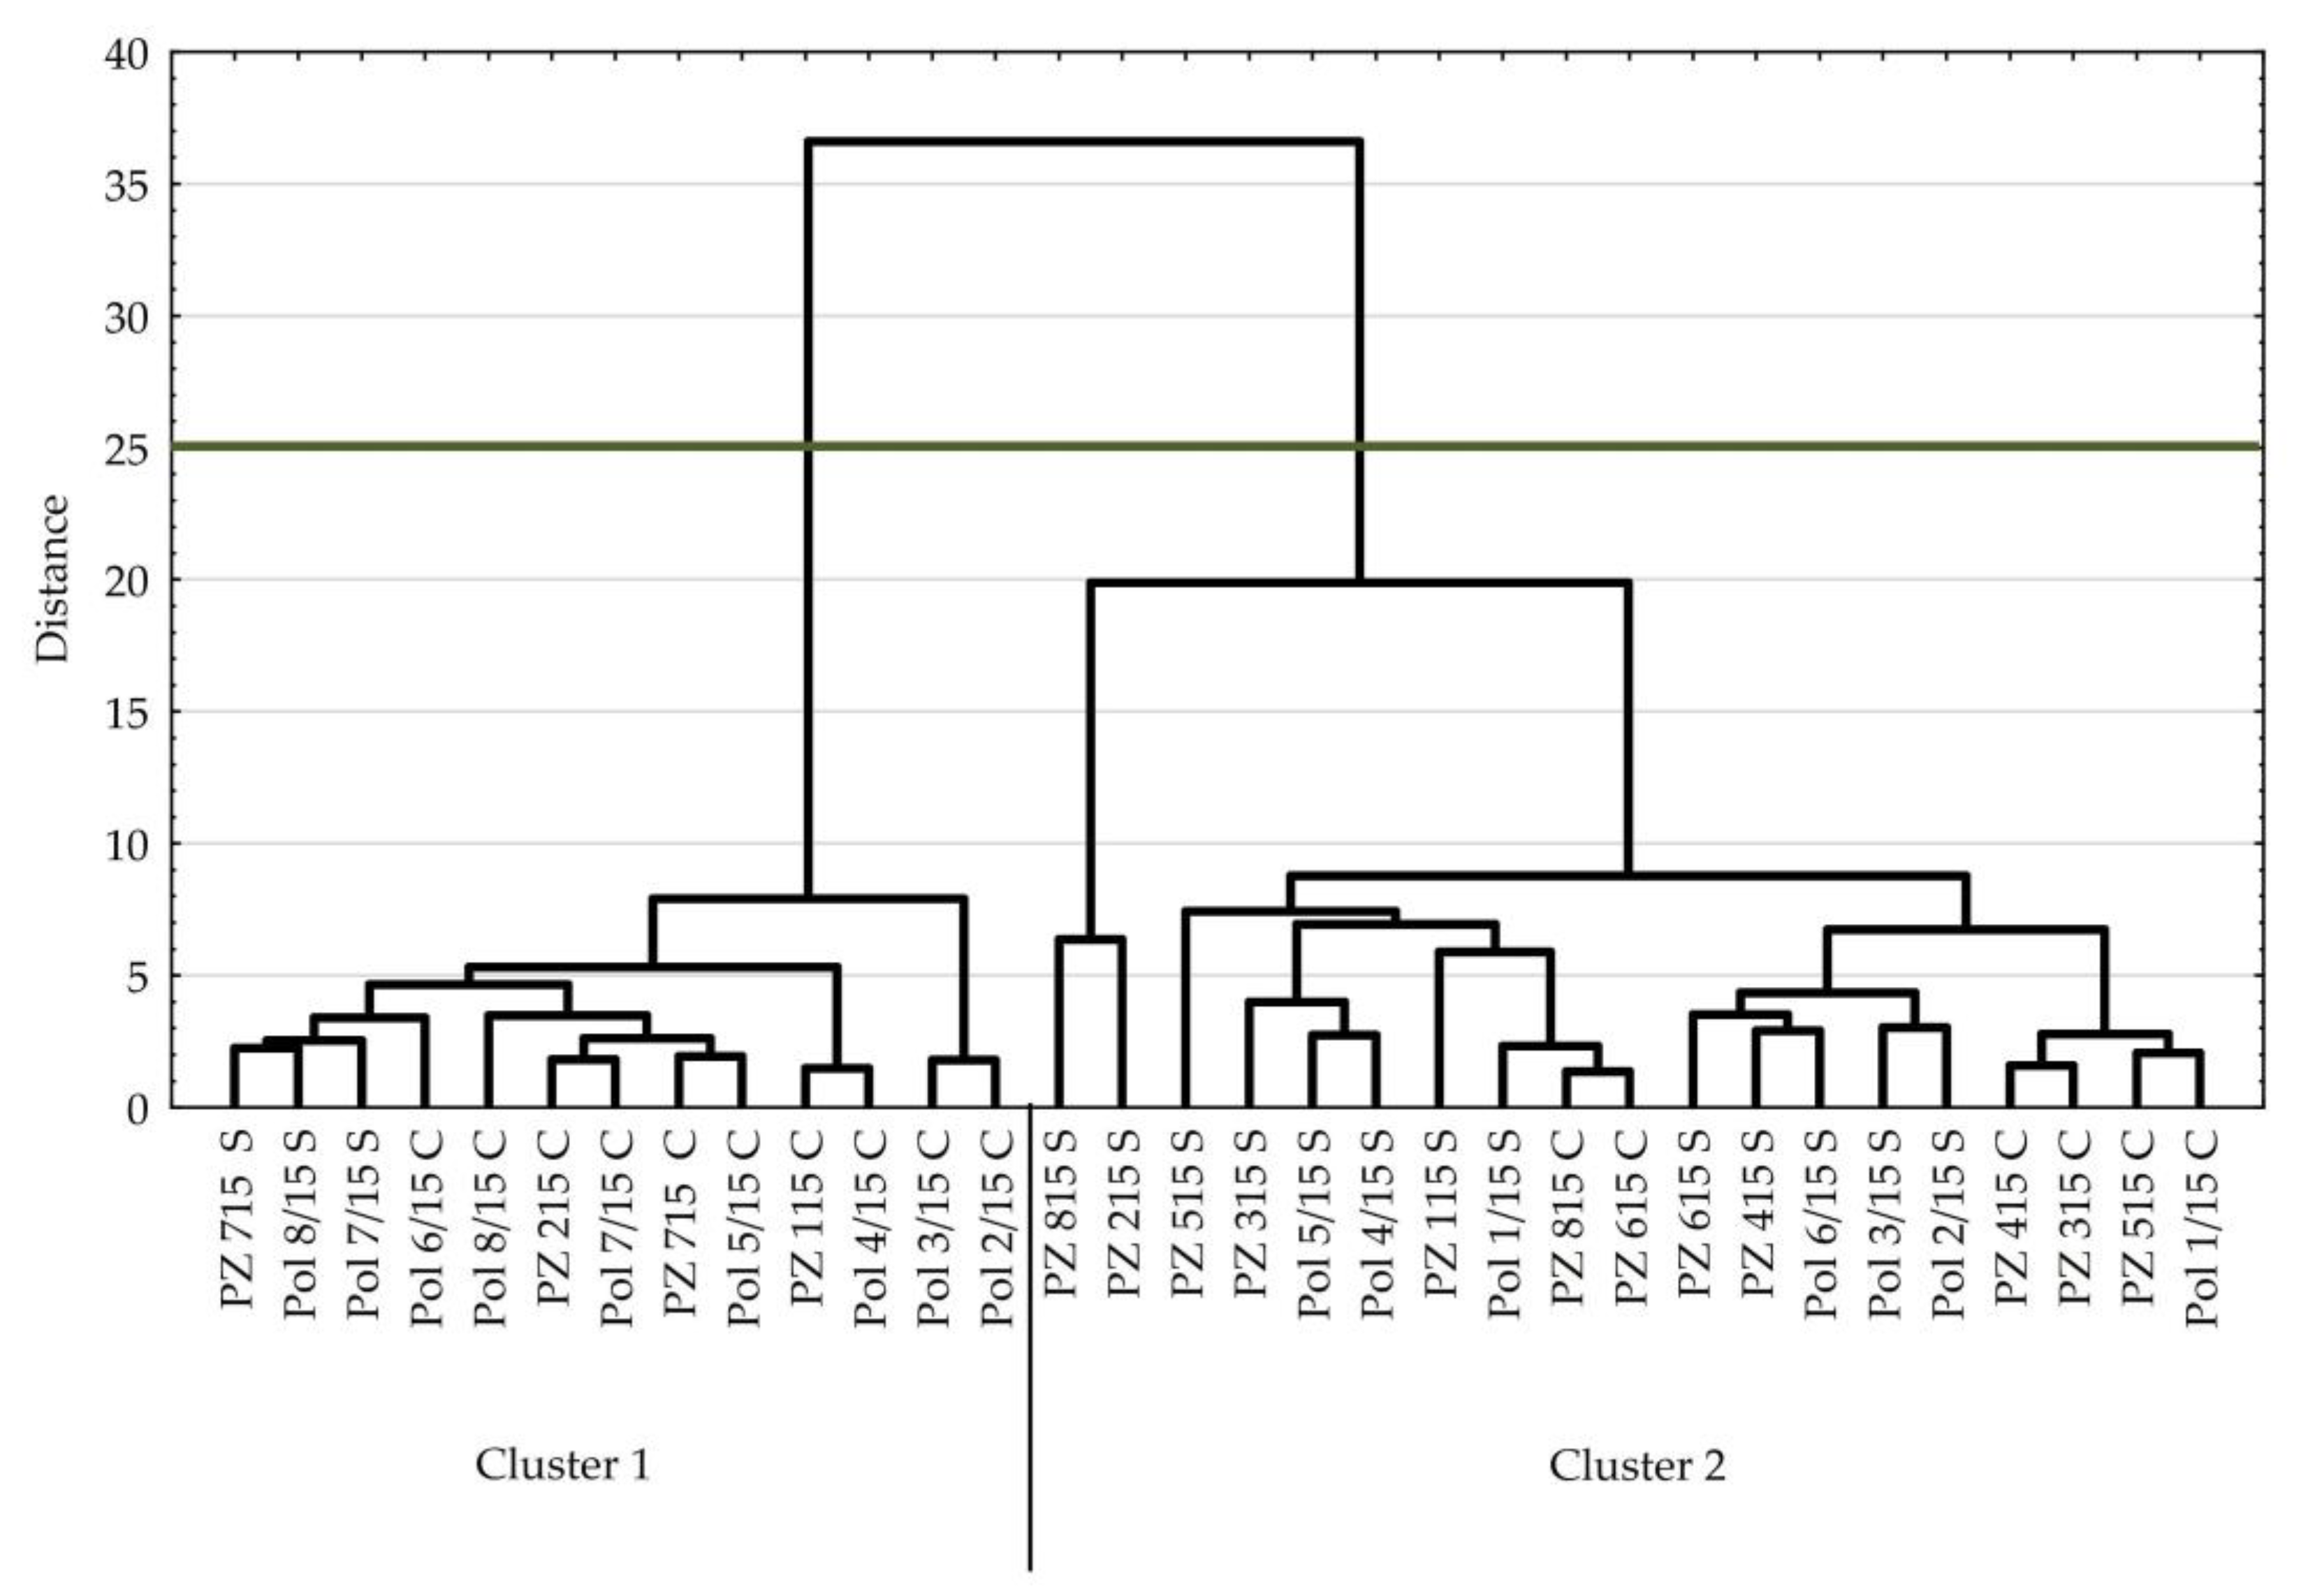
3.2. Tomato
4. Discussion
5. Conclusions
Supplementary Materials
Author Contributions
Funding
Acknowledgments
Conflicts of Interest
References
- Bailey-Serres, J.; Lee, S.C.; Brinton, E. Waterproofing crops: Effective flooding survival strategies. Plant Physiol. 2012, 160, 1698–1709. [Google Scholar] [CrossRef] [PubMed]
- Pachauri, R.K.; Meyer, L.A. (Eds.) Climate Change 2014: Synthesis Report. Contribution of Working Groups I, II and III to the Fifth Assessment Report of the Intergovernmental Panel on Climate Change; IPCC: Geneva, Switzerland, 2014; 151p, Available online: https://www.ipcc.ch/site/assets/uploads/2018/05/SYR_AR5_FINAL_full_wcover.pdf (accessed on 20 August 2020).
- FAO. The Future of Food and Agriculture—Trends and Challenges. Rome, Italy. 2017. Available online: http://www.fao.org/3/a-i6583e.pdf (accessed on 20 August 2020).
- Patel, P.K.; Singh, A.K.; Yadav, D.; Hemantaranjan, A.; Tripathi, N. Flooding: Abiotic constraint limiting vegetable productivity. Adv. Plants Agric. Res. 2014, 1, 96–103. [Google Scholar]
- Kaur, G.; Singh, G.; Motavalli, P.P.; Nelson, K.A.; Orlowski, J.M.; Golden, B.R. Impacts and management strategies for crop production in waterlogged or flooded soils: A review. Agron. J. 2020, 112, 1475–1501. [Google Scholar] [CrossRef]
- Rao, R.; Li, Y. Management of flooding effects on growth of vegetable and selected field crops. HortTechnology 2003, 13, 610–616. [Google Scholar] [CrossRef]
- Sasidharan, R.; Bailey-Serres, J.; Ashikari, M.; Atwell, B.J.; Colmer, T.D.; Fagerstedt, K.; Fukao, T.; Geigenberger, P.; Hebelstrup, K.H.; Hill, R.D.; et al. Community recommendations on terminology and procedures used in flooding and low oxygen stress research. New Phytol. 2017, 214, 1403–1407. [Google Scholar] [CrossRef]
- Bailey-Serres, J.; Voesenek, L.A.C.J. Flooding stress: Acclimations and genetic diversity. Annu. Rev. Plant Biol. 2008, 59, 313–339. [Google Scholar] [CrossRef]
- Que, F.; Wang, G.; Feng, K.; Xu, Z.S.; Wang, F.; Xiong, A.S. Hypoxia enhances lignification and affects the anatomical structure in hydroponic cultivation of carrot taproot. Plant Cell Rep. 2018, 37, 1021–1032. [Google Scholar] [CrossRef]
- Bansal, R.; Srivastava, J.P. Effect of waterlogging on photosynthetic and biochemical parameters in pigeonpea. Russ. J. Plant Physiol. 2015, 62, 322–327. [Google Scholar] [CrossRef]
- Braun, K.P.; Cody, R.B., Jr.; Jones, D.R.; Peterson, C.M. A structural assignment for a stable acetaldehyde-lysine adduct. J. Biol. Chem. 1995, 270, 11263–11266. [Google Scholar] [CrossRef]
- An, Y.; Qi, L.; Wang, L. ALA pretreatment improves waterlogging tolerance of fig plants. PLoS ONE 2016, 11, e0147202. [Google Scholar] [CrossRef]
- Ahsan, N.; Lee, D.G.; Lee, S.H.; Lee, K.W.; Bahk, J.D.; Lee, B.H. A proteomic screen and identification of waterlogging regulated proteins in tomato roots. Plant Soil 2007, 295, 37–51. [Google Scholar] [CrossRef]
- Li, J.; Sun, J.; Yang, Y.; Guo, S.; Glick, B.R. Identification of hypoxic-responsive proteins in cucumber roots using a proteomic approach. Plant Physiol. Biochem. 2012, 51, 74–80. [Google Scholar] [CrossRef] [PubMed]
- Xu, X.; Wang, H.; Qi, X.; Xu, Q.; Chen, X. Waterlogging-induced increase in fermentation and related gene expression in the root of cucumber (CucumissativusL.). Sci. Hortic 2014, 179, 388–395. [Google Scholar]
- He, L.; Li, B.; Lu, X.; Yuan, L.; Yang, Y.; Yuan, Y.; Du, J.; Guo, S. The effect of exogenous calcium on mitochondria, respiratory metabolism enzymes and ion transport in cucumber roots under hypoxia. Sci. Rep. 2015, 5, 11391. [Google Scholar] [CrossRef] [PubMed]
- Xu, X.; Ji, J.; Ma, X.; Xu, Q.; Qi, X.; Chen, X. Comparative proteomic analysis provides insight into the key proteins involved in cucumber (Cucumissativus L.) Adventitious root emergence under waterlogging stress. Front. Plant Sci. 2016, 7, 1515. [Google Scholar] [CrossRef]
- Hou, Y.; Jiang, F.; Zheng, X.; Wu, Z. Identification and analysis of oxygen responsive microRNAs in the root of wild tomato (S. habrochaites). BMC Plant Biol. 2019, 19, 100. [Google Scholar] [CrossRef]
- Kuo, C.G.; Chen, B.W. Physiological responses of tomato cultivars to flooding. J. Am. Soc. Hort. Sci. 1980, 105, 751–755. [Google Scholar]
- Ezin, V.; Pena, R.D.L.; Ahanchede, A. Flooding tolerance of tomato genotypes during vegetative and reproductive stages. Braz. J. Plant Physiol. 2010, 22, 131–142. [Google Scholar] [CrossRef]
- Safavi-Rizi, V.; Herde, M.; Stöhr, C. RNA-Seq reveals novel genes and pathways associated with hypoxia duration and tolerance in tomato root. Sci. Rep. 2020, 10, 1692. [Google Scholar] [CrossRef]
- Justin, S.H.F.W.; Armstrong, W. The anatomical characteristics of roots and plant response to soil flooding. New Phytol. 1987, 106, 465–495. [Google Scholar] [CrossRef]
- Jackson, M.B. Plant survival in wet environments: Resilience and escape mediated by shoot systems. In Wetlands: Functioning, Biodiversity, Conservation and Restoration. Ecological Studies (Analysis and Synthesis); Bobbink, R., Beltman, B., Verhoeven, J.T.A., Whigham, D.F., Eds.; Springer: Berlin/Heidelberg, Germany, 2006; Volume 191, pp. 16–36. [Google Scholar]
- Voesenek, L.A.C.J.; Colmer, T.D.; Pierik, R.; Millenaar, F.F.; Peeters, A.J.M. How plants cope with complete submergence. New Phytol. 2006, 170, 213–226. [Google Scholar] [CrossRef] [PubMed]
- Shimamura, S.; Yamamoto, R.; Nakamura, T.; Shimada, S.; Komatsu, S. Stem hypertrophic lenticels and secondary aerenchyma enable oxygen transport to roots of soybean in flooded soil. Ann. Bot. 2010, 106, 277–284. [Google Scholar] [CrossRef] [PubMed]
- Zeng, F.; Shabala, L.; Zhou, M.; Zhang, G.; Shabala, S. Barley responses to combined waterlogging and salinity stress: Separating effects of oxygen deprivation and elemental toxicity. Front. Plant Sci. 2013, 4, 313. [Google Scholar] [CrossRef] [PubMed]
- Herzog, M.; Striker, G.G.; Colmer, T.D.; Pedersen, O. Mechanisms of waterlogging tolerance in wheat–a review of root and shoot physiology. Plant Cell Environ. 2016, 39, 1068–1086. [Google Scholar] [CrossRef]
- Irfan, M.; Hayat, S.; Hayat, Q.; Afroz, S.; Ahmad, A. Physiological and biochemical changes in plants under waterlogging. Protoplasma 2010, 241, 3–17. [Google Scholar] [CrossRef]
- Pimentel, P.; Alamada, R.D.; Salvatierra, A.; Toro, G.; Arismendi, M.J.; Pinto, M.T.; Sagredo, B.; Pinto, M. Physiological and morphological responses of Prunus species with different degree of tolerance to long-term root hypoxia. Sci. Hortic. 2014, 180, 14–23. [Google Scholar] [CrossRef]
- Ren, B.; Zhang, J.; Dong, S.; Liu, P.; Zhao, B. Effects of waterlogging on leaf mesophyll cell ultrastructure and photosynthetic characteristics of summer maize. PLoS ONE 2016, 11, e0161424. [Google Scholar] [CrossRef]
- Stoddard, F.L.; Balko, C.; Erskine, W.; Khan, H.R.; Link, W.; Sarker, A. Screening techniques and sources of resistance to abiotic stresses in cool-season food legumes. Euphytica 2006, 147, 167–186. [Google Scholar] [CrossRef]
- Zhou, M. Improvement of plant waterlogging tolerance. In Waterlogging Signalling and Tolerance in Plants; Mancuso, S., Shabala, S., Eds.; Springer: Berlin/Heidelberg, Germany, 2010; pp. 267–285. [Google Scholar]
- Zhou, M. Accurate phenotyping reveals better QTL for waterlogging tolerance in barley. Plant Breed. 2011, 130, 203–208. [Google Scholar] [CrossRef]
- Zou, X.; Hu, C.; Zeng, L.; Cheng, Y.; Xu, M.; Zhang, X. A Comparison of screening methods to identify waterlogging tolerance in the field in Brassica napus L. during plant ontogeny. PLoS ONE 2014, 9, e89731. [Google Scholar] [CrossRef]
- Smillie, R.M.; Hetherington, S.E. Stress tolerance and stress-induced injury in crop plants measured by chlorophyll fluorescence in vivo: Chilling, freezing, ice cover, heat, and high light. Plant Physiol. 1983, 72, 1043–1050. [Google Scholar] [CrossRef] [PubMed]
- Smethurst, C.F.; Shabala, S. Screening methods for waterlogging tolerance in lucerne: Comparative analysis of waterlogging effects on chlorophyll fluorescence, photosynthesis, biomass and chlorophyll content. Funct. Plant Biol. 2003, 30, 335–343. [Google Scholar] [CrossRef] [PubMed]
- Pang, J.Y.; Zhou, M.H.; Mendham, N.J.; Shabala, S. Growth and physiological responses of six barley genotypes to waterlogging and subsequent recovery. Aust. J. Agric. Res. 2004, 55, 895–906. [Google Scholar] [CrossRef]
- Bertholdsson, N.O. Screening for barley waterlogging tolerance in nordic barley cultivars (Hordeumvulgare L.) using chlorophyll fluorescence on hydroponically-grown plants. Agronomy 2013, 3, 376–390. [Google Scholar] [CrossRef]
- Pan, R.; Jiang, W.; Wang, Q.; Xu, L.; Shabala, S.; Zhang, W.Y. Differential response of growth and photosynthesis in diverse cotton genotypes under hypoxia stress. Photosynthetica 2019, 57, 772–779. [Google Scholar] [CrossRef]
- Cao, X.; Jiang, X.; Wang, X.; Zang, Y.; Wu, Z. Comprehensive evaluation and screening for chilling-tolerance in tomato lines at the seedling stage. Euphytica 2015, 205, 569–584. [Google Scholar] [CrossRef]
- Zhou, R.; Yu, X.; Kjær, K.H.; Rosenqvist, E.; Ottosen, C.O.; Wu, Z. Screening and validation of tomato genotypes under heat stress using Fv/Fm to reveal the physiological mechanism of heat tolerance. Environ. Exp. Bot. 2015, 118, 1–11. [Google Scholar] [CrossRef]
- Dasgan, H.Y.; Aktas, H.; Abak, K.; Cakmak, I. Determination of screening techniques of salinity tolerance in tomatoes and investigation of genotype responses. Plant Sci. 2002, 163, 695–703. [Google Scholar] [CrossRef]
- Raza, M.A.; Saeed, A.; Munir, H.; Ziaf, K.; Shakeel, A.; Saeed, N.; Munawar, A.; Rehman, F. Screening of tomato genotypes for salinity tolerance based on early growth attributes and leaf inorganic osmolytes. Arch. Agron. Soil Sci. 2017, 63, 501–512. [Google Scholar] [CrossRef]
- Qi, X.; Chen, R.; Xu, Q.; Chen, X. Preliminary analysis of cucumber submergence tolerance at seedling stage. China Veg. 2011, 4, 7. [Google Scholar]
- Stirbet, A.; Govindjee. On the relation between the Kautsky effect (chlorophyll a fluorescence induction) and photosystem II: Basics and applications of the OJIP fluorescence transient. J. Photochem. Photobiol. B Biol. 2011, 104, 236–257. [Google Scholar] [CrossRef] [PubMed]
- Stirbet, A.; Lazár, D.; Kromdijk, J.; Govindjee. Chlorophyll a fluorescence induction: Can just a one-second measurement be used to quantify abiotic stress responses? Photosynthetica 2018, 56, 86–104. [Google Scholar] [CrossRef]
- Jackson, M.B. Long-distance signalling from roots to shoots assessed: The flooding story. J. Exp. Bot. 2002, 53, 175–181. [Google Scholar] [CrossRef] [PubMed]
- Dat, J.F.; Capelli, N.; Folzer, H.; Bourgeade, P.; Badot, P.M. Sensing and signalling during plant flooding. Plant Physiol. Biochem. 2004, 42, 273–282. [Google Scholar] [CrossRef]
- Sasidharan, R.; Hartman, S.; Liu, Z.; Martopawiro, S.; Sajeev, N.; van Veen, H.; Yeung, E.; Voesenek, L.A. Signal dynamics and interactions during flooding stress. Plant Physiol. 2018, 176, 1106–1117. [Google Scholar] [CrossRef]
- Ashraf, M.H.P.J.C.; Harris, P.J. Photosynthesis under stressful environments: An overview. Photosynthetica 2013, 51, 163–190. [Google Scholar] [CrossRef]
- Tsimilli-Michael, M. Revisiting JIP-test: An educative review on concepts, assumptions, approximations, definitions and terminology. Photosynthetica 2019, 58, 275–292. [Google Scholar] [CrossRef]
- Kalaji, H.M.; Rastogi, A.; Živčák, M.; Brestic, M.; Daszkowska-Golec, A.; Sitko, K.; Alsharafa, K.Y.; Lotfi, R.; Stypiński, P.; Samborska, I.A.; et al. Prompt chlorophyll fluorescence as a tool for crop phenotyping: An example of barley landraces exposed to various abiotic stress factors. Photosynthetica 2018, 56, 953–961. [Google Scholar] [CrossRef]
- Maxwell, K.; Johnson, G.N. Chlorophyll fluorescence—A practical guide. J. Exp. Bot. 2000, 51, 659–668. [Google Scholar] [CrossRef]
- Panda, D.; Rao, D.N.; Sharma, S.G.; Strasser, R.J.; Sarkar, R.K. Submergence effects on rice genotypes during seedling stage: Probing of submergence driven changes of photosystem 2 by chlorophyll a fluorescence induction OJIP transients. Photosynthetica 2006, 44, 69–75. [Google Scholar] [CrossRef]
- Roháček, K. Chlorophyll fluorescence parameters: The definitions, photosynthetic meaning, and mutual relationships. Photosynthetica 2002, 40, 13–29. [Google Scholar] [CrossRef]
- He, L.; Yu, L.; Li, B.; Du, N.; Guo, S. The effect of exogenous calcium on cucumber fruit quality, photosynthesis, chlorophyll fluorescence, and fast chlorophyll fluorescence during the fruiting period under hypoxic stress. BMC Plant Biol. 2018, 18, 180. [Google Scholar] [CrossRef] [PubMed]
- Barik, J.; Panda, D.; Mohanty, S.K.; Lenka, S.K. Leaf photosynthesis and antioxidant response in selected traditional rice landraces of Jeypore tract of Odisha, India to submergence. Physiol. Mol. Biol. Plants 2019, 25, 847–863. [Google Scholar] [CrossRef] [PubMed]
- Ma, Y.H.; Guo, S.R. 24-epibrassinolide improves cucumber photosynthesis under hypoxia by increasing CO2 assimilation and photosystem II efficiency. Photosynthetica 2014, 52, 96–104. [Google Scholar] [CrossRef]
- Hüther, C.M.; Martinazzo, E.G.; Rombaldi, C.V.; Bacarin, M.A. Effects of flooding stress in ‘Micro-Tom’ tomato plants transformed with different levels of mitochondrial sHSP23.6. Braz.J. Biol. 2017, 77, 43–51. [Google Scholar] [CrossRef]
- Mauro, R.P.; Agnello, M.; Distefano, M.; Sabatino, L.; Primo, A.S.B.; Leonardi, C.; Giuffrida, F. Chlorophyll fluorescence, photosynthesis and growth of tomato plants as affected by long-term oxygen root zone deprivation and grafting. Agronomy 2020, 10, 137. [Google Scholar] [CrossRef]
- Lin, H.H.; Lin, K.H.; Syu, J.Y.; Tang, S.Y.; Lo, H.F. Physiological and proteomic analysis in two wild tomato lines under waterlogging and high temperature stress. J. Plant Biochem. Biotechnol. 2016, 25, 87–96. [Google Scholar] [CrossRef]
- Xu, L.; Pan, R.; Shabala, L.; Shabala, S.; Zhang, W.Y. Temperature influences waterlogging stress-induced damage in Arabidopsis through the regulation of photosynthesis and hypoxia-related genes. Plant Growth Regul. 2019, 89, 143–152. [Google Scholar] [CrossRef]
- Yang, B.Z.; Liu, Z.B.; Zhou, S.D.; Ou, L.J.; Dai, X.Z.; Ma, Y.Q.; Zhang, Z.Q.; Chen, W.C.; Li, X.F.; Liang, C.L.; et al. Exogenous Ca2+ alleviates waterlogging-caused damages to pepper. Photosynthetica 2016, 54, 620–629. [Google Scholar] [CrossRef]
- Zhang, F.; Zhu, K.; Wang, Y.Q.; Zhang, Z.P.; Lu, F.; Yu, H.Q.; Zou, J.Q. Changes in photosynthetic and chlorophyll fluorescence characteristics of sorghum under drought and waterlogging stress. Photosynthetica 2019, 57, 1156–1164. [Google Scholar] [CrossRef]
- Pociecha, E.; Kościelniak, J.; Filek, W. Effects of root flooding and stage of development on the growth and photosynthesis of field bean (Viciafaba L. minor). Acta Physiol. Plant. 2008, 30, 529–535. [Google Scholar] [CrossRef]


| Cucumis sativus L. | Solanum lycopersicum L. | Origin | ||
|---|---|---|---|---|
| Accession | Breeding Status | Accession | Breeding Status | |
| GROT MARKUS TYTUS B1F1 B2F1 DH1 DH2 DH3 DH4 | F1 cultivar F1 cultivar F1 cultivar Parthenocarpic cultivar Parthenocarpic cultivar Double haploid line Double haploid line Double haploid line Double haploid line | POL 1/15 POL 2/15 POL 3/15 POL 4/15 POL 5/15 POL 6/15 POL 7/15 POL 8/15 | F1 cultivar Breeding line BC Breeding line Breeding line Breeding line Breeding line Breeding line BC Breeding line | KHiNO Polan, PL |
| PGZ-1 GMG-30 GM-50 G404 G598 | Breeding line Breeding line Breeding line F1 cultivar F1 cultivar | PZ 115 PZ 215 PZ 315 PZ 415 PZ 515 PZ 615 PZ 715 PZ 815 | Cultivar Cultivar F1 cultivar Cultivar F1 cultivar Cultivar Cultivar Cultivar | PlantiCo, PL |
| NOE1 NOE2 NOE3 NOE4 NOE5 | F1 cultivar F1 cultivar F1 cultivar F1 cultivar F1 cultivar | Spójnia HiNO | ||
| Parameter | Cluster 1 | Cluster 2 | p-Value |
|---|---|---|---|
| % weight change | 97 | 103 | 0.0000 |
| % height change | 93 | 88 | 0.0136 |
| Relative leaf number | 1.11 | 1.05 | 0.1955 |
| F0 | 444 | 464 | 0.0000 |
| Fm | 2496 | 2397 | 0.0000 |
| Fv | 2052 | 1932 | 0.0000 |
| Fv/F0 | 4.65 | 4.22 | 0.0000 |
| Fv/Fm | 0.82 | 0.80 | 0.0000 |
| Tfm | 172 | 171 | 0.8759 |
| Area | 27,039 | 22,302 | 0.0000 |
| Fm/F0 | 5.65 | 5.22 | 0.0000 |
| PI ABS | 1.11 | 0.79 | 0.0000 |
| ABS/RC | 3.29 | 3.54 | 0.0000 |
| TR0/RC | 2.71 | 2.84 | 0.0000 |
| ET0/RC | 1.15 | 1.07 | 0.0000 |
| DI0/RC | 0.59 | 0.70 | 0.0000 |
| ET0/ABS | 0.35 | 0.31 | 0.0000 |
| ET0/TR0 | 0.43 | 0.38 | 0.0000 |
| Parameter | GM-50 Control | GM-50 Stress | p-Value | G404 Control | G404 Stress | p-Value |
|---|---|---|---|---|---|---|
| % weight change | 100 | 85 | 0.0000 | 100 | 93 | 0.0244 |
| % height change | 100 | 67 | 0.0000 | 100 | 65 | 0.0000 |
| Relative leaf number | 1.05 | 1.33 | 0.1529 | 1.30 | 0.78 | 0.0010 |
| F0 | 423 | 439 | 0.0907 | 437 | 464 | 0.0696 |
| Fm | 2484 | 2569 | 0.1993 | 2453 | 2521 | 0.2838 |
| Fv | 2060 | 2130 | 0.2541 | 2016 | 2057 | 0.5182 |
| Fv/F0 | 4.88 | 4.85 | 0.8237 | 4.66 | 4.46 | 0.3244 |
| Fv/Fm | 0.83 | 0.83 | 0.7230 | 0.82 | 0.82 | 0.3969 |
| Tfm | 176 | 179 | 0.7788 | 164 | 186 | 0.0351 |
| Area | 29,868 | 29,264 | 0.6359 | 27,051 | 26,648 | 0.7991 |
| Fm/F0 | 5.88 | 5.85 | 0.8226 | 5.66 | 5.46 | 0.3243 |
| PI ABS | 1.13 | 1.21 | 0.3860 | 1.26 | 1.10 | 0.2351 |
| ABS/RC | 3.40 | 3.31 | 0.2075 | 3.24 | 3.37 | 0.2383 |
| TR0/RC | 2.82 | 2.74 | 0.1317 | 2.66 | 2.74 | 0.2851 |
| ET0/RC | 1.23 | 1.21 | 0.5859 | 1.20 | 1.21 | 0.7823 |
| DI0/RC | 0.58 | 0.57 | 0.6829 | 0.58 | 0.63 | 0.2378 |
| ET0/ABS | 0.36 | 0.37 | 0.8337 | 0.37 | 0.36 | 0.4029 |
| ET0/TR0 | 0.44 | 0.44 | 0.8227 | 0.45 | 0.44 | 0.4775 |
| Parameter | GMG-30 Control | GMG-30 Stress | p-Value | TYTUS Control | TYTUS Stress | p-Value |
|---|---|---|---|---|---|---|
| % weight change | 100 | 100 | 0.5298 | 100 | 99 | 0.8431 |
| % height change | 100 | 72 | 0.0000 | 100 | 62 | 0.0000 |
| Relative leaf number | 0.86 | 1.23 | 0.0838 | 1.52 | 1.05 | 0.0082 |
| F0 | 413 | 456 | 0.0605 | 450 | 469 | 0.1380 |
| Fm | 2441 | 2405 | 0.6090 | 2527 | 2371 | 0.0049 |
| Fv | 2029 | 1949 | 0.3058 | 2077 | 1902 | 0.0023 |
| Fv/F0 | 4.93 | 4.42 | 0.0550 | 4.63 | 4.10 | 0.0057 |
| Fv/Fm | 0.83 | 0.81 | 0.0820 | 0.82 | 0.80 | 0.0035 |
| Tfm | 173 | 159 | 0.2001 | 172 | 179 | 0.4821 |
| Area | 26,474 | 24,396 | 0.1341 | 27,277 | 22,771 | 0.0044 |
| Fm/F0 | 5.93 | 5.42 | 0.0549 | 5.63 | 5.10 | 0.0057 |
| PI ABS | 1.30 | 0.99 | 0.0357 | 1.04 | 0.75 | 0.0323 |
| ABS/RC | 3.24 | 3.51 | 0.0599 | 3.28 | 3.41 | 0.0802 |
| TR0/RC | 2.69 | 2.82 | 0.1082 | 2.69 | 2.73 | 0.4889 |
| ET0/RC | 1.21 | 1.17 | 0.1676 | 1.11 | 0.97 | 0.0139 |
| DI0/RC | 0.55 | 0.69 | 0.0734 | 0.58 | 0.68 | 0.0052 |
| ET0/ABS | 0.38 | 0.34 | 0.0247 | 0.34 | 0.29 | 0.0161 |
| ET0/TR0 | 0.45 | 0.42 | 0.0286 | 0.42 | 0.36 | 0.0200 |
| Parameter | Cluster 1 | Cluster 2 | p-Value |
|---|---|---|---|
| % weight change | 102 | 102 | 0.798161 |
| % height change | 94 | 84 | 0.493144 |
| Relative leaf number | 1.15 | 1.00 | 0.557965 |
| F0 | 452 | 511 | 0.000249 |
| Fm | 2374 | 2260 | 0.002449 |
| Fv | 1922 | 1749 | 0.000067 |
| Fv/F0 | 4.28 | 3.61 | 0.000000 |
| Fv/Fm | 0.81 | 0.77 | 0.000074 |
| Tfm | 188 | 209 | 0.015459 |
| Area | 19,702 | 16,086 | 0.000004 |
| Fm/F0 | 5.25 | 4.46 | 0.000001 |
| PI ABS | 1.00 | 0.65 | 0.000000 |
| ABS/RC | 3.23 | 3.85 | 0.000323 |
| TR0/RC | 2.60 | 2.88 | 0.000195 |
| ET0/RC | 1.07 | 0.99 | 0.015152 |
| DI0/RC | 0.62 | 0.98 | 0.001677 |
| ET0/ABS | 0.33 | 0.27 | 0.000000 |
| ET0/TR0 | 0.41 | 0.35 | 0.000000 |
| Parameter | POL 7/15 Control | POL 7/15 Stress | p-Value | POL 8/15 Control | POL 8/15 Stress | p-Value | PZ 715 Control | PZ 715 Stress | p-Value |
|---|---|---|---|---|---|---|---|---|---|
| % weight change | 100 | 117 | 0.0005 | 100 | 103 | 0.6168 | 100 | 105 | 0.0282 |
| % height change | 100 | 70 | 0.0239 | 100 | 72 | 0.0255 | 100 | 81 | 0.0537 |
| Relative leaf number | 1.10 | 1.05 | 0.8010 | 0.95 | 1.00 | 0.7699 | 1.00 | 0.68 | 0.0671 |
| F0 | 441 | 447 | 0.6030 | 429 | 453 | 0.2131 | 439 | 496 | 0.0002 |
| Fm | 2259 | 2317 | 0.5088 | 2416 | 2324 | 0.1287 | 2292 | 2468 | 0.0413 |
| Fv | 1818 | 1869 | 0.5695 | 1987 | 1871 | 0.0507 | 1853 | 1972 | 0.1355 |
| Fv/F0 | 4.17 | 4.20 | 0.9211 | 4.65 | 4.22 | 0.0411 | 4.22 | 3.99 | 0.1858 |
| Fv/Fm | 0.80 | 0.81 | 0.5391 | 0.82 | 0.80 | 0.0417 | 0.81 | 0.80 | 0.1699 |
| Tfm | 178 | 191 | 0.3619 | 187 | 213 | 0.1696 | 177 | 196 | 0.3126 |
| Area | 19,874 | 20,181 | 0.8558 | 20,194 | 17,879 | 0.0592 | 19,530 | 19,283 | 0.8493 |
| Fm/F0 | 5.17 | 5.20 | 0.9215 | 5.65 | 5.22 | 0.0411 | 5.22 | 4.99 | 0.1862 |
| PI ABS | 1.13 | 0.95 | 0.3583 | 1.32 | 0.94 | 0.0108 | 0.90 | 0.82 | 0.3596 |
| ABS/RC | 3.15 | 3.18 | 0.8164 | 2.97 | 3.37 | 0.0003 | 3.49 | 3.35 | 0.1196 |
| TR0/RC | 2.51 | 2.56 | 0.3718 | 2.44 | 2.71 | 0.0002 | 2.82 | 2.67 | 0.0495 |
| ET0/RC | 1.04 | 1.05 | 0.8469 | 1.08 | 1.11 | 0.4794 | 1.19 | 1.08 | 0.0013 |
| DI0/RC | 0.65 | 0.62 | 0.6056 | 0.53 | 0.66 | 0.0035 | 0.67 | 0.68 | 0.9076 |
| ET0/ABS | 0.34 | 0.33 | 0.7765 | 0.36 | 0.33 | 0.0726 | 0.34 | 0.32 | 0.1381 |
| ET0/TR0 | 0.42 | 0.41 | 0.7011 | 0.44 | 0.41 | 0.1028 | 0.42 | 0.40 | 0.1901 |
| Parameter | PZ 115 Control | PZ 115 Stress | p-Value | PZ 215 Control | PZ 215 Stress | p-Value |
|---|---|---|---|---|---|---|
| % weight change | 100 | 109 | 0.0160 | 100 | 109 | 0.0332 |
| % height change | 100 | 211 | 0.0001 | 100 | 11 | 0.0000 |
| Relative leaf number | 0.00 | 0.20 | 0.0527 | 0.53 | 0.16 | 0.0160 |
| F0 | 454 | 491 | 0.1741 | 456 | 677 | 0.0069 |
| Fm | 2502 | 2274 | 0.0065 | 2371 | 2211 | 0.0645 |
| Fv | 2048 | 1783 | 0.0051 | 1915 | 1534 | 0.0053 |
| Fv/F0 | 4.54 | 3.80 | 0.0149 | 4.22 | 2.82 | 0.0014 |
| Fv/Fm | 0.82 | 0.78 | 0.0328 | 0.81 | 0.68 | 0.0034 |
| Tfm | 210 | 259 | 0.0775 | 183 | 244 | 0.0000 |
| Area | 19,309 | 15,832 | 0.0864 | 20,171 | 13,332 | 0.0010 |
| Fm/F0 | 5.54 | 4.80 | 0.0149 | 5.22 | 3.82 | 0.0014 |
| PI ABS | 1.10 | 0.73 | 0.0201 | 0.97 | 0.43 | 0.0008 |
| ABS/RC | 3.46 | 3.89 | 0.0448 | 3.20 | 5.13 | 0.0009 |
| TR0/RC | 2.82 | 3.00 | 0.0866 | 2.58 | 3.22 | 0.0000 |
| ET0/RC | 1.21 | 1.15 | 0.0975 | 1.04 | 0.97 | 0.3251 |
| DI0/RC | 0.64 | 0.89 | 0.0445 | 0.62 | 1.91 | 0.0051 |
| ET0/ABS | 0.36 | 0.31 | 0.0313 | 0.33 | 0.23 | 0.0019 |
| ET0/TR0 | 0.43 | 0.39 | 0.0466 | 0.41 | 0.31 | 0.0036 |
© 2020 by the authors. Licensee MDPI, Basel, Switzerland. This article is an open access article distributed under the terms and conditions of the Creative Commons Attribution (CC BY) license (http://creativecommons.org/licenses/by/4.0/).
Share and Cite
Kołton, A.; Kęska, K.; Czernicka, M. Selection of Tomato and Cucumber Accessions for Waterlogging Sensitivity through Morpho-Physiological Assessment at an Early Vegetative Stage. Agronomy 2020, 10, 1490. https://doi.org/10.3390/agronomy10101490
Kołton A, Kęska K, Czernicka M. Selection of Tomato and Cucumber Accessions for Waterlogging Sensitivity through Morpho-Physiological Assessment at an Early Vegetative Stage. Agronomy. 2020; 10(10):1490. https://doi.org/10.3390/agronomy10101490
Chicago/Turabian StyleKołton, Anna, Kinga Kęska, and Małgorzata Czernicka. 2020. "Selection of Tomato and Cucumber Accessions for Waterlogging Sensitivity through Morpho-Physiological Assessment at an Early Vegetative Stage" Agronomy 10, no. 10: 1490. https://doi.org/10.3390/agronomy10101490
APA StyleKołton, A., Kęska, K., & Czernicka, M. (2020). Selection of Tomato and Cucumber Accessions for Waterlogging Sensitivity through Morpho-Physiological Assessment at an Early Vegetative Stage. Agronomy, 10(10), 1490. https://doi.org/10.3390/agronomy10101490