Article

Faba Bean and Pea Can Provide Late-Fall Forage Grazing without Affecting Maize Yield the Following Season

1
Department of Soil Sciences, North Dakota State University, Fargo, ND 58108, USA
2
Department of Plant Sciences, North Dakota State University, PO Box 6050, Fargo, ND 58108, USA
*
Author to whom correspondence should be addressed.
Agronomy 2020, 10(1), 80; https://doi.org/10.3390/agronomy10010080
Submission received: 19 November 2019 / Revised: 30 December 2019 / Accepted: 31 December 2019 / Published: 6 January 2020
(This article belongs to the Special Issue Sustainable Cropping Systems)

Abstract

:
Faba bean (Vicia faba Roth) and pea (Pisum sativum L.) are grown worldwide as protein sources for food and feed and can be used as cover crops after wheat (Triticum aestivum L.). However, faba bean is underutilized in upper Midwest farming systems. This study was conducted to determine how faba bean relates to pea as a forage, cover crop, and in cycling of nutrients to maize (Zea mays L.) in the following season. Five faba bean cultivars and two pea cultivars, a forage pea and a field pea, were established after wheat harvest in North Dakota, in 2017 and 2018. Faba bean and pea cultivars averaged 1.3 Mg ha−1 of biomass, enough to support 1.5 animal unit month (AUM) ha−1 for a 450 kg cow (Bos taurus L.) with calf, at 50% harvest efficiency. Crude protein content was highest in faba bean cv. Boxer (304 g kg−1), with faba bean cv. Laura and forage pea cv. Arvika having similar content, and field pea having the least (264 g kg−1). Cover crop treatments did not affect maize in the following year, indicating no nutrient cycling from faba bean and pea to maize. Both cover crop species tested provided high protein forage, suitable for late grazing, with a more fibrous crop residue. Faba bean has potential as a cover crop in the upper Midwest while providing greater quality forage than pea.

1. Introduction

The Natural Resources Conservation Service (NRCS) defines cover crops as grasses, legumes, and forbs sown for seasonal vegetative cover [1]. Cover crops may be established between successive production crops, companion-sown, or relay-sown into production crops. Species and sowing dates that will not compete with the production crop yield or harvest may be used. According to the NRCS [1], cover crops may be used to reduce water and wind erosion, maintain or increase soil health and organic matter, increase water quality, suppress weeds and break pest cycles, enhance soil water conservation, and minimize soil compaction. Cover crops may be grazed as long as the conservation purposes are not compromised. Different species of cover crops are also often sown together in mixtures to fulfill multiple purposes at the same time [1].
Cover crops are gaining popularity throughout the USA, rising from 4 million ha in 2012 to 6 million ha in 2017 [2]. North Dakota’s cover crop acreage increased 89%, from 86,500 ha in 2012 to 163,600 ha in 2017 [2]. The use of cover crops is an important addition to upper Midwest farming systems in order to rebuild soil and reduce soil erosion [3].
One important use of legume cover crops is fall grazing, which can complement crop residue grazing. For cattle, crop residue grazing in the fall saves stored forage resources for winter feeding. In beef cattle production, feed is the most expensive part of the operation [4]. Wheat harvested in August leaves ample time for grazing of residue, and cover crop growth throughout the fall and into winter. Distributing cattle to graze, and effectively reducing the manure concentration in an area, could help ensure cattle health by reducing the spread of disease, along with reducing the need for manure management [5].
Pea is used for grazing and hay in mixtures with barley (Hordeum vulgare L.) or oat (Avena sativa L.) in the upper Midwest. Pea alone yields less than 2 Mg ha−1, which can increase to 5.7 Mg ha−1 when mixed with oat or forage barley [6]. Although differences in crude protein (CP) and biomass are not always seen when comparing forage and semi-leafless pea [7,8], depending on cultivar, forage pea can achieve greater biomass and crude protein yield than semi-leafless pea [9]. According to Anderson and Ilse [6], freshly weaned calves preferred pea and pea-barley hay to grass hay. Calves on pea and pea-barley hay, respectively, gained 304 g d−1 and 240 g d−1 more than calves on rations with grass hay alone, making pea hay 230% greater in value than the grass hay [6]. Due to the high CP content of some legumes leading to possible digestion issues, Amiri and Shariff [10] concluded that a combination of legume and grass species is safe a way to provide the needed feeding and protein requirements of grazing livestock.
Faba bean is not common in the upper Midwest, compared with other countries, where it is usually used in mixtures with oat, triticale (Triticosecale x Witt.), or barley [11,12,13,14]. Forage yield of oat-faba bean and triticale-faba bean mixtures fluctuated between 10 and 22 Mg ha−1 and total CP yield ranged between 1.0 and 3.3 Mg ha−1 in studies conducted in Greece [11,12]. In Canada, a faba bean–barley mixture had greater CP than a barley and barley–pea mixture [13], and silage maize–faba bean than maize [14]. Furthermore, faba bean silage had the highest CP content (220 g kg−1) compared with pea (178 g kg−1), and soybean [Glycine max (L.) Merr.] (197 g kg−1) [15]. Lambs (Ovis aries L.) grazing on faba bean grew significantly faster (220 g head−1 day−1) than lambs grazing on field pea (186 g d−1) [16].
There are significant differences in both biomass quantity and quality between faba bean cultivars. Wegi et al. [17] found biomass production between five cultivars ranged from 3.3 to 5.1 Mg ha−1. When comparing faba bean with forage pea, Iglesias and Lloveras [18] found that faba bean produced more biomass at pod fill than at initial flowering, but pea produced more biomass than most other cool-season legumes at earlier stages of development. Wichmann et al. [19] also found that pea had faster biomass accumulation than faba bean or blue lupin (Lupinus angustifolius L.).
Faba bean is grown as a winter annual in warm, temperate and subtropical areas. The hardiest European cultivars are able to tolerate temperatures down to -15 °C in vegetative stage without serious injury, but optimum temperatures for production are typically from 18 to 27 °C [20]. Field pea grown in the upper Midwest have shown ability to grow at temperatures down to -3 °C [21]. When compared with field pea, faba bean had slightly less winter-kill.
Faba bean has the highest reliance on N2 fixation for growth in comparison with other cool-season legumes, such as pea and lupin, which leads to high N credit for the following crops [22,23,24]. Faba bean has been shown to attain high amounts of N derived from the atmosphere (Ndfa), ranging between 75% and 90% of its total shoot N [22,23,24], whereas pea Ndfa ranged between 50% and 70% [20,23,24]. Jensen et al. [20] reported that, on a global average, faba bean fixes 154 kg N ha−1 and pea fixes 86 kg N ha−1. In addition, annual legumes can reduce NO3-N leaching by scavenging residual soil NO3-N, with shoot uptake values ranging from 92 to 276 kg N ha−1 for faba bean [20] and 104 kg N ha−1 for pea [23].
The possible legume benefits to the following crop are well known, but the data are inconsistent. Stevenson and van Kessell [25] concluded that wheat yield consistently was 43% greater when preceded by pea compared with wheat, with up to 14 of the extra 27 kg N ha−1 (Ndfa -total N content) accumulated in the wheat attributed to fixed N2 from the pea and the rest to non-N-related benefits. Beckie et al. [26] had similar results, finding that the benefit of pea residue to the following crop was 25 kg N ha−1, whereas Lupwayi and Soon [27] found that only 7.5 kg N ha−1 was released by pea residue to the subsequent crop. Faba bean was the only crop with a positive N balance after harvest when compared with lupin, pea, and oat [23], indicating it would be the only one providing soil mineral N to following crops [23]. Cupina et al. [28] found that field pea contributed 165 kg N ha−1 to the following crop after it was used as a cover crop over a mild winter. Couedel et al. [29] found that legume cover crops grown in the fall provided 35 to 54 kg N ha−1 as green manure to the following crop. These differences can be attributed to differences in soil type, moisture content, management, weather, especially rainfall, and how these factors affect the mineralization of plant tissue [20,27].
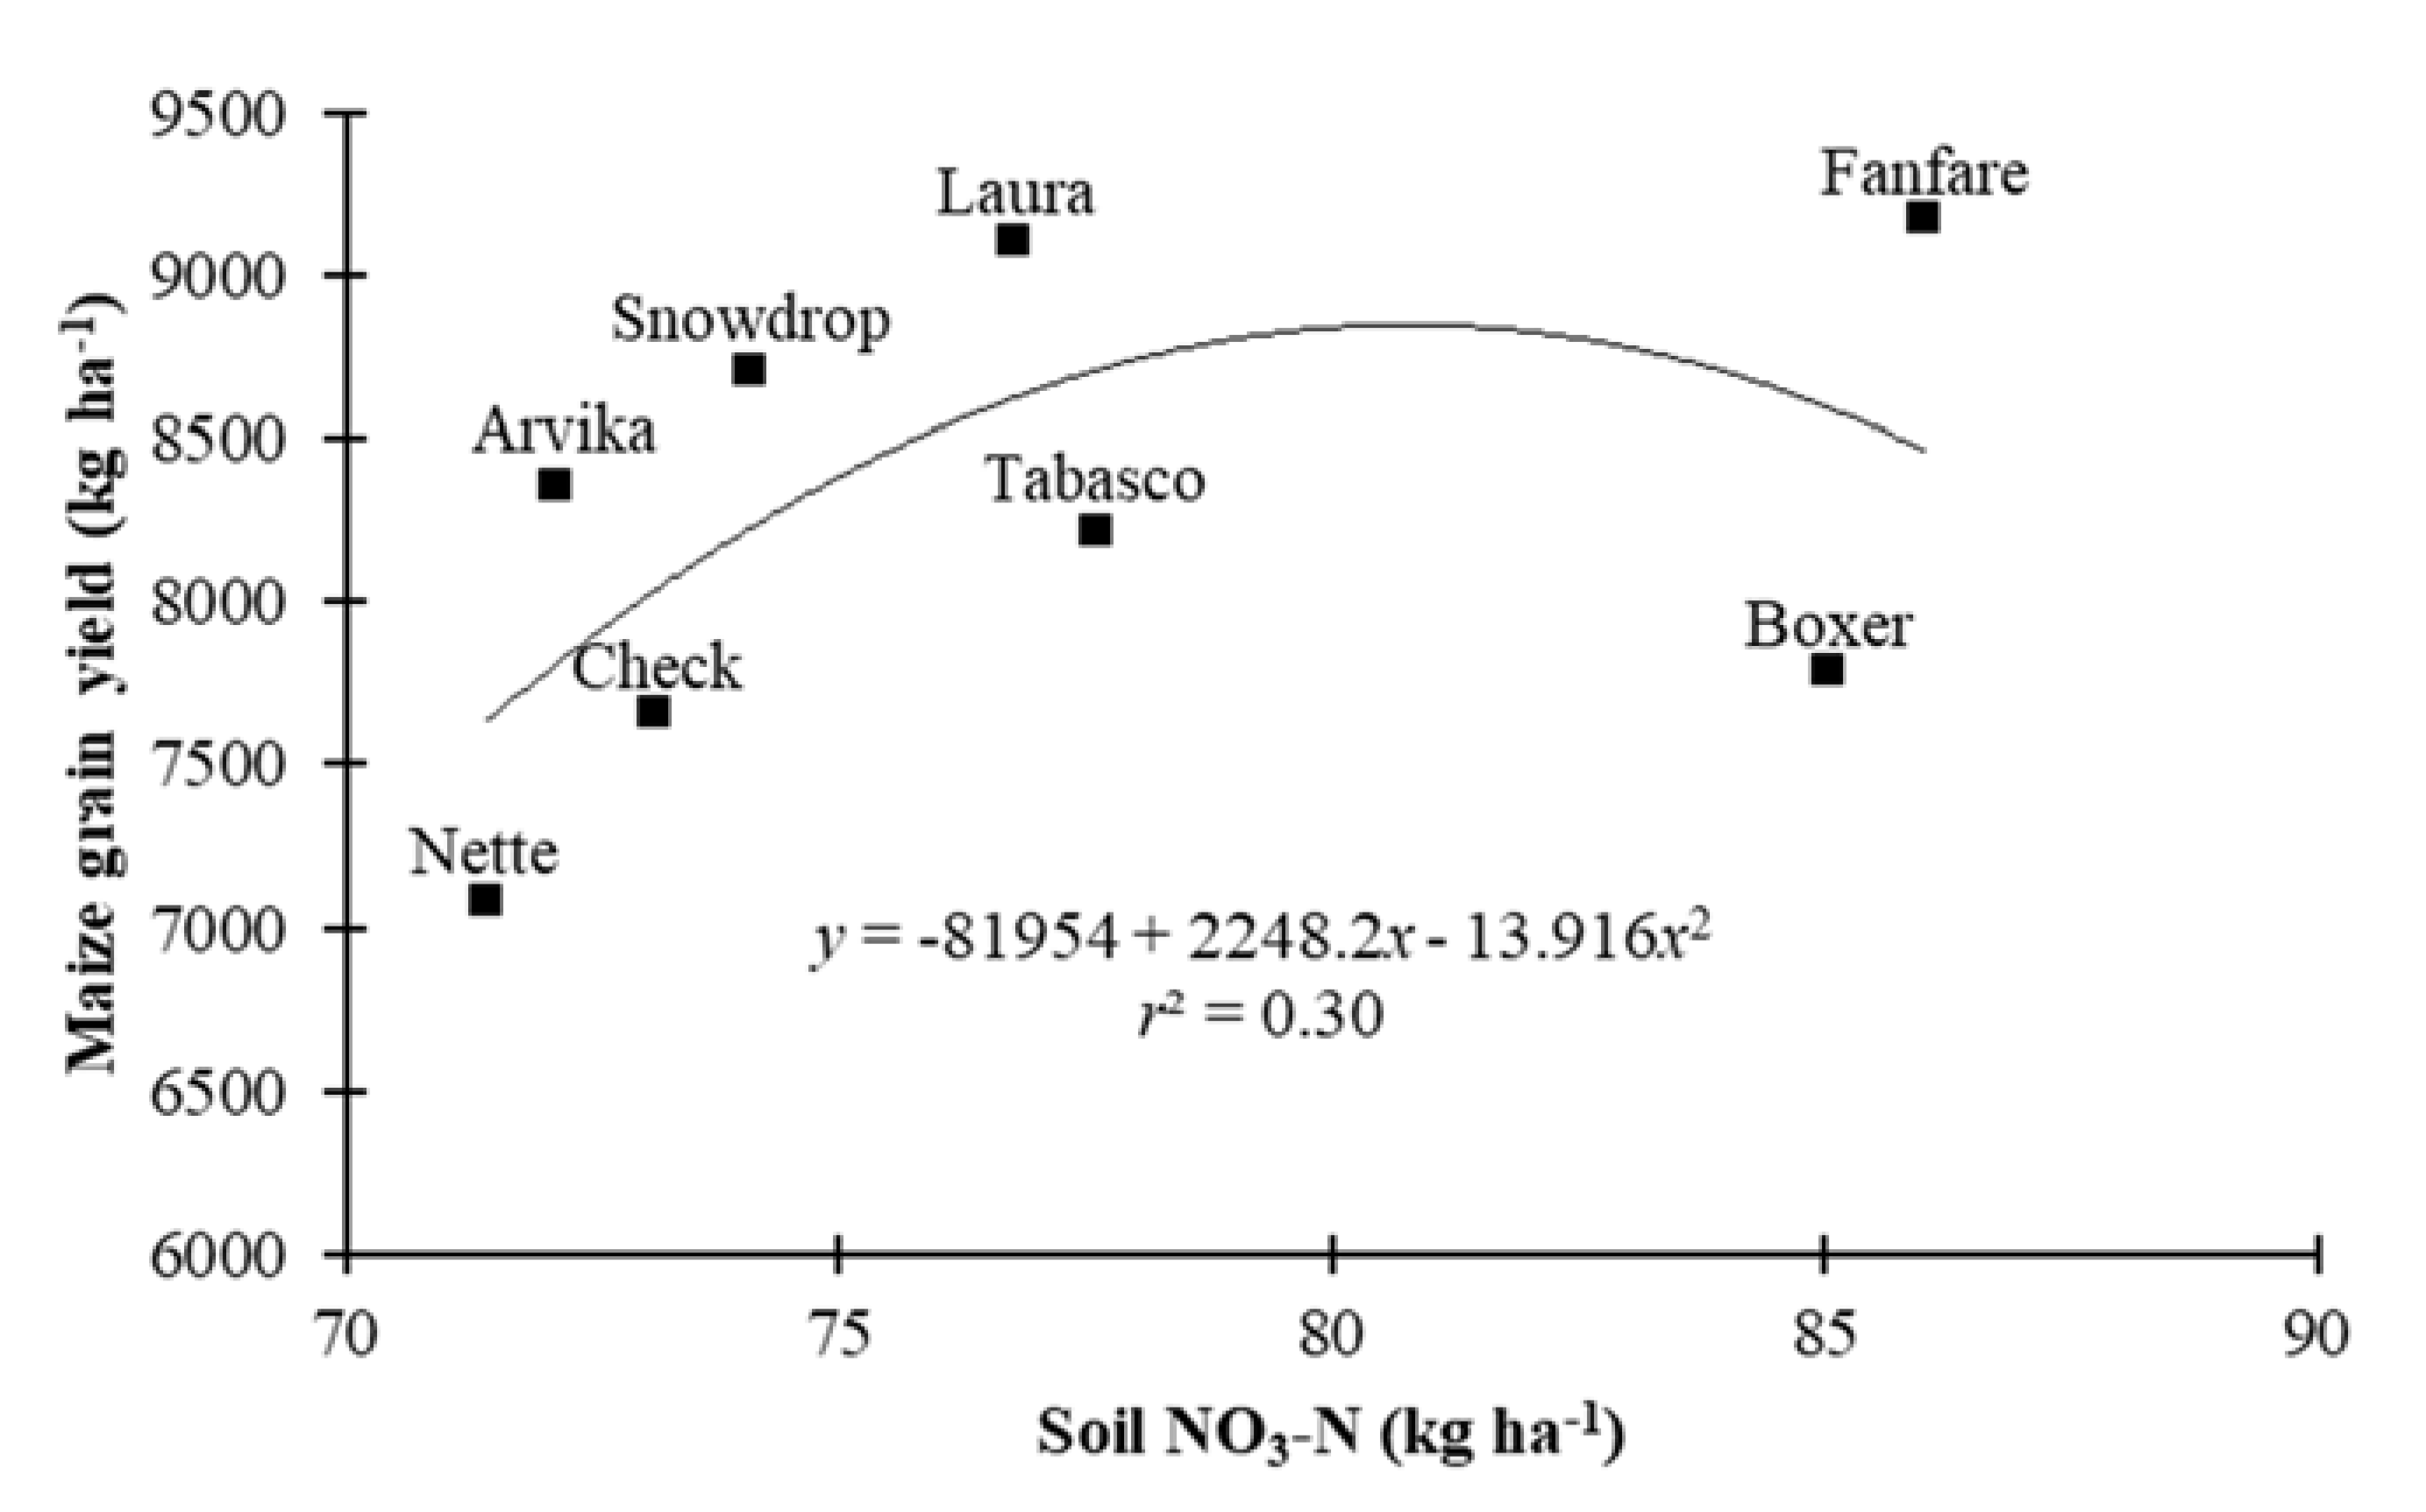
The North Dakota State University Extension [30] has evaluated faba bean as grain for food, however, very limited information and research has been done on faba bean as a cover crop and forage for grazing. In 2017, 3367 ha of faba bean for grain were reported in North Dakota [31]. Preliminary studies in North Dakota indicate that faba bean produces up to 680 kg of biomass yield with high crude protein and high digestibility for ruminants when sown in August after wheat in the northern Great Plains [3]. Faba bean has the potential to become an important cover crop in wheat-based or maize–soybean-based cropping systems.
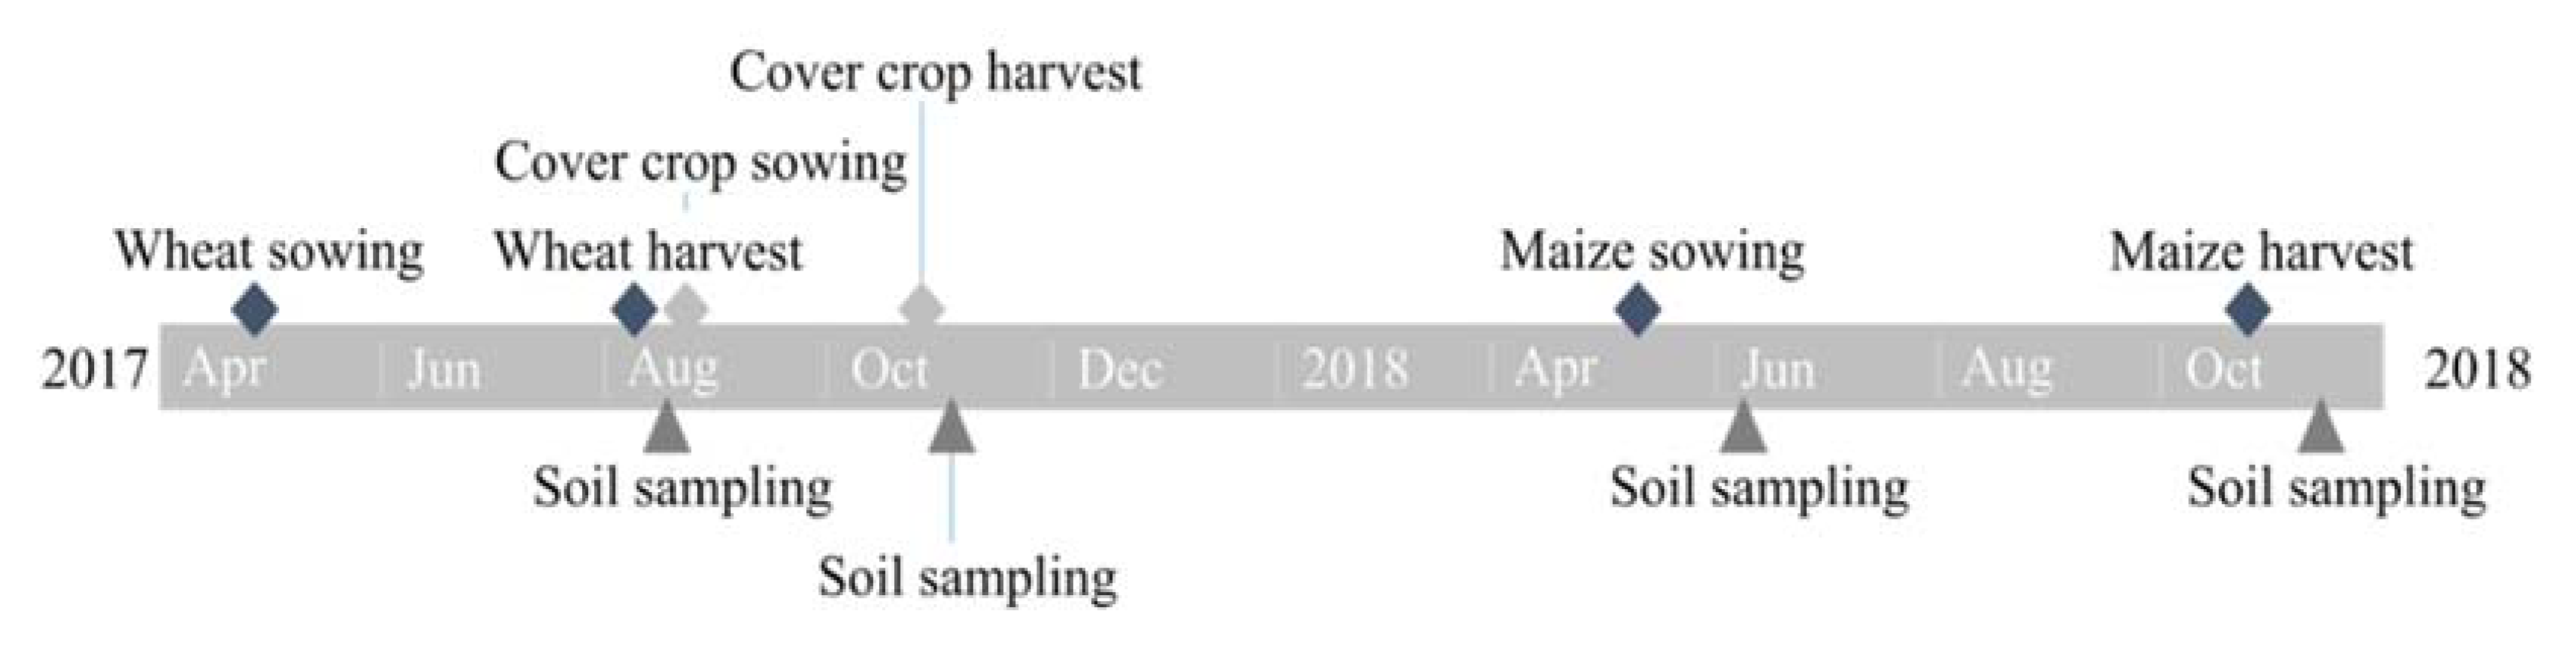
The aim of this study was to evaluate forage yield and quality, and the effect on the following spring crop, along with other legume cover crop advantages of faba bean grown in the fall after wheat harvest compared with field and forage pea. This information could be used to provide information on fall cover crop use, late-season grazing opportunity, and the effects of late-season legume cover crops on soil NO3–N in the fall and spring before maize sowing.

2. Materials and Methods

2.1. Field Establishment and Experimental Design

Experiments were conducted in 2017 and 2018 at two North Dakota State University (NDSU) research locations at Prosper, ND (−97°1143′ W, 46°9997′ N; 281 m elevation), and Hickson, ND (−96°8259′ W, 46°6335′ N; 281 m elevation). Location–year combinations will be referred to as environments henceforward. The soil type in Prosper is a Kindred–Bearden silty clay loam (Fine-silty, mixed, superactive frigid Typic Endoaquolls; Bearden: Fine-silty, mixed, superactive, frigid Aeric Calciaquolls), and the soil type in Hickson is a Hagne–Fargo silty clay loam (Hagne: Fine, smectitic, frigid Typic Calciaquerts; Fargo: Fine, smectitic, frigid Typic Epiaquerts) [32] Daily temperature and rainfall were monitored by the North Dakota Agricultural Weather Network (NDAWN) stations nearest to each experimental site.
The experimental design was a randomized complete-block design with four replicates, sown at two environments in August of 2017 and 2018 after the harvest of ‘Glenn’ cv. wheat. Wheat was grown during the season and cover crops were sown after wheat harvest. Wheat was drilled using a Great Plains 15-cm row spacing planter (Great Plains, Salinas, KS, USA) at 4,450,000 pure live seeds (PLS) ha−1 on 25 April 2017 and 2 May 2018 in Hickson, and on 20 April 2017 and 15 May 2018 in Prosper. Wheat in Hickson was fertilized with 88 kg N ha−1 and 24 kg P2O5 ha−1 both years, and Prosper was fertilized with 90 kg N ha−1 of N and 17 kg P2O5 ha−1 both years. Wheat was harvested on 8 August 2017 and 9 August 2018 in Hickson, and on 5 August 2017 and 8 August 2018 in Prosper. Cover crop treatments included five faba bean cultivars (Fanfare, Boxer, Laura, Snowdrop, and Tabasco), two pea cultivars (Arvika forage pea and Nette semi-leafless field pea), and one control plot without cover crop. After wheat harvest, a leaf blower (BR 200, Stihl, Waiblingen, Germany) was used to clear extra wheat stover from the plots to ensure an even sowing depth of 4 cm. All seeds were treated with inoculant (Penicillium bilaiae, Rhizobium leguminosarum) (TagTeam, Monsanto Company, St. Louis, MO, USA) at 6.1 kg ha−1 shortly before sowing. Cover crops were directly (no-till) sown with a plot drill (XL Plot seeder, Wintersteiger, Austria) into the wheat stubble on 22 August 2017 and 13 August 2018 in Hickson, and on 14 August 2017 and 16 August 2018 in Prosper (Table 1).
Each experimental unit had eight cover crop rows 15-cm apart and was 7.6-m in length. Prior to sowing, cover crop cultivars were tested for germination to calculate pure live seed (PLS). Cover crops were sown at 150,000 PLS ha−1 and 67 kg ha−1 PLS for faba bean and pea, respectively. Seeding rates were set at 75% of the recommended seeding rates for field production, as farmers using them for a cover crop would reduce sowing rates to save money. For faba bean, seeds for each plot were counted because of the variability in seed size among cultivars (Table 2). No herbicides or fertilizers were used on the cover crops, with the exception of a burndown application of glyphosate (N-(phosphonomethyl) glycine) (1.4 kg a.i. ha−1) to kill volunteer wheat before cover crop sowing.
The following spring, maize was sown on the experiments. Peterson Farm Seed 75K85 VT2PRO (85-day maturity) maize was sown in 56-cm rows at a population of 79,262 plants ha−1 (MaxEmerge XP, John Deere, Moline, IL, USA) on 10 May 2018 in Hickson and 15 May 2018 in Prosper on the previous year’s cover crops’ plots. Each experimental unit was the same as the cover crop plots, consisting of three 56-cm maize rows 7.6-m in length. Maize was left unfertilized to allow for the determination of the difference in mineralization and release of N from the winter-killed cover crop biomass.

2.2. Plant Sampling and Analysis

Cover crop stand was recorded by counting emerged plants in 1-m2 in each plot two weeks after emergence. The percent area of ground coverage for all cover crops was determined before the first killing frost with the Canopeo© application (Canopeo, Oklahoma State University, Stillwater, OK, USA) with pictures taken from 1-m above the canopy. Pictures were taken on 30 October 2017 in Prosper and 2 October 2018 in both Hickson and Prosper in 2018.
Shortly before the first expected killing frost, biomass samples were collected by clipping all aboveground biomass 0.2-m2 from each cover crop plot. This was done on 26 October 2017 and 15 October 2018 in Hickson, and 25 October 2017 and 16 October 2018 in Prosper (Figure 1). The carrying capacity of cover crop biomass was calculated assuming 50% harvest efficiency using the NDSU Grazing Calculator Application (NDSU Grazing Calculator, North Dakota State University, Fargo, ND, USA). The leaves and stems of the collected plants were separated, dried at 70 °C until constant weight, and weighed to determine dry weight and leaf to stem ratio. For this ratio calculation, tendrils on the pea plants were counted as stems and stipules were counted as leaves. The leaf:stem ratio was calculated this way because tendril composition is more similar to stem than leaf, while stipules are similar to leaves. After this was calculated, dried samples were ground to pass through a 1-mm sieve with a mill (E3703.00, Eberbach Corporation, Bellville, MI, USA). Ground cover crop samples were analyzed using near-infrared reflectance spectroscopy (NIRS) with an XDS analyzer (Foss, Denmark) for N, P, and ash. Biomass N accumulation was calculated by multiplying the dry matter biomass yield by the total N content.
Maize was harvested on 24 October 2018 in Hickson and 18 October 2018 in Prosper (HP 5 combine, Almaco, Nevada, IA, USA). A 7.6-m row from the center of each plot was harvested for grain yield. A 56-cm row maize harvester was not available, so cobs were removed by hand and placed into the 76-cm row maize harvester. Grain from each plot was tested for water content and test weight (Mini GAC 2500, Dickey-John, Auburn, IL, USA). Before this, maize biomass yield was determined by cutting and weighing 1-m of maize row, 10-cm above the ground. After recording weights, plants were harvested for grain, but two were saved from each plot to determine harvest index. The two maize plants were dried at 70 °C until constant weight. Maize cobs were separated by hand and shelled (SCS-2, Agriculex, ON, Canada). Dry grain and stover were weighed separately. Harvest index was calculated using the equation
H a r v e s t   i n d e x = d r y   g r a i n   w e i g h t t o t a l   b i o m a s s   w e i g h t   ×   100

2.3. Soil Sampling and Analysis

Soil samples were taken at 0- to 15-cm and 0- to 60-cm across each replicate after wheat harvest. Wheat residue was removed from the surface before taking the sample (Table 3). Soil samples taken at the 0- to 15-cm depth were tested for soil pH, organic matter, P [33], and K with the ammonium acetate method [34], with a Buck Scientific Model 210 VGP Atomic Absorption Spectrophotometer (Buck Scientific, East Norwalk, CT, USA). Soil samples taken from 0- to 60-cm depth were analyzed for NO3–N using the Vendrell and Zupancic [35] method. Soil samples were taken on 29 August in Hickson and 21 August in Prosper in 2017, and on 17 August in Hickson and 7 September in Prosper in 2018.
Soil samples were collected from each experimental unit after cover crop death in late fall on 3 November in both Hickson and Prosper in 2017, and 13 November in Hickson and 6 November in Prosper in 2018 (Figure 1). These soil samples were analyzed for NO3–N, from 0- to 60-cm depth. The difference between the soil NO3–N in the sample after wheat harvest and soil NO3–N after cover crop harvest was considered as the change in NO3–N.
Soil samples were taken from each maize plot in the spring following cover crops at 0–60 cm and analyzed for NO3-N on 8 June 2018 in both environments. In addition, soil samples were taken from each experimental unit at 0–60 cm and analyzed for NO3-N after maize harvest on 13 November in Hickson and 6 November in Prosper in 2018. The difference between these spring and post-harvest soil NO3–N samples in each plot was considered the change in NO3–N. All evaluations were recorded for each plot of each replicate in all four environments.

2.4. Statistical Analysis

Statistical analysis was conducted using standard procedures for a randomized complete-block design. Biomass yield and forage quality data was analyzed using analysis of variance with the GLM procedure of SAS [36] Each location–year was analyzed separately and tested for homogeneity of variances before combining them. Each location–year combination was considered an environment and a random effect, while cover crops and grain crops were considered fixed effects in the analysis. All interactions of fixed effects with the environment were considered random in the analysis. The mean separation test was an F-protected least significant differences (LSD) (p ≤ 0.05).

3. Results and Discussion

3.1. Weather

Both 2017 locations received less rainfall than the 30-yr average throughout the growing season except the month of September (Table 4). Hickson received 94 mm less rainfall than the 30-yr average in late summer and fall from July through October, and Prosper received 21 mm less rainfall than the 30-yr average from July through October (Table 4). Prosper 2017 received 86 mm more rainfall than the 30-yr average in September, relieving some possible water deficiency that had built up throughout the growing season. Hickson, in 2017, received only 6 mm more rainfall than average in September, making its total rainfall below average, much greater than Prosper 2017. Despite low rainfall, both locations had average temperatures throughout the growing season.
Both 2018 locations also started the growing season with drier-than-average rainfall. Hickson in 2018 received slightly above average rainfall in June through August, whereas Prosper 2018 received below average rainfall until August, where it received 12 mm above average, followed by 5 mm above average in both September and October. Along with a dry spring, both 2018 environments were 6 °C below average throughout April. In May and June, both environments had slightly above average temperatures, followed by slightly below average temperatures for the rest of the season.

3.2. Cover Crop Growth

Stand count of both pea cultivars averaged across environments was greater (p ≤ 0.05) than the faba bean cultivars (Table 5) due to the higher seeding rate of the peas. There was no difference among faba bean cultivars, which showed similar emergence and growth; the same was true for the pea cultivars. There was a ground coverage by environment interaction across three environments (p ≤ 0.05); data were not available for ground coverage in the Hickson 2017 environment. Forage pea cv. Arvika had greater (p ≤ 0.05) ground coverage than any other treatment across each of the three environments (Table 5). Field pea cv. Nette had the next most coverage but was always less (p ≤ 0.05) than ‘Arvika’.
Prostrate growth, along with greater sowing density of pea cultivars, led to their greater ground coverage. Faba bean cv. Snowdrop and Boxer had consistently low ground coverage (Table 5). The control plots had weeds, explaining coverage observed in control plots in both 2018 environments. In 2017, there was uncontrolled volunteer wheat in the plots, explaining the 14.1% average coverage in the control plot. Volunteer wheat, along with the pictures being taken later, and faba beans beginning to turn a darker color with frost, led to skewed coverage readings of cover crops in that environment. Ground cover from cover crops could help significantly curtail soil losses due to wind erosion, which, according to Fryrear [37], can be reduced by 58% with just 20% ground cover. However, no-till management can greatly reduce soil erosion on its own; with low residue crops in no-till there is still chance for inter-rill erosion, which can be reduced by adding cover crops [38].
Cover crop biomass averaged across four environments was similar among all cultivars (Table 6), showing faba bean produced similar amounts of aboveground biomass as forage and field pea. This is in contrast to Iglesias and Lloveras [18], who reported significantly greater biomass production with faba bean than forage pea. This is likely because of the short growing period of the cover crops in this study (August–October), whereas, in Iglesias’ study, cover crops were grown to maturity through a mild winter from late October to May. Cover crop biomass averaged 1207 kg ha−1 and ranged from 957 to 1630 kg ha−1 (Table 6) across cultivars, but were not significantly different. ‘Arvika’ averaged 1630 kg ha−1, which was similar to the biomass yield reported by Iglesias and Lloveras [18] and Wichmann et al. [19]. They also indicated that, in earlier harvests, pea yielded greater biomass than other cold season legumes such as lupin, faba bean, and hairy vetch (Vicia villosa Roth). The differences in forage and field pea biomass align with findings from Uzun et al. [8] and Turk and Albayrak [9], who reported that leaved pea cultivars averaged greater biomass than semi-leafless cultivars. The carrying capacity per hectare of the average biomass produced by cover crops in this study (1207 kg ha−1) resulted in 1.5 AUM ha−1 for a 450 kg cow and calf.
All faba bean cultivars, averaged across environments, showed greater (p ≤ 0.05) leaf:stem ratios than forage pea, which had a greater (p ≤ 0.05) ratio than field pea (Table 6). Alkhtib et al. [39] found that faba bean has a greater concentration of CP in the leaves than in the stems. The high leaf:stem ratio of faba bean gives them a high nutritive value forage. Forage pea had a greater number of leaves and stipules, but they were much smaller than faba bean leaves, giving them a lesser leaf:stem ratio. Field pea is largely a vine plant and had only stipules that were counted as leaves, contributing to its lesser (p ≤ 0.05) leaf:stem ratio.

3.3. Cover Crop Biomass Chemical Composition

All biomass chemical composition parameters evaluated were significantly different among cultivars (p ≤ 0.05) (Table 7). Faba bean cv. Boxer had the highest CP concentration, but not different from faba bean cv. Laura and forage pea cv. Arvika. Field pea cv. Nette had lesser (p ≤ 0.05) CP concentration than any other cover crop. Wichmann et al. [19] also reported that faba bean contained more CP than pea. Faba bean cv. Fanfare, Tabasco, and Snowdrop all had less (p ≤ 0.05) CP than ‘Boxer’. Soto-Navarro et al. [7], Uzun et al. [8], and Strydhorst et al. [13] reported that forage pea types averaged a greater CP forage yield than semi-leafless pea, and that faba bean had more (p ≤ 0.05) CP content than field pea. This could be related to the leaf:stem ratio, because Alkhtib et al. [39] found that leaves have a greater (p ≤ 0.05) concentration of CP than stems. Legumes in this study were in a vegetative stage at harvest, which explains their high CP concentration. The crude protein concentration of typical legume forages, such as alfalfa (Medicago sativa L.), averaged 212 g kg−1 when cut at early bud stage [40].
Forage pea harvested in vegetative stage usually have greater forage nutritive value than more mature plants (seed fill), with earlier harvests having greater CP, total digestible nutrients, and relative feed value [9]. Crude protein concentration in all cover crops in this study were much above those needed by beef cattle. A gestating cow in the mid-1/3 of pregnancy and weighing 540 kg requires 10 kg of dry matter intake with 71 g kg−1 of crude protein [41]. It is important to graze pea and faba bean along with an alternative source of fiber to increase the amount of DM intake, reduce CP concentration of feed intake to maintain rumen stability, and avoid bloating [41]. This could be provided by wheat stubble or wheat volunteers, along with other low-CP, high-fiber, dry hay.
Amiri and Shariff [10] found that combining legumes and grass species provided proper nutrition requirements for grazing livestock. Pea grain and forage are known to cause bloat in ruminant animals because of their high protein content [42]. Faba bean contains condensed tannins, which are attributed to reduced bloating typical of other legume forages [43]. Thus, faba bean as a sole feed are less likely to cause bloating than pea. However, it is important to note that tannin-free faba bean cultivars are available [13] to increase digestibility of the seed for feed. Although there is abundant information about the effects of tannin-free faba bean seed, there is little information on whether the amount of tannin in the plant biomass is affected. More research should be done on whether tannin-free faba bean seeds may produce biomass with reduced tannin content as well, increasing the probability of bloating.
Phosphorus concentration in the biomass was different among cultivars (p ≤ 0.05), especially between faba bean and pea cultivars, with the greatest being faba bean ‘Boxer’ with 4.83 g kg−1 and the least being field pea ‘Nette’ with 4.24 g kg−1 (Table 7). Forage pea had less (p ≤ 0.05) P content than all faba bean cultivars except for ‘Tabasco’, and field pea had less (p ≤ 0.05) P content than forage pea. Both legumes have more than enough P for cattle, which need 1.4 g P kg−1 of feed [43].
Ash was greater (p ≤ 0.05) in all faba bean cultivars than the pea cultivars (Table 7). This was likely due to the greater (p ≤ 0.05) leaf:stem ratio of faba bean and the fact that leaves of faba bean have greater ash content than the stem [39]. Overall, ash concentrations (42–77 g kg−1) were lesser compared with the average ash concentration of a grass–legume mixture (90 g kg−1) [44].
No significant differences (p ≤ 0.05) in nitrogen accumulation were found between cover crops averaged across environments (Table 8). Average nitrogen accumulation of all cover crop treatments was 55.3 kg N ha−1, and ranged from 43.4–76.8 kg N ha−1. Analysis indicated an interaction between N accumulation and environment (p ≤ 0.05) (Table 8). Biomass and N accumulation averages follow the trend of available NO3–N in the soil at cover crop sowing in each environment (Table 3). The fact that there was no significant interaction between biomass and environment, but there was between nitrogen accumulation and environment, suggests that available NO3–N in the soil is not essential for legume biomass production, but they can accumulate excess soil NO3–N when it is available. This shows that legumes can be scavengers as well when there are excessive nutrients in the soil, in alignment with findings from Jensen et al. [20] and Hauggard-Nielsen et al. [23]. The Prosper 2017 environment likely had the highest average N accumulation because it had the most growing degree days accumulated between cover crop sowing and harvest (Table 1), along with the most NO3–N in the soil at cover crop sowing (Table 3), allowing for the most crop growth. The greatest amount of N was accumulated by forage pea cv. Arvika with 105.1 kg ha−1 in Hickson in 2017 (Table 8). In general, the least N accumulation was seen in most cultivars at Prosper in 2018 (Table 8).

3.4. Soil

Soil residual NO3–N was not significantly different among treatments after biomass harvest, October/November, due to the short time for the uptake of soil NO3–N (Table 9). This could also be due to the N2 fixation by legumes. Control plots without cover crop averaged slightly, but not significantly, greater residual NO3–N in the soil than the cover crop plots. This shows that the cover crops in this study didn’t accumulate more N from the soil than would have been leached away or lost by other means, alleviating the need to increase fertilization in the following year. Similarly, Hauggaard-Nielsen et al. [23] found that excess nutrients accumulate in cover crop biomass and can reduce nutrient leaching or loss through soil erosion throughout the fall, winter, and spring. However, Couedel et al. [29] found a decrease in soil NO3–N from legume cover crops grown during a fallow period, which ranged from 25% to 56%, with pea causing the most reduction. This is likely due to the longer growing period of the cover crops in the Couedel et al. [29] study.
Change in soil NO3–N during the life of the cover crops (August to October) was not different between treatments (Table 9). Although not significant, the absence of a cover crop resulted in a lesser change in soil NO3–N from planting to harvest of cover crops than those with cover. Soil NO3–N changes are mainly due to mineralization, leaching, and immobilization and N2 fixation.

3.5. Maize Crop in Following Season

No differences were found between the previous year’s cover crop treatments in any of the maize parameters that were tested in the following season. This neutral result indicates that N stored in the cover crop biomass did not mineralize fast enough, or in large enough amounts, for the following crop, maize, to utilize. This low response is likely due to low temperatures throughout April in 2018, delaying the start of the mineralization process (Table 4). Low rainfall throughout the spring of 2018 in both environments, and through July of 2018 in the Prosper environment likely decreased mineralization rate in the soil to less than expected (Table 4). Similarly, Hauggaard-Nielsen et al. [23] reported that production of wheat in the spring was unaffected after fall-sown grass/clover.
When analyzing the maize grain yield response to residual soil NO3–N after each cover crop in the spring, there was a slight response (r2 = 0.30) (Figure 2). Pea cultivars and the control plot had a lesser maize grain yield compared with the maize following faba bean cultivars. Likewise, Lupwayi and Soon [45] indicated that faba bean might have released more N in the first year of decomposition than both field and forage pea.
Slightly increased maize yield in the year following forage pea compared with the field pea was likely due to its greater leaf:stem ratio and greater N concentration; a response also reported by Lupwayi and Soon [45]. A greater N concentration in the faba bean biomass could allow for faster mineralization of the nutrients, leading to a slight boost in maize yield, but this has not been determined by this study. This trial was not fertilized with N; thus, a slightly greater availability of soil NO3–N could have made a difference in grain yield.

4. Conclusions

Faba bean, forage pea, and field pea all show potential as late-season cover crops and forage grazing, due to their ability to produce biomass when sown after wheat harvest and their high CP content. All cover crops tested attained similar biomass accumulation and enough ground coverage to reduce erosion. Peas provided more ground coverage than faba bean. Increasing the faba bean sowing rate would likely increase biomass production and ground coverage. On just these cover crops, 1.5 AUM would be able to graze per hectare. Forage pea and faba bean had a better nutritive value than field pea because of their greater CP concentration. Faba bean cultivars had a greater leaf:stem ratio than peas, which could lead to increased intake of faba bean over peas for grazing cattle. Faba bean and forage pea also showed a slightly greater N benefit than field pea to the succeeding crop due to their high N content and superior leaf:stem ratio. There are multiple advantages to using these leguminous cover crops after wheat, though more research may need to be done to find conclusive results of their residual nutrient effects on the following crops.

Author Contributions

Conceptualization, M.T.B.; Data curation, B.J.A.; Formal analysis, B.J.A. and M.T.B.; Funding acquisition, M.T.B.; Investigation, B.J.A. and M.T.B.; Methodology, B.J.A. and M.T.B.; Project administration, M.T.B.; Resources, A.W. and M.T.B.; Supervision, M.T.B.; Validation, B.J.A. and M.T.B.; Writing original draft, B.J.A., D.P.S. and M.T.B.; Writing—review and editing, B.J.A., D.P.S., A.W. and M.T.B. All authors have read and agreed to the published version of the manuscript.

Funding

This research was funded by USDA-NIFA, Coordinated Agricultural Program, Award no. 2016-69004-24784 “CropSys—A novel management approach to increase productivity, resilience, and long-term sustainability of cropping systems in the northern Great Plains”.

Acknowledgments

Our most sincere thanks to the forages and cover crops team, Alan Peterson, Alex Wittenberg, Sergio Cabello, and Swarup Podder, for their assistance in experiments establishment, data collection, harvest, and sample processing.

Conflicts of Interest

The authors declare no conflict of interest. The funders had no role in the design of the study; in the collection, analyses, or interpretation of data; in the writing of the manuscript, or in the decision to publish the results.

References

  1. Natural Resources Conservation Service (NRCS). National Handbook of Conservation Practices. Conservation Practice Standards Code 340; 2014; Available online: https://www.nrcs.usda.gov/Internet/FSE_DOCUMENTS/stelprdb1263176.pdf (accessed on 4 November 2019).
  2. Myers, R. A Preliminary Look at State Rankings for Cover Crop Acreage Based on Census of Agriculture Information. Sustainable Agriculture Network, 2019. Available online: https://files.constantcontact.com/c7de6aab001/914daacf-ca6d-4549-a57f-a2b3f861ec15.pdf (accessed on 4 November 2019).
  3. Berti, M.T.; Li, H.; Samarappuli, D.; Peterson, A.; Cabello, S.; Andersen, B.; Wittenberg, A.; Johnson, B.; Steffl, N.; Aasand, K.; et al. MCCC-North Dakota Annual Report. 2019. Available online: http://mccc.msu.edu/wp-content/uploads/2018/04/ND_2017_MCCC_North-Dakota-Report.pdf (accessed on 4 November 2019).
  4. Lawrence, J.D.; Strohbehn, D.R. Understanding and managing costs in beef cow-calf herds. In Integrated Resource Management Committee. National Cattlemen’s Beef Association Convention; Iowa Beef Center, Iowa State University: Charlotte, NC, USA, 1999. [Google Scholar]
  5. Strauch, D. Survival of pathogenic micro-organisms and parasites in excreta, manure and sewage sludge. Rev. Sci. Tech. Off. Int. Epiz. 1991, 10, 813–846. [Google Scholar] [CrossRef]
  6. Anderson, V.L.; Ilse, B. Field Peas Make Excellent Quality Forage for Beef Cattle. 2012, pp. 1–2. Available online: https://northernpulse.com/uploads/resources/883/field-peas-make-excellenct-quality-forage-for-beef-cattle.jpg.pdf (accessed on 4 November 2019).
  7. Soto-Navarro, S.A.; Encinias, A.M.; Bauer, M.L.; Lardy, G.P.; Caton, J.S. Feeding value of field pea as a protein source in forage-based diets fed to beef cattle. J. Anim. Sci. 2012, 90, 585–591. [Google Scholar] [CrossRef] [PubMed]
  8. Uzun, A.; Bilgili, U.; Sincik, M.; Filya, I.; Acikgoz, E. Yield and quality of forage type pea lines of contrasting leaf types. Eur. J. Agron. 2005, 22, 85–94. [Google Scholar] [CrossRef]
  9. Turk, M.; Albayrak, S. Effect of harvesting stages on forage yield and quality of different leaf types pea cultivar. Turk. Field Crops 2012, 17, 111–114. [Google Scholar]
  10. Amiri, F.; Shariff, A.R.M. Comparison of nutritive values of grasses and legume species using forage quality index. Songklanakarin J. Sci. Technol. 2012, 34, 577–586. [Google Scholar]
  11. Dordas, C.A.; Lithourgidis, A.S. Growth, yield, and nitrogen performance of faba bean intercrops with oat and triticale at varying seeding ratios. Grass Forage Sci. 2011, 66, 569–577. [Google Scholar] [CrossRef]
  12. Dhima, K.V.; Vasilakoglou, I.B.; Keco, R.X.; Dima, A.K.; Paschalidis, K.A.; Gatsis, T.D. Forage yield and competition indices of faba bean intercropped with oat. Grass Forage Sci. 2014, 69, 376–383. [Google Scholar] [CrossRef]
  13. Strydhorst, S.M.; King, J.R.; Lopetinsky, K.J.; Harker, K.N. Forage potential of intercropping barley with faba bean, lupin, or field pea. Agron. J. 2008, 100, 182–190. [Google Scholar] [CrossRef]
  14. Stoltz, E.; Nadeau, E. Effects of intercropping on yield, weed incidence, forage quality and soil residual N in organically grown forage maize (Zea mays L.) and faba bean (Vicia faba L.). Field Crops Res. 2014, 169, 21–29. [Google Scholar] [CrossRef]
  15. Mustafa, A.F.; Seguin, F. Characteristics and in situ degradability of whole crop faba bean, pea, and soybean silages. Can. J. Anim. Sci. 2003, 83, 793–799. [Google Scholar] [CrossRef]
  16. Warner, K.S.A.; Hempworth, G.W.; Davidson, R.H.; Milton, J.T.B. Value of mature grain legume crops for out of season prime lamb production. Anim. Prod. Aust. 1998, 22, 217–220. [Google Scholar]
  17. Wegi, T.; Tolera, A.; Wamatu, J.; Animut, G.; Rischkowsky, B. Effects of feeding different varieties of faba bean (Vicia faba L.) straws with concentrate supplement on feed intake, digestibility, body weight gain and carcass characteristics of Arsi-Bale sheep. Asian Austral. J. Anim. Sci. 2018, 31, 1221. [Google Scholar] [CrossRef] [PubMed]
  18. Iglesias, I.; Lloveras, J. Annual cool-season legumes for forage production in mild winter areas. Grass Forage Sci. 1998, 53, 318–325. [Google Scholar] [CrossRef]
  19. Wichmann, S.; Loges, R.; Taube, F. Development of whole crop yield and quality of different grain legumes in monocrop and intercropping with cereals. Pflanzenbauwissenschaften 2005, 9, 61–74. [Google Scholar]
  20. Jensen, E.S.; Peoples, M.B.; Hauggaard-Nielsen, H. Faba bean in cropping systems. Field Crops Res. 2010, 115, 203–216. [Google Scholar] [CrossRef] [Green Version]
  21. Schatz, B.G. Benefits of Growing Field Peas. 2012, p. 3. Available online: https://northernpulse.com/uploads/resources/883/field-peas-make-excellenct-quality-forage-for-beef-cattle.jpg.pdf (accessed on 4 November 2019).
  22. Hardarson, G.; Danso, S.; Zapata, F.; Reichardt, K. Measurements of nitrogen fixation in faba bean at different N fertilizer rates using the 15N isotope dilution and ‘A-value’ methods. Plant Soil 1991, 131, 161–168. [Google Scholar] [CrossRef]
  23. Hauggaard-Nielsen, H.; Mundus, S.; Jensen, E.S. Nitrogen dynamics following grain legumes and subsequent catch crops and the effects on succeeding cereal crops. Nutr. Cycl. Agroecosyst. 2009, 84, 281–291. [Google Scholar] [CrossRef]
  24. Peoples, M.B.; Brockwell, J.; Herridge, D.F.; Rochester, I.J.; Alves, B.J.R.; Urquiaga, S.; Boddey, R.M.; Dakora, F.D.; Bhattarai, S.; Maskey, S.L.; et al. The contributions of nitrogen-fixing crop legumes to the productivity of agricultural systems. Symbiosis 2009, 48, 1–17. [Google Scholar] [CrossRef]
  25. Stevenson, F.C.; van Kessel, C. The nitrogen and non-nitrogen rotation benefits of pea to succeeding crops. Can. J. Plant Sci. 1996, 76, 735–745. [Google Scholar] [CrossRef]
  26. Beckie, H.J.; Brandt, S.A.; Schoenau, J.J.; Campbell, C.A.; Henry, J.L.; Janzen, H.H. Nitrogen contribution of field pea in annual cropping systems. 2. Total nitrogen benefit. Can. J. Plant Sci. 1997, 77, 323–331. [Google Scholar] [CrossRef]
  27. Lupwayi, N.Z.; Soon, Y.K. Nitrogen release from field pea residues and soil inorganic N in a pea-wheat crop rotation in northwestern Canada. Can. J. Plant Sci. 2009, 89, 239–246. [Google Scholar] [CrossRef]
  28. Cupina, B.; Manojlovic, M.; Krstic, D.; Cabilovski, R.; Mikic, A.; Ignjatovic-Cupina, A.; Eric, P. Effect of winter cover crops on the dynamics of soil mineral nitrogen and yield and quality of sudan grass Sorghum bicolor (L.) Moench. Aust. J. Crop Sci. 2011, 5, 839–845. [Google Scholar]
  29. Couedel, A.; Alletto, L.; Tribouillois, H.; Justes, E. Cover crop crucifer-legume mixtures provide effective nitrate catch crop and nitrogen green manure ecosystem services. Agric. Ecosyst. Environ. 2018, 254, 50–59. [Google Scholar] [CrossRef]
  30. North Dakota State University Extension. Langdon 2016 Variety Trial Report; North Dakota State Univ. Ext. Serv.: Fargo, ND, USA, 2016. [Google Scholar]
  31. National Agricultural Statistics Service (NASS); Farm Service Agency (FSA). 2017 North Dakota Acreage Summary Report. 2017. Available online: https://www.fsa.usda.gov/Assets/USDA-FSA-Public/usdafiles/State-Offices/North-Dakota/pdfs/2017AcreageReportingSummary.pdf (accessed on 4 November 2019).
  32. Web Soil Survey. National Resources Conservation Service; United States Dep. of Agric.: Washington, DC, USA, 2009; Available online: http://websoilsurvey.nrcs.usda.gov/app/WebSoilSurvey.aspx (accessed on 12 April 2018).
  33. Olsen, R.S.; Cole, C.V.; Watanabe, F.S.; Dean, L.A. Estimation of Available Phosphorus in Soils by Extraction with Sodium Bicarbonate. Circular 939; United States Department of Agriculture: Washington, DC, USA, 1954.
  34. Warncke, D.; Brown, J.R. Potassium and other basic cations. Recomm. Chem. Soil Test Proced. N. Cent. Reg. 1998, 1001, 31. [Google Scholar]
  35. Vendrell, P.F.; Zupancic, J. Determination of soil nitrate by transnitration of salicylic-acid. In Proceedings of the International Symposium on Soil Testing and Plant Analysis, Fresno, CA, USA, 14–18 August 1989. [Google Scholar]
  36. SAS Institute. SAS User’s Guide: Statistics; SAS Institute: Cary, NC, USA, 2014. [Google Scholar]
  37. Fryrear, D.W. Soil cover and wind erosion. Trans ASAE 1985, 28, 781–784. [Google Scholar] [CrossRef]
  38. Kaspar, T.C.; Radke, J.K.; Laflen, J.M. Small grain cover crops and wheel traffic effects on infiltration, runoff, and erosion. J. Soil Water Conserv. 2001, 56, 160–164. [Google Scholar]
  39. Alkhtib, A.S.; Warnatu, J.A.; Wegi, T.; Rischkowsky, B.A. Variation in the straw traits of morphological fractions of faba bean (Vicia faba L.) and implications for selecting for food-feed varieties. Anim. Feed Sci. Technol. 2016, 222, 122–131. [Google Scholar] [CrossRef]
  40. Lloveras, J.; Ferran, J.; Alvarez, A.; Torres, L. Harvest management effects an alfalfa (Medicago sativa L.) production and quality in Mediterranean areas. Grass Forage Sci. 1998, 53, 88–92. [Google Scholar] [CrossRef] [Green Version]
  41. Lalman, D.; Richards, C. Nutrient Requirements of Beef Cattle. Oklahoma Cooperative Extension Service, 2017. Available online: http://pods.dasnr.okstate.edu/docushare/dsweb/Get/Document-1921/E-974web.pdf (accessed on 4 November 2019).
  42. Radostits, O.M.; Gay, C.G.; Hinchcliff, K.W.; Constable, P.D. Veterinary Medicine: A Textbook of the Diseases of Cattle, Horses, Sheep, Pigs and Goats, 10th ed.; Saunders Ltd.: Philadelphia, PA, USA, 2007. [Google Scholar]
  43. Lees, G.L. Condensed tannins in some forage legumes: Their role in the prevention of ruminant pasture bloat. Basic Life Sci. 1992, 59, 915–934. [Google Scholar]
  44. Hoffman, P.C. Ash Content in Forages. 2005. Available online: https://fyi.extension.wisc.edu/forage/ash-content-of-forages/ (accessed on 4 November 2019).
  45. Lupwayi, N.Z.; Soon, Y.K. Carbon and nitrogen release from legume crop residues for three subsequent crops. Soil Sci. Soc. Am. J. 2015, 79, 1650–1659. [Google Scholar] [CrossRef]
Figure 1. General timeline of sowing and harvesting of various crops and soil sampling throughout the experiment.
Agronomy 10 00080 g001
Figure 2. Interaction between spring soil NO3–N and maize grain yield in 2018, following fall cover crops.
Agronomy 10 00080 g002
Table 1. Sowing and harvest of cover crops and weather data for each location and year (environment).
EnvironmentSowing DateBiomass HarvestTotal Rainfall Average TempColdest TempColdest Temp DateGDD
mm°C °C
Hickson 201722 August26 October8114−410 October440
Hickson 201813 August15 October17613−711 October436
Prosper 201714 August25 October16114−410 October526
Prosper 201816 August16 October20112−1112 October409
Total rainfall, temperature (temp), and growing degree days (GDD) measured from cover crop sowing to biomass harvest dates at each environment (mid-late August to mid-late October). Growing degree days calculated with 7 °C as the base temperature.
Table 2. Seed weight and sowing rate of cover crop cultivars sown after wheat harvest in Prosper and Hickson, ND, in 2017 and 2018.
CropCultivar100-Seed WeightSowing Rate
gPLS ha−1
Faba beanFanfare60.65150,000
Boxer57.43150,000
Laura57.73150,000
Snowdrop35.28150,000
Tabasco47.25150,000
Field peaNette19.17350,000
Forage peaArvika15.79424,000
Table 3. Soil sample results taken after wheat harvest and before cover crop sowing at each environment.
EnvironmentpH Organic MatterPhosphorusPotassiumNO3-N
g kg−1mg kg−1kg ha−1
Hickson 20177.6551231054.8
Hickson 20187.5521033721.3
Prosper 20177.4362523493.8
Prosper 20187.3422818512.5
pH, organic matter, P, and K, all sampled from 0–15 cm depth. NO3–N sampled from 0–60 cm depth.
Table 4. Total monthly rainfall, temperature, and difference from the 30-yr average for four environments at Hickson and Prosper, ND, USA, in 2017 and 2018.
EnvironmentMonthRainfallTemperature
Total±30 yr MaxMinAvg±30 yr
mm°C
HicksonJuly37 −462914210
2017August50−13251218−2
September696229150
October12−4115080
HicksonApril2−376−51−6
2018May22−5525917+3
June952271421+2
July10725271421−1
August9633261219−1
September39−2521714−1
October46−710−24−4
ProsperJuly50−382814210
2017August53−14251118−2
September15286228150
October7−5515080
ProsperApril4−336−60−6
2018May54−2425917+3
June79−21271420+2
July65−23271420−1
August7912271219−1
September71521714−1
October6759−14−3
30 y average temperatures based on 1981–2010 long-term averages from NDAWN. Weather data obtained from: https://ndawn.ndsu.nodak.edu/weather-data-monthly.html.
Table 5. Plant stand count averaged across four environments and ground coverage for each cultivar in each environment at Hickson and Prosper, ND, USA, in 2017 and 2018.
Cultivar HicksonProsper
Stand Count201820172018
Plants m−2Ground Coverage (%)
Fanfare19 b 23.0 def12.1 k19.1 ghi
Boxer23 b19.3 fgh13.2 k15.0 jk
Laura22 b21.4 efg12.5 k17.4 hij
Snowdrop21 b19.4 fgh12.3 k12.0 k
Tabasco22 b26.1 d14.2 jk15.3 ijk
Nette40 a40.9 c15.2 jk23.7 de
Arvika41 a61.9 a21.1 efgh49.4 b
No cover control0 c1.1 l 14.1 jk1.3 l
LSD (p = 0.05)73.8
Means followed by the same letters within a column for each factor are not significantly different (p ≤ 0.05) according to the least significant differences (LSD) test. Coverage in the no cover control corresponds to volunteer wheat in 2017 and weeds in 2018.
Table 6. Cover crop biomass yield and leaf:stem ratio averaged across four environments at Hickson and Prosper, ND, USA, in 2017 and 2018.
CultivarBiomass YieldLeaf:Stem Ratio
kg ha−1
Faba bean
Fanfare1021 1.69 a
Boxer11841.85 a
Laura11901.82 a
Snowdrop9571.71 a
Tabasco13201.69 a
Pea
Nette11490.49 c
Arvika16301.12 b
LSD (p = 0.05)NS0.31
Means followed by the same letters (or no letter) within a column for each factor are not significantly different (p ≤ 0.05) according to the LSD test.
Table 7. Cover crop crude protein, p and content averaged across four environments at Hickson and Prosper, ND, USA, in 2017 and 2018.
CultivarCrude ProteinPhosphorusAsh
g kg−1
Fanfare289 b 4.73 bc74 a
Boxer304 a4.83 a77 a
Laura297 ab4.76 ab75 a
Snowdrop284 b4.66 cd73 a
Tabasco285 b4.63 de67 a
Nette264 c4.24 f44 b
Arvika298 ab4.57 e42 b
LSD (p = 0.05)140.0814
Means followed by the same letters within a column for each factor are not significantly different (p ≤ 0.05) according to the LSD test.
Table 8. Environment by cover crop interaction and mean across all environments of N accumulation in the shoot biomass of each cultivar in Hickson and Prosper, ND, USA, in 2017 and 2018.
CultivarHicksonProsperMean
2017201820172018
kg ha−1
Fanfare34.0 g 41.7 efg64.5 bcdef47.6 defg46.9
Boxer55.1 cdefg42.8 efg 90.2 ab39.2 fg56.9
Laura38.8 fg49.7 defg91.2 ab49.1 defg57.2
Snowdrop38.2 fg50.2 defg55.4 cdefg29.6 g43.4
Tabasco73.0 bcd47.4 defg84.6 abc29.0 g58.5
Nette57.3 cdefg46.4 defg55.8 cdefg29.7 g47.3
Arvika105.1 a71.3 bcde66.1 bcdef64.8 bcdef76.8
LSD (p = 0.05)30.0NS
Means followed by the same letters (or no letter) within a column for each factor are not significantly different (p ≤ 0.05) according to the LSD test.
Table 9. End of season soil NO3–N and change in soil NO3–N throughout the life of the cover crop averaged across four environments at Hickson and Prosper, ND, in 2017 and 2018.
CultivarSoil NO3–NChange in NO3–N
kg ha−1
Fanfare24.021.6
Boxer23.821.7
Laura22.123.4
Snowdrop22.722.8
Tabasco23.721.8
Nette25.919.7
Arvika24.720.9
Control26.419.1
LSD (p = 0.05)NSNS
Change in soil NO3-N from cover crop sowing to biomass harvest.

