Article

Physiological Beneficial Effect of Rhizophagus intraradices Inoculation on Tomato Plant Yield under Water Deficit Conditions

1
Department of Sustainable Crop Production, Università Cattolica del Sacro Cuore, via Emilia Parmense 84, 29122 Piacenza, Italy
2
Department of Life Sciences and Systems Biology, University of Torino, Viale P.A. Mattioli 25, 10125 Torino, Italy
*
Author to whom correspondence should be addressed.
Agronomy 2020, 10(1), 71; https://doi.org/10.3390/agronomy10010071
Submission received: 31 October 2019 / Revised: 12 December 2019 / Accepted: 31 December 2019 / Published: 3 January 2020
(This article belongs to the Section Water Use and Irrigation)

Abstract

:
Increasing drought, under current climate change scenarios, will reduce the sustainability of tomato cultivation in the Mediterranean region. The present study evaluates the effect of Rhizophagus intraradices inoculation on tomato plant physiology and yield in response to progressive water deficit conditions. Two commercial products (Prod1 and Prod2) containing only R. intraradices were tested at two different concentrations (1% and 5% of the substrate volume) using three methods of inoculation: (a) mixed to substrate, (b) dissolved in water, (c) spread on seedlings root blocks before transplant. The highest mycorrhization of root fragments (F%) was found with Prod2 at 1% w/w at 40 days after sowing (DAS); this product was therefore used in a second experiment to inoculate tomato plants and test their physiological response to progressive water deficit induced withholding irrigation. Phenology, plant height, stem diameter, chlorophyll content and fluorescence, whole canopy gas exchange, biomass production and partitioning and phosphorus content were investigated in inoculated and not inoculated tomato plants under well-watered and water stressed conditions. Vegetative period and plant height were shorter in inoculated than in control plants; moreover, inoculation with R. intraradices increased fruit production by enhancing chlorophyll content under water stress condition, PS2 efficiency, ETR, Fv/Fm, net photosynthetic rate and whole canopy WUE.

1. Introduction

According to FAO [1], tomato (Solanum lycopersicum) is the second most important vegetable crop, after potato, considering global production (about 164 million tons of fresh fruit harvested) and cultivated surfaces (4.7 million ha). For its high antioxidant content, it is recommended that an adult human eat from 25 to 32 kg of tomatoes per year [2]. In the Mediterranean region, where tomato cultivation requires high water and fertilization inputs, agro-techniques should be improved to increase the sustainability of tomato production while maintaining high yield levels to satisfy the needs of a growing population [3]. Under the current climate change scenario, the increasing temperature and the variation in rainfall intensity and distribution will increase drought and temperature-related stresses leading to reduction in crop productivity [4,5,6].
Research to increase resilience to drought and to mitigate the effects of climate change on crop yield [7] exploited conventional breeding techniques and genetic engineering to create stress-tolerant cultivars [8,9], paying little attention to the complex ecological interactions, in particular at soil level [10].
Only recently, root-associated microbial communities have received considerable attention due to their ability to improve crop productivity and stress tolerance [8,11,12,13,14]. Among plant growth-promoting microorganisms (PGPM), arbuscular mycorrhizal fungi (AMF) were the first to be identified and studied. AMF establish a mutualistic symbiosis with the roots of most land plants, including tomato [15], by forming in the root cortex typical intracellular fungal structures, called arbuscules, which are thought to be the site of nutrient exchanges between the partners [16]. AMF, which are obligate biotrophs, receive carbon compounds from the host plant [17], in return they provide water and low mobile nutrients (i.e., phosphorus) to the plant, extending its root depletion zone with their extra-radical hyphae [18,19]. Increased tolerance to abiotic stress (drought, salinity, nutrient deficiency, heavy metals and adverse soil pH) in mycorrhizal plants has been widely described in literature [20,21,22,23,24,25] and some of the underlying mechanisms have been recently investigated [26,27]. In particular, under water-deficient environment, modifications in root architecture induced by AMF (root length, density, diameter and number of lateral roots) [28] are responsible for a more efficient root system both in tree and vegetable crops [29,30]. In response to drought conditions, higher plant heights, root lengths, biomass production and net photosynthetic rates, attributable to antioxidant enzymes (superoxide dismutase, peroxidase, catalase) production and soluble sugars accumulation were found in melon inoculated plants [31]. High root-to shoot ratio and leaf water potential were found in Chile pepper [32] and high ABA concentrations were responsible for high root hydraulic conductivity and low transpiration in lettuce [33,34]. Increased water use efficiency was observed in inoculated strawberry [35] and watermelon [36]. Under drought stress, fruit yield of inoculated tomato plants was higher than in non-inoculated plants for the most effective maintenance of leaf water and leaf nutritional status (high N and P) [37,38].
Several commercial products, that include AMF in their formulation, are available on the market: they may consist of single AMF, or consortia of AMF, other fungi and rhizobacteria. For our study we focused on the effect of Rhizophagus intraradices, which is common in natural and agricultural sites, on the growth and production of one of the most common processing tomato cultivar in Emilia Romagna region, Zelig (ISI Sementi, Fidenza, Italy http://www.isisementi.com). In order to better understand the physiological modification induced by AMF colonization and promote the production and the commercialization of mycorrhizal tomato plantlets, the objective of our study was twofold: (i) to evaluate the effect of R. intraradices on tomato plant gas exchange and physiology under progressive drought stress conditions and the resulting tomato yield, and (ii) to investigate the economic feasibility of mycorrhizal tomato plantlets production.
Through a preliminary experiment, we first evaluated the extent of root cortex colonization in tomato seedlings inoculated with two commercial products containing R. intraradices at two concentrations (1% and 5% w/w) The best performing product was then used to set up a second experiment where physiological parameters, such as chlorophyll content and chlorophyll fluorescence, whole canopy net gas exchange and water use efficiency, and agronomic parameters, such as total aboveground dry biomass and fruit production, were investigated to study the response of inoculated vs. control non-inoculated tomato plants under increasing drought stress.

2. Materials and Methods

2.1. Plant Material and Growth Conditions

The effects of methods of distribution and concentration of two commercial formulations of Rhizophagus intraradices were evaluated in a preliminary experiment (Exp1). Tomato (Solanum lycopersicum cv ‘Zelig’) seeds were surface sterilized in sodium hypochlorite 3.5% for 10 min, washed in sterile water, and then put on wet paper in Petri dish to germinate. Plastic plateau (S40C, http://www.plastisavio.it/contenitori) with 83 cm3 of soil volume per plant and a final density of 245 plants m−2 were filled with Sphagnum peat (Gartenmarkt, https://www.tuttogiardino.it/it/giardino/terriccio-e-concimi/34-3121.html) having the following characteristics: bulk density 0.27 g cm−3, organic matter content 40%, 5.5–6.5 pH, and 68% v/v of water content. 1200 g of sterilized peat (30 g per plant) were homogenously mixed to the inoculum of R. intraradices.
Two commercial products of R. intraradices were tested:
(1)
Prod1: provided by MycAgro (MYCII15ZAV#3, Mycagro Lab sarl, Dijon, France http://www.mycagrolab.com) a granular inoculum containing mineral solid particles (clay, zeolite) with R. intraradices propagules (spores, hyphae pieces) and mycorrhizal root pieces mixed with mineral support powder of roots and fungus R. intraradices (cost 100 € Kg−1);
(2)
Prod2: provided by Agrifutur (Agrifutur srl, Alfianello, Italy, http://www.agrifutur.com) a powder formulation containing kaolin as carrier material and propagules of R. intraradices (cost 52 € Kg−1).
Three different modes of distribution of the two commercial products were tested:
(1)
The commercial products were homogeneously mixed to the substrate
(2)
The commercial products were dissolved in water and provided as irrigation on the germinating seedlings
(3)
The commercial products were spread on seedling root blocks before the transplant in the field.
No inoculum was added to the substrate for non-inoculated plants (M-), whilst two concentrations of inoculum (1% and 5% w/w, resulting in 12 g and 60 g of inoculum per 1200 g of topsoil) were used to induce root colonization. Twenty plants per treatment were transplanted in plastic plateau after germination and were grown in a greenhouse, with a temperature of 25 °C/21 °C day/night, 500 µmol m−2 s−1 PPFD and 16/8-h light/dark photoperiod, and relative humidity of 60% ± 10%. From germination to the first sampling time (40 days after sowing, DAS), all plants were watered twice per week with tap water and, once per week, with a modified Long-Ashton nutrient solution [39] containing 300 μM inorganic phosphate (Table S1) until plateau water capacity (~ 600 ml per plateau). A total of 40 plants per inoculum (Prod1 and Prod2) were used to assess the symbiosis development at 40, 50, 60 and 70 DAS (10 plants per sampling day). Considering the amount and the cost of each formulation and the average number of plants per square meter in an industrial tomato crop, the cost of mycorrhizal tomato plantlets production was estimated by multiplying the cost of the inoculum for the amount of inoculum used for the average number of plants per square meter (Table 1).
For Experiment 2 (Exp2) tomato seeds were treated as described in Exp1 and put on wet paper in a Petri dish for germination. Seedlings were then transplanted in closed plastic pots (3.4 L capacity) containing Sphagnum peat (Gartenmarkt) and Prod2 at 1%, thereafter M+ plants. For non-inoculated plants (M-), no inoculum was added to the Sphagnum peat (Gartenmarkt). The plants were grown in greenhouse under the same growing conditions (temperature, light intensity and duration, relative humidity and nutrient solution) used in Exp1.
Six plants per treatment (M- and M+) were randomly assigned to a well-watered (WW) or to a water-stressed (WS) treatment. On 95 DAS, all plants were irrigated until field capacity and the top of the pots was covered with PVC bags. A little slit was cut at the bottom of the plastic bag to allow tomato plant to grow through it. The slit was sealed with adhesive packing tape around plant collars to minimize evaporation losses from the soil surface. The onset of water stress was monitored gravimetrically according to [40]. The Fraction of Transpirable Soil Water (FTSW) was calculated as follows:
F T S W   =   A S W C T T S W   =   S W C     W P F C     W P
where ASWC is the Available Soil Water Content, calculated subtracting the soil water content at Wilting Point (WP) from the actual Soil Water Content SWC, and TTSW is the Total Transpirable Soil Water, calculated as difference between the soil water content at Field Capacity (FC) and that at WP. FC and WP were 68 and 15% (w/w) respectively and were determined gravimetrically in a preliminary experiment according to [41]. The addition of 1% of Prod2 increased FC and WP of about 1%.
The WW M- and M+ plants were continuously irrigated to maintain FTSW above 0.8. For the remaining 6 plants, irrigation was withheld for 13 days until 0.28 FTSW and 0.35 FTSW were reached for M- and M+ plants, respectively. This level of stress was then kept for ten days, from 113DAS to 123 DAS (Figure 1).

2.2. Assessment of AM Symbiosis Development

Two hundred randomly chosen 1 cm-long root segments, 20 root segments from 10 plants representative of each experimental condition, were stained with 0.1% Cotton Blue in lactic acid at each sampling date in Exp1. Fungal colonization was then quantified according with the Trouvelot method [42] using the MYCOCALC software freely available at: www.dijon.inra.fr/mychintec/Mycocalc-prg/download.html. Intensity of the mycorrhizal colonization in the root system (M%) and arbuscular abundance in the root system (A%) were calculated in this experiment.
In Exp2 the fungal colonization was determined at the end of the experiment (123 DAS) following the same protocol described for Exp1. In Exp2 the root system was split into two subsamples: one part was used to determine root symbiosis, whilst the remaining roots were weighted, dried at 65 °C for 4 days and weighted again to determine dry weight and P concentration.

2.3. Assessment of Physio-Phenological Traits

2.3.1. Height, Diameter, Phenology, Whole Canopy Leaf Area and Chlorophyll Content

Plant height, stem diameter and phenology were measured once a week for the entire duration of Exp2 (0–123 DAS). Whole canopy leaf area was determined once a week using the software ImageJ (NIH, http://rsb.info.nih.gov/ij/, Bethesda, MD, USA) on scanned leaves, and the results were used to normalize gas exchange data. Chlorophyll content was also non-destructively determined with SPAD 502 Chlorophyll Meter (Minolta Co., Ltd., Osaka, Japan) once a week from 100 to 123 DAS.

2.3.2. Chlorophyll Fluorescence

Chlorophyll fluorescence parameters were measured by a Fluorescence Monitoring System (Hansatech Instruments, Norfolk, UK) on the last fully opened leaf according to the method described by Zhu et al. three times from 103 to 120 DAS. Measurements on dark adapted leaves were carried out before LED lamps switching on, therefore on leaves dark adapted for 8 h. A saturating pulse of irradiation of 2000 μmol m−2 s−1 was applied for 3 s to measure the maximal fluorescence (Fm) in the dark-adapted state. The leaves were then placed under actinic light of 3000 μmol m−2 s−1 to determine the maximal fluorescence (Fmʹ) and the minimal fluorescence in the light-adapted state (F0′), and the steady-state fluorescence (Fs). Photochemical quenching coefficient (qP), non-photochemical quenching coefficient (NPQ), the maximal quantum yield of PSII in the dark-adapted state (Fv/Fm), effective photochemical efficiency of PSII (ΦPSII) and electron transport rates (ETR) were calculated according to the following Equations [43]:
F v / F m   =   ( F m   F 0 ) F m

2.3.3. Gas Exchange Measurements

From 100 DAS to 120 DAS, tomato plants were enclosed in an open automated self-assembled multi-chamber gas exchange apparatus, as described in [44]. The system enables continuous recording of CO2 and H2O differentials for the entire duration of the experiment. The air flow entering in each sampling chamber is measured upstream each chamber in order to calculate net photosynthetic and transpiration rate and regulated according to plant leaf area in order to prevent CO2 and H2O stagnation inside the sampling chamber. In Exp2 the air flow rate in the chambers was set at 0.0015 m3 s−1. The polyethylene sampling chambers had a volume of 0.068 m3 ± 0.008, so a complete volume air change occurred approximately every 50 s. Diurnal direct and diffuse light was always constant from 7 a.m. to 7 p.m. for the entire duration of the experiment. Net photosynthetic (Pn, μmol s−1 m−2) and transpiration rates (E, mmol s−1 m−2) were calculated from flow rates and CO2 and water vapor differentials using the formula provided in [45] and normalized for the whole canopy leaf area previously measured. Whole-canopy instantaneous WUE (wcWUEi) was calculated as Pn/E ratio (μmol CO2/ mmol H2O) according to [44]. The daily average of whole canopy transpiration rate and wcWUEi was plotted against daily FTSW values. A two-slope linear model was fitted [40] in order to calculate the FTSW thresholds (FTSWt) per each treatment. This index represents the FTSW value below which transpiration rate starts to decrease [46].

2.3.4. Plant Biomass Production, Partitioning, Growth and P Content

Plant biomass production and partitioning was determined on 123 DAS. The aboveground plant biomass was divided into leaves, stems, and fruits. Tomato leaves were scanned (Scanjet 3970) and the software ImageJ was used for leaf area determination. Leaves, stems and fruits were put in an oven at 65 °C for 4 days to determine dry matter and P content.
Leaf area and dry weight of tomato leaves were used to calculate Specific Leaf Area (SLA, cm2 g−1) and Leaf Area Ratio (LAR, cm2 g−1), according to the Equations:
S L A = l e a f   a r e a   ( c m 2 ) d r y   l e a f   m a t t e r   ( g )
L A R = l e a f   a r e a   ( c m 2 ) a b o v e g r o u n d   d r y   m a t t e r   ( g )
Half of the belowground plant biomass was dried at 65 °C for 4 days, weighted and then used for P content determination. Total P content (ppm) of leaves, stems, root, and fruit was determined through acid digestion (1:100) using nitric acid method and analysed by inductively coupled plasma emission ICP-OES (mod. 5100, Agilent Technologies, Santa Clara, CA, USA).

2.4. Statistical Analysis

Analysis of variance was performed using the Agricolae R package. Three-way ANOVA, with product type, concentrations and sampling date as main factors, was carried out in Exp1 and, when the F-test was significant, mean separation was performed by Tukey test at p < 0.05 and p <0.01. Degree of variation around means is given as standard error (SE). In Exp2 two-way ANOVA, with inoculation and drought stress as main factors, followed by post-hoc Tukey test was performed.

3. Results

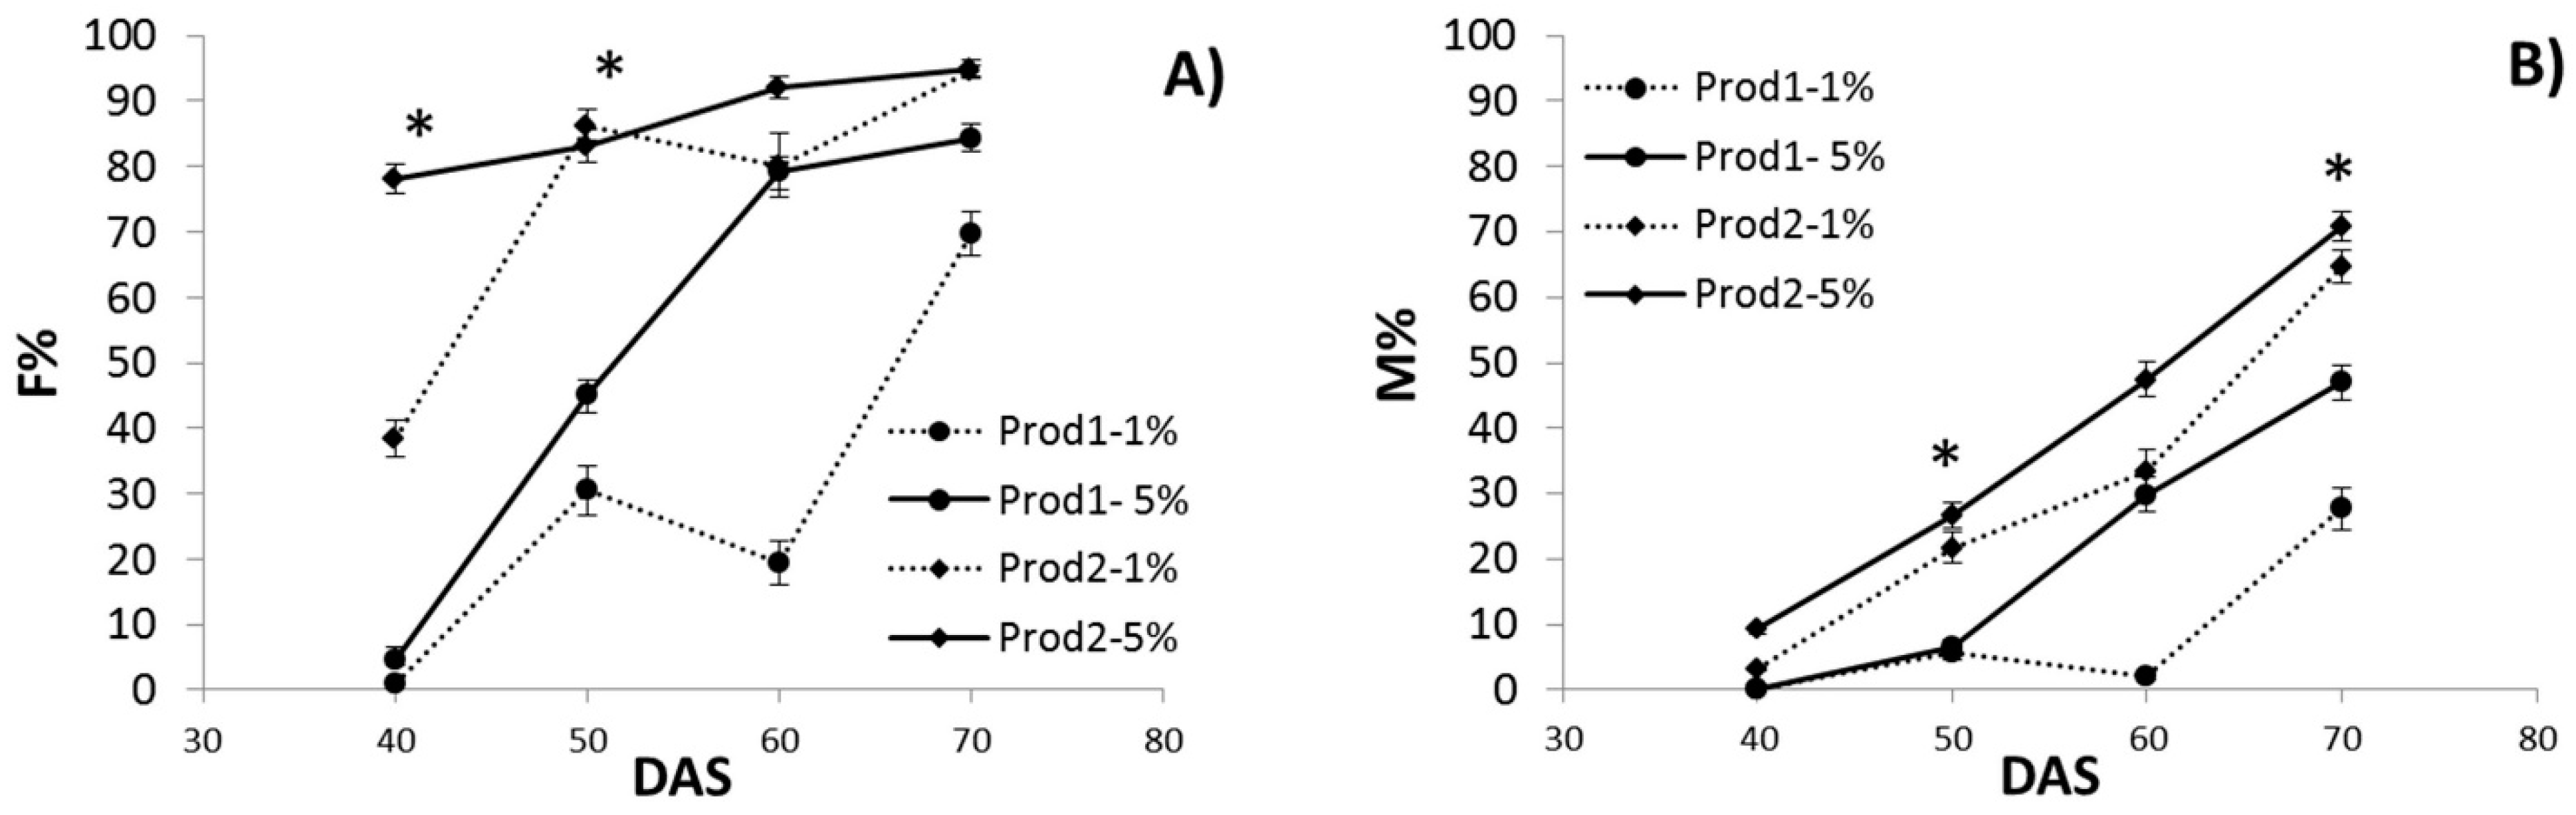
3.1. Assessment of AMF Symbiosis Development

Out of the three mode of AMF distribution (data not shown), only mixing commercial inoculum to peat resulted in significant level of root mycorrhization. At the highest product concentration (5%), frequency of mycorrhization of root fragments (F%) was highest with Prod2 in the first 2 sampling times but no significant difference of F% was found between Prod 1 and Prod2 at 60 and 70 DAS (days after sowing). The effect of product concentration was minor and rather inconsistent in time and at the last sampling time (Figure 2A).
The intensity of root cortex colonization (M%) was significantly affected both by product and concentration (Figure 2B). With Prod2 M% increased linearly from the first (40 DAS) to the last sampling time (70 DAS) without significant differences between product concentrations. With Prod1 M% started later, at DAS 50 at the highest concentration (5%) and at 60 DAS at 1%, but then progressed linearly at a rate similar to that measured with Prod2. At 70 DAS, M% was higher using Prod2 (at both concentrations) than using Prod1 at 1% (M% = 28) and Prod1 at 5% (M% = 47).
Inoculation costs were estimated considering the purchase of the AMF inoculum only, as applications cost were considered negligible. Inoculation of 1 ha of a processing tomatoes crop (40,000 plants ha−1) ranged from 104 € with Prod2 at 1% concentration to 920 € with Prod1 at 5% concentration (Table 1).
We considered the amount of product used in order to obtain a frequency of mycorrhization (F%) above 30% at 40 DAS, that is an average lifetime of tomato seedlings when they are sold to the farmers. Considering the cost of Prod1 and Prod2 per seedling and an average number of plant m−2, the use of mycorrhizal tomato seedlings with Prod2 at 1% will increase by 12% the actual cost per hectare of tomato seedlings (Table 1).
The results obtained in the preliminary experiment (Exp1), modality “a”, were instrumental to determine the commercial product and the relative concentration to be used in Exp2. In Exp2, Prod2 at 1% concentration was used for a deeper characterization of plants responses to AMF colonization and drought stress. At the end of the experiment (123 DAS), frequency of mycorrhization of root fragments was F = 80%, intensity of root cortex colonization was M = 70%, average presence of arbuscules within the infected areas was a = 95% and arbuscules abundance in the root system was A = 70%.

3.2. Assessment of Physio-Phenological Traits

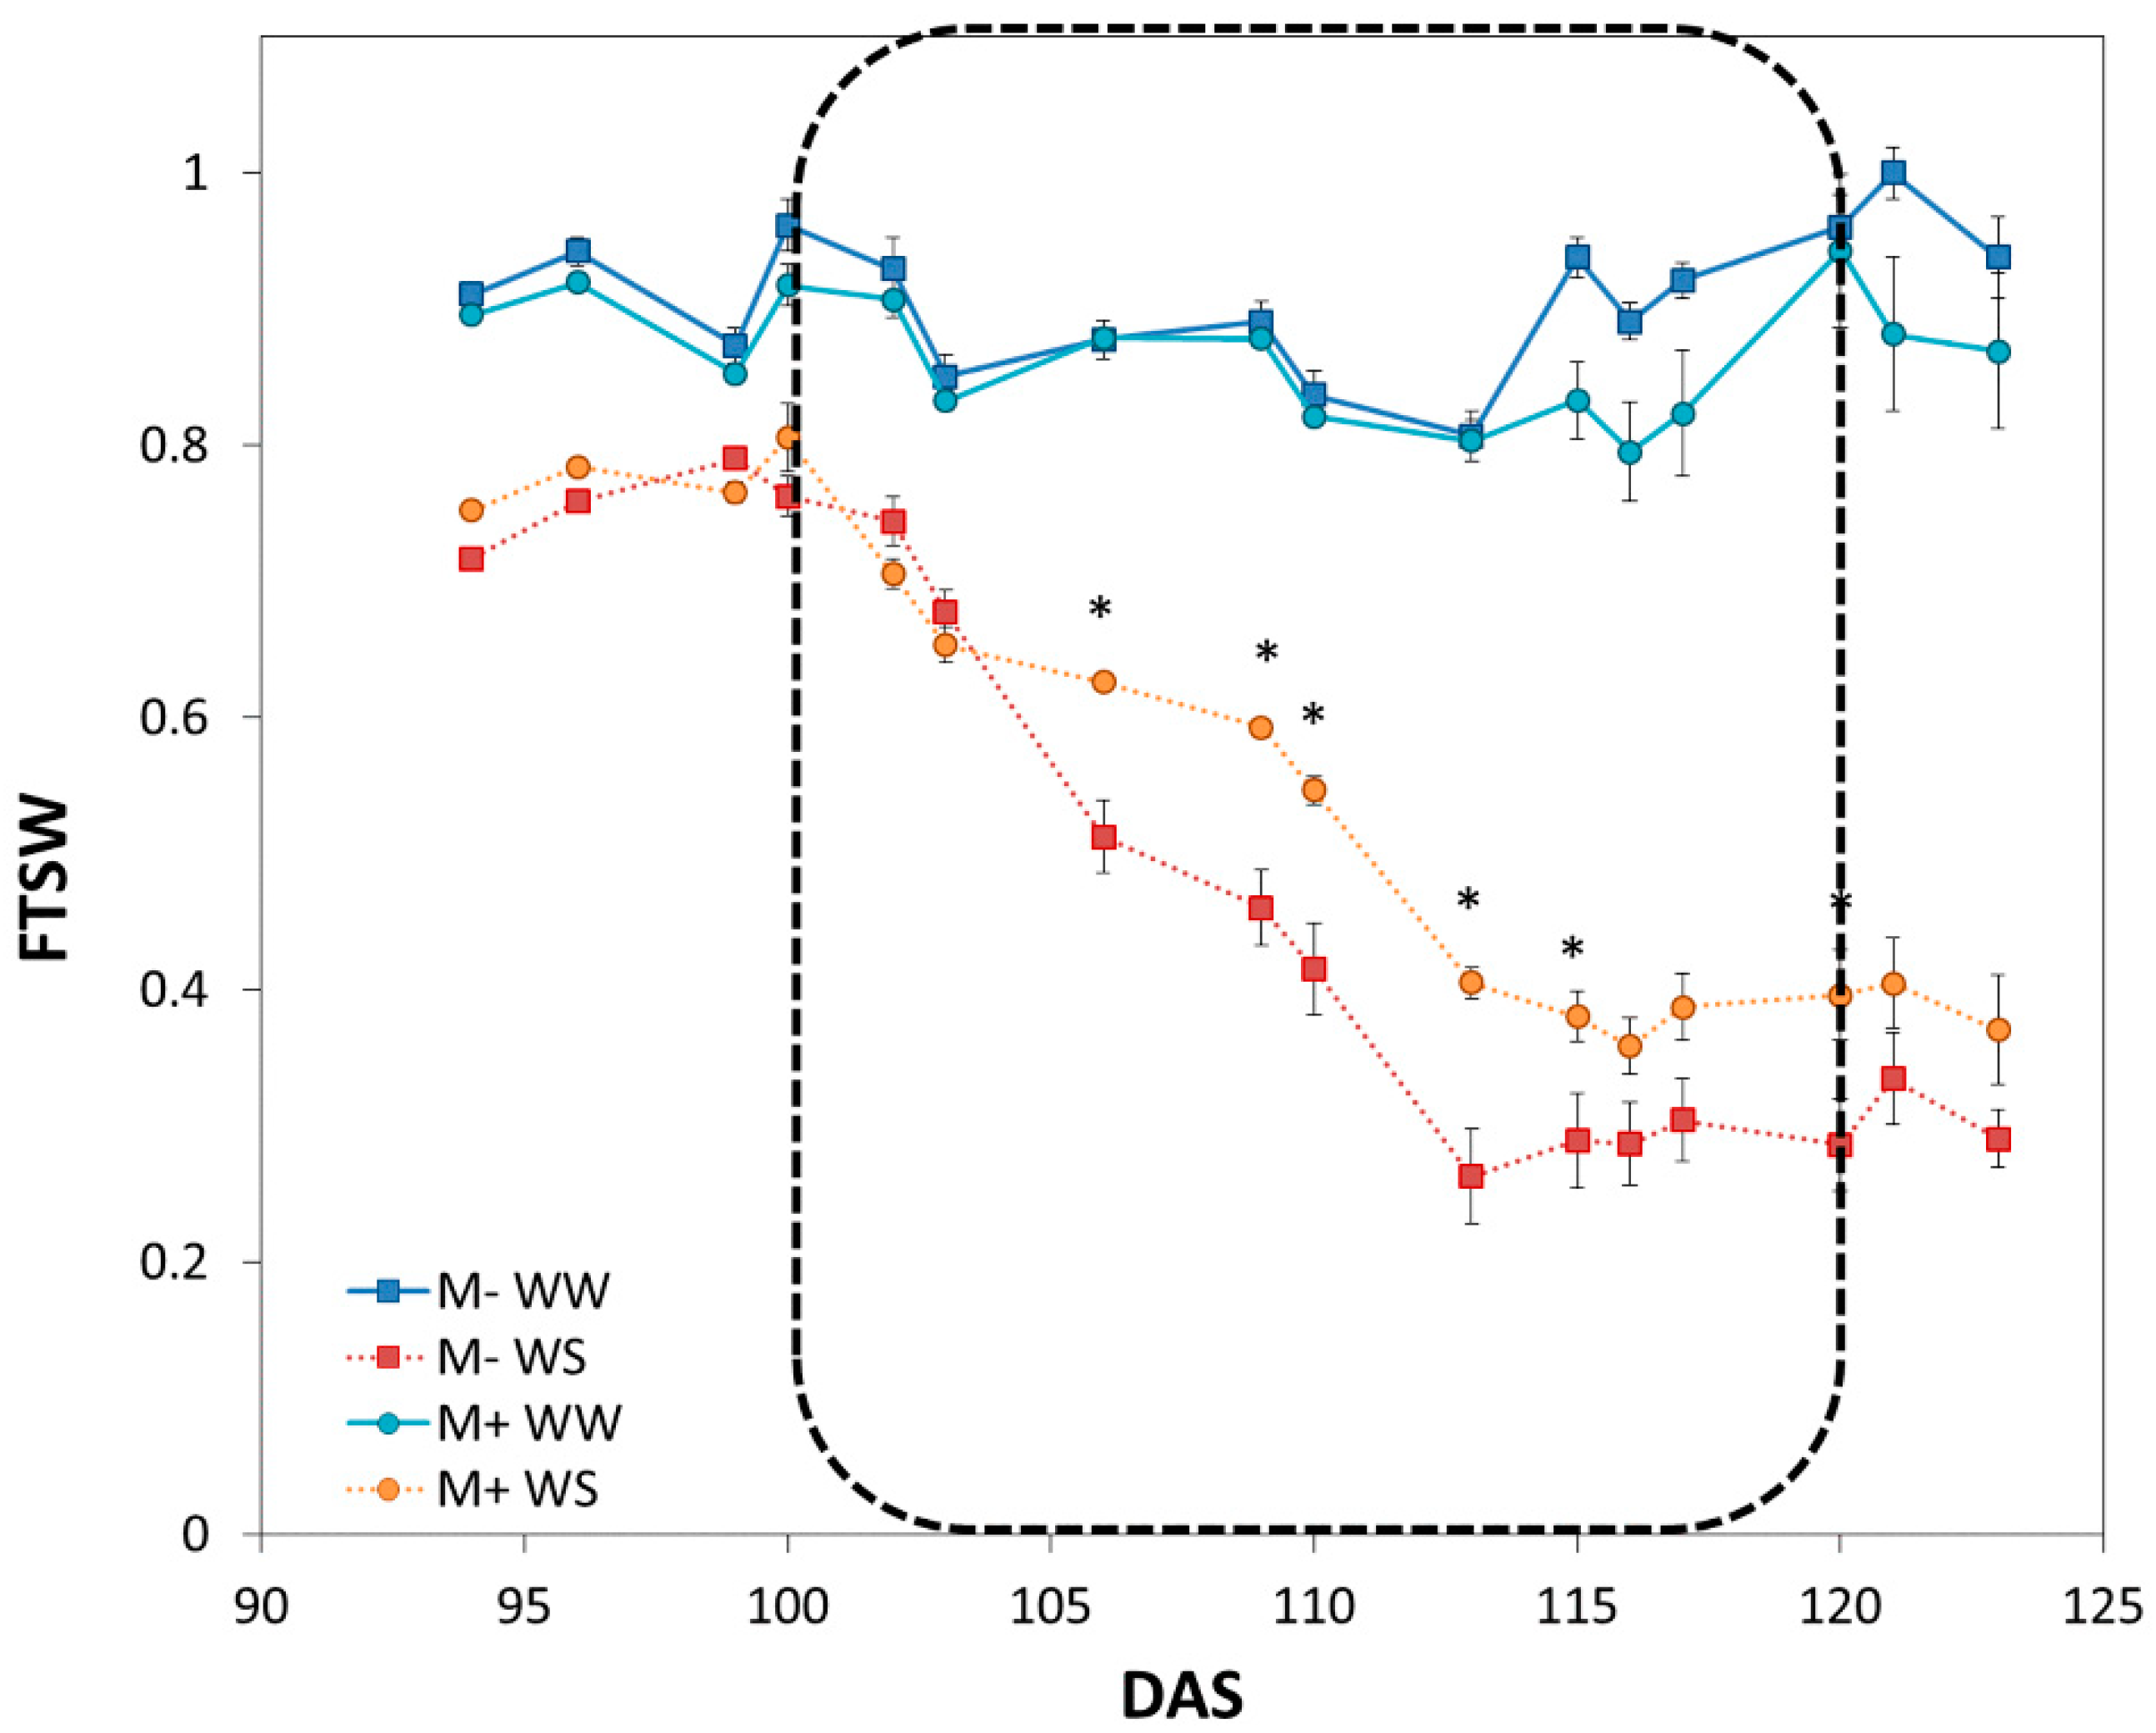
3.2.1. Characterization of Drought Dynamics

The average time course of soil water deficit of M+ (mycorrhizal) and M- (non-mycorrhizal) tomato plants investigated under WW (well-watered) and WS (water stressed) conditions is expressed as Fraction of Transpirable Soil Water (FTSW) and was measured since the beginning of the experiment. In Figure 1 we reported the trend of FTSW from DAS 93 to DAS 123. FTSW of WS plants decreased linearly from the day when irrigation was withheld (DAS 100) until the lowest value of FTSW was reached, which was 0.28 on 113 DAS in M- plants and 0.35 FTSW on 116 DAS in M+ plants (Figure 1). From that moment on, irrigation was restarted to maintain FTSW at these minimum values (0.28 and 0.35 for M- and M+ plants, respectively), until plants were harvested for plant biomass determination (at 123 DAS for M- and M+ plants).

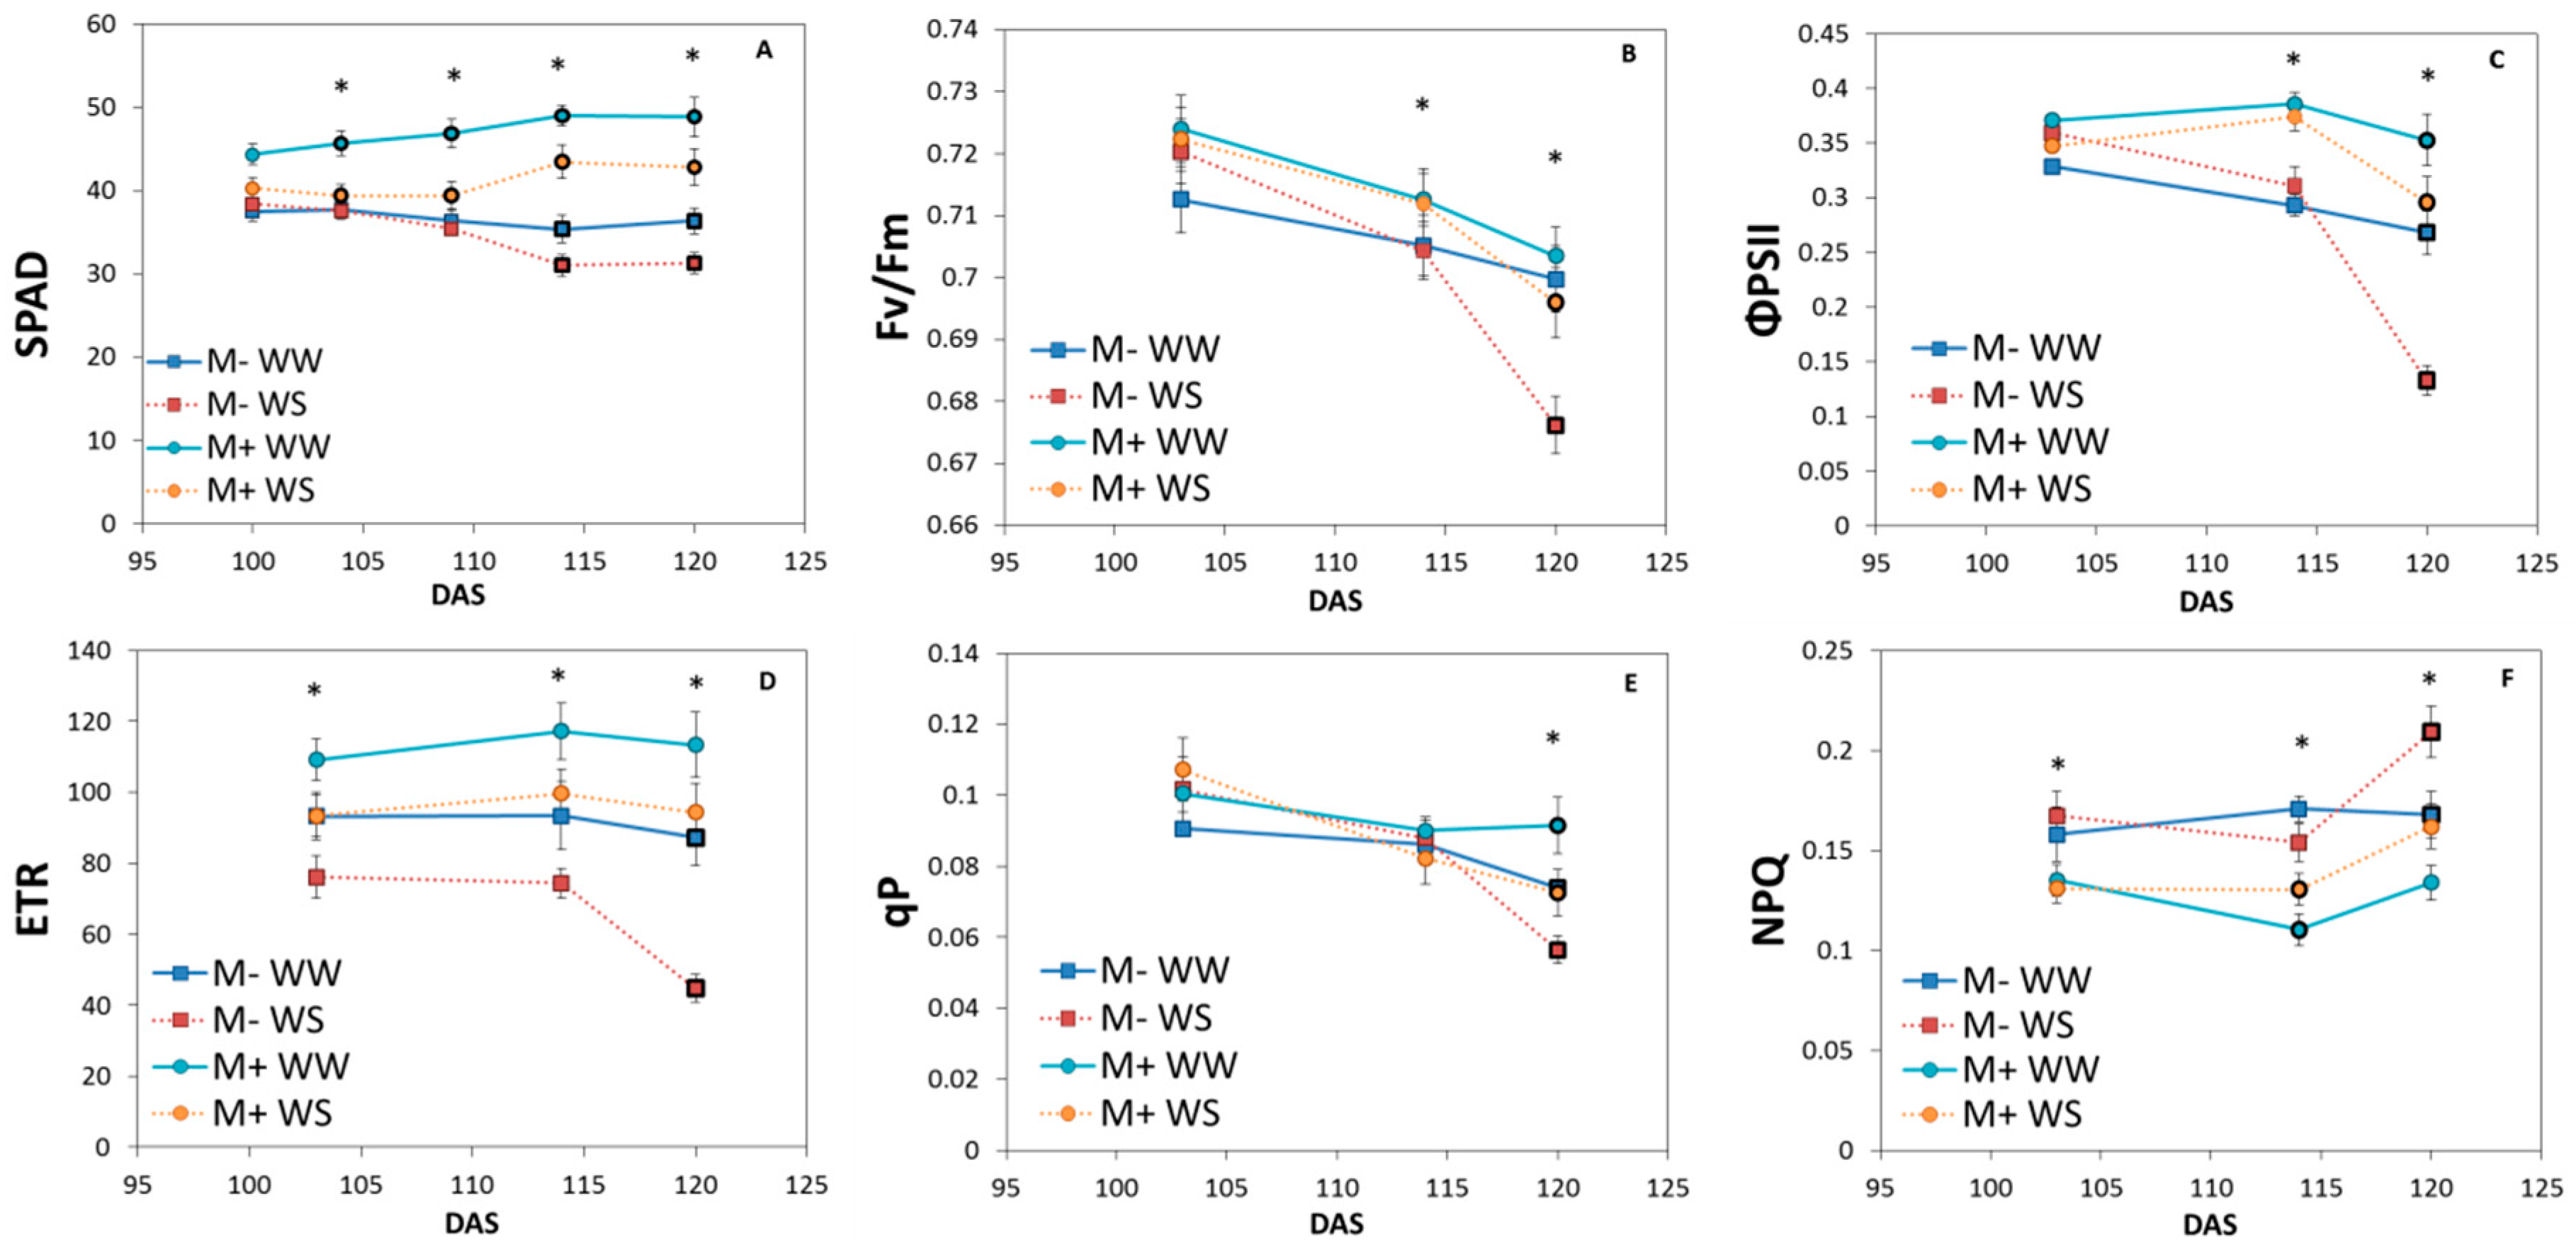
3.2.2. Chlorophyll Content and Fluorescence

Leaf chlorophyll content, expressed as SPAD values, was higher in WW M+ plants (46.9) than in WS M+ plants (41.1) and M- plants (WW and WS, 36.7 and 34.7, respectively) considering the average of all the SPAD values recorded during the experiment (Figure 3A). During the measurements inside the gas exchange apparatus (100–120 DAS), SPAD values increased for M+ plants and slightly decreased for M- ones (Figure 3A). All WW plants showed no significant change of SPAD values during the experiment (Figure 3A). Maximum quantum yield (Fv/Fm), photosystem II efficiency (ΦPSII), electron transport rate (ETR), photochemical quenching (qP) and non-photochemical quenching (NPQ) were monitored once a week between 100 and 120 DAS (Figure 3B–F). Differences in Fv/Fm between the two water treatments increased progressively during the stress period, reaching statistical significance on 120 DAS (p < 0.05, Figure 3B). Differences in Fv/Fm between WS M+ and M- plants became significant on 114 DAS (p < 0.05) and kept increasing until 120 DAS (p < 0.01; Figure 3B). On 114 DAS, ΦPSII was on average higher for M+ plants than for M- (p < 0.01, Figure 3C). ΦPSII was reduced by drought stress to a greater extent in M- plants than in M+ ones (p < 0.01; Figure 3C). Similarly, ETR was higher in M+ than in M- plants both in WW and WS conditions (Figure 3D). Drought stress affected ETR significantly in M- plants but not in M+ plants (Figure 3D).
ETR of WS M- plants was significantly lower than ETR of WW M- plants on 120 DAS (p < 0.01, Figure 3D). Differences in qP between water treatments and between M- and M+ plants became significant only on 120 DAS (p < 0.05, Figure 3E). On 120 DAS, qP was higher in WW M+ plants than in WS M- (p < 0.01), WW M- (p < 0.05) and WS M+ ones (p < 0.05, Figure 3E). NPQ was statistically different between M+ and M- plants since 103 DAS (Figure 3F). On 114 DAS, NPQ started to be significantly affected by drought in M+ plants, resulting in an increase of NPQ of WS M+ plants (p < 0.05, Figure 3F). On 120 DAS, also NPQ of M- plants were significantly affected by drought stress (p < 0.05, Figure 3F).

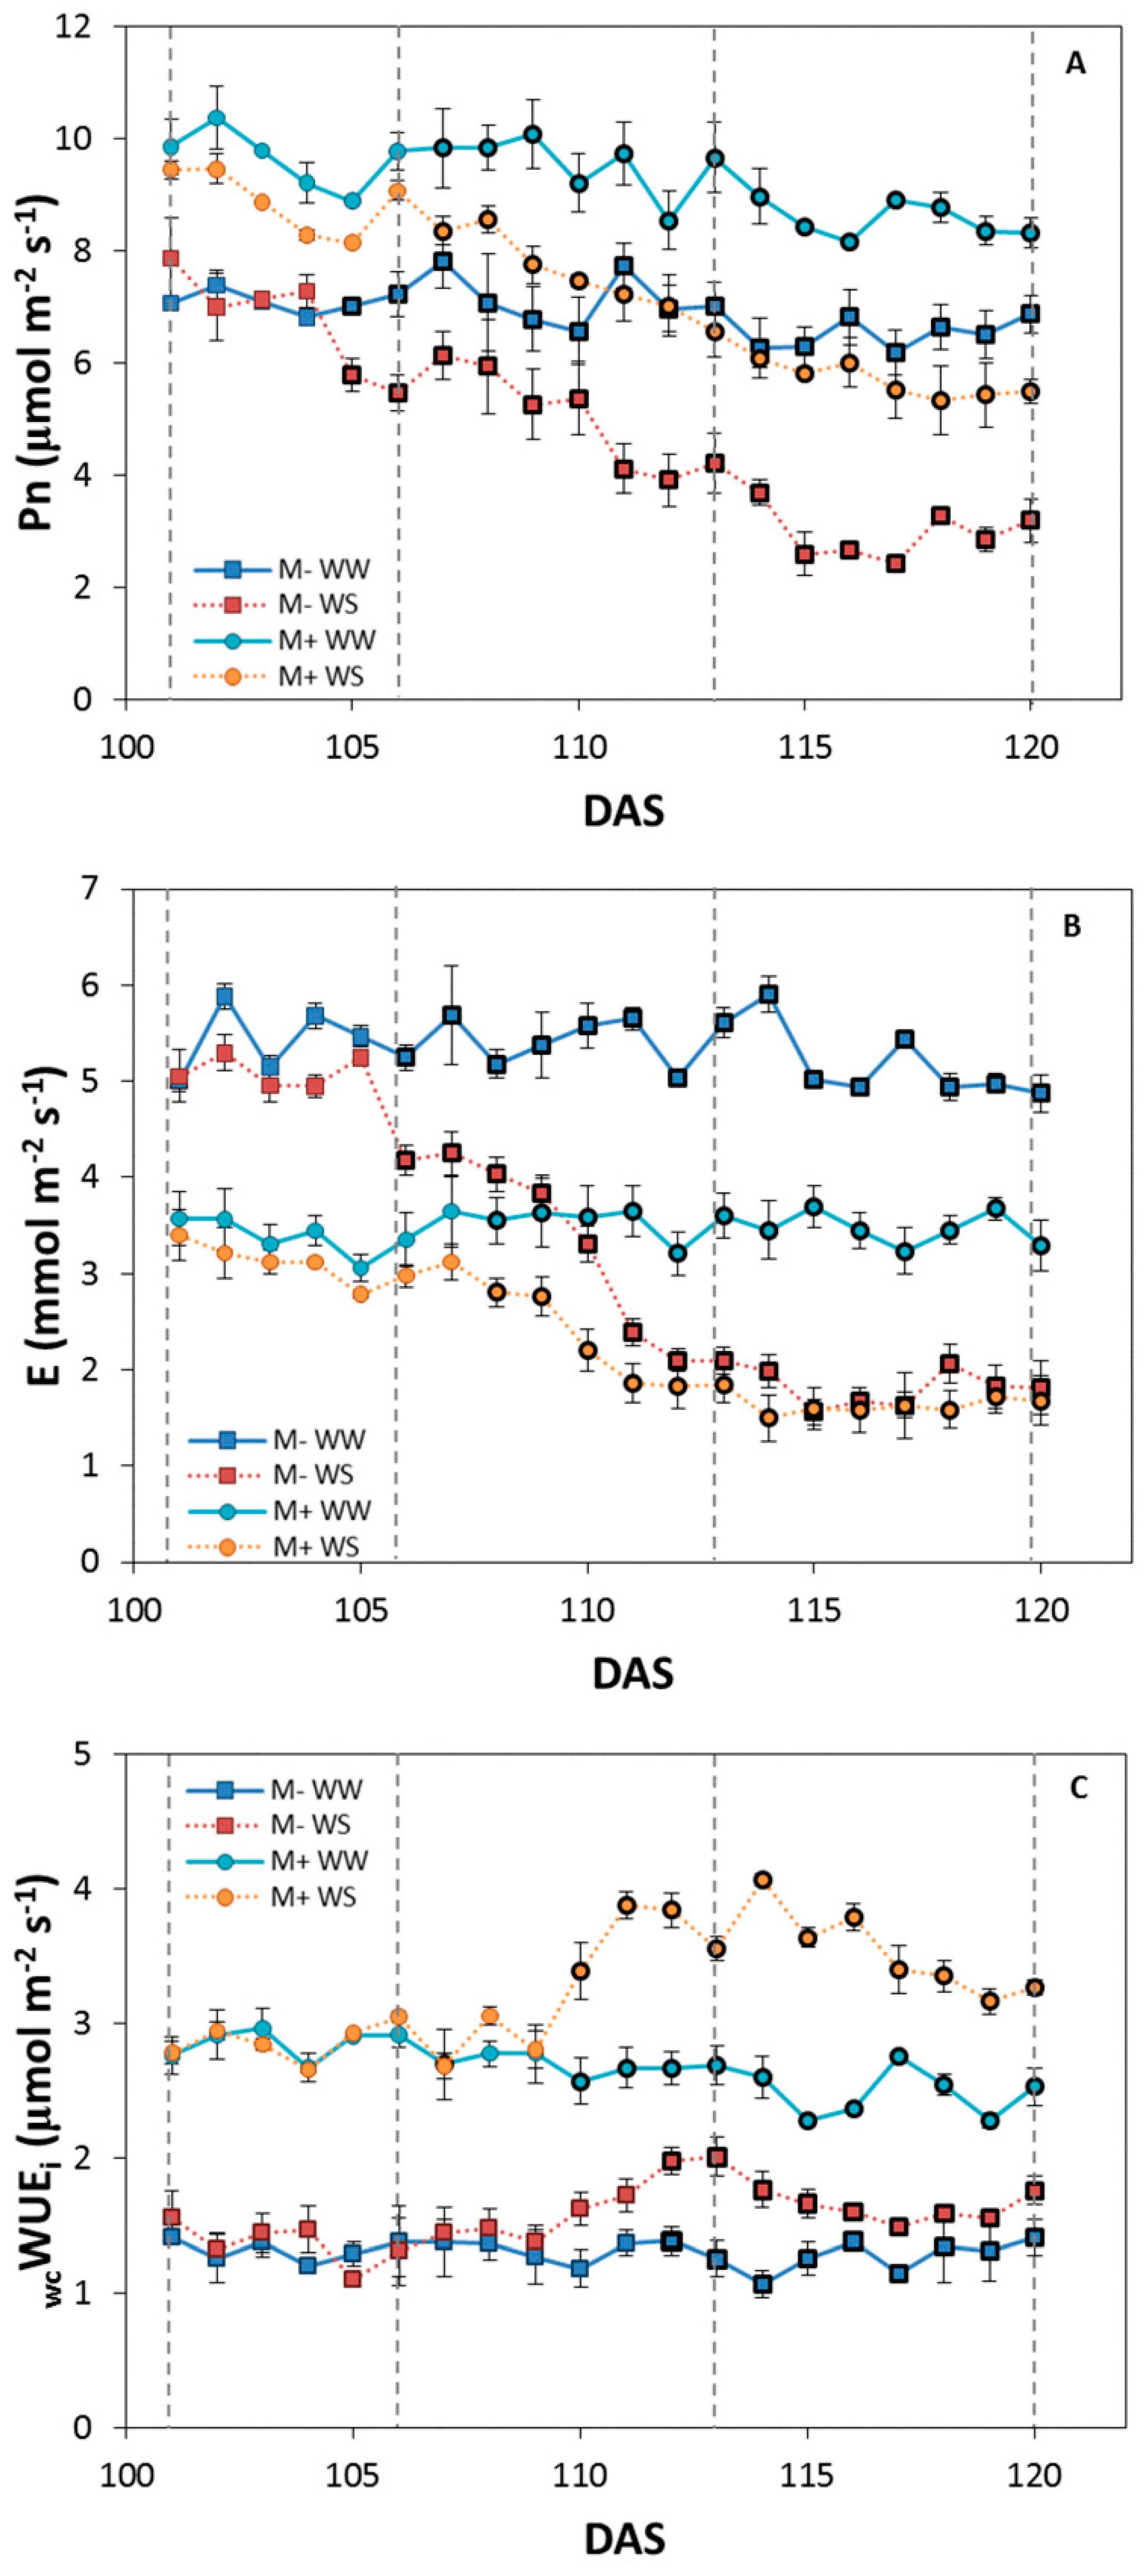
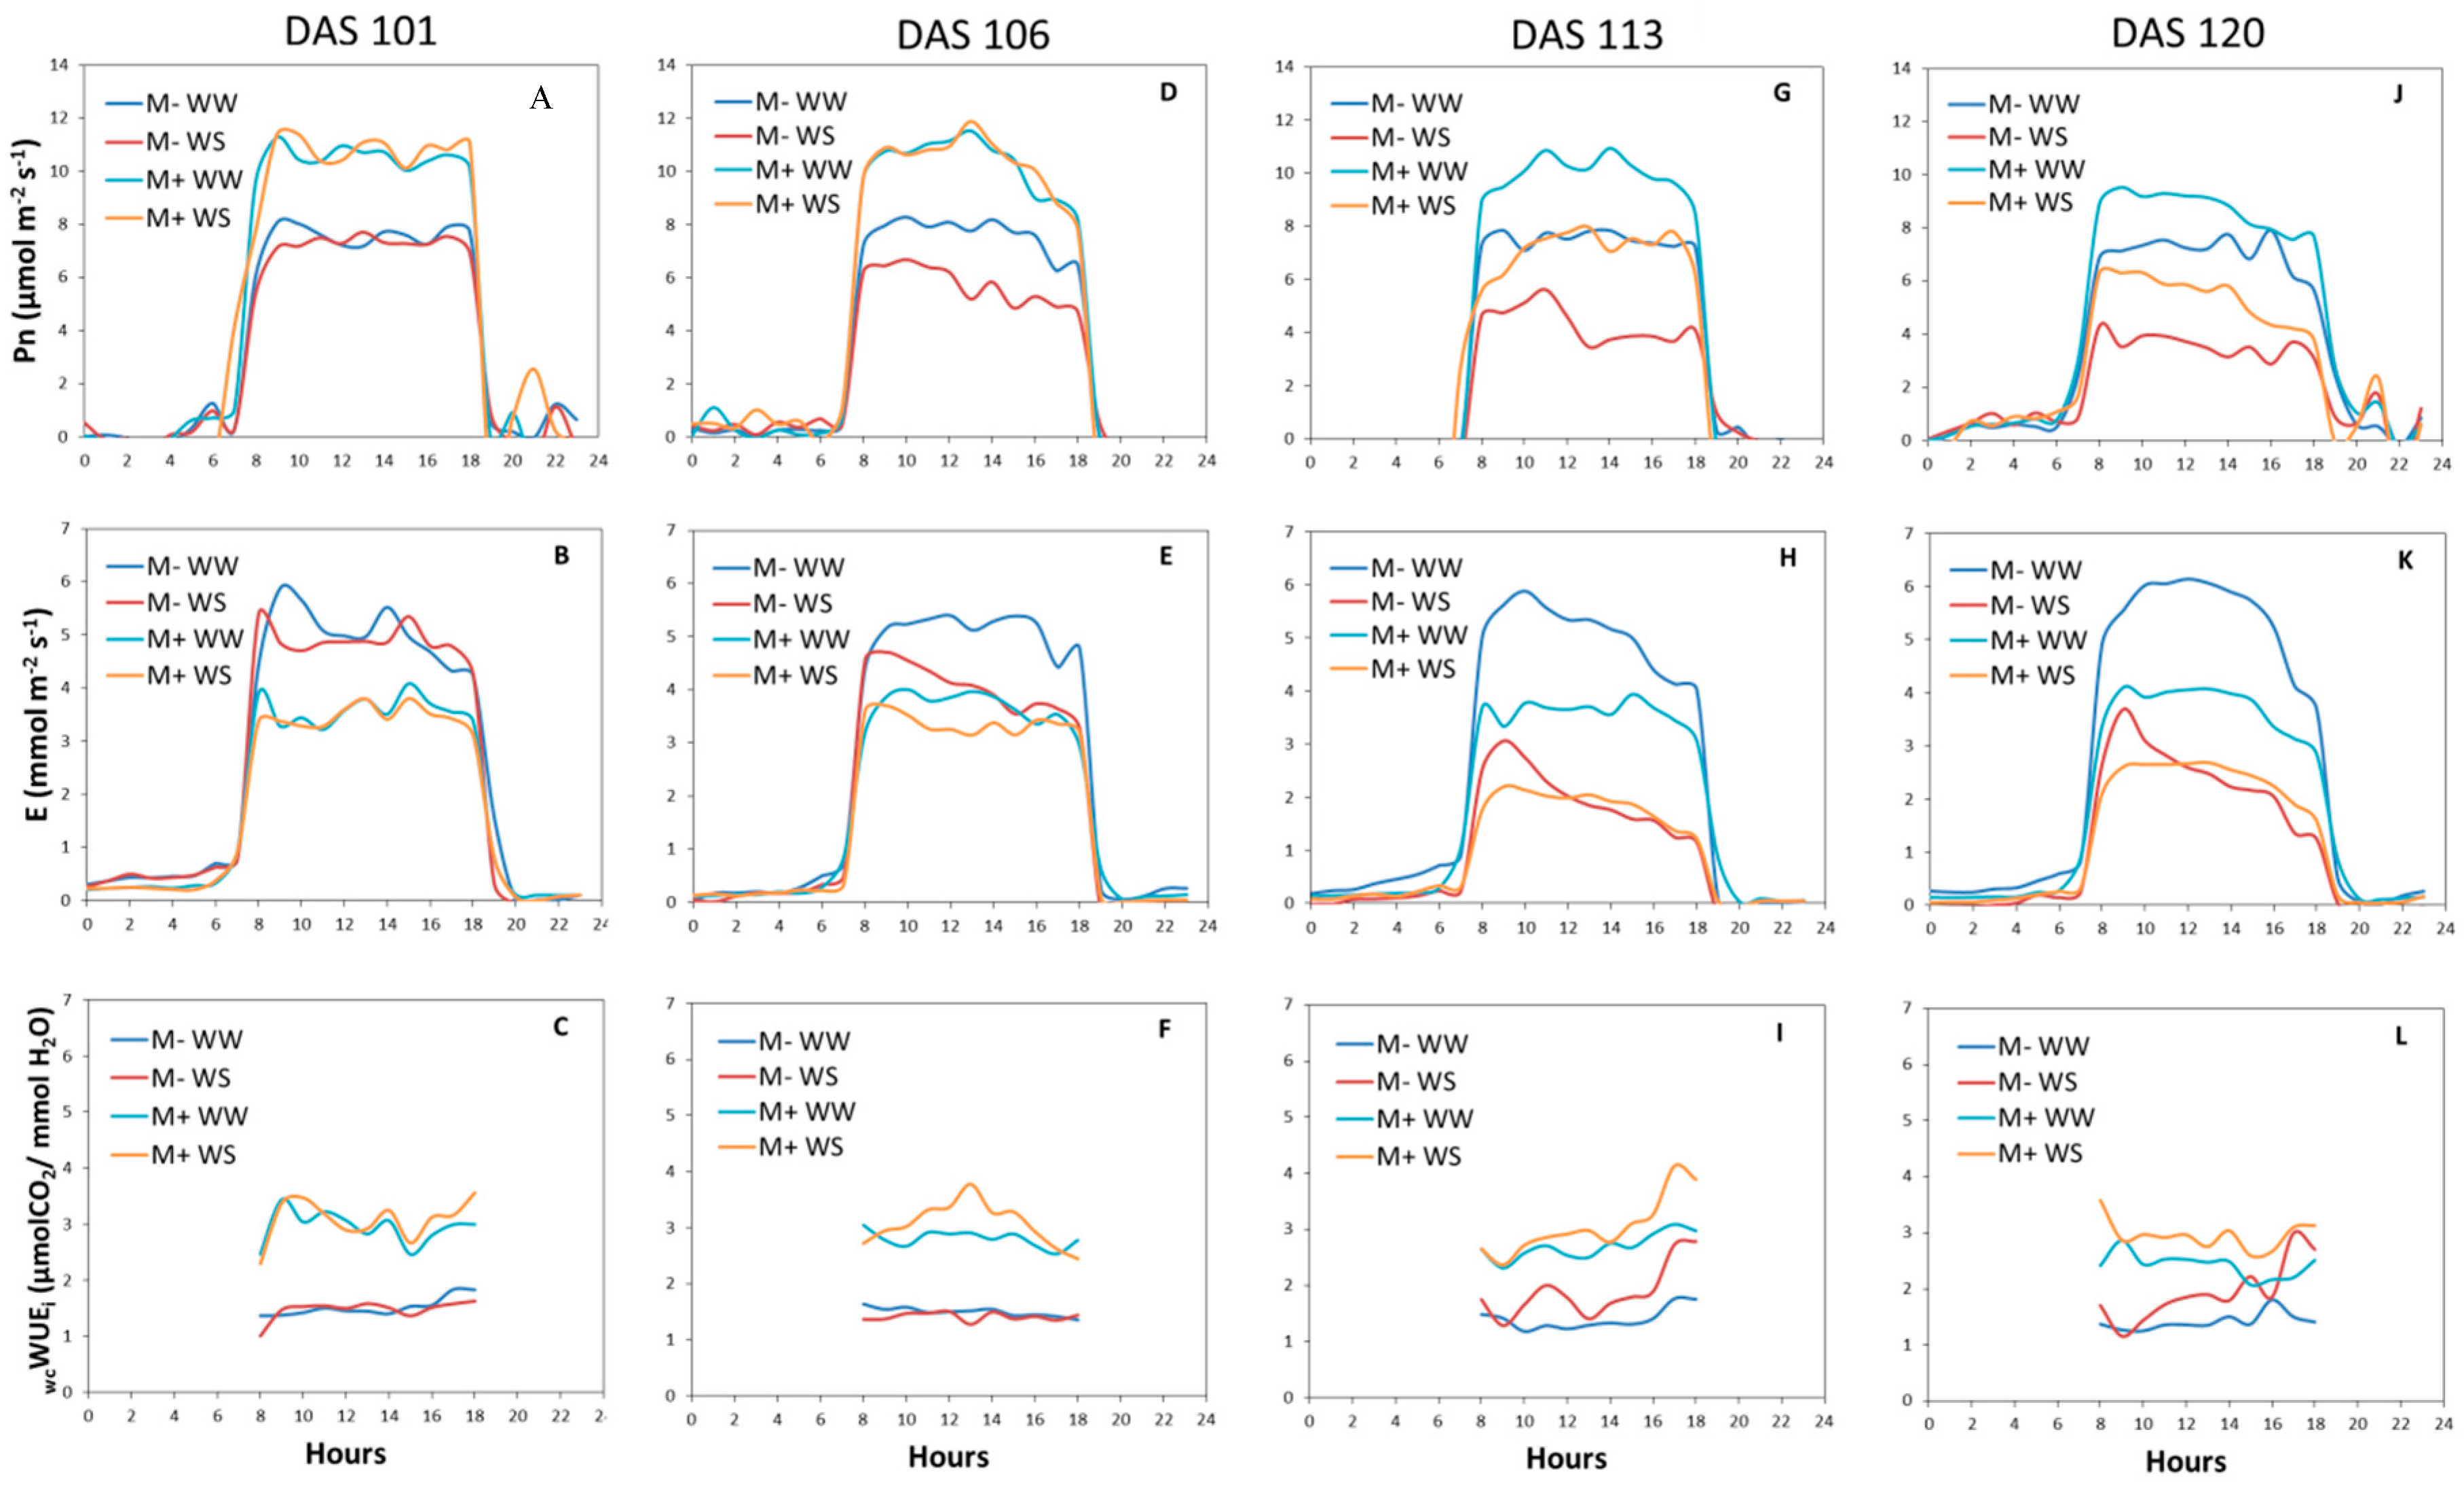
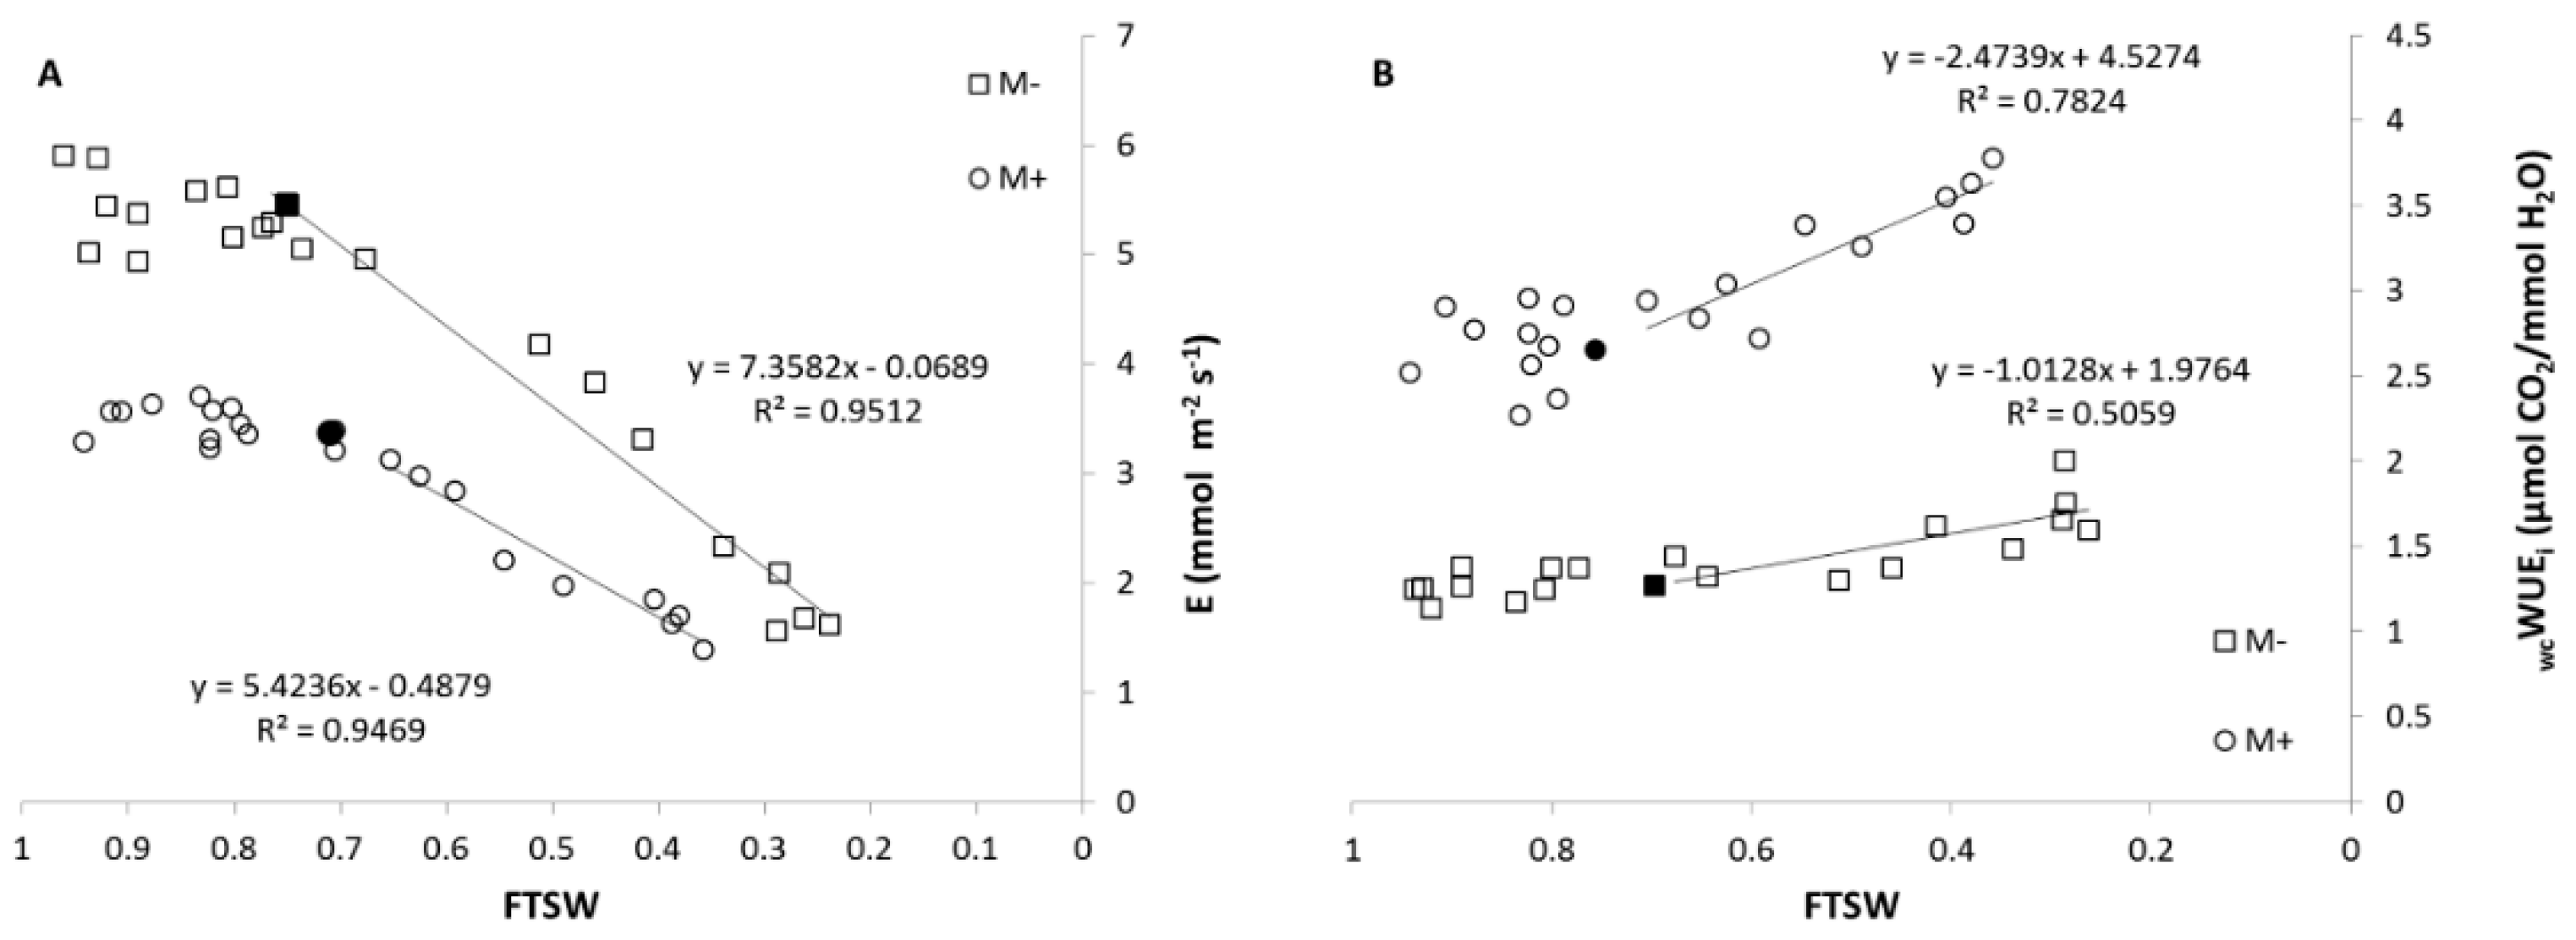
3.2.3. Gas Exchange Measurements

The multi-chamber system ran continuously for 20 days, from 100 DAS to 120 DAS. The system recorded the air temperature entering (inlet) and leaving (outlet) the chambers. Mean daily temperature of inlet air was 22.3 °C; mean daily temperature of outlet air was 24.3 °C and 24.1 °C for the chambers hosting WW and WS plants respectively.
Mean daily net photosynthetic rate (Pn) for WW M+ and WW M- plants was constant for the entire duration of the experiment (Figure 4A). On average, Pn of M- plants was significantly lower than Pn of M+ plants both in WW and WS conditions (p < 0.05). Mean Pn under WW conditions was 6.9 μmol m2 s−1 and 9.3 μmol m2 s−1 for M- and M+ plants, respectively (p < 0.05, Figure 4A). Under WS condition, Pn of M+ and M- plants decreased proportionally to the decrease of FTSW, starting from 106 DAS and 104 DAS for M+ and M- plants respectively (Figure 4A). On average drought stress reduced the photosynthetic rate of M- and M+ plants by approximately 30% and 20%, respectively.
A similar trend was observed for mean daily transpiration rate (E; Figure 4B). Under WW conditions, E was lower for M+ than for M- plants (3.5 and 5.3 mmol m2 s−1 for M+ and M-, respectively, p < 0.05). Under WS condition, E started to decrease on 106 DAS in M- plants and two days later, on 108 DAS, in M+ plants (Figure 4B). Thereafter and until harvesting, E decreased linearly by about 38% (3.2 mmol m2 s−1) in M- plants and by about 30% (2.3 mmol m2 s−1) in M+ plants.
Whole-canopy instantaneous WUE (wcWUEi), expressed as Pn/E ratio (μmol CO2/ mmol H2O), was higher in M+ plants (2.8 μmol CO2/mmol H2O) than in M- ones (1.3 μmol CO2/mmol H2O) throughout the experiment (Figure 4C). The difference in wcWUEi became statistically different between water treatments on 110 DAS for M+ plants and on 112 DAS for M- ones (Figure 4C, p < 0.05). On average wcWUEi under WS condition was 1.6 and 3 μmol CO2/mmol H2O for M- and M+ plants, respectively.
Figure 5 reports the diurnal variation of Pn, E and wcWUEi of four representative moments of the dry-down experiment: before the water stress occurred (0.77 FTSW for WS plants, 101 DAS, Figure 5A–C), at 0.56 FTSW (106 DAS, Figure 5D–F), 0.34 FTSW (113 DAS, Figure 5G–I) and at 0.28 FTSW (120 DAS, Figure 5J–L).
Before the onset of drought stress (0.77 FTSW, 101 DAS), Pn was constant throughout the day for M+ (11.1 μmol m2 s−1) and M- plants (7.8 μmol m2 s−1, Figure 5A). Daily E was also constant throughout the day for M+ and M- plants (3.1 mmol m2 s−1 and 4.5 mmol m2 s−1, respectively) (Figure 5B). Therefore, wcWUEi was constant throughout the day without significant differences between water treatments but with significant differences between the mycorrhization treatments (p < 0.05, Figure 5C).
At 0.56 FTSW, on 106 DAS, water availability affected WS M- plants, whose Pn was 28% lower than that of WW M- plants (p < 0.05, Figure 5D). At 0.56 FTSW, Pn of WS M+ plant was not different from that of WW M+ ones and it was stable during the day (Figure 5D). E of WS M- plants decreased by about 27% compared to WW M- plants (Figure 5E); the decrease became significant after 10 a.m. and lasted until 6 p.m. (p < 0.01). On the same DAS, E of WS M+ plant was lower but not statistically different from E of the WW M+ plants (Figure 5E). wcWUEi at 0.56 FTSW was similar to that recorded at 0.77 FTSW for M- plants, while it was slightly higher in WS M+ plant (Figure 5F).
At 0.34 FTSW (113 DAS), Pn of WS M- plants was 44% lower than that of WW M- plants, whilst Pn of WS M+ plants were 27% lower than that of WW M+ plants (Figure 5G). The daily trend of Pn of M+WS plants was constant throughout the day, whilst Pn of M- WS plants significantly decreased between 11a.m. and 1p.m. (Figure 5G). E of WS M- and M+ plants was 47% and 37% lower than that of WW plants, respectively (Figure 5H). wcWUEi of WS plants at 0.34 FTSW increased by 10% and 17% in the M- and M+ plants, respectively (Figure 5I).
At 0.28 FTSW (120 DAS), on average Pn in WS plants was 47% lower than in WW plants both in M- and M+ plants (p < 0.01). The Pn reduction started after 2 p.m. (Figure 5J) when VPD was high (data not shown). E was affected more in M- plants (reduction by 51%) than in M+ ones (reduction by 37%) (Figure 5K). Daily E started to decrease in M- plants after 10 a.m., whilst it started to decrease after 2 p.m. in the M+ ones (Figure 5K). wcWUEi of WS M+ plants were statistically higher than that of WS M- ones (Figure 5L).
The effect of drought stress was different for M+ and M- plants. FTSWt was, in fact, 0.75 and 0.70 for M- and M+ plants, respectively (Figure 6A, full symbols). Differences between M- and M+ plants were observed also in the trend of wcWUEi in response to increasing water stress (Figure 6B). Under WW conditions M- plants had lower value of wcWUEi compared to M+ ones. wcWUEi increased linearly with increasing water stress, with a rate that was higher for M+ plants than for M- ones (Figure 6B). Similarly, the threshold after which wcWUEi started to increase was 0.69 and 0.75 FTSW for M- and M+ plants, respectively (Figure 6B).

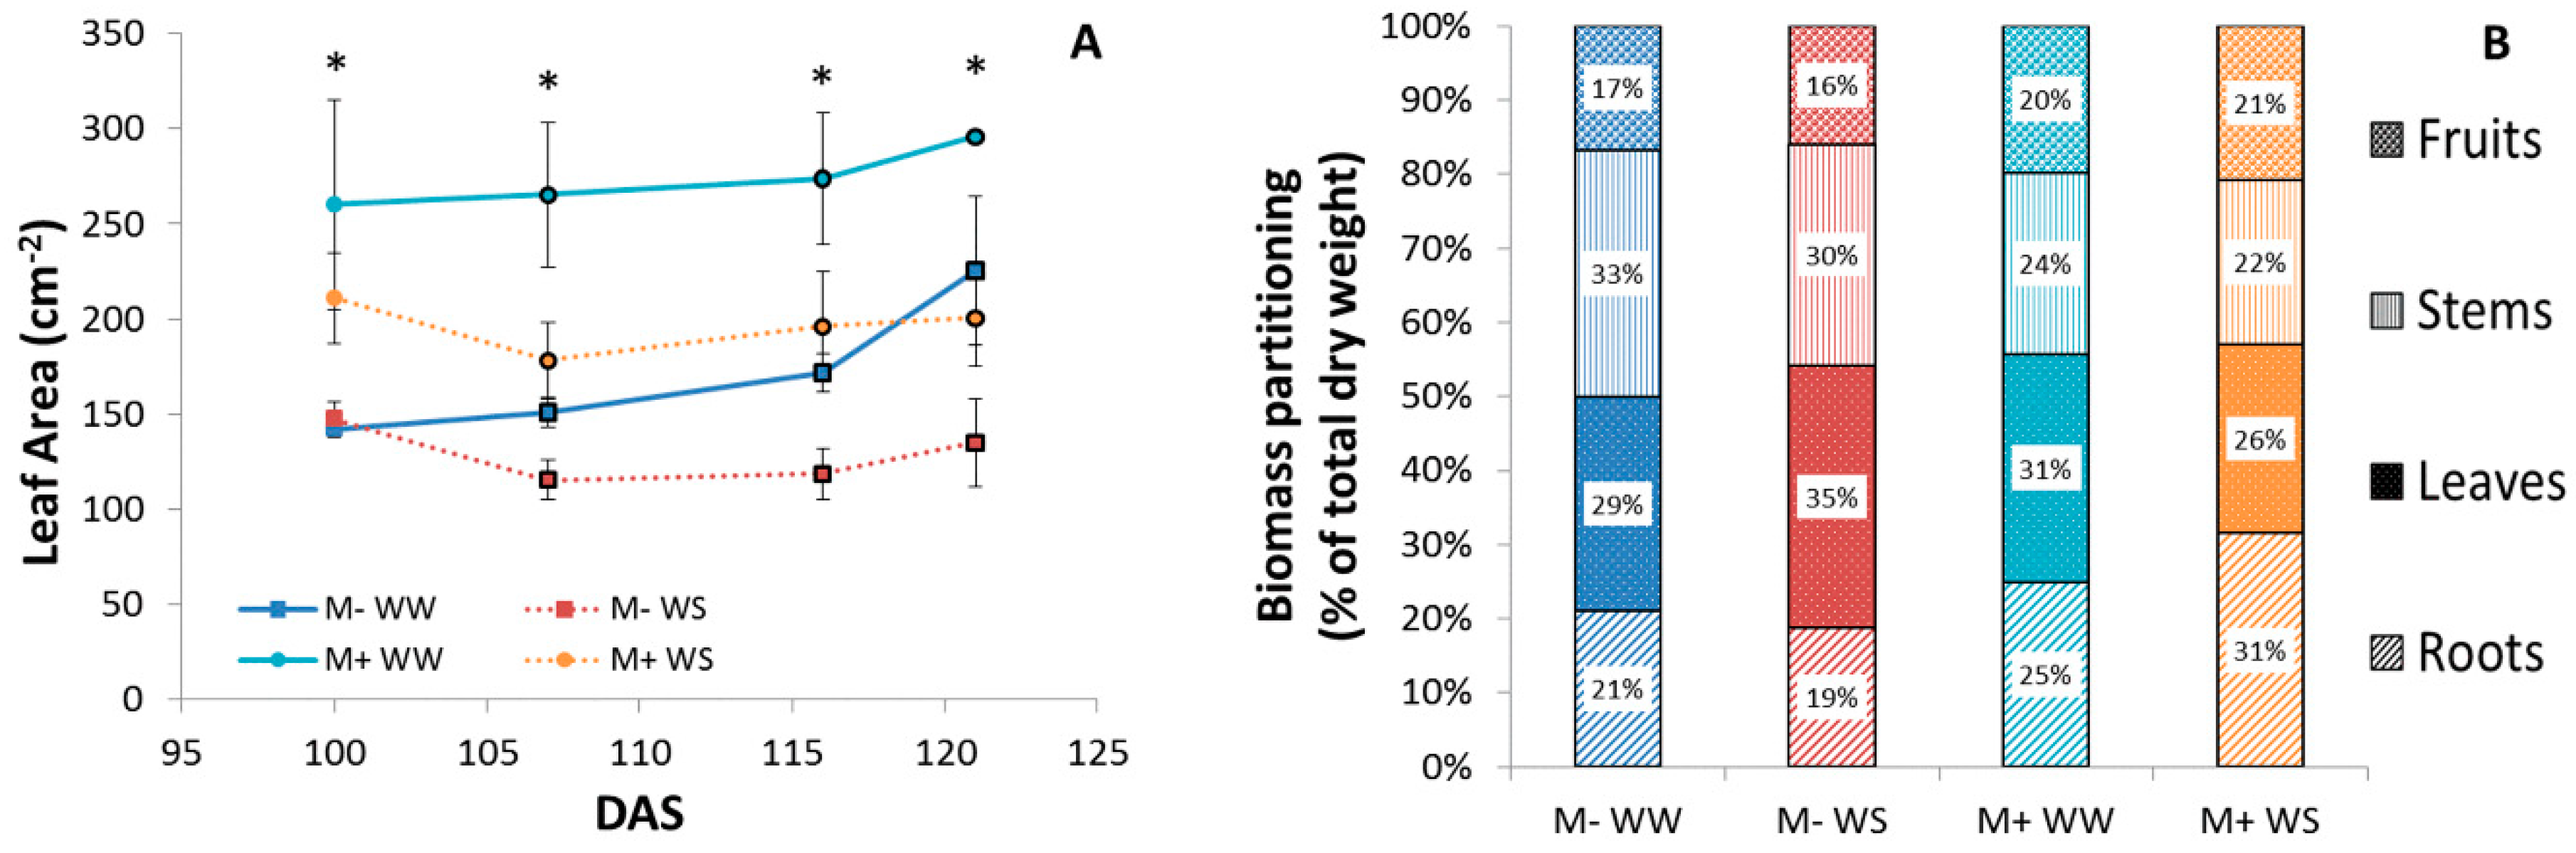
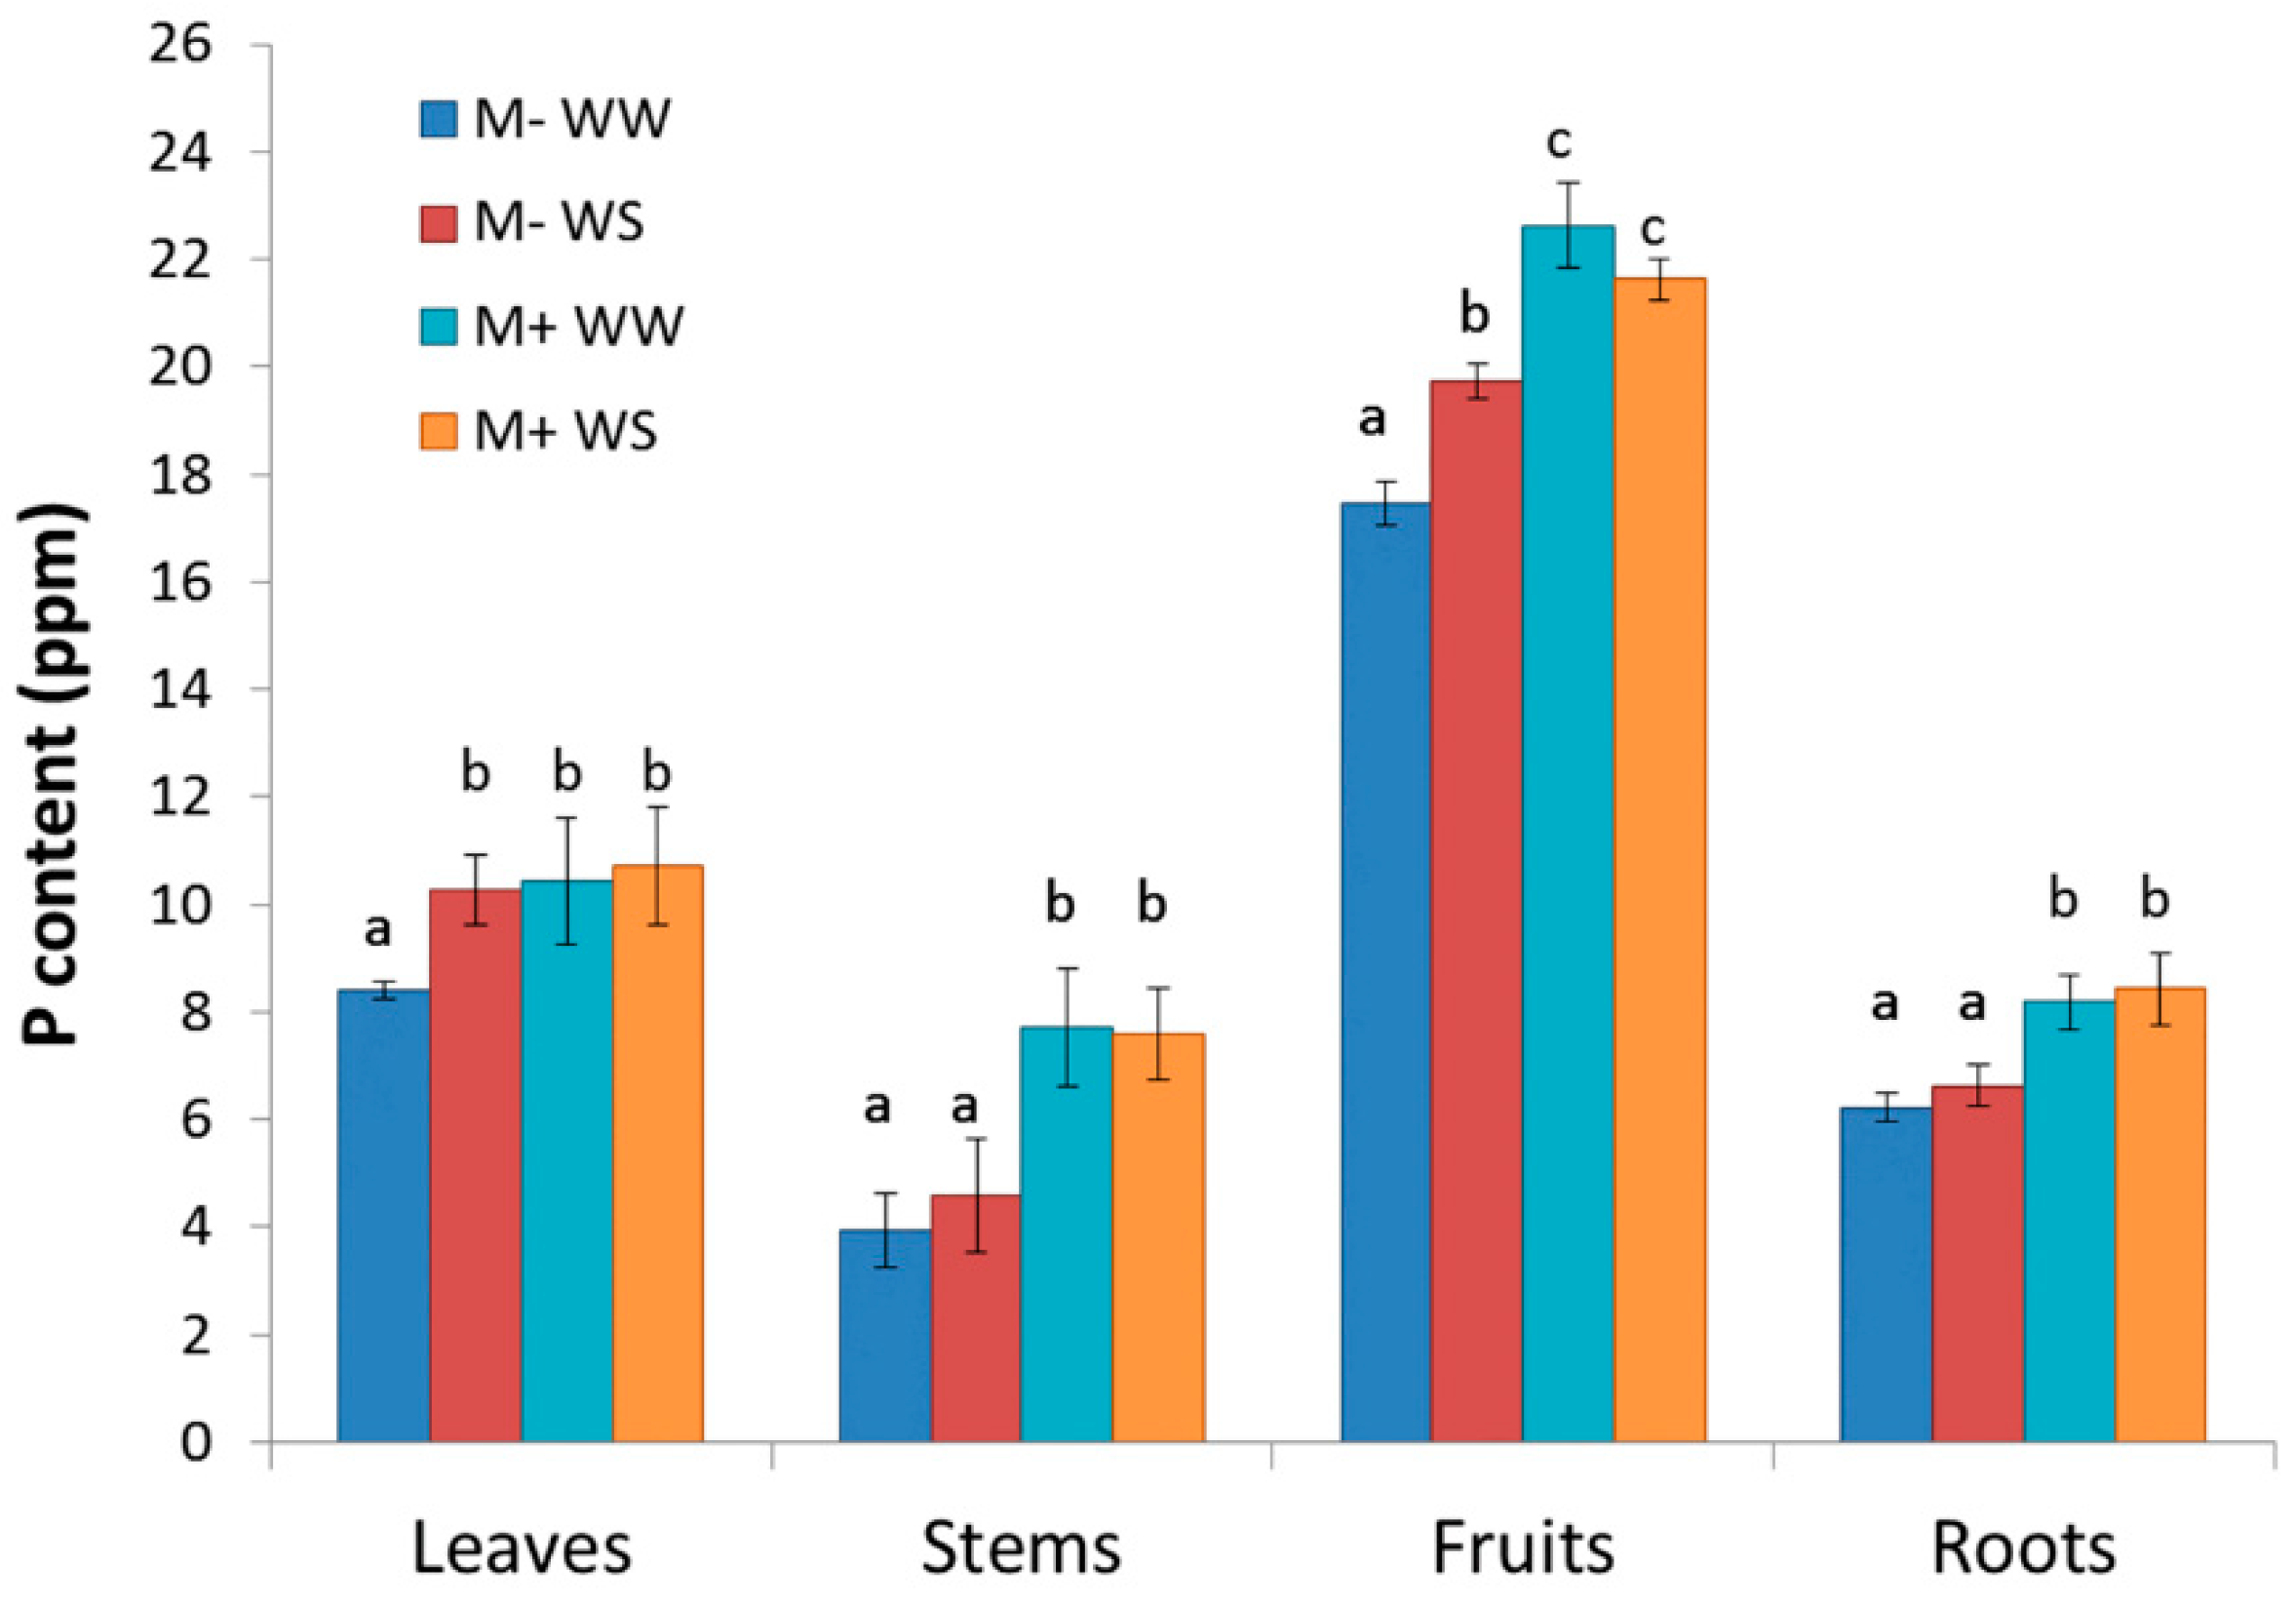
3.2.4. Plant Biometry, Phenology, Biomass Production and Partitioning, Leaf Area, Growth and P Content

In Exp2, difference in height between M+ and M- plants became significant from 90 DAS. At sampling date (120 DAS), M+ plants (49.1 cm) were shorter than M- ones (61.3 cm) (Table 2). Drought stress did not affect plant height in M+ or M- plants.
Plant stem diameter of M- and M+ plants increased in response to drought stress (p < 0.05, Table 2). Mean flowering date (defined as the date at which 50% of the plants had produced the first flower) occurred 12 days before in M+ plants than in M- ones. The number of flowering branches per plant was greater in M+ than in M- plants (p < 0.05, Table 2), whilst the number of fruit per branch was lower in M+ plants than in M- ones. In addition, fresh weight of tomato fruits was higher in M+ WW plants (25.3 g) than in M- WW ones (12.4 g). Statistically significant inoculation x drought stress interaction was observed (p < 0.05, Table 2) where drought stress increased tomato fruit production of M+ plants and reduced tomato fruit production of M- ones (Table 2).
Aboveground dry matter (g/pot) was higher in M- plants than in M+ ones (p < 0.05, Table 3). Drought stress did not decrease aboveground dry matter in M- whilst reduced aboveground dry matter in WS M+ plants even though not significantly (Table 3). Belowground dry matter of M- was statistically higher than in M+ plants (p < 0.05, Table 3). No differences were induced by drought stress. Total dry matter (leaves, stems, fruits and roots) was on average higher in M- plants than in M+ plants (p < 0.05, Table 3), without any significant effect induced by drought stress. SLA was higher in M+ than in M- plants and was not affected by drought stress (Table 3). LAR was higher in M+ than in M- plants (p < 0.05, Table 3) and drought stress significantly reduced LAR both in M+ and in M- plants (p < 0.05, Table 3).
Leaf area measured during the experiment resulted significantly affected by AMF colonization (p < 0.05, Figure 7A) and by water treatment (p < 0.05, Figure 7A), but no statistically significant interaction mycorrhization x water treatment was found. M+ plants had leaf area higher than M- plants through all the experiment, both under WW and WS conditions; on the last day of measurement, water stress resulted in a reduction of 32% and 40% for M+ and M- plants respectively (Figure 7A).
Biomass partitioning (expressed as % of total dry biomass) to leaves and stems was higher in M- plants than in M+ ones (p < 0.05, Figure 7B). On the contrary, biomass partitioning to fruits and roots was higher in M+ than in M- plants (p < 0.05, Figure 7B).
P content (ppm) was higher in M+ plants (48.4 ppm), with no differences caused by drought stress, than in WS M- plants (41.2 ppm) and in WW M- ones (36.1 ppm). P content was differently allocated in plants organs and tissue. On average M+ plants showed higher P content in stems, fruits and roots than M- plants (Figure 8). P content of leaves of WW M- plants was statistically lower than WS M-, WW M+ and WS M+ plants (p < 0.05, Figure 8). Drought stress led to an increase in P content in fruits of M- plants, whilst in M+ plants drought stress induced a non-significant decrease in fruit P content (Figure 8).

4. Discussion

4.1. Assessment of AM Symbiosis Development

Obtaining homogeneously AMF inoculated plants is limited by several constraints such as the physical (e.i. substrate used) [47] or chemical (e.i. salinity) [48] properties of the substrate used, or the nutrients availability, especially P and N [49,50]. In our experiment the major limitation to an effective homogeneous inoculation through “a” mode of distribution was the physical structure of the products used. In fact, being Prod1 a granular inoculum, it was difficult to mix it homogeneously with peat and to distribute in the plateau. Prod2, on the other hand, being a powder formulation, was much more suitable for the homogenization with peat and the distribution in plateau. The poor symbiosis development obtained with “b” mode of distribution was a consequence of the insolubility in water of Prod1 and of the impossibility to keep Prod2 in suspension. The failure of the “c” mode of products distribution is unclear and needs further investigation; probably the competition with soil microbial community, or adverse weather conditions at transplant in open field, or roots structure, prevented AMF symbiosis.
Once the modality of inoculation was assessed, we investigated the economic feasibility of tomato seedlings production with a frequency of mycorrhization (F%) above 30% at 40 DAS, that is an average lifetime of tomato seedlings when they are sold also to the farmers and transplanted in the field. Considering the cost of Prod1 and Prod2 per seedling and an average number of tomato plant m−2 in the field, the use of mycorrhizal tomato seedlings with Prod2 at 1% will increase by 12% the actual cost per hectare of tomato seedlings (Table 1). As proved by Exp2, AMF symbiosis affected tomato physiology decreasing the vegetative period and increasing of 8.5% the tomato fruit production. All these results benefit all the stakeholders of tomato industry from production to cultivation and processing. In fact, the nurseryman with the minimum increase of 12% of the cost would easily sell on the market a certified AMF tomato seedling to the farmer; the farmer, on the other hand, will experiment the benefit of colonization and the improved water use efficiency as well as the shortage of the vegetative period and the increase in tomato fresh fruit production. The reduction of vegetative stage in AMF tomato led to an extension of harvesting period and consequently more time for tomato processing plants. Of course, further investigations in open field conditions are needed to definitively assess the hypothesized increased in tomato yield.

4.2. Ecophysiological Assessment of AM Symbiosis in Tomato

Beneficial effects of AM symbiosis on tomato plants are reported in literature [15,27]. In addition, to the expected effects on roots [48,51,52], AMF colonization contributes to modify gene expression in tomato fruits [53,54] and leaves, in particular genes involved in defense process, transport and hormonal metabolisms [55,56] as well as in lignin synthesis [15]. As previously mentioned, the beneficial effects of AM symbiosis observed during this experiment are the basis of an economic feasibility study aiming at the promotion of production and commercialization of mycorrhizal tomato plantlets.
The Eco physiological beneficial effects were all related to the photosynthetic performances of AM tomato plants compared to the non-inoculated ones during a progressive drought stress. In particular, the main effects were related to the efficiency of PS2, chlorophyll content and gas exchange that determined higher WUE under drought stress.
ETR values were calculated for M+ and M- plants using the mean absorbance ratio of 0.84. According to the literature, this value might vary across succulent and desert species characterized by great variation in color and high reflectiveness [57], but it is not the case of S. lycopersicum leaves. In our study, the high level of chlorophyll pigments (SPAD) showed by M+ plants, which confirms results of previous research [47,58], is positively correlated with PS2 efficiency (ΦPSII, r = 0.68, p < 0.05) and with ETR measured in M+ plants (r = 0.85, p < 0.05), whilst it is negatively correlated with NPQ (r = −0.78, p < 0.05). According to [59] and [60], in fact, M+ plants are less sensitive to light stress being NPQ inhibited by mycorrhization, as confirmed by data shown in Figure 3. High SPAD values, together with high PS2 efficiency, high ETR, high Fv/Fm and low NPQ, confirm for tomato the beneficial effect of the AM symbiosis already observed in another crop, as in Phaseolus lunatus [61]. Especially under conditions of high light intensity, AMF, acting as a “sink” of C, may allocate and dispose excess products of photosynthesis in an efficient way [62], dissipating light in excess avoiding permanent damages to chloroplast biochemistry and resulting in high PS2 efficiency and ETR, but low NPQ, as observed in our study (Figure 3).
In this experiment, the photosynthetic performances of M+ plants were enhanced as demonstrated by high SPAD and high Pn values. In fact, SPAD and ETR are positively correlated with Pn (r = 0.63 and r = 0.75 respectively), that overall was higher for M+ plants than for M- plants [63,64,65,66] (Figure 4). [27] reported that high Pn values in M+ plants are due to increased stomatal density induced by AM symbiosis but we did not have this experimental evidence in our experiment. Surprisingly, high Pn values of M+ plants did not lead to high total dry biomass production (Table 3). Further investigations are therefore necessary to understand why M+ plants, that had high photosynthetic potential (high SPAD, high ΦPS2, high ETR, low NPQ) and high Pn, were shorter (Table 2) and had lower total dry biomass than M- plants (Table 3). Despite the low aboveground biomass production that M+ plant had as consequence of the shorter vegetative period, higher total tomato fruit production than M- under drought stress conditions was observed (Table 2).
The effect of AM symbiosis on drought tolerance is reflected on stomatal conductance and transpiration rate [67]. In our study, the effect of R. intraradices was reflected in a number of physiological responses: (i) modification of leaves structure by increasing SLA (Table 3), (ii) reduction of transpiration (E) both under WW and WS conditions (Figure 4B), (iii) decreasing the threshold of FTSW for transpiration and increasing the threshold of FTSW for wcWUEi (Figure 6). The reduction in transpiration rate (E) of M+ plants was double checked through the gas exchange apparatus and through gravimetric method according to [44].
The decreasing threshold of FTSW for transpiration is a consequence of the exploring ability of hyphae of AMF extraradical mycelium that provide an extensive surface area for water and nutrient absorption [68]. Among nutrients, P plays a crucial role in tomato seedling growth [69], pollen quality and quantity [70], and thereby tomato fruit production and soluble sugar concentration. In our study M+ plants, subjected to P deficiency (300 μM), had higher total tomato fruit prodution (Table 2) and higher P content in fruits, stems and roots [37,71,72] than M-, which is in agreement with result from [53] (Figure 8). This result further proves the ability of AMF extraradical mycelium in uptaking P beyond the P depletion zone generated in the soil solution by fast root P absorption [73]. Due to the positive relationship between AMF-mediated P absorption and shoot P content enhanced by the mycorrhizosphere bacteria [74], the use of AMF in tomato cultivation would have significant implication on tomato production and quality.
AM symbiosis induced also morphological modifications to plants architecture increasing the number of flower branches per plants in line with the short vegetative period that M+ plants had. Therefore, longer reproductive period led to higher number of floral branches in M+ plants. Surprisingly, the expected number of fruits per branches of M+ plants was lower than of M-; it could be due to the adverse conditions that tomato M+ plants had during the experiment where flowering was limited by lack of wind inside the greenhouse. Further investigations are needed to better understand if AM symbiosis affect the flower differentiation or if this effect was due only to the environmental conditions during the experiment. Anyway, M+ plants produced bigger fruits than M-, leading in higher tomato fresh production especially under water stress. This is the results of the higher wcWUEi that M+ plants had during the dry-down experiment.

5. Conclusions

The Eco physiological analysis carried out in this study highlighted that the AM symbiosis can be established and provides beneficial effect to tomato plants using low concentration of inoculum (1%) homogeneously mixed to the substrate.
AM symbiosis induced several effects on plant physiology and phenology: (i) colonized plants (M+) reduced their vegetative period of 12 days compared to the not colonized ones (M-), (ii) were shorter than M- plants, (iii) and had higher fruit production than non-mycorrhizal plants. The high fruit production was a consequence of (iv) high Pn supported by (v) high chlorophyll content (SPAD), high PS2 efficiency, high ETR, high Fv/Fm, and low NPQ observed in M+ plants; higher wcWUEi was observed in M+ than M- as result of (vi) low transpiration rate and (vii) low threshold of FTSW of the colonized plants. Drought stress decreased shoot dry matter but did not affect tomato fruit production (viii) neither tomato fruit quality, in terms of P content (ix).
Tomato plantlets inoculated with Prod2 at 1% were 12% more expensive than non-inoculated plantlets, but their fruit production increased by about 8.5% in response to water stress and by about 27% if compared to drought stressed not inoculated tomato plants. Considering also the positive physiological effect of R. intraradices in alleviating drought stress, the use of AMF seems a promising option to stabilize tomato production and to increase resilience of tomato cultivations, as well as widening the cultivation and harvesting time of processing tomato crop in Italy and pushing farmers to use tomato M+ plants rather than the conventional ones in order to increase their earnings and to save on the cost of water and irrigation.

Supplementary Materials

The following are available online at https://www.mdpi.com/2073-4395/10/1/71/s1.

Author Contributions

A.F. and S.A. conceived and planned the experiment. A.F. and L.T. set up and monitored the canopy gas exchange system. L.T. performed the experimental work and A.F. performed data analysis. A.F. drafted the manuscript. S.A., P.B. and L.L. revised the manuscript. All authors have read and agreed to the published version of the manuscript.

Acknowledgments

The authors would like to thank the staff of MycAgro (Mycagro Lab sarl, Dijon, http://www.mycagrolab.com) and Agrifutur (Agrifutur srl, Alfianello http://www.agrifutur.com) that kindly provided the inoculum of R. intraradices, and Mara Novero for her constant support.

Conflicts of Interest

The authors declare no conflict of interest. The funders had no role in the design of the study; in the collection, analyses, or interpretation of data; in the writing of the manuscript, or in the decision to publish the results.

Abbreviations

AMFarbuscular mycorrhizal fungi
DASdays after sowing
Etranspiration rate
ETRelectron transport rate
Fmmaximal fluorescence
FTSWfraction of transpirable soil water
Fv/Fmmaximal quantum yield of PSII
LARleaf area ratio
NPQnon-photochemical quenching
Pnnet photosynthetic rate
PPFDphotosynthetic photon flux density
PSIIphotosystem II
qPphotochemical quenching
SLAspecific leaf area
VPDphotosynthetic photon flux density
wcWUEiwhole canopy intrinsic water use efficiency
WSwater stress
WWwell-watered

References

  1. FAOSTAT. Food and Agriculture Organization of the United Nations. 2015. Available online: http://faostat3.fao.org/download/Q/QC/E (accessed on 14 May 2019).
  2. Viskelis, P.; Vilkauskaite, G.; Noreika, R.K. Chemical composition, functional properties and consumption of tomatoes. Sodininkyste ir Darzininkyste 2005, 24, 182–192. [Google Scholar]
  3. Godfray, H.C.J.; Beddington, J.R.; Crute, I.R.; Haddad, L.; Lawrence, D.; Muir, J.F.; Pretty, J.; Robinson, S.; Thomas, S.M.; Toulmin, C. Food security: The challenge of feeding 9 billion people. Science 2010, 327, 812–818. [Google Scholar] [CrossRef] [PubMed] [Green Version]
  4. Ciais, P.; Reichstein, M.; Viovy, N.; Granier, A.; Ogée, J.; Allard, V.; Aubinet, M.; Buchmann, N.; Bernhofer, C.; Carrara, A.; et al. Europe-wide reduction in primary productivity caused by the heat and drought in 2003. Nature 2005, 437, 529–533. [Google Scholar] [CrossRef] [PubMed]
  5. Grover, M.; Ali, S.Z.; Sandhya, V.; Rasul, A.; Venkateswarlu, B. Role of microorganisms in adaptation of agriculture crops to abiotic stresses. World J. Microbiol. Biotechnol. 2010, 27, 1231–1240. [Google Scholar] [CrossRef]
  6. Larson, C. Losing arable land, China faces stark choice: Adapt or go hungry. Science 2013, 339, 644–645. [Google Scholar] [CrossRef]
  7. Campbell, B. Perspectives: Legislating change. Nature 2012, 501, S12–S14. [Google Scholar]
  8. Barrow, J.R.; Lucero, M.E.; Reyes-Vera, I.; Havstad, K.M. Do symbiotic microbes have a role in plant evolution, performance and response to stress? Commun. Integr. Biol. 2008, 1, 69–73. [Google Scholar] [CrossRef]
  9. Eisenstein, M. Discovery in a dry spell. Nature 2013, 501, S7–S9. [Google Scholar] [CrossRef]
  10. Morrissey, J.P.; Dow, J.M.; Mark, G.L.; O’Gara, F. Are microbes at the root of a solution to world food production? EMBO Rep. 2004, 5, 922–926. [Google Scholar] [CrossRef] [Green Version]
  11. Mayak, S.; Tirosh, T.; Glick, B.R. Plant growth-promoting bacteria that confer resistance to water stress in tomatoes and peppers. Plant Sci. 2004, 166, 525–530. [Google Scholar] [CrossRef]
  12. Marulanda, A.; Barea, J.M.; Azcón, R. Stimulation of plant growth and drought tolerance by native microorganisms (AM fungi and bacteria) from dry environments: Mechanisms related to bacterial effectiveness. J. Plant Growth Regul. 2009, 28, 115–124. [Google Scholar] [CrossRef]
  13. Tank, N.; Saraf, M. Salinity-resistant plant growth promoting rhizobacteria ameliorates sodium chloride stress on tomato plants. J. Plant Interact. 2010, 5, 51–58. [Google Scholar] [CrossRef]
  14. Marasco, R.; Rolli, E.; Vigani, G.; Borin, S.; Sorlini, C.; Ouzari, H.; Zocchi, G.; Daffonchio, D. Are drought-resistance promoting bacteria cross-compatible with different plant models? Plant Signal. Behav. 2013, 8, e26741. [Google Scholar] [CrossRef] [PubMed] [Green Version]
  15. Chialva, M.; Salvioli di Fossalunga, A.; Daghino, S.; Ghignone, S.; Bagnaresi, P.; Chiapello, M.; Novero, M.; Spadaro, D.; Perotto, S.; Bonfante, P. Native soils with their microbiotas elicit a state of alert in tomato plants. New Phytol. 2018, 220, 1296–1308. [Google Scholar] [CrossRef] [PubMed] [Green Version]
  16. Bonfante, P.; Genre, A. Mechanisms underlying beneficial plant-fungus interactions in mycorrhizal symbiosis. Nat. Commun. 2010, 1, 48. [Google Scholar] [CrossRef] [PubMed] [Green Version]
  17. Lanfranco, L.; Fiorilli, V.; Gutjahr, C. Partner communication and role of nutrients in the arbuscular mycorrhizal symbiosis. New Phytol. 2018, 220, 1031–1046. [Google Scholar] [CrossRef]
  18. Smith, S.E.; Smith, F.A. Roles of arbuscular mycorrhizas in plant nutrition and growth: New paradigms from cellular to ecosystem scales. Ann. Rev. Plant Biol. 2011, 62, 227–250. [Google Scholar] [CrossRef] [Green Version]
  19. Ezawa, T.; Saito, K. How do arbuscular mycorrhizal fungi handle phosphate? New insight into fine-tuning of phosphate metabolism. New Phytol. 2018, 220, 1116–1121. [Google Scholar] [CrossRef] [Green Version]
  20. Rapparini, F.; Penuelas, J. Mycorrhizal fungi to alleviate drought stress on plant growth. In Use of Microbes for the Alleviation of Soil Stresses; Miransari, M., Ed.; Springer: New York, NY, USA, 2014; Volume 1. [Google Scholar]
  21. Estrada, B.; Aroca, R.; Maathuis, F.J.M.; Barea, J.M.; Ruiz-Lozano, J.M. Arbuscular mycorrhizal fungi native from a Mediterranean saline area enhance maize tolerance to salinity through improved ion homeostasis. Plant Cell Environ. 2013, 36, 1771–1782. [Google Scholar] [CrossRef]
  22. Estrada, B.; Aroca, R.; Barea, J.M.; Ruiz-Lozano, J.M. Native arbuscular mycorrhizal fungi isolated from a saline habitat improved maize antioxidant systems and plant tolerance to salinity. Plant Sci. 2013, 201–202, 42–51. [Google Scholar] [CrossRef]
  23. Rouphael, Y.; Franken, P.; Schneider, C.; Schwarz, D.; Giovannetti, M.; Agnolucci, M.; De Pascale, S.; Bonini, P.; Colla, G. Arbuscular mycorrhizal fungi act as biostimulants in horticultural crops. Sci. Hortic. 2015, 196, 91–108. [Google Scholar] [CrossRef]
  24. Pedranzani, H.; Tavecchio, N.; Gutierrez, M.; Garbero, M.; Porcel, R.; Ruiz-Lozano, J.M. Differential effects of cold stress on the antioxidant response of mycorrhizal and non-mycorrhizal Jatropha curcas (L.) plants. J. Agric. Sci. 2015, 7, 35–43. [Google Scholar] [CrossRef]
  25. Pedranzani, H.; Rodrıguez-Rivera, M.; Gutierrez, M.; Porcel, R.; Hause, B.; Ruiz-Lozano, J.M. Arbuscular mycorrhizal symbiosis regulates physiology and performance of Digitaria eriantha plants subjected to abiotic stresses by modulating antioxidant and jasmonate levels. Mycorrhiza 2016, 26, 141–152. [Google Scholar]
  26. Rivero, J.; Gamir, J.; Aroca, R.; Pozo, M.J.; Flors, V. Metabolic transition in mycorrhizal tomato roots. Front. Microbiol. 2015, 6, 598. [Google Scholar] [CrossRef]
  27. Chitarra, W.; Pagliarani, C.; Maserti, B.; Lumini, E.; Siciliano, I.; Cascone, P.; Schubert, A.; Gambino, G.; Balestrini, R.; Guerrieri, E. Insights on the impact of arbuscular mycorrhizal symbiosis on tomato tolerance to water stress. Plant Physiol. 2016, 171, 1009–1023. [Google Scholar] [CrossRef] [Green Version]
  28. Wu, Q.S.; Srivastava, A.K.; Zou, Y.N. AMF-induced tolerance to drought stress in citrus: A review. Sci. Hortic. 2013, 164, 77–87. [Google Scholar] [CrossRef]
  29. Wu, Q.S.; Zou, Y.N. Mycorrhizal influence on nutrient uptake of citrus exposed to drought stress. Philipp. Agric. Sci. 2009, 92, 33–38. [Google Scholar]
  30. Bagheri, V.; Shamshiri, M.H.; Shirani, H.; Roosta, H. Nutrient uptake and distribution in mycorrhizal pistachio seedlings under drought stress. J. Agric. Sci. Technol. 2012, 14, 1591–1604. [Google Scholar]
  31. Huang, Z.; Zou, Z.R.; He, C.X.; He, Z.Q.; Zhang, Z.B.; Li, J.M. Physiological and photosynthetic responses of melon (Cucumis melo L.) seedlings to three Glomus species under water deficit. Plant Soil 2011, 339, 391–399. [Google Scholar] [CrossRef]
  32. Davies, F.T., Jr.; Portugal-Olalde, V.; Aguilera-Gomez, L.; Alvarado, M.J.; Ferrera-Cerrato, R.C.; Bouton, T.W. Alleviation of drought stress of Chile ancho pepper (Capsicum annuum cv San Luis) with arbuscular mycorrhiza indigenous to Mexico. Sci. Hortic. 2002, 92, 347–359. [Google Scholar] [CrossRef]
  33. Aroca, R.; Vernieri, P.; Ruiz-Lozano, J.M. Mycorrhizal and nonmycorrhizal Lactuca sativa plants exhibit contrasting responses to exogenous ABA during drought stress and recovery. J. Exp. Bot. 2008, 59, 2029–2041. [Google Scholar] [CrossRef] [PubMed] [Green Version]
  34. Jahromi, F.; Aroca, R.; Porcel, R.; Ruiz-Lozano, J.M. Influence of salinity on the in vitro development of Glomus intraradices and on the in vivo physiological and molecular responses of mycorrhizal lettuce plants. Microb. Ecol. 2008, 55, 45–53. [Google Scholar] [CrossRef] [PubMed]
  35. Boyer, L.R.; Brain, P.; Xu, X.M.; Jeffries, P. Inoculation of drought-stressed strawberry with a mixed inoculum of two arbuscular mycorrhizal fungi: Effects on population dynamics of fungal species in roots and consequential plant tolerance to water deficiency. Mycorrhiza 2015, 25, 215–227. [Google Scholar] [CrossRef] [PubMed]
  36. Omirou, M.; Ioannides, I.M.; Ehaliotis, C. Mycorrhizal inoculation affects arbuscular mycorrhizal diversity in watermelon roots but leads to improved colonization and plant response under water stress only. Appl. Soil Ecol. 2013, 63, 112–119. [Google Scholar] [CrossRef]
  37. Subramanian, K.S.; Santhanakrishnan, P.; Balasubramanian, P. Responses of field grown tomato plants to arbuscular mycorrhizal fungal colonization under varying intensities of drought stress. Sci. Hortic. 2006, 107, 245–253. [Google Scholar] [CrossRef]
  38. Wang, B.; Yao, Z.; Zhao, S.; Guo, K.; Sun, J.; Zhang, H. Arbuscular mycorrhizal fungal application to improve growth and tolerance of processing tomato (Lycopersicum esculentum Miller) under drought stress. J. Food Agric. Environ. 2014, 12, 452–457. [Google Scholar]
  39. Hewitt, E.J. Sand and Water Culture Methods Used in Study of Plant Nutrition, 2nd ed.; Commonwealth Agricultural Bureaux: Farnham Royal, UK, 1966; p. 547. [Google Scholar]
  40. Fracasso, A.; Amaducci, S. Drought tolerance strategies highlighted by two Sorghum bicolor races in a dry-down experiment. J. Plant Physiol. 2015, 190, 1–14. [Google Scholar] [CrossRef]
  41. Luquet, D.; Clément-Vidal, A.; Fabre, D.; This, D.; Sonderegger, N.; Dingkuhn, M. Orchestration of transpiration, growth and carbohydrate dynamics in rice during a dry-down cycle. Funct. Plant Biol. 2008, 35, 689–704. [Google Scholar] [CrossRef]
  42. Trouvelot, A.; Kough, J.; Gianinazzi-Pearson, V. Mesure du taux de mycorhization VA d’un système radiculaire. Recherche des méthodes d’estimation ayant une signification fonctionnelle. The mycorrhizae: Physiology and genetic. In Mycorrhizae: Physiology and Genetics; INRA Press: Paris, France, 1986; pp. 217–221. [Google Scholar]
  43. Genty, B.; Briantais, J.M.; Baker, N.R. The relationship between the quantum yield of photosynthetic electron transport and quenching of chlorophyll fluorescence. Biochim. Biophys. Acta 1989, 990, 87–92. [Google Scholar] [CrossRef]
  44. Fracasso, A.; Magnanini, E.; Marocco, A.; Amaducci, S. Real-Time Determination of Photosynthesis, Transpiration, Water-Use Efficiency and Gene Expression of Two Sorghum bicolor (Moench) Genotypes Subjected to Dry-Down. Front. Plant Sci. 2017, 8, 932. [Google Scholar] [CrossRef] [Green Version]
  45. Long, S.P.; Hällgren, J.E. Measurement of CO2 assimilation by plants in the field and the laboratory. In Photosynthesis and Production in a Changing Environment: A Field and Laboratory Manual; Hall, D.O., Scurlock, J.M.O., Bolhàr-Nordenkampf, H.R., Leegood, R.C., Long, S.P., Eds.; Springer: Dordrecht, The Netherlands, 1993; pp. 129–167. [Google Scholar]
  46. Casadebaig, P.; Debaeke, P.; Lecoeur, J. Thresholds for leaf expansion and transpiration response to soil water deficit in a range of sunflower genotypes. Eur. J. Agron. 2008, 28, 646–654. [Google Scholar] [CrossRef]
  47. Ma, N.; Yokoyama, K.; Marumoto, T. Effect of peat on mycorrhizal colonization and effectiveness of the arbuscular mycorrhizal fungus Gigaspora margarita. Soil Sci. Plant Nutr. 2007, 53, 744–752. [Google Scholar] [CrossRef] [Green Version]
  48. Abdel Latef, A.A.H.; Chaoxing, H. Effect of arbuscular mycorrhizal fungi on growth, mineral nutrition, antioxidant enzymes activity and fruit yield of tomato grown under salinity stress. Sci. Hortic. 2011, 127, 228–233. [Google Scholar] [CrossRef]
  49. Schubert, A.; Mazzitelli, M.; Ariusso, O.; Eynard, I. Effects of vesicular-arbuscular mycorrhizal fungi on micropropagated grapevines: Influence of endophyte strain, P fertilization and growth medium. Vitis 1990, 29, 5–13. [Google Scholar]
  50. Nouri, E.; Breuillin-Sessoms, F.; Feller, U.; Reinhardt, D. Phosphorus and Nitrogen Regulate Arbuscular Mycorrhizal Symbiosis in Petunia hybrida. PLoS ONE 2014, 9, e90841. [Google Scholar] [CrossRef]
  51. Ouiziad, F.; Wilde, P.; Schmelzer, E.; Hildebrandt, U.; Bothe, H. Analysis of expression of aquaporins and Na+/H+ transporters in tomato colonized by arbuscular mycorrhizal fungi and affected by salt stress. Environ. Exp. Bot. 2006, 57, 177–186. [Google Scholar] [CrossRef] [Green Version]
  52. López-Ráez, J.A.; Flors, V.; García, J.M.; Pozo, M.J. AM symbiosis alters phenolic acid content in tomato roots. Plant Signal. Behav. 2010, 5, 1138–1140. [Google Scholar] [CrossRef] [PubMed] [Green Version]
  53. Zouari, I.; Salvioli, A.; Chialva, M.; Novero, M.; Miozzi, L.; Tenore, G.C.; Bagnaresi, P.; Bonfante, P. From root to fruit: RNA-Seq analysis shows that arbuscular mycorrhizal symbiosis may affect tomato fruit metabolism. BMC Genom. 2014, 15, 221. [Google Scholar] [CrossRef] [Green Version]
  54. Chialva, M.; Zouari, I.; Salvioli, A.; Novero, M.; Vrebalov, J.; Giovannoni, J.J.; Bonfante, P. Gr and hp-1 tomato mutants unveil unprecedented interactions between arbuscular mycorrhizal symbiosis and fruit ripening. Planta 2016, 244, 155–165. [Google Scholar] [CrossRef]
  55. Fiorilli, V.; Catoni, M.; Miozzi, L.; Novero, M.; Accotto, G.P.; Lanfranco, L. Global and cell-type gene expression profiles in tomato plants colonized by an arbuscular mycorrhizal fungus. New Phytol. 2009, 184, 975–987. [Google Scholar] [CrossRef]
  56. López-Ráez, J.A.; Verhage, A.; Fernandez, I.; Garcia, J.M.; Azcon-Aguilar, C.; Flors, V.; Pozo, M.J. Hormonal and transcriptional profiles highlight common and differential host responses to arbuscular mycorrhizal fungi and the regulation of the oxylipin pathway. J. Exp. Bot. 2010, 61, 2589–2601. [Google Scholar] [CrossRef] [PubMed] [Green Version]
  57. Stemke, J.A.; Santiago, L.S. Consequences of light absorptance in calculating electron transport rate of desert and succulent plants. Photosynthetica 2011, 49, 195–200. [Google Scholar] [CrossRef] [Green Version]
  58. Yamawaki, K.; Matsumura, A.; Hattori, R.; Tarui, A.; Hossain, M.; Ohashi, Y.; Daimon, H. Effect of inoculation with arbuscular mycorrhizal fungi on growth, nutrient uptake and curcumin production of turmeric (Curcuma longa L.). Agric. Sci. 2013, 4, 66–71. [Google Scholar] [CrossRef] [Green Version]
  59. Boldt, K.; Pörsb, Y. Photochemical processes, carbon assimilation and RNA accumulation of sucrose transporter genes in tomato arbuscular mycorrhiza. J. Plant Physiol. 2011, 168, 1256–1263. [Google Scholar] [CrossRef] [PubMed]
  60. De Andrade, S.A.L.; Domingues, A.P.; Mazzafera, P. Photosynthesis is induced in rice plants that associate with arbuscular mycorrhizal fungi and are grown under arsenate and arsenite stress. Chemosphere 2015, 134, 141–149. [Google Scholar] [CrossRef]
  61. Millar, J.A.; Ballhorn, D.J. Effect of mycorrhizal colonization and light limitation on growth and reproduction of lima bean (Phaseolus lunatus L.). J. Appl. Bot. Food Qual. 2013, 86, 172–179. [Google Scholar]
  62. Kaschuk, G.; Thomas, W.; Kuyper, T.W.; Leffelaar, P.A.; Mariangela Hungria, M.; Giller, K.E. Are the rates of photosynthesis stimulated by the carbon sink strength of rhizobial and arbuscular mycorrhizal symbioses? Soil Biol. Biochem. 2009, 41, 1233–1244. [Google Scholar] [CrossRef]
  63. Wu, Q.S.; Xia, R.X. Arbuscular mycorrhizal fungi influence growth, osmotic adjustment and photosynthesis of citrus under well-watered and water stress conditions. J. Plant Physiol. 2006, 163, 417–425. [Google Scholar] [CrossRef]
  64. Amaya-Carpio, F.T.; Davies, T., Jr.; Fox, C. Arbuscular mycorrhizal fungi and organic fertilizer influence photosynthesis, root phosphatase activity, nutrition, and growth of Ipomoea carnea ssp. Fistulosa. Photosynthetica 2009, 47, 1–10. [Google Scholar] [CrossRef]
  65. Wu, Q.S.; Zou, Y.N.; Liu, W.; Ye, X.F.; Zai, H.F.; Zhao, L.J. Alleviation of salt stress in citrus seedlings inoculated with mycorrhiza: Changes in leaf antioxidant defense systems. Plant Soil Environ. 2010, 56, 470–475. [Google Scholar] [CrossRef] [Green Version]
  66. Birhane, E.; Sterck, F.J.; Fetene, M.; Bongers, F.; Kuyper, T.W. Arbuscular mycorrhizal fungi enhance photosynthesis, water use efficiency, and growth of frankincense seedlings under pulsed water availability conditions. Oecologia 2012, 169, 895–904. [Google Scholar] [CrossRef] [Green Version]
  67. Augè, R.M.; Duan, X. Mycorrhizal fungi and non-hydraulic root signals of soil drying. Plant Physiol. 1991, 97, 821–824. [Google Scholar] [CrossRef] [PubMed] [Green Version]
  68. Smith, S.E.; Read, D.J. Mycorrhizal Symbiosis, 2nd ed.; Academic Press: London, UK, 1997. [Google Scholar]
  69. De Groot, C.C.; Marcelis, L.F.M.; van den Boogaard, R.; Lambers, H. Growth and dry-mass partitioning in tomato as affected by phosphorus nutrition and light. Plant Cell Environ. 2001, 24, 1309–1317. [Google Scholar] [CrossRef]
  70. Poulton, J.L.; Koide, R.T.; Stephenson, A.G. Effects of mycorrhizal infection and soil phosphorus availability on in vitro and in vivo pollen performance in Lycopersicon esculentum (Solanaceae). Am. J. Bot. 2001, 88, 1786–1793. [Google Scholar] [CrossRef]
  71. Alloush, G.A.; Zeto, S.K.; Clark, R.B. Phosphorus source, organic matter, and arbuscular mycorrhiza effects on growth and mineral acquisition of chickpea grown in acidic soil. J. Plant Nutr. 2010, 23, 1351–1369. [Google Scholar] [CrossRef]
  72. Tamayo, E.; Gómez-Gallego, T.; Azcón-Aguilar, C.; Ferrol, N. Genome-wide analysis of copper, iron and zinc transporters in the arbuscular mycorrhizal fungus Rhizophagus irregularis. Front. Plant Sci. 2014, 5, 547. [Google Scholar] [CrossRef] [PubMed] [Green Version]
  73. Karandashov, V.; Bucher, M. Symbiotic phosphate transport in arbuscular mycorrhizas. Trends Plant Sci. 2005, 10, 22–29. [Google Scholar] [CrossRef]
  74. Battini, F.; Grønlund, M.; Agnolucci, M.; Giovannetti, M.; Jakobsen, I. Facilitation of phosphorus uptake in maize plants by mycorrhizosphere bacteria. Sci. Rep. 2017, 7, 4686. [Google Scholar] [CrossRef]
Figure 1. Fraction of transpirable soil water (FTSW) dynamics recorded during the dry-down experiment (Exp2). FTSW dynamics is presented as a function of day after sowing (DAS); squares represent M- plants: blue solid line for the well-watered plants (WW) and red dotted line for the water stressed ones (WS); circles represent M+ plants: light blue solid line for the well-watered plants (WW) and orange dotted line for the water stressed ones (WS). The dotted rectangle highlights the days in which the plants were analysed inside the whole canopy gas exchange apparatus (from 100 DAS to 120 DAS). Mean of 3 ± SE. * indicate statistically significant differences between FTSW values of WS M- and WS M+ plants (p < 0.05).
Agronomy 10 00071 g001
Figure 2. Frequency of mycorrhization F% (A) and intensity of root cortex colonization M% (B) measured at 40, 50, 60 and 70 DAS (days after sowing) mixing the commercial products (circles for prod1 and diamonds for prod2) to the substrate (modality “a” of Exp1). Circles represent prod1: solid line for 5% and dotted line for 1% concentration respectively; diamonds represent prod2: solid line for 5% and dotted line for 1% concentration respectively. * indicate statistically significant differences between the two commercial products (p < 0.05).
Agronomy 10 00071 g002
Figure 3. (A) Trend of chlorophyll concentration (SPAD); (B) maximal quantum yield of PSII in the dark-adapted state (Fv/Fm); (C) effective photochemical efficiency of PSII (ΦPSII), (D) electron transport rates (ETR); (E) photochemical quenching coefficient (qP); (F) non-photochemical quenching coefficient (NPQ) recorded during Exp2. Squares represent M- plants: blue solid line for the well-watered plants (WW) and red dotted line for the water stressed ones (WS); circles represent M+ plants: light blue solid line for the well-watered plants (WW) and orange dotted line for the water stressed ones (WS). Symbols with highlighted black outline represent statistically significant differences between water treatment (p < 0.05), whilst * represent statistically significant differences between M+ and M- plants (p < 0.05). Mean of 3 ± SE.
Agronomy 10 00071 g003
Figure 4. (A) Net photosynthetic rate (Pn); (B) transpiration rate (E) and (C) whole-canopy WUEi (wcWUEi) recorded during the experiment for M- and M+ plants under well-watered (WW) and water-stressed (WS) conditions. Squares represent M- plants: blu solid line for the well-watered plants (WW) and red dotted line for the water stressed ones (WS); circles represent M+ plants: light blue solid line for the well-watered plants (WW) and orange dotted line for the water stressed ones (WS). Vertical dashed lines indicate the date in which hourly Pn, E and wcWUEi were analysed in detail. Symbols with highlighted black outline represent the moment when differences became statistically significant (p < 0.05). Mean of 3 ± SE.
Agronomy 10 00071 g004
Figure 5. Daily net photosynthetic rate (A,D,G,J), transpiration rate (B,E,H,K), and whole-canopy WUEi (C,F,I,L) recorded at 0.77 (101 DAS), 0.56 (106 DAS), 0.34 (113 DAS) and 0.28 FTSW (120 DAS) for M- and M+ plants under well-watered (WW) and water-stressed (WS) conditions. Blue line represents well-watered M- plants (M- WW) and red dotted line the M- water stressed ones (M- WS); light blue solid line represents well-watered M+ plants (M+ WW) and orange dotted line the M+ water stressed ones (M+ WS). Mean of 3 ± SE.
Agronomy 10 00071 g005
Figure 6. (A) Response of transpiration (E, mmol m−2 s−1) and (B) whole canopy intrinsic water use efficiency (wcWUEi, μmol CO2/mmol H2O) to the increasing drought stress during the dry-down experiment. Full dots in (A) represent the FTSW threshold calculated for M- (squares) and M+ (circles) plants. Mean of 3 ± SE.
Agronomy 10 00071 g006
Figure 7. Leaf area and biomass partitioning into roots, stems, leaves and fruits of M- and M+ subjected to well-watered (WW) and water-stressed (WS) conditions. (A) squares represent M- plants: blue solid line for the well-watered plants (WW) and red dotted line for the water stressed ones (WS); circles represent M+ plants: light blue solid line for the well-watered plants (WW) and orange dotted line for the water stressed ones (WS). Symbols with highlighted black outline represent statistically significant differences between water treatment (p < 0.05), whilst * represent statistically significant differences between M+ and M- plants (p < 0.05). (B) blue histogram represents M- WW plants, red histogram represents M- WS plants, light blue represents M+ WW plants and orange histogram represents M+ WS plants. Diagonal lines represent roots (% of total dry weight), full colours represent leaves (% of total dry weight), vertical lines represent stems (% of total dry weight) and spotted patterns represent fruits (% of total dry weight). (Mean of 3 ± SE).
Agronomy 10 00071 g007
Figure 8. P content (ppm) measured in leaves, stems, fruits and roots of WW M- (blue), WS M- (red), WW M+ (light blue) and WS M+ (orange) plants. Mean of 3 ± SE. Values followed by the same letter are not statistically significant at HSD Tukey test p < 0.05 performed on the interaction inoculation × drought stress, separately for leaves, stems, fruits and roots.
Agronomy 10 00071 g008
Table 1. Summary of inocula, concentration (w/w), amount and cost of inoculum per each seedling and per hectare, assuming an average density of 40,000 plant ha−1.
NameCost
(€/kg)
Concentration in Exp1Amount of Inoculum per Seedling
(gr Seedling −1)
N of Seedling that Could be Inoculated with 1kg of FormulationCost per Seedling
(€ Seedling−1)
Cost per Hectare
(40,000 Plant ha−1) (€ ha−1)
Prod11001%0.0520,0000.01200
5%0.2343480.02920
Prod2521%0.0520,0000104
5%0.2343480.01478.4
Table 2. Plant height (cm), stem diameter (mm), number of flower branches per plants, number of fruits per flower branch, mean of single fruit fresh weight (g) and mean of total fresh weight of tomato (g) recorded for M- and M+ plants under WW and WS conditions in Exp2.
VariableInoculatio Water TreatmentANOVA
WWWSInoculationWater TreatmentI × W
Plant Height (cm) M-59.263.4F (8.3)
p = 0.015
F (0.09)
p = 0.77
F (1.6)
p = 0.24
M+ *52.545.8
AA
Stem Diameter
(mm)
M-6.276.89F (2.11)
p = 0.18
F (4.82)
p = 0.05
F (0.02)
p = 0.96
M+6.617.15
AB
N Flower Branches Plants−1M-21.3F (4.97)
p = 0.047
F (7.2)
p = 0.021
F (0.8)
p = 0.39
M+ *31.6
AB
N Fruit
Flower Branch−1
M-2.32F (6.88)
p = 0.024
F (0.27)
p = 0.61
F (1.85)
p = 0.21
M+ *0.81.5
AA
Mean Single Fruit
Fresh Weight (g)
M-12.417.7F (5.03)
p = 0.046
F (0.07)
p = 0.79
F (0.5)
p = 0.49
M+ *25.322.8
AA
Mean Total Fresh Weight of Fruit (g)M-52.9 a39.7 dF (0.77)
p = 0.40
F (2.86)
p = 0.12
F (10.04)
p = 0.008
M+ *46.7 c50.7 b
The data (mean of 3) were analyzed by two-way ANOVA (α = 0.05) with significant F-values and p-values highlighted in bold. In case of significant interaction, values followed by the same small letter are not significantly different (Tukey HSD). Different capital letters indicate significant differences between water treatment (WW and WS) and * (second column) indicate whether inoculation caused a significant effect (Tukey HSD).
Table 3. Aboveground (ABG) dry matter (g plant−1), belowground (BG) dry matter (g plant−1), root to shoot ratio, total dry matter (g plant−1), Specific Leaf Area (cm2 g−1), and Leaf Area Ratio (cm2 g−1) recorded in Exp2 for M- and M+ plants subjected to WW and WS conditions.
VariableInoculation Water TreatmentANOVA
WWWSInoculation
F (1,11) P
Water Treatment
F (1,11) P
I × W
F (2,11) P
ABG Dry Matter
(g plant−1)
M-8.008.26F (7.37)
p = 0.026
F (0.90)
p = 0.36
F (2.07)
p = 0.18
M+ *7.316.02
AA
BG Dry Matter
(g plant−1)
M-1.221.12F (9.55)
p = 0.015
F (0.33)
p = 0.58
F (0.004)
p = 0.95
M+ *0.730.65
AA
Root/ ShootM-0.150.14F (5.92)
p = 0.040
F (0.058)
p = 0.81
F (0.49)
p = 0.5
M+ *0.100.11
AA
Total Dry Matter
(g plant−1)
M-9.229.39F (8.58)
p = 0.018
F (0.83)
p = 0.39
F (1.32)
p = 0.28
M+ *8.046.66
AA
SLA
(cm2 g−1)
M-87.778.3F (4.98)
p = 0.047
F (0.14)
p = 0.71
F (2.63)
p = 0.14
M+ *118.8127.8
AA
LAR
(cm2 g−1)
M-31.423.5F (7.11)
p = 0.028
F (6.24)
p = 0.037
F (0.02)
p = 0.87
M+ *40.932.02
AB
The data (mean of 3) were analyzed by two-way ANOVA (α =0.05) with significant F-values and p-values highlighted in bold. In case of significant interaction, values followed by the same small letter are not significantly different (Tukey HSD). Different capital letters indicate significant differences between water treatment (WW and WS) and * (second column) indicate whether inoculation caused a significant effect (Tukey HSD).

