Abstract
The number of cotton plants grown per unit of ground area has gained attention due to the high prices of inputs and lower production. Cotton yield per unit of area in Henan province has been stagnant in the last few years. The objectives of this study were to investigate cotton growth, yield, boll spatial distribution and biomass accumulation using different plant densities at cultivation and to find out the optimal plant density. A 2-year field experiment was conducted in a randomized complete block design under six plant densities (D1, 15,000; D2, 33,000; D3, 51,000; D4, 69,000; D5, 87,000 and D6, 105,000 ha−1). Cotton grown at lower plant density produced taller plants and high number of leaves per plant while greater number of branches, fruiting nodes and high number of bolls per unit of ground area were produced under high plant density. Boll retention rate decreased as plant population increased and at nodes 1–8 the rate decreased slowly and then increased dramatically. The highest seed cotton yield (4546 kg ha−1) and lint yield (1682 kg ha−1) was produced by D5. The seed cotton and lint yield produced by D5 were 51–55%, 40–37%, 22–26%, 11–15%, 12–15%, 28–30%, 21–24%, 15–20%, 7–13% and 13–17% higher than D1, D2, D3, D4 and D6 during both years of experimentation, respectively. The increase in seed yield was due to higher biomass accumulation in reproductive organs under D5 plant density. The highest average (110.4 VA kg ha−1 d−1) and maximum (126 VM kg ha−1 d−1) rate of reproductive organs biomass was also accumulated by D5 as compared to other plant densities. The results suggest that D5 is the optimal plant density for high reproductive biomass accumulation and high yield for the area of Henan province.
1. Introduction
Cotton (Gossypium hirustum L.) is a leading cash crop considered as “white gold” and cultivated in more than 80 countries throughout the world [1]. It contributes to the economy of cotton-producing countries. According to statistics, India is the largest producer of cotton with 6.2 million metric tons in the year 2017–2018, while China, USA, Pakistan and Brazil is included in top five cotton-producing countries [2]. Approximately 80% of world total cotton production comes from these five countries. Cotton production is very important not only for its economic benefits but also for the socio-economic value in the country. The USA is the largest exporter with 3.4 million metric tons of cotton and Bangladesh is the largest importer of cotton with 1.65 million metric ton [2]. China contributes about 30% of the world cotton production [3]. Cotton is a unique crop which provides oil and clothes to humans, chaff for livestock feed, organic matter to soil and many other products to industries [4]. Currently, more than half of clothes worn by all people in the world is made of cotton fiber [5].
Proper spacing between plants is an important agronomic factor which affect optimal use of resources and increase crop productivity [6]. Plant density is a key factor for optimizing structure and increasing the photosynthetic capacity of the cotton canopy. Crop geometry and plant density are agronomic factors which enhance yield and profitability [7]. Plant density affects light interception, moisture availability and wind movement which further affect plant height, architecture, boll behavior, crop maturity and yield. An optimal plant density not only enhances the yield and fiber quality of cotton but also reduces fertilizer application and labor cost as compared to high plant densities without compromising yield [8]. Fertilizer and irrigation can also be efficiently utilized in optimal plant density regimes. Globally, high planting density has become common in the cotton production systems. High plant density has more leaf shedding in late season along with lower weight boll production. High plant density (>10 plants m−2) and the associated shading may lead to disease infestation, fruit shedding, reduced boll size, delayed maturity and decreased individual plant development and light interception [9,10]. Current recommended and practiced plant densities in China is 5.3 × 10⁴–7.5 × 10⁴ plants ha−1 in the Yellow River Valley [11], 3.0 × 10⁴ plants ha−1 in the Yangtze River Valley [9] and 22.7 × 10⁴ plants ha−1 in the Northwest region.
Cotton yield can be separated into different components such as boll number, boll weight and lint percentage [12]. Boll density is a major contributor to lint yield [13]. Cotton fiber is an extension of the epidermal cell of the seed, and the most basic element of lint yield can be further dissected into smaller units such as seeds number per boll [13] and number of fibers per seed [14]. Seed size affects fiber numbers per unit seed surface area and lint mass [10,15]. High plant density produces more bolls per unit area and contributes to final yield, however, it also leads to a decrease in individual plant yield [9,16]. Cotton growth, yield and quality perfection through optimal management practices is the continuous goal of cotton agronomists.
Plant density and boll retention have a direct and complex relationship which is influenced by many factors like temperature, nutrition, physiology, genotype, water stress, competition for photosynthates, insects and/or a combination of these [17,18,19,20,21]. Biomass production is also the prerequisite of cotton yield and biomass partitioned to reproductive organs contributes to the final yield [22]. Due to its indeterminate growth, cotton accumulates high vegetative biomass. The biomass accumulation in cotton increases as cotton crops change from one growth stage to another; however, in the last growth stages, biomass decreases due to fruit and leaves shedding [8,23]. In early growth phases, more light intercepts to lower parts of the plant due to a less dense canopy which helps in the establishment of a good stand and increases the biomass.
The purpose of this research was to investigate the effect of plant density on cotton growth parameters, seed cotton yield, lint yield, and yield components, and to find the optimal cotton plant density for Henan province in China.
2. Materials and Methods
2.1. Experimental Site
The field experiment was conducted in 2017 and 2018 at the research station, Institute of Cotton Research of the Chinese Academy of Agricultural Sciences in Anyang, Henan, China (36°06′ N, 114°21′ E). The field soil was medium loam with total N of 0.65 g kg−1, P of 0.01 g kg−1 and K of 0.11 g kg−1. The monthly average temperature and relative humidity data of both years of the cotton-growing season are presented in Figure 1. Average temperature during the cotton-growing season was 23 °C and 24 °C in 2017 and 2018, respectively. Annual rainfall was 585 mm in 2017 and 602 mm in 2018. Annual sunshine hours were 1838 h in 2017 and 1996 h in 2018. The average air temperature at seedling and reproductive stage was cooler as compared to other growth stages. The average relative humidity in the 2017 cotton growing season was higher than 2018.
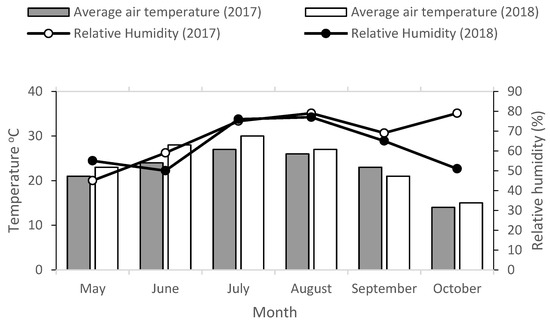
Figure 1.
Temperature and relative humidity of cotton growing season.
2.2. Experimental Design
The experiment was conducted in randomized complete block design (RCBD). Six plant densities (D1, 15,000; D2, 33,000; D3, 51,000; D4, 69,000; D5, 87,000 and D6, 105,000 plants ha−1) were plotted randomly in three replications on clay loam soil. Each experimental plot area was 64 m−2 with 10-m length and width. Each plot consisted of 10 rows with 0.8 m row spacing which was constant for all plant densities. Seeds of cotton mid-maturity cultivar SCRC28 were sown by hand on flat beds with plastic mulching to conserve soil moisture from evaporation. Plastic mulch was removed after one month of full emergence. Seedlings were thinned to required plant densities after three weeks of emergence. During both years, the land was prepared by ploughing and irrigated in early spring before sowing. Sowing was done on 22 April 2017 and 20 April 2018.
A basal dose of 225 kg N ha−1, 150 kg P2O5 ha−1 and 225 kg K2O ha−1 were applied to field before sowing. Irrigation was applied by flooding during flowering stage at a total volume of approximately 45 m3. Crop-management practices such as weeding, hoeing, pesticides and irrigation were performed in a timely manner to enhance crop growth.
2.3. Observations
Data was recorded on cotton phenology, growth parameters, boll retention, yield and biomass accumulation during 2017 and 2018 at different days after emergence.
2.3.1. Cotton Phenology
Cotton phenology (days to emergence, seedling, squaring, flowering and boll opening) was assessed by randomly tagging 10 uniform plants at four leaf stage in each plot and number of days for each growth stage was calculated.
2.3.2. Cotton Plant Growth Parameters
Growth parameters were measured at peak boll stage (72 days after emergence) from 10 randomly tagged plants. Plant height was measured using a specially designed ruler. Number of leaves, fruiting branches and nodes in each plot were also counted from the same tagged plants.
2.3.3. Yield and Yield Components
Seed cotton yield (kg/ha) and lint yield (kg/ha) were recorded three times from each treatment by using the hand harvesting method. The bolls were dried to reduce moisture at less than 11% and seed cotton of 100 bolls at first harvest were sampled for boll weight. The weight of a single boll was calculated by dividing the total seed cotton yield of 100 bolls by the total number of bolls. Lint% was calculated from lint yield of 100 bolls divided by seed cotton weight of 100 bolls. Boll retention rate (%) was calculated from the 10 tagged plants at node (1–16) and fruiting position (1–4) and then average of each point were taken.
2.3.4. Biomass Accumulation
Dry weight of cotton plants was recorded at 42 days after emergence (DAE), 57 DAE, 72 DAE, 87 DAE, 102 DAE, 117 DAE and 132 DAE. Three random plants from each plot of three replications were uprooted and dissected into underground part (roots), leaves, stem and reproductive structures. Samples were quickly placed for 30 min in an electric fan assisted oven at 105 °C to stop metabolism. Samples were dried at 80 °C for 48 h to attain a constant weight. The following logistic regression formula was used to describe biomass accumulation.
In Equation (1) y (kg) is the biomass, A (kg) the maximum biomass, t (d) is the number of days after emergence (DAE) while a and b are constants.
From formula (1), the following equations were calculated:
∆t = t2 − t1
In the above equations VM (kg ha−1 d−1) is the highest rate of biomass accumulation, t (d) is the maximum biomass fast accumulation period, Y1 and Y2 is the biomass at t1 and t2, VA indicates the average biomass accumulation from t1 to t2 and ∆t (d) is the total period of average biomass accumulation.
2.3.5. Data Analysis
Stata 14.0 were used for processing data. SPSS 19.0 and Origin 2016 were used for analysis of data. Figures were plotted using Origin 2016. Contour maps were drawn by Surfer 16 (Golden Software Inc, USA). Duncan multiple range test at 5% probability level was used to test differences among mean values.
3. Results
3.1. Cotton Growth Stages
Cotton growth stages in 2017 and 2018 were positively affected by planting density (Table 1). In 2017 the squaring, flowering, boll opening and total growth period of D5 and D6 took (1, 1, 2–4, 2–3 days respectively) more as compared to D1, D2, D3 and D4 while in 2018 high plant density (D6) took (1,1,1,4 d) more days in the squaring, flowering, boll opening and total growth period as compared to D4 and D5. Seedling stages in both years were statistically found to be similar for all planting densities.

Table 1.
Cotton growth stages and periods as affected by different plant densities in 2017 and 2018.
3.2. Cotton Growth Parameters
Data regarding cotton growth parameters are presented in Table 2. Cotton growth parameters were significantly affected by plant density (PD) in both years. Low PD (D1) produced 2%, 3%, 6%, 10% and 12% taller plants in 2017 while 2%, 4%, 7%, 11% and 12% taller plants in 2018 than D2, D3, D4, D5 and D6, respectively (Figure 2A). In 2017, plant density D6 produced 412%, 140%, 86%, 45%, 27%, 103%, 72%, 37%, 26% and 10% more fruiting branches and fruiting nodes m−2 as compared to D1, D2, D3, D4, and D5 respectively, while in 2018, fruiting branches and nodes m−2 produced by D6 were 372%, 145%, 92%, 49%, 31%, 109%, 77%, 38%, 27% and 11% more than D1, D2, D3, D4 and D5, respectively (Figure 2B,C). Number of leaves produced by D1 in both years were higher as compared to other PD. The shedding percentage during 2017 and 2018 was 22%, 20%, 15%, 10%, 16%, 24%, 18%, 13%, 7% and 14% higher in D6 as compared to D1, D2, D3, D4 and D5, respectively.
Table 2.
Growth parameters affected by different plant densities in cotton growing season 2017 and 2018.
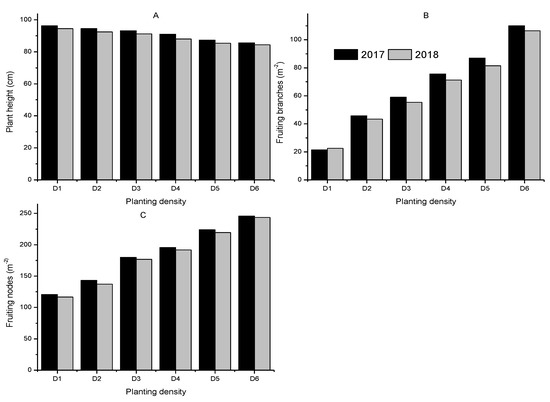
Figure 2.
Growth parameters of cotton plant densities in 2017 and 2018. (A–C) indicate plant height, fruiting branches and fruiting nodes respectively.
3.3. Yield and Yield Components
A parabolic correlation was found between plant density and yield. Plant density had significantly affected yield and yield components of cotton in both years except boll weight and lint percentage in the second year (Table 3). The D5 (58,000 plants ha−1) PD achieved high seed cotton and lint yield in both years as compared to other PD. In 2017, plant density D5 produced 44%, 35%, 20%, 13% and 11% more bolls per m−2 than D1, D2, D3, D4 and D6, while in 2018, D5 produced 47%, 34%, 24%, 11% and 10% more bolls m−2 than D1, D2, D3, D4 and D6, respectively. The seed cotton and lint yield produced by D5 in 2017 was 51%, 40%, 22%, 11%, 12%, 28%, 21%, 15%, 7% and 13% greater than D1, D2, D3, D4 and D6 while in 2018 D5 seed cotton and lint yield was 55%, 37%, 26%, 15%, 15%, 30%, 24%, 20%, 13% and 17% more than D1, D2, D3, D4 and D6, respectively. Lint percentage in 2017 of D1 was 2%, 12%, 14%, 19% and 19% higher than D2, D3, D4, D5 and D6 respectively while in 2018 it was found to be statistically similar.
Table 3.
Cotton yield and yield components response to plant density in growing season 2017 and 2018.
Boll retention rate varied in different plant densities at different positions (Figure 3 and Figure 4). Increasing plant density resulted in a decreased boll retention rate. High boll retention rate was observed above node 8 at fruiting position 3, followed by position 1 and 2. The rate decreased from node 1–8 at fruiting position 1, 2 and 3 and then increased again after node 8. At fruiting position 3 and fruiting position 1, the rate increased slowly from nodes 1–14 and then decreased during the growing season 2017 and 2018, respectively (Figure 4). So overall high boll retention at upper nodes was observed at fruiting position 3 followed by 1 and 2 while less boll retention was observed between nodes 4–10.
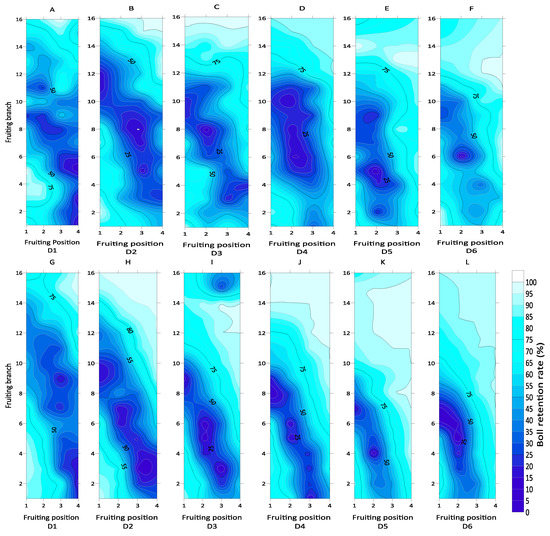
Figure 3.
Boll retention maps of different plant densities. (D1–D6) indicate plant density. (A–F) and (G–L) represent 2017 and 2018, respectively.
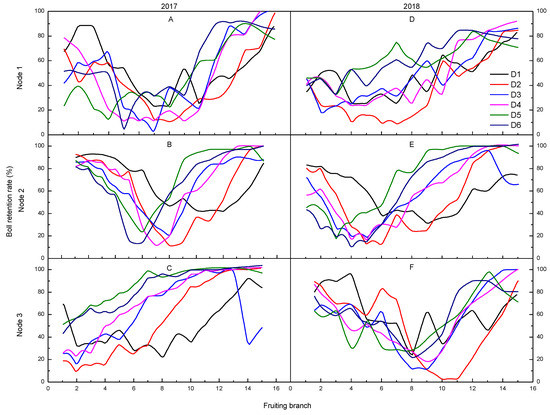
Figure 4.
Boll retention at node 1, 2, 3 of fruiting branches. D1–D6 represent plant densities. (A–C) and (D–F) indicate 2017 and 2018, respectively.
3.4. Cotton Plant Biomass (CPB) Accumulation
Cotton plant biomass (CPB) accumulation was positively influenced by plant density and followed a normal logistic model by DAE (Figure 5A,D). Cotton plant biomass increased as the density increased, whereas differences were found between different plant densities. The D6 PD had more CPB accumulation as compared to D1, D2, D3, D4 and D5 during both growing seasons. The CPB increased up to 117 DAE and then decreased gradually until 132 DAE.
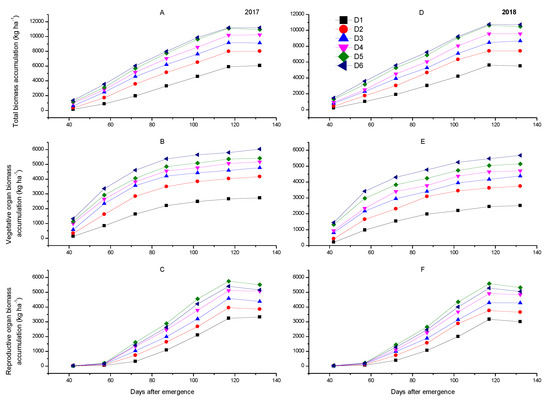
Figure 5.
Total cotton plant biomass (A,D), vegetative organ biomass (B,E) and reproductive organ biomass accumulation (C,F) during 2017 and 2018, respectively.
Data regarding vegetative organ biomass (VOB) during 2017 and 2018 are presented in Figure 5B,E. Vegetative organ biomass of cotton was positively affected by PD. Vegetative organ biomass of each density increased up to maturity of vegetative structures. After achieving maturity, the VOB accumulation became lower as compared to before maturity. The VOB accumulation increased up to 117 DAE and then followed a decreasing trend. The highest PD, D6 produced maximum VOB as compared to other plant densities, while individual plant VOB decreased as density increased due to resource competition among plants.
The appearance of the first square is the start of reproductive growth of cotton. The reproductive organ biomass (ROB) accumulation was lower up to the first bloom and then onwards, the growth of ROB increased gradually. Reproductive organ biomass curve remain narrowed up to 60 DAE after that it became widened. During both years, the D5 PD produced more ROB followed by D6, D4, D3, D2 and D1 (Figure 5C,F).
3.5. Simulation of Biomass Accumulation
Simulation of biomass accumulation based on formula (1) followed the logistic function and all the biomass accumulations were significant (Table 4). Calculation from Equations (2)–(7) based on Table 4 shows the day of starting and ending of cotton biomass fast accumulation period (FAP) during 2017 and 2018. The averaged highest speed for CPB in all treatments were 56 and 98 DAE in 2017 (Table 5) and 55 and 102 in 2018 growing season with highest average (VA = 131 and 115 kg ha−1 d−1) and maximum rate (VM = 149 and 131 kg ha−1 d−1) (Table 6).
Table 4.
Simulation of plant biomass accumulation affected by plant density in cotton-growing season 2017 and 2018.
Table 5.
Eigen values of biomass accumulation affected by plant density in cotton-growing season 2017.
Table 6.
Eigen values of biomass accumulation affected by plant density in cotton-growing season 2018.
Progress of CPB accumulation varied among different plant densities. In 2017, the fast accumulation period of D5 started at 52 DAE and completed at 95 DAE which lasted for 42 DAE with the highest average (156 VA kg ha−1 d−1) and maximum rate (177 VM kg ha−1 d−1) at 72 DAE. The longest fast accumulation period for CPB was observed in D4 which lasted for 45 DAE with an average rate of 138 VA kg ha−1 d−1 (Table 5).
In 2018, FAP of CPB for D6 began earlier at 49 DAE and D1 FAP ended finally at 108 DAE. The highest average (133 VA kg ha−1 d−1) and maximum rate (152 VM kg ha−1 d−1) was observed in D5 followed by D6, D4, D3, D2 and D1 (Table 6).
Data regarding VOB showed that accumulation responded positively to plant density. The earliest and highest FAP of VOB in both years was observed at D6 with the average rate of 107 and 89 VA kg ha−1 d−1 which lasts for 32 and 37 DAE, while maximum rate (122 and 99 VM kg ha−1 d−1) lasted for 55 and 53 DAE in 2017 and 2018, respectively. The average and maximum VOB accumulation rate of D6 was 8%, 13%, 16%, 25%, 53% higher than D3, D5, D4, D2, D1 and 17%, 21%, 33%, 33%, 55% higher than D5, D4, D2, D3, D1 in 2017 and 2018, respectively (Table 5 and Table 6).
The highest average rate (110 VA kg ha−1 d−1) of ROB was observed in D5 which began at 71 DAE and terminated at 102 DAE which lasted for 31 DAE and maximum rate (126 VM kg ha−1 d−1) at 86 DAE in 2017 (Table 5). The average and maximum ROB accumulation rate of D5 was 5%, 15%, 23%, 31% and 34% higher than D6, D4, D3, D2 and D1, respectively. The earliest FAP also started in D5 at 71 DAE while the last terminated FAP was observed in D1 which ended at 111 DAE. In 2018, the earliest FAP of ROB was started in D5 which lasted for 31 DAE and terminated at 103 DAE with the highest average rate (108 VA kg ha−1 d−1) and maximum rate (123 VM kg ha−1 d−1) at 87 DAE trailed by D6, D4, D3, D2 and D1 (Table 6).
4. Discussion
The present two-year study was conducted to investigate the effects of different PD on cotton growth, yield, boll retention and biomass accumulation. High PD is practiced for higher production in terms of number of bolls per unit area, however, it has been observed that yield increases up to a certain moderate plant density while too high a PD negatively affects the yield resulting in lower production.
An optimal cotton PD is influenced by various conditions, including soil, microclimate, planting pattern, irrigation type, fertilizer application method, cultivar and farmer’s field management. Three major regions of China’s cotton belt have huge differences in their PD. An optimal higher PD is advantageous for producing high yield. Xinjiang region has the highest PD of 21.0 × 10⁴–24.0 × 10⁴ plants ha−1 [24], followed by Yellow River Valley, with a PPD of 3.0 × 10⁴, 4.5 × 10⁴ and 6.0 × 10⁴ plants ha−1 for hybrid Bt cotton, indigenous Bt cotton, and Bt cotton, respectively [25,26], whereas, for late sowing PD it is 7.5 × 10⁴ ha−1 [27]. Similarly, Yangtze River Valley in which hybrid seeds are commonly used, has the PD of 3.0 × 10⁴ plants ha−1 [28]. Similar results are also presented in this paper that cotton yield increases with increasing PD up to certain limit (87,000 plants ha−1) in Yellow River Valley while yield reduction occurred with very high or very low PD [29].
Growth and development of cotton is highly affected by PD. As PD increases, squaring, flowering, boll setting, and maturity is delayed. Late maturity is related to low temperature and light interception. An increase in PD decreases the amount of light interception to the lower parts of the plant and increases resource competition among plants which affect cotton phenological development [30].
Increasing plant density reduced plant height, main-stem nodes per plant, number of bolls per plant, and individual boll weight [31,32]. Decreasing PD increased bolls at the 1st, 2nd and 3rd positions of the plant with less yield and unnecessary vegetative growth that led to undesirable fruit shedding and boll rotting [33]. In the present study, it was observed that plant height, number of bolls and fruiting nodes per plant decreased, while shedding percentage increased with increasing PD. Similar results were also reported in previous investigations [16,34].
In this study, the plant density D5 produced the highest yield and yield contributors except boll weight and lint percentage in the year 2018. Cotton yield and yield contributors of the different plant densities decreased in the following trend, D5 > D4 > D6 > D3 > D2 > D1, with the highest and lowest yield in D5 and D1, respectively. During both years, the increase in yield might be due to higher number of bolls and fruiting nodes m−2. Individual plant yield and bolls m−2 of D5 was lower as compared to D1, D2, D3, D4 but was higher per unit area. Our results are in agreement with Mao et al. (2015), who reported an increased number of bolls m−2 and a lower weight of single boll in higher PD [35]. Exceptionally high plant densities reduced boll weight and light penetration to lower parts of the plant which increased ethylene/sugar ratio and resulted in greater shedding with low yield [16]. Our results are also in agreement with Dong et al. (2010) that high PD produce more bolls but decrease boll weight [36]. High PD resulted in fruit shedding, poor boll filling, delay maturity and disease infestation which resulted in reduced cotton yield [9,10,23]. Our results showed that too high (D6) and too low (D1) plant population led to a decline in cotton yield. An optimal plant density (D5) not only increases yield but also utilize less inputs without yield reduction as compared to high PD [8].
Boll retention was affected by plant density and an inverse relationship was found between fruiting position and plant density. Bednarz et al. (2000) reported that plant population affected boll numbers per plant in cotton [17]. In this study, the rate of boll retention at both fruiting position and node decreased as plant population increased. This might be due to high resource competition as density increases [8]. Our result are in agreement with the findings of Siebert and Stewart (2006) that decrease of plant population increased bolls at the 1st, 2nd and 3rd positions of the plant [33]. Higher boll numbers were retained above node 8 while less retention rate was observed at node 4–10. Increasing plant density decreased the bolls at the 1st position on nodes 6–10 [31]. Different studies conducted on boll retention rate reported that more bolls were retained at nodes 7–13 [37] or at nodes 13–22 [38]. Shade during the first bloom, peak bloom and boll development increased fruit shedding which consequently reduced boll retention rate [39]. Pettigrew et al. (2004) reported that higher plant nodes produced more bolls in irrigated cotton [40], while Guo-zheng et al. (2010) linked high boll retention with increased boll rot, low open boll rate and concluded that dense population create shade, increase canopy humidity, making the canopy environment suitable for pest injury, spread of disease and remaining safe from insecticides or pesticide sprays due to dense leaves [34]. The lower boll retention rate might also be due to less light interception in the canopy. Xue et al. (2015) concluded that light interception decreases with an increase in plant height because of a sealed canopy [41]. Light interception increases speedily after planting and starts decreasing after canopy sealing whereas less of a difference in light interception was observed in different plant densities at early growth stages [41]. Therefore, it might be possible that due to more light interception in the early growth stages, the first nodes had more boll retention and canopy sealed slowly affecting light interception and boll retention. After tip removal, the plants stopped branching and the upper branches received more light up to the end of season which probably resulted an increase in boll retention in the nodes above 8.
Biomass accumulation in cotton changes with different treatments and follows a parabolic curve. High plant density increased plant total biomass in terms of kg ha−1 but the individual biomass of a cotton plant decreased [42]. Plant density D5 produced maximum biomass and had maximum biomass accumulation. As the canopy becomes dense, the light interception in the canopy decreases and resource competition increases which affect the growth of the crop [41,43]. Vegetative organ biomass accumulation increases as density increases but reproductive organ biomass accumulation decreases at too high a density. Biomass above ground is directly related with PD and increasing plant density increases light-use efficiency at the reproductive stage [44]. The increase in total and vegetative biomass may also be due to higher number of plants per unit area with high vegetative growth. Reproductive organ biomass accumulation decreases with too high and too low plant densities[9]. Our results recommended that high ROB can be obtained by adjusting plant density accordingly.
5. Conclusions
The results from the present study indicated that plant density influenced growth, seed cotton and lint yield, boll retention and biomass accumulation of cotton crop. Specifically, cotton plants from cv. SCRC28 had more reproductive organ biomass accumulation in D5 (87,000 cotton plants per hectare) as compared to other densities used into this experiment. The greater biomass accumulation in reproductive organs and more bolls per unit of area had a consequence an increase in yield at D5 crop density. Low densities produced more boll weight but did not contribute to final yield due to a lower number of bolls per unit of area. Increasing density from D1 (15,000) to D5 (87,000), resulted in higher fruit shedding and lower bolls per unit area and gave low biomass accumulation in reproductive structures due to less light penetration into the lower canopy. Hence, it is concluded that 87,000 plants ha−1 could be the optimal plant density for the mid-maturing cultivar SCRC28, which had achieved high cotton production in Henan province of China. Further research is needed to check the recommended density for other varieties, hybrids or Bt cotton cultivars.
Author Contributions
L.F. and Y.L. (Yabing Li) designed the study. F.X., S.X. and B.Y. conducted the experiment. Z.W. and Y.H. gave directions and supervised the work. Z.F., Y.L. (Xiaofei Li) and X.L. helped during the experiment. N.K. processed and analyzed the data and wrote the first draft. Y.L. (Yabing Li) and G.W. edited and revised the manuscript. All authors have read and agreed to the published version of the manuscript.
Funding
This work was supported by National Key Research and Development Program of China (2018YFD1000900). The funder had no role in study designing, data collection and analysis of data.
Acknowledgments
We appreciate the agronomic expertise of technical staff for their contribution in carrying out field operations of this project.
Conflicts of Interest
The authors declare no conflict of interest.
References
- Maiti, R.; Satya, P.; Rajkumar, D.; Ramaswamy, A. Crop Plant Anatomy; CABI: Wallingford, UK, 2012; Volume 42, ISBN 9781780640198. [Google Scholar]
- Statista Distribution of Global Cotton Production by Country. Available online: https://www.statista.com/statistics/595561/distribution-of-global-cotton-production-by-country/ (accessed on 31 March 2019).
- Dai, J.; Dong, H. Intensive cotton farming technologies in China: Achievements, challenges and countermeasures. Field Crops Res. 2014, 155, 99–110. [Google Scholar] [CrossRef]
- Abdurakhmonov, I.Y. Role of genomic studies in boosting yield. In Proceedings of the International Cotton Advisory Board (ICAC), Cartagena, Colombia, 20 September–4 October 2013; pp. 7–22. [Google Scholar]
- Zhang, Y.; Dong, H. Yield and Fiber Quality of Cotton; Elsevier Inc: Amsterdam, The Netherlands, 2019; pp. 1–9. [Google Scholar]
- Ajayakumar, M.Y.; Umesh, M.R.; Shivaleela, S.; Nidagundi, J.M. Light interception and yield response of cotton varieties to high density planting and fertilizers in sub-tropical India. J. Appl. Nat. Sci. 2018, 9, 1835–1839. [Google Scholar] [CrossRef]
- Venugopalan, M.V.; Kranthi, K.R.; Blaise, D.; Lakde, S.; Sankaranarayana, K. High density planting system in cotton—The Brazil experience and Indian initiatives. Cott. Res. J. 2014, 5, 1–7. [Google Scholar]
- Zhi, X.Y.; Han, Y.C.; Li, Y.B.; Wang, G.P.; Du, W.L.; Li, X.X.; Mao, S.C.; Lu, F. Effects of plant density on cotton yield components and quality. J. Integr. Agric. 2016, 15, 1469–1479. [Google Scholar] [CrossRef]
- Yang, G.Z.; Luo, X.J.; Nie, Y.C.; Zhang, X.L. Effects of plant density on yield and canopy micro environment in hybrid cotton. J. Integr. Agric. 2014, 13, 2154–2163. [Google Scholar] [CrossRef]
- Bednarz, C.W.; Nichols, R.L.; Brown, S.M. Plant density modifications of cotton within-boll yield components. Crop Sci. 2006, 46, 2076–2080. [Google Scholar] [CrossRef]
- Dong, H.; Li, W.; Eneji, A.E.; Zhang, D. Nitrogen rate and plant density effects on yield and late-season leaf senescence of cotton raised on a saline field. Field Crops Res. 2012, 126, 137–144. [Google Scholar] [CrossRef]
- Mccarty, J.C.; Wu, J.; Jenkins, J.N. Genetic association of cotton yield with its component traits in derived primitive accessions crossed by elite upland cultivars using the conditional ADAA genetic model. Euphytica 2008, 161, 337–352. [Google Scholar] [CrossRef]
- Worley, S.; Culp, T.W.; Harrell, D.C.; Region, S. The relative contributions of yield components to lint yield of upland cotton, Gossypium hirsutum. Euphytica 1974, 23, 399–403. [Google Scholar] [CrossRef]
- Clement, J.D.; Constable, G.A.; Liu, S.M. Increasing cotton seed fibre density as a breeding strategy to improve fibre fineness. Field Crops Res. 2014, 160, 81–89. [Google Scholar] [CrossRef]
- Imran, M.; Shakeel, A.; Azhar, F.M.; Farooq, J.; Saleem, M.F.; Saeed, A. Combining ability analysis for within-boll yield components in upland cotton (Gossypium hirsutum L.). Genet. Mol. Res. 2012, 11, 2790–2800. [Google Scholar] [CrossRef] [PubMed]
- Khan, A.; Najeeb, U.; Wang, L.; Tan, D.K.Y.; Yang, G.; Munsif, F.; Ali, S.; Hafeez, A. Planting density and sowing date strongly influence growth and lint yield of cotton crops. Field Crops Res. 2017, 209, 129–135. [Google Scholar] [CrossRef]
- Bednarz, C.W.; Bridges, D.C.; Brown, S.M. Analysis of cotton yield stability across population densities. Agron. J. 2000, 92, 128–135. [Google Scholar] [CrossRef]
- Boquet, D.J.; Moser, E.B. Boll retention and boll size among intrasympodial fruiting sites in cotton. Crop Sci. 2003, 43, 195–201. [Google Scholar] [CrossRef]
- Ehlig, C.F.; Lemert, R.D. Effects of fruit load, temperature, and relative humidity on boll retention of cotton. Crop Sci. 1973, 13, 1971–1974. [Google Scholar] [CrossRef]
- Guinn, G. Fruiting of cotton. III. Nutritional stress and cutout. Crop Sci. 1985, 25, 981–985. [Google Scholar] [CrossRef]
- Reddy, K.R.; Hodges, H.F.; Reddy, V.R. Temperature Effects on cotton fruit retention. Agron. J. 1992, 84, 26–30. [Google Scholar] [CrossRef]
- Bange, M.P.; Milroy, S.P. Growth and dry matter partitioning of diverse cotton genotypes. Field Crops Res. 2004, 87, 73–87. [Google Scholar] [CrossRef]
- Khan, A.; Wang, L.; Ali, S.; Tung, S.A.; Hafeez, A.; Yang, G. Optimal planting density and sowing date can improve cotton yield by maintaining reproductive organ biomass and enhancing potassium uptake. Field Crops Res. 2017, 214, 164–174. [Google Scholar] [CrossRef]
- Xia, Y.Q. A probe into planting density for cotton high yielding. Xinjiang Agric. Sci. 2008, 45, 70–71. [Google Scholar]
- Dong, H.; Li, Z.; Tang, W.; Zhang, D. Evaluation of a production system in china that uses reduced plant densities and retention of vegetation branches. J. Cotton Sci. 2005, 9, 1–9. [Google Scholar]
- Dong, H.Z.; Li, W.J.; Tang, W.; Li, Z.H.; Zhang, D.M. Crop/Stress physiology effects of genotypes and plant density on yield, yield components and photosynthesis in BT transgenic cotton. J. Agron. Crop Sci. 2006, 139, 132–139. [Google Scholar] [CrossRef]
- Dong, H.; Li, W.; Tang, W.; Li, Z.; Zhang, D.; Niu, Y. Yield, quality and leaf senescence of cotton grown at varying planting dates and plant densities in the Yellow River Valley of China. Field Crops Res. 2006, 98, 106–115. [Google Scholar] [CrossRef]
- Wang, R.Q.; Pang, C.Q. Effect of NPK fertilizer and density on cotton lint yield. China Cott. 2009, 36, 8–12. [Google Scholar]
- Ali, M.; Ali, L.; Sattar, M. Response of seed cotton yield to various plant populations and planting methods. J. Agric. Res. 2010, 48, 163–169. [Google Scholar]
- Wei, H.; Meili, C.; Wenqing, Z.; Binglin, C.; Youhua, W.; Shan-shan, W.; Yali, M.; Zhiguo, Z. The effects of sowing date on cottonseed properties at different fruiting-branch positions. J. Integr. Agric. 2017, 16, 1322–1330. [Google Scholar]
- Clawson, E.L.; Cothren, J.T.; Blouin, D.C. Nitrogen fertilization and yield of cotton in ultra-narrow and conventional row spacings. Agron. J. 2006, 98, 72–79. [Google Scholar] [CrossRef]
- Gwathmey, C.O.; Clement, J.D. Field crops research alteration of cotton source—sink relations with plant population density and mepiquat chloride. Field Crops Res. 2010, 116, 101–107. [Google Scholar] [CrossRef]
- Siebert, J.; Stewart, A. Influence of plant density on cotton response to mepiquat chloride application. Agron. J. 2006, 98, 1634–1639. [Google Scholar] [CrossRef]
- Yang, G.Z.; Zhou, M.Y. Multi-location investigation of optimum planting density and boll distribution of high-yielding cotton (G. hirsutum L.) in Hubei Province, China. Agric. Sci. China 2010, 9, 1749–1757. [Google Scholar] [CrossRef]
- Mao, L.; Zhang, L.; Evers, J.B.; van der Werf, W.; Liu, S.; Zhang, S.; Wang, B.; Li, Z. Yield components and quality of intercropped cotton in response to mepiquat chloride and plant density. Field Crops Res. 2015, 179, 63–71. [Google Scholar] [CrossRef]
- Dong, H.; Kong, X.; Li, W.; Tang, W.; Zhang, D. Effects of plant density and nitrogen and potassium fertilization on cotton yield and uptake of major nutrients in two fields with varying fertility. Field Crops Res. 2010, 119, 106–113. [Google Scholar] [CrossRef]
- Davidonis, G.H.; Johnson, A.S.; Landivar, J.A.; Fernandez, C.J. Cotton fiber quality is related to boll location and planting date. Agron. J. 2004, 96, 42–47. [Google Scholar] [CrossRef]
- Blaise, D. Yield, boll distribution and fibre quality of hybrid cotton (Gossypium hirsutum L.) as influenced by organic and modern methods of cultivation. J. Agron. Crop Sci. 2006, 192, 248–256. [Google Scholar] [CrossRef]
- Zhao, D.; Oosterhuis, D. Cotton responses to shade at different growth stages: Growth, lint yield and fibre quality. Exp. Agric. 2000, 36, 27–39. [Google Scholar] [CrossRef]
- Pettigrew, W.T. Moisture deficit effects on cotton lint yield, yield components, and boll distribution. Agron. J. 2004, 2, 377–383. [Google Scholar] [CrossRef]
- Xue, H.; Han, Y.; Li, Y.; Wang, G.; Feng, L.; Fan, Z.; Du, W.; Yanga, B.; Cao, C.; Maoa, S. Spatial distribution of light interception by different plant population densities and its relationship with yield. Field Crops Res. J. 2015, 184, 17–27. [Google Scholar] [CrossRef]
- Khan, A.; Kong, X.; Najeeb, U.; Zheng, J.; Kean, D.; Tan, Y.; Akhtar, K.; Munsif, F.; Zhou, R. Planting density induced changes in cotton biomass yield, fiber quality, and phosphorus distribution under beta growth model. Agronomy 2019, 9, 500. [Google Scholar] [CrossRef]
- Villalobos, F.J.; Sadras, V.O.; Fereres, E. Plant density and competition. In Principles of Agronomy for Sustainable Agriculture; Springer: Berlin, Germany, 2016; pp. 159–168. ISBN 9783319461168. [Google Scholar]
- Mao, L.; Zhang, L.; Zhao, X.; Liu, S.; van der Werf, W.; Zhang, S.; Spiertz, H.; Li, Z. Crop growth, light utilization and yield of relay intercropped cotton as affected by plant density and a plant growth regulator. Field Crops Res. 2014, 155, 67–76. [Google Scholar] [CrossRef]


© 2019 by the authors. Licensee MDPI, Basel, Switzerland. This article is an open access article distributed under the terms and conditions of the Creative Commons Attribution (CC BY) license (http://creativecommons.org/licenses/by/4.0/).