Allelic Variation for Prolamins in Spanish Durum Wheat Landraces and Its Relationship with Quality Traits

 , and
, and
Abstract
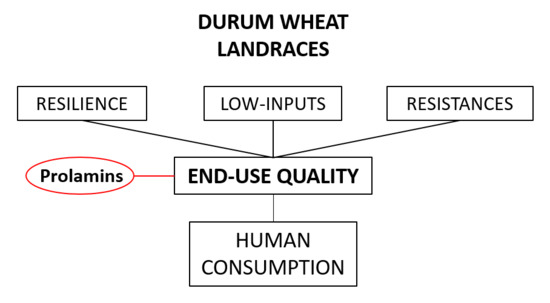
1. Introduction
2. Materials and Methods
2.1. Plant Material and Field Experimental Design
2.2. Homogeneity of Landraces
2.3. Characterization of High and Low Molecular Weight Glutenins, and Gliadins
2.4. Mass Spectrometry
2.5. Semolina Quality Analyses
2.6. Statistical Analyses
3. Results and Discussion
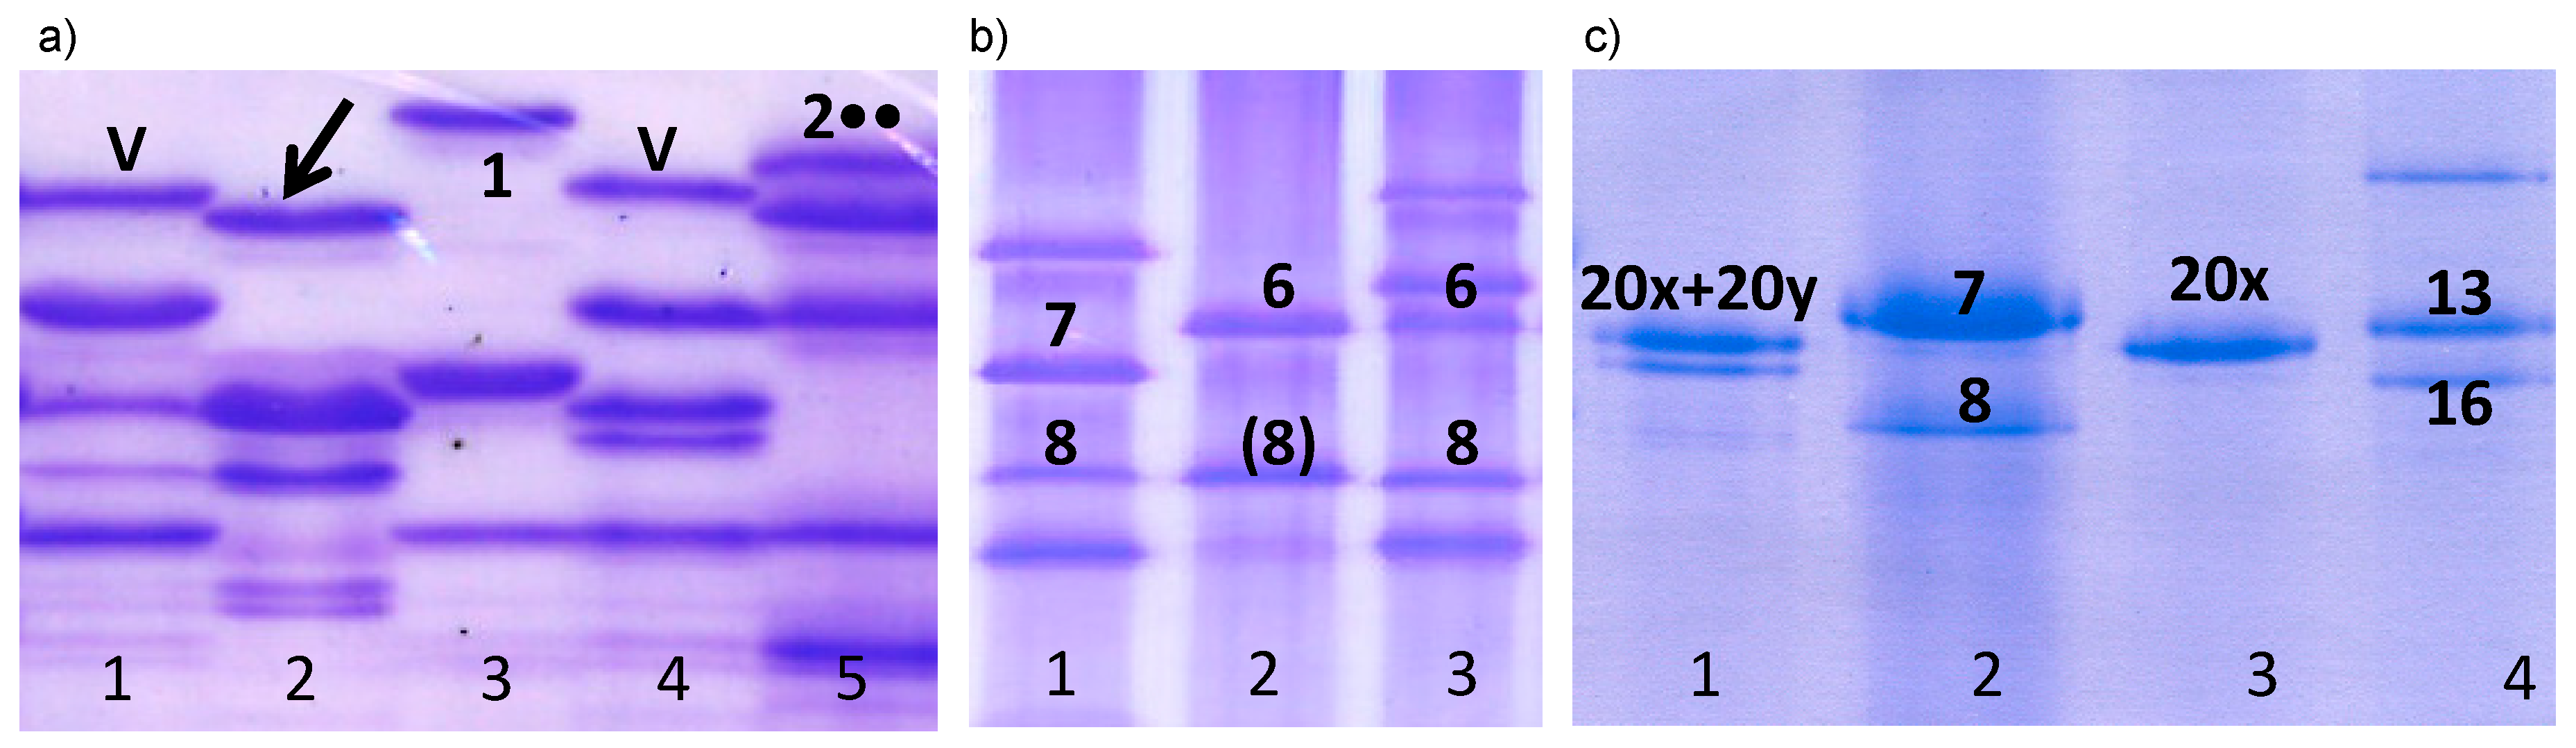
3.1. Characterization of Prolamin Loci
3.1.1. HMW Glutenin Subunits
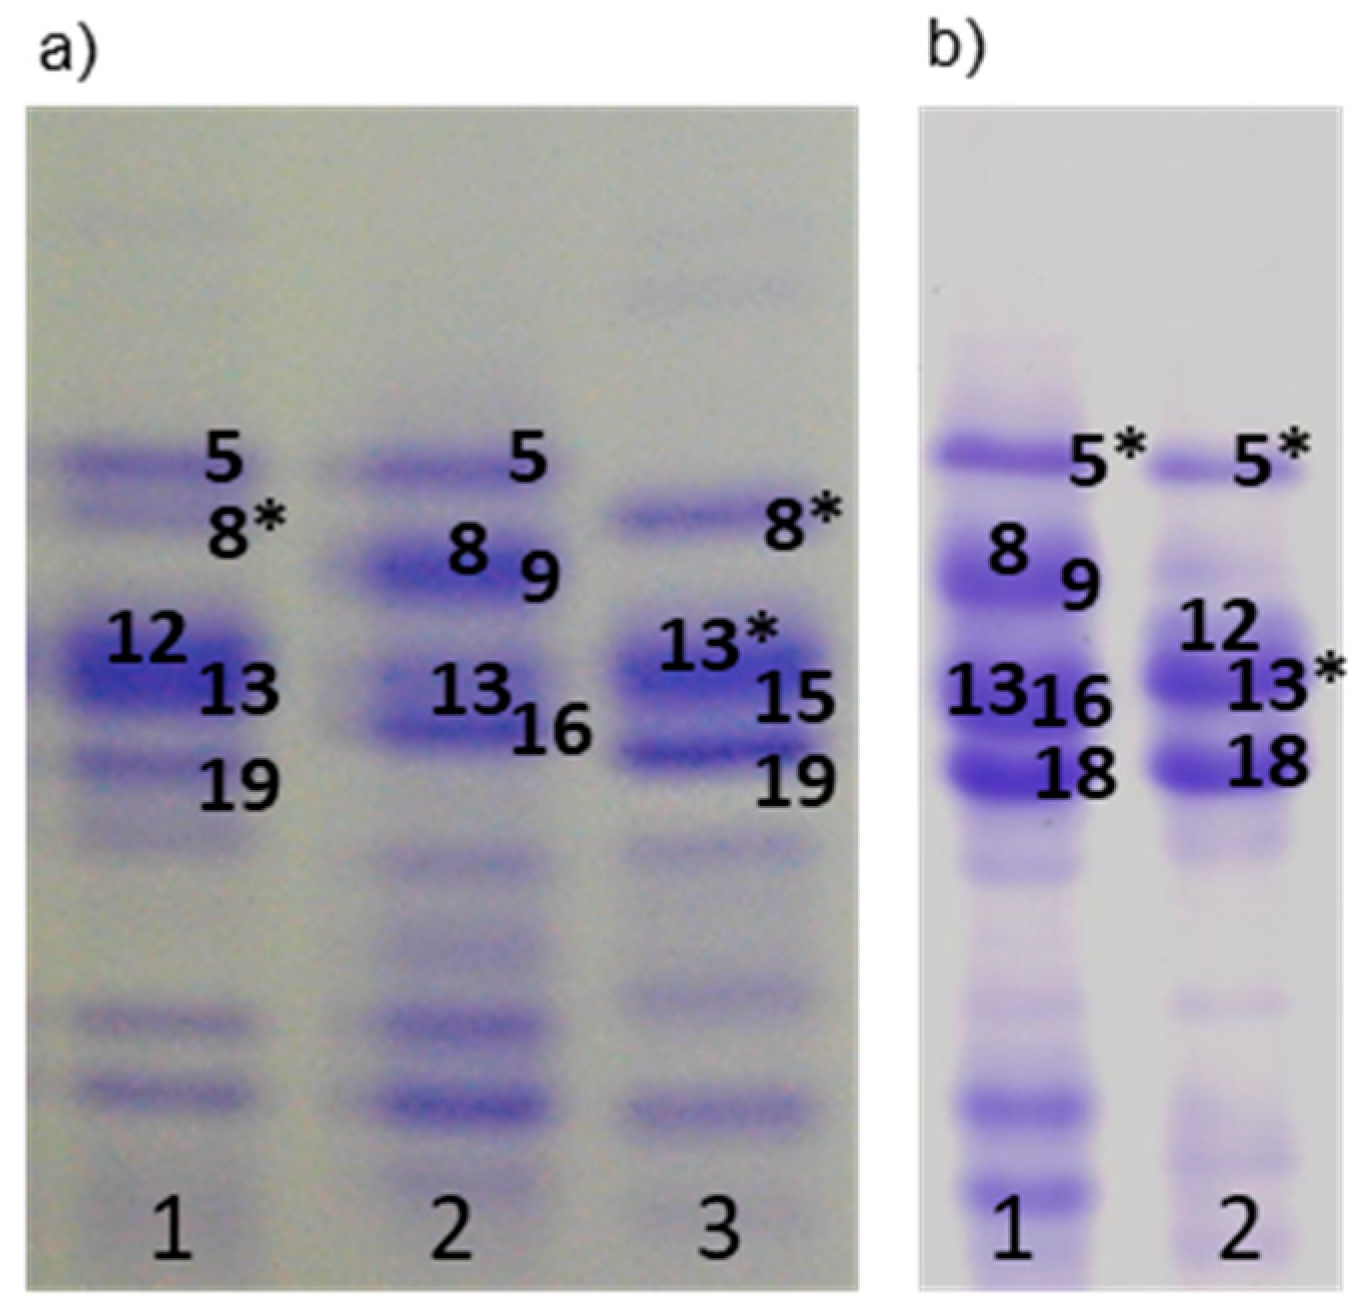
3.1.2. LMW Glutenin Subunits
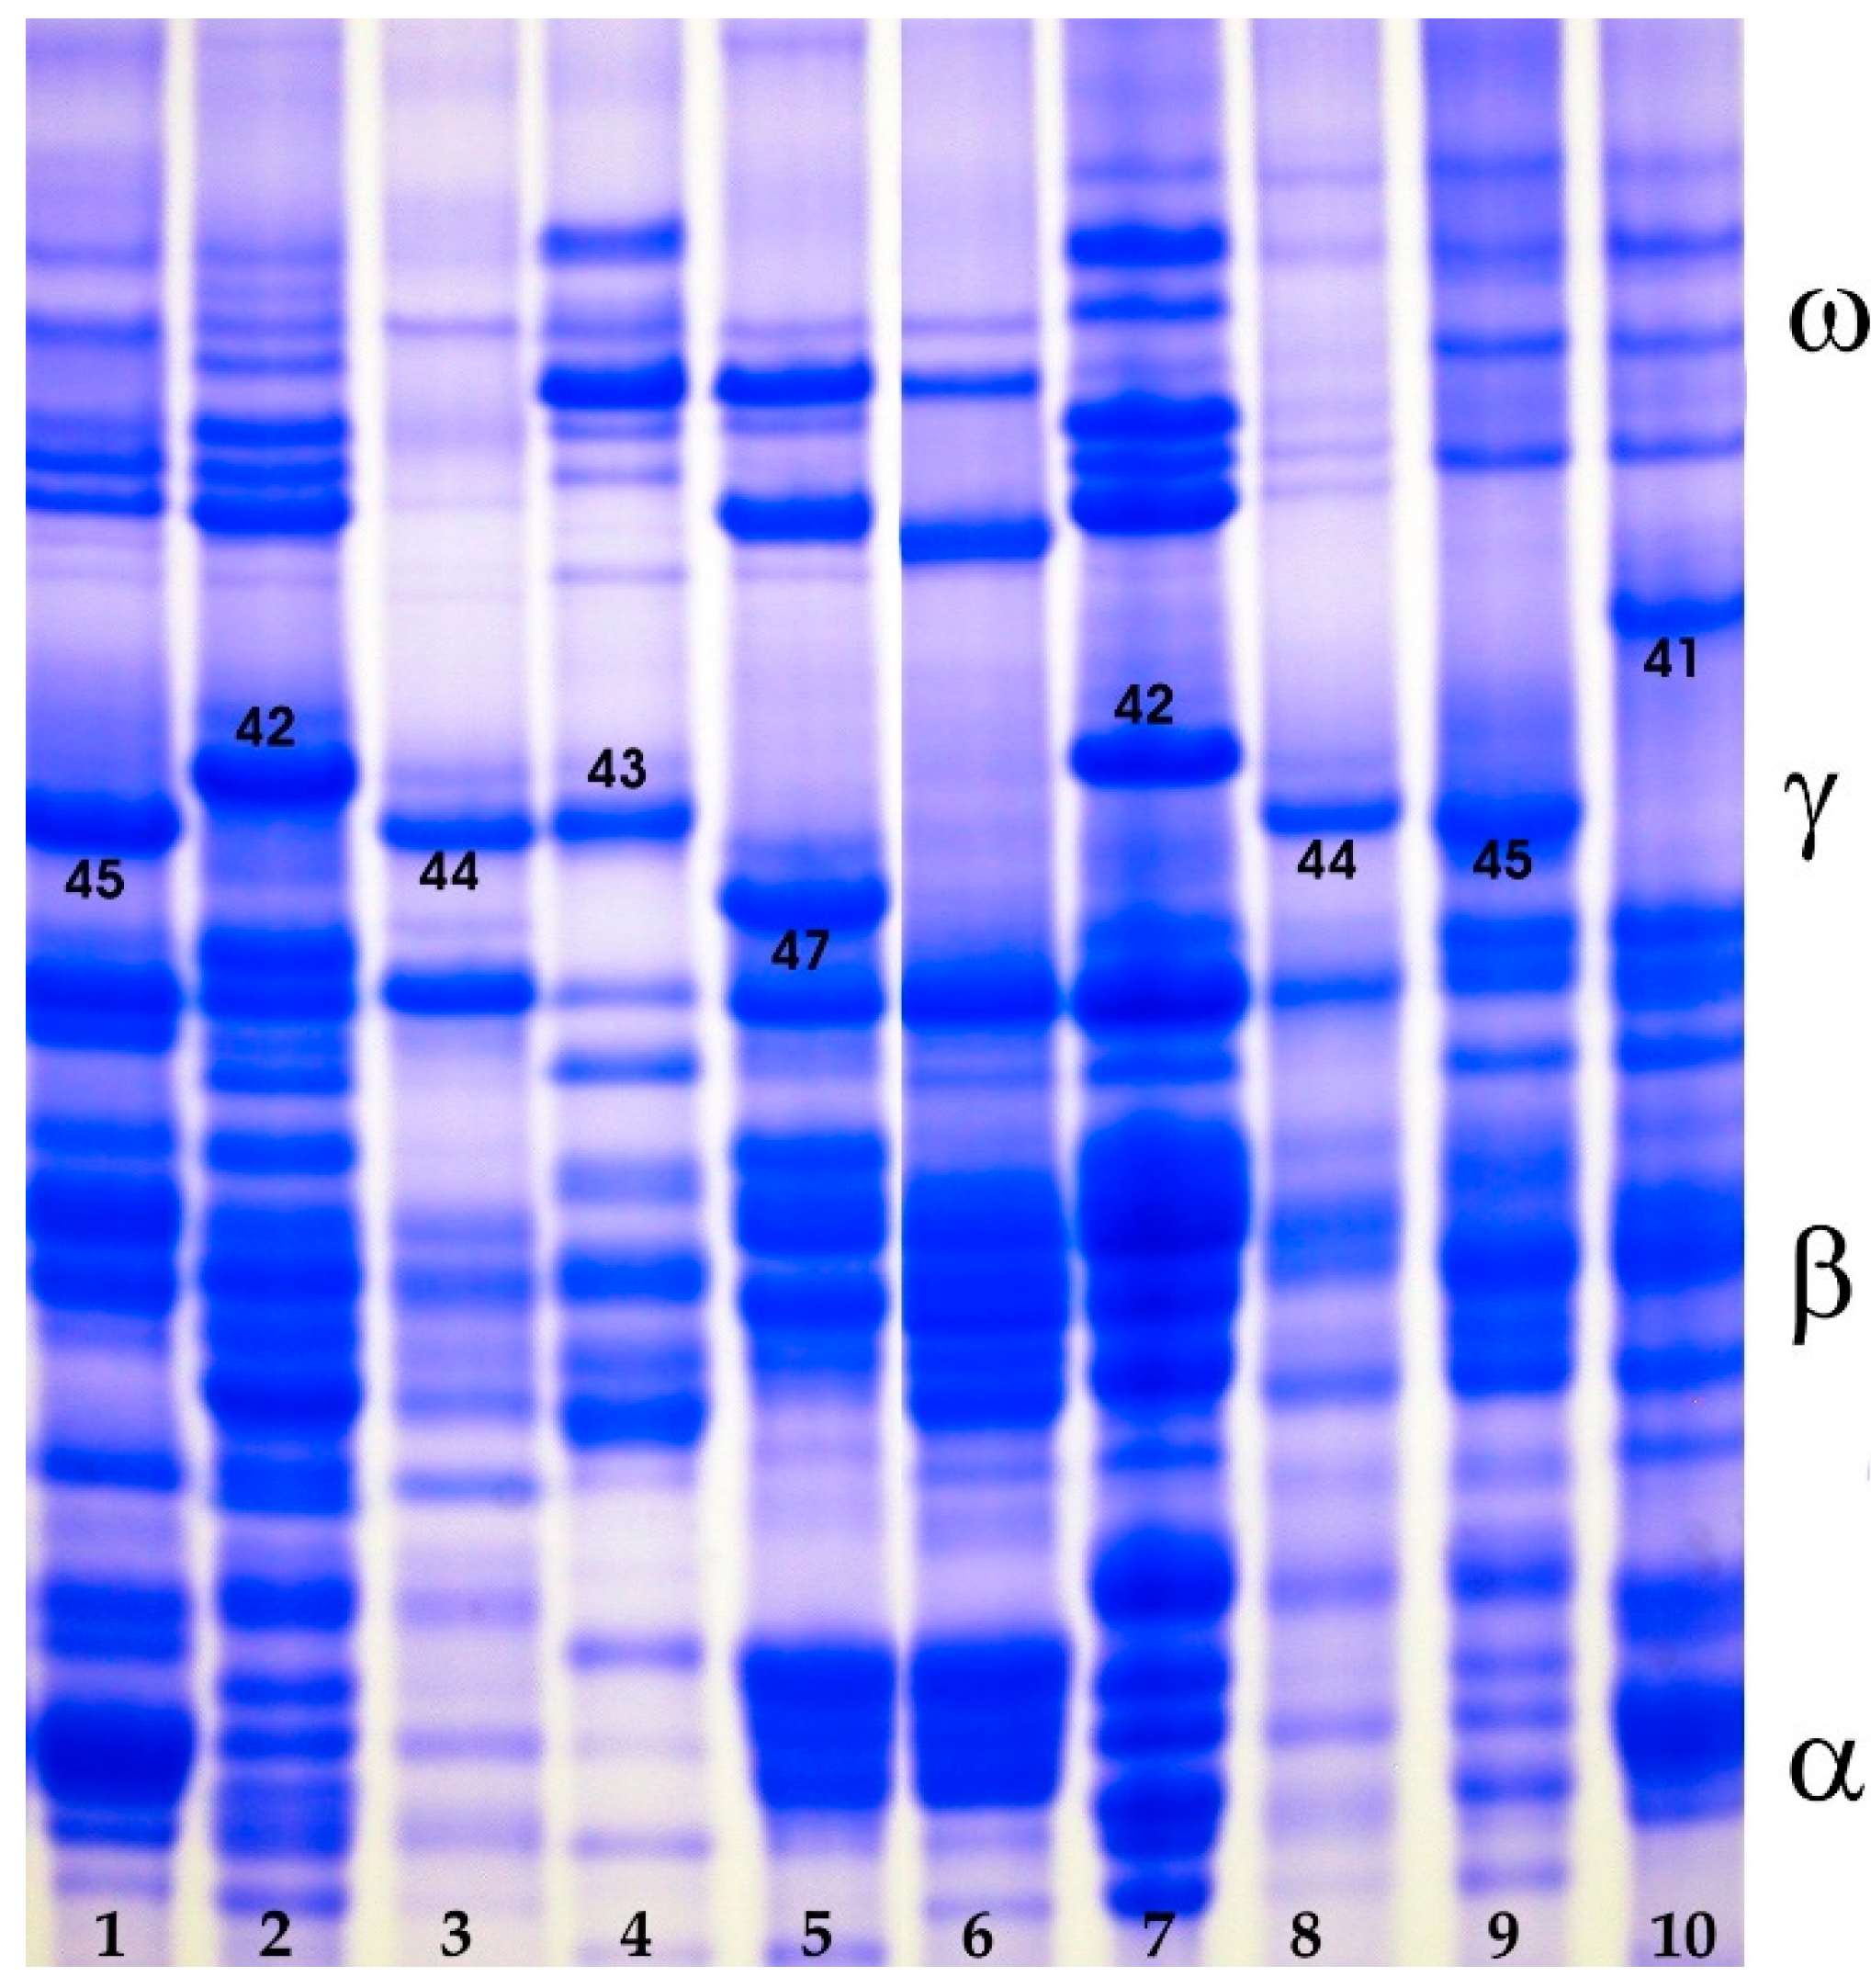
3.1.3. Gliadins
3.2. Quality Evaluation
3.2.1. Mean Values, Range of the Quality Tests and Relation Between Quality Parameters
3.2.2. Effect of Allelic Variation at Individual Prolamin Loci
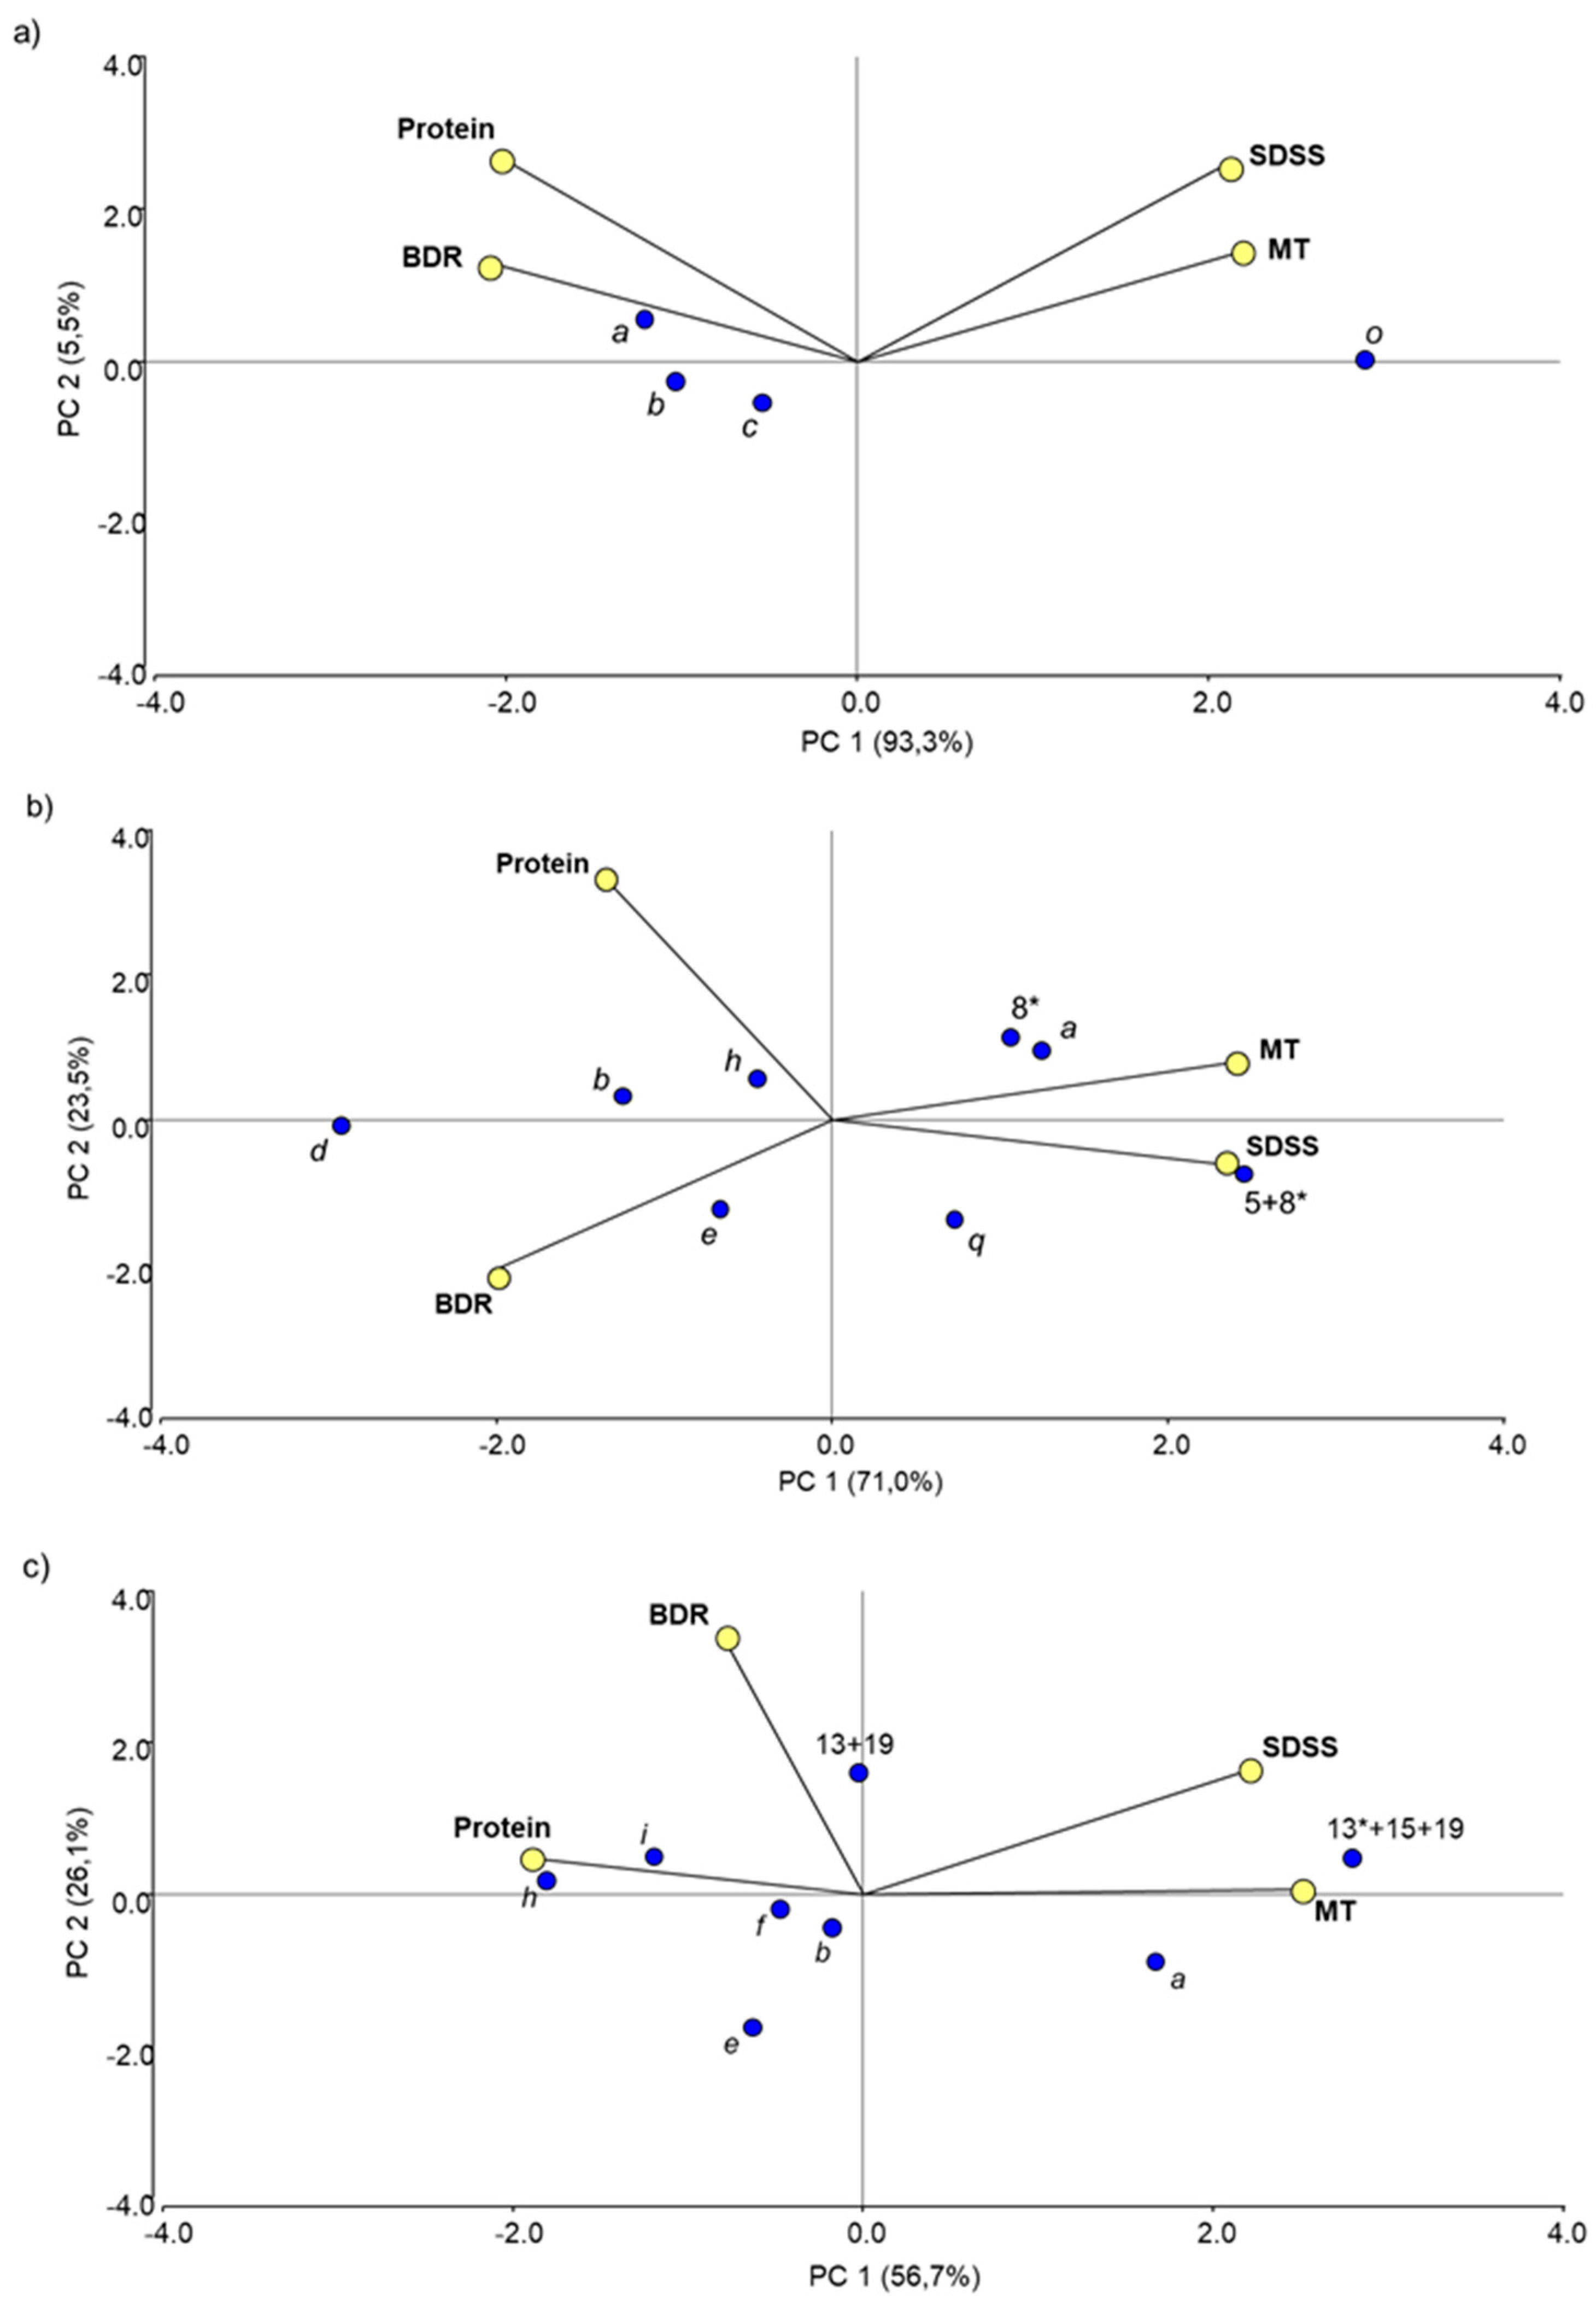
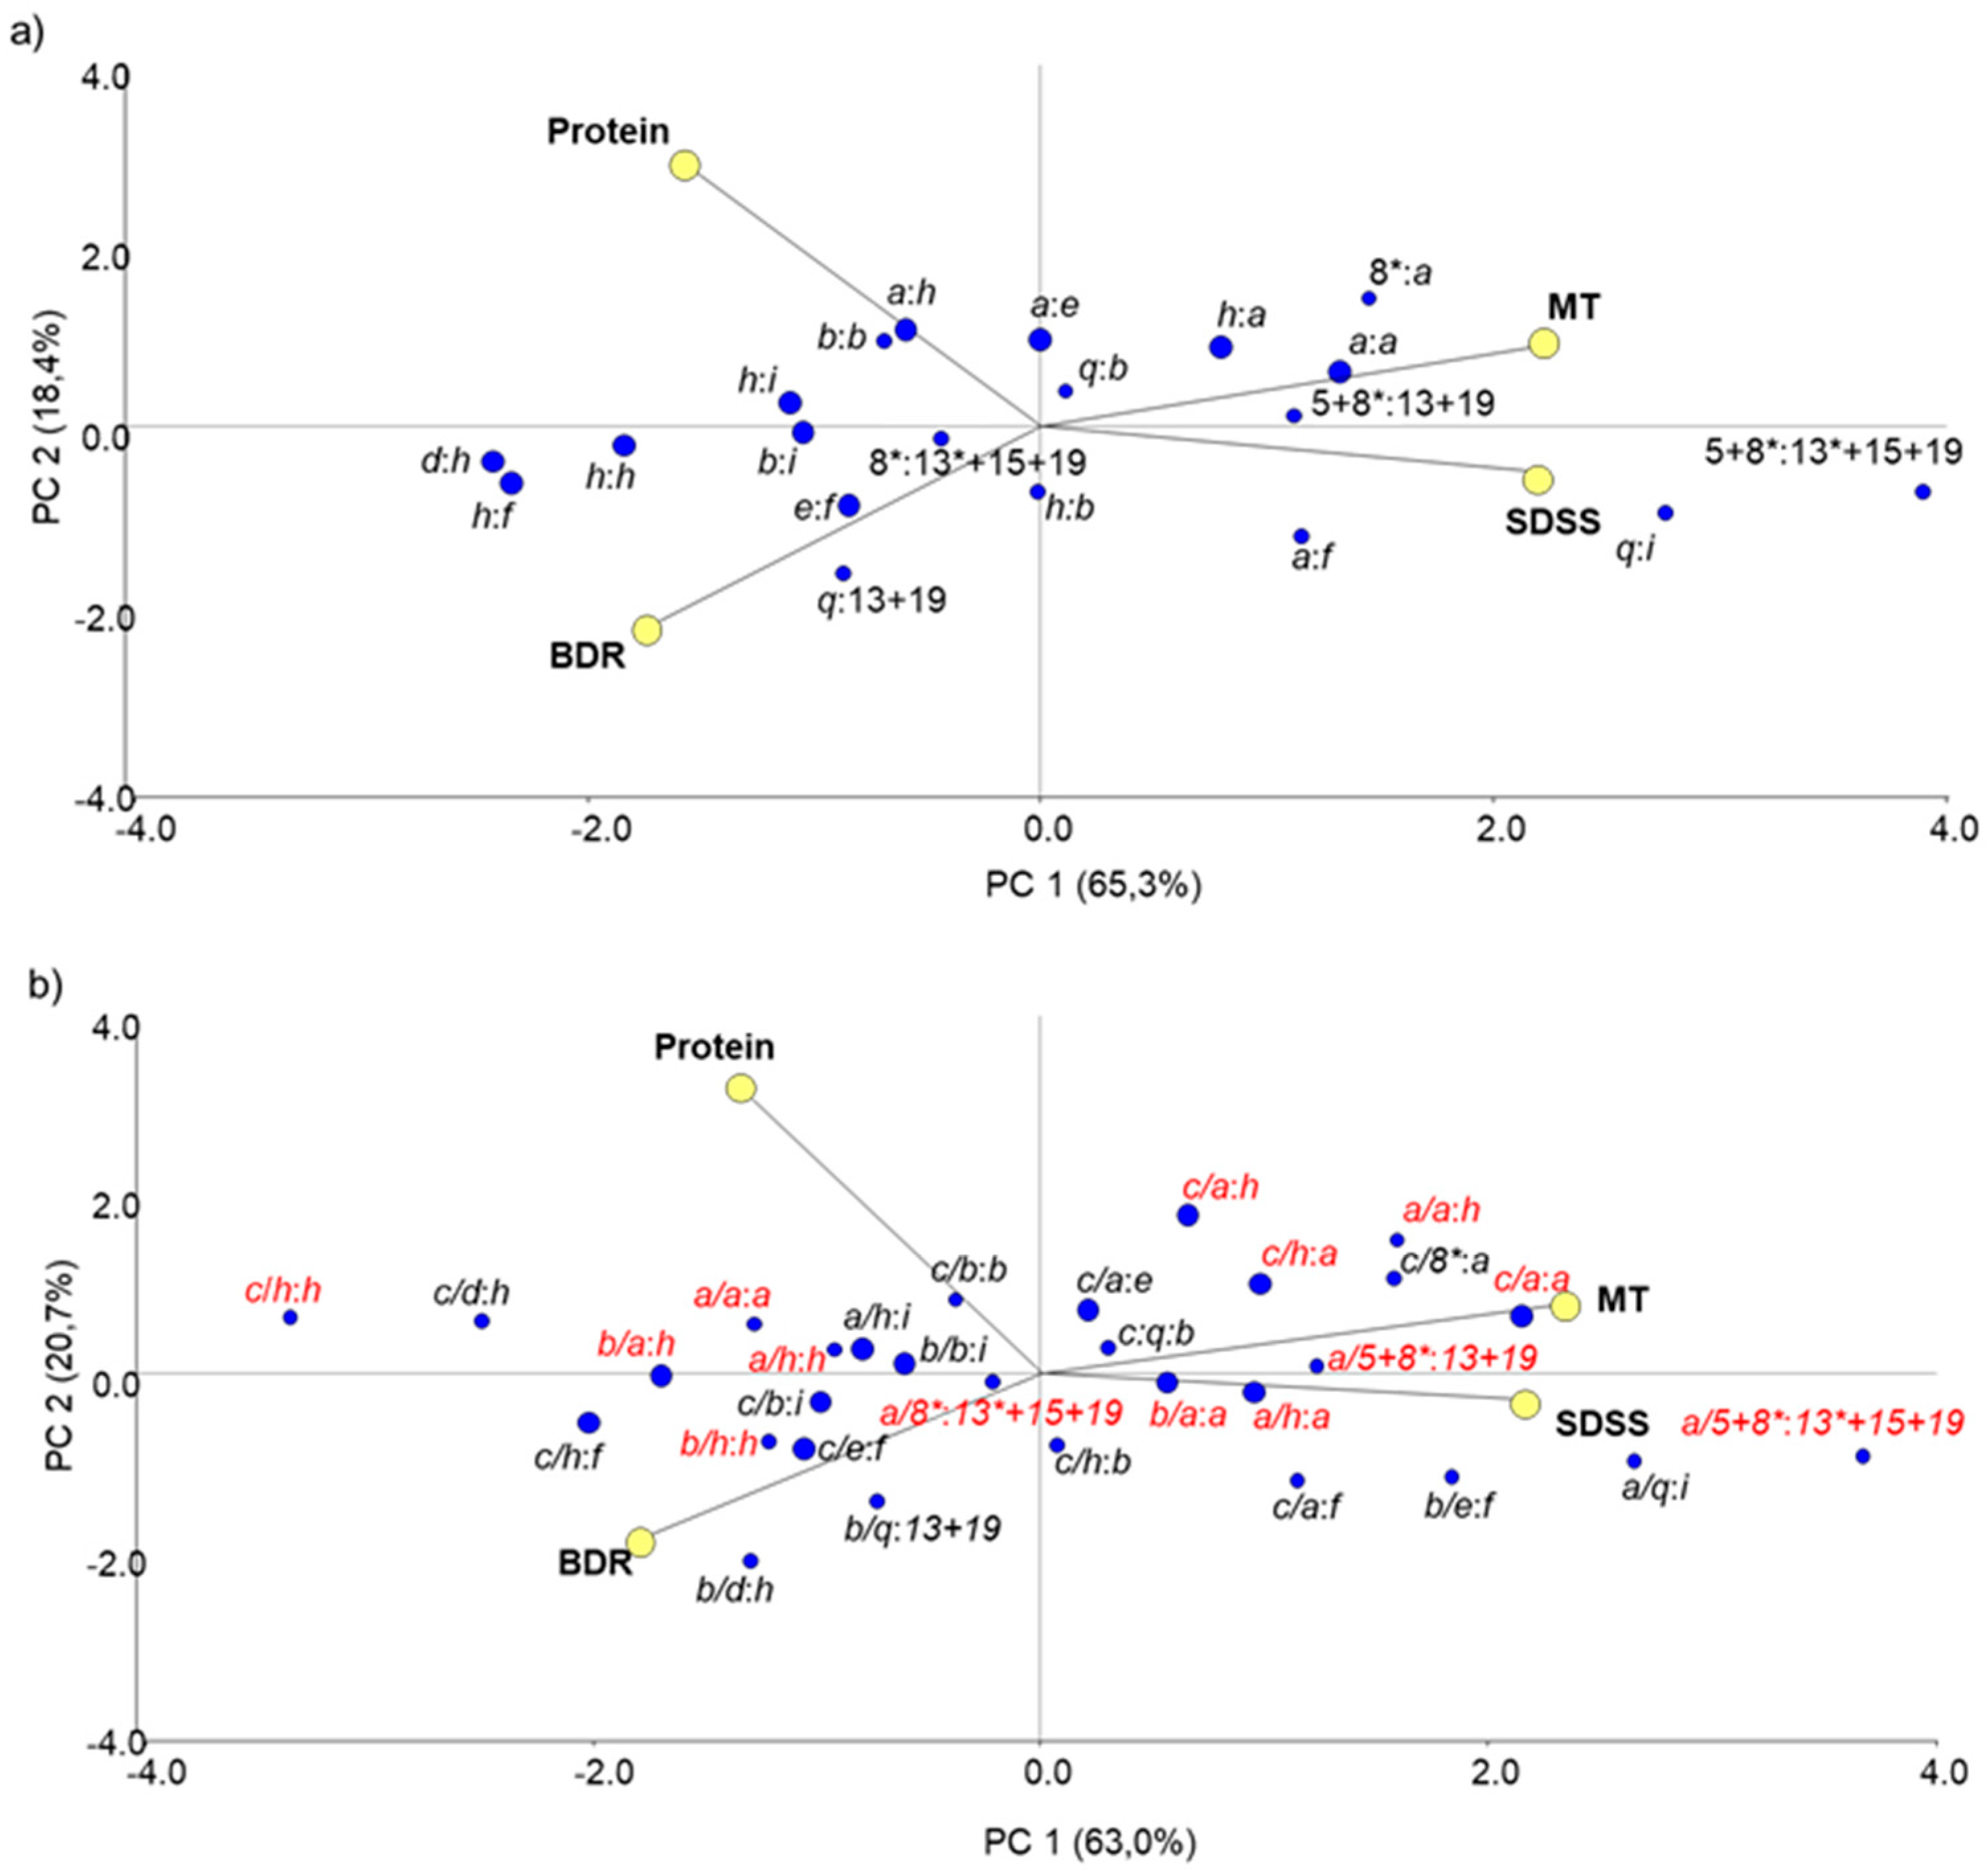
3.2.3. Non-Allelic Interactions between Prolamin Loci
4. Conclusions
Supplementary Materials
Author Contributions
Funding
Acknowledgments
Conflicts of Interest
References
- Kabbaj, H.; Sall, A.T.; Al-Abdallat, A.; Geleta, M.; Amri, A.; Filali-Maltouf, A.; Belkadi, B.; Ortiz, R.; Bassi, F.M. Genetic diversity within a global panel of durum wheat (Triticum durum) landraces and modern germplasm reveals the history of alleles exchange. Front. Plant Sci. 2017, 8, 1277. [Google Scholar] [CrossRef] [PubMed]
- MacKey, J. Wheat: Its concept, evolution, and taxonomy. In Durum Wheat Breeding: Current Approaches and Future Strategies; Royo, C., Nachit, M., Di Fonzo, N., Araus, J.L., Pfeiffer, W.H., Slafer, G.A., Eds.; Haworth Press: Binghamton, NY, USA, 2005; Volume 1, pp. 3–62. [Google Scholar]
- Feldman, M. Origin of cultivated wheat. In The World Wheat Book: A History of Wheat Breeding; Bonjean, A.P., Angus, W.J., Eds.; Lavoisier Publishing: Paris, France, 2001; Volume 1, pp. 3–56. [Google Scholar]
- Ortiz, R.; Trethowan, R.; Ferrara, G.O.; Iwanaga, M.; Dodds, J.H.; Crouch, J.H.; Crossa, J.; Braun, H.-J. High yield potential, shuttle breeding, genetic diversity, and a new international wheat improvement strategy. Euphytica 2007, 157, 365–384. [Google Scholar] [CrossRef]
- Reif, J.C.; Zhang, P.; Dreisigacker, S.; Warburton, M.L.; van Ginkel, M.; Hoisington, D.; Bohn, M.; Melchinger, A.E. Wheat genetic diversity trends during domestication and breeding. Theor. Appl. Genet. 2005, 110, 859–864. [Google Scholar] [CrossRef] [PubMed]
- Mefleh, M.; Conte, P.; Fadda, C.; Giunta, F.; Piga, A.; Hassoun, G.; Motzo, R. From ancient to old and modern durum wheat varieties: Interaction among cultivar traits, management, and technological quality. J. Sci. Food Agric. 2019, 99, 2059–2067. [Google Scholar] [CrossRef]
- Food and Agriculture Organization. FAO Statistical Yearbook, World Food and Agriculture; Food and Agriculture Organization: Rome, Italy, 2013; p. 307. [Google Scholar]
- Berni, R.; Cantini, C.; Romi, M.; Hausman, J.-F.; Guerriero, G.; Cai, G. Agrobiotechnology goes wild: Ancient local varieties as sources of bioactives. Int. J. Mol. Sci. 2018, 19, 2248. [Google Scholar] [CrossRef]
- Osborne, T.B. The Vegetable Proteins, 2nd ed.; Longmans, Green and Co.: London, UK, 1924; pp. 1–154. [Google Scholar]
- Damidaux, R.; Autran, J.; Grignac, P.; Feillet, P. Evidence of relationships useful for breeding between the electrophoretic patterns of gliadins and the viscoelastic properties of the gluten in Triticum durum. Comptes Rendus Hebd. Seances Acad. Sci. Ser. D Sci. Nat. 1978, 287, 701–704. [Google Scholar]
- Payne, P.I.; Jackson, E.A.; Holt, L.M. The association between γ-gliadin 45 and gluten strength in durum wheat varieties: A direct causal effect or the result of genetic linkage? J. Cereal Sci. 1984, 2, 73–81. [Google Scholar] [CrossRef]
- Ruiz, M.; Carrillo, J.M. Relationships between different prolamin proteins and some quality properties in durum wheat. Plant Breed. 1995, 114, 40–44. [Google Scholar] [CrossRef]
- Vazquez, J.F.; Ruiz, M.; Nieto-Taladriz, M.T.; Albuquerque, M.M. Effects on Gluten Strength of Low Mr Glutenin Subunits Coded by Alleles at Glu-A3 and Glu-B3 Loci in Durum Wheat. J. Cereal Sci. 1996, 24, 125–130. [Google Scholar] [CrossRef]
- Carrillo, J.M.; Martinez, M.C.; Brites, C.; Nieto-Taladriz, M.T.; Vázquez, J.F. Relationship between endosperm proteins and quality in durum wheat (Triticum turgidum L. var. durum). Options Méditerranéennes 2000, 40, 463–467. [Google Scholar]
- Aguiriano, E.; Ruiz, M.; Fité, R.; Carrillo, J.M. Genetic variation for glutenin and gliadins associated with quality in durum wheat (Triticum turgidum L. ssp. turgidum) landraces from Spain. Span. J. Agric. Res. 2008, 6, 599–609. [Google Scholar] [CrossRef]
- Moragues, M.; del Moral, L.F.G.; Moralejo, M.; Royo, C. Yield formation strategies of durum wheat landraces with distinct pattern of dispersal within the Mediterranean basin I: Yield components. Field Crops Res. 2006, 95, 194–205. [Google Scholar] [CrossRef]
- Nazco, R.; Peña, R.J.; Ammar, K.; Villegas, D.; Crossa, J.; Moragues, M.; Royo, C. Variability in glutenin subunit composition of Mediterranean durum wheat germplasm and its relationship with gluten strength. J. Agric. Sci. 2014, 152, 379–393. [Google Scholar] [CrossRef] [PubMed]
- Ruiz, M.; Bernal, G.; Giraldo, P. An update of low molecular weight glutenin subunits in durum wheat relevant to breeding for quality. J. Cereal Sci. 2018, 83, 236–244. [Google Scholar] [CrossRef]
- Singh, N.K.; Shepherd, K.W.; Cornish, G.B. A simplified SDS—PAGE procedure for separating LMW subunits of glutenin. J. Cereal Sci. 1991, 14, 203–208. [Google Scholar] [CrossRef]
- Payne, P.I.; Law, C.N.; Mudd, E.E. Control by homoeologous group 1 chromosomes of the high-molecular-weight subunits of glutenin, a major protein of wheat endosperm. Theor. Appl. Genet. 1980, 58, 113–120. [Google Scholar] [CrossRef]
- Lafiandra, D.; Kasarda, D.D. One-and two-dimensional (two-pH) polyacrylamide gel electrophoresis in a single gel: Separation of wheat proteins. Cereal Chem. 1985, 62, 314–319. [Google Scholar]
- Payne, P.I.; Lawrence, G.J. Catalogue of alleles for the complex gene loci, Glu-A1, Glu-B1, and Glu-D1 which code for high-molecular-weight subunits of glutenin in hexaploid wheat. Cereal Res. Commun. 1983, 11, 29–35. [Google Scholar]
- McIntosh, R.; Dubcovsky, J.; Rogers, J.W.; Morris, C.; Appels, R.; Xia, X. Catalogue of gene symbols for wheat: 2013-14 Supplement. Annu. Wheat Newsl. 2014, 58, 259–279. [Google Scholar]
- Nieto-Taladriz, M.T.; Ruiz, M.; Martinez, M.C.; Vazquez, J.F.; Carrillo, J.M. Variation and classification of B low-molecular-weight glutenin subunit alleles in durum wheat. Theor. Appl. Genet. 1997, 95, 1155–1160. [Google Scholar] [CrossRef]
- Kudryavtsev, A.M.; Illichevskii, N.N.; Boggini, G.; Benedettelli, S. Gliadin polymorphism and genetic diversity of modern Italian durum wheat. J. Genet. Breed. 1996, 50, 239–248. [Google Scholar]
- Sechi, S.; Chait, B.T. Modification of cysteine residues by alkylation. A tool in peptide mapping and protein identification. Anal. Chem. 1998, 70, 5150–5158. [Google Scholar] [CrossRef] [PubMed]
- Dick, J.W.; Quick, J.S. A Modified Screening-Test for rapid estimation of gluten strength in early-generation durum-wheat breeding lines. Cereal Chem. 1983, 60, 315–318. [Google Scholar]
- Carrillo, J.M.; Vazquez, J.F.; Orellana, J. Relationship between gluten strength and glutenin proteins in durum wheat cultivars. Plant Breed. 1990, 104, 325–333. [Google Scholar] [CrossRef]
- Finney, K.F.; Shogren, M.D. A ten-gram mixograph for determining and predicting functional properties of wheat flours. Bak. Dig. 1972, 46, 32–47. [Google Scholar]
- InfoStat v2016; Grupo Infostat, FCA, Universidad Nacional de Córdoba: Córdoba, Argentina, 2016.
- Zeven, A.C. Landraces: A review of definitions and classifications. Euphytica 1998, 104, 127–139. [Google Scholar] [CrossRef]
- Ruiz, M.; Vazquez, J.; Carrillo, J. Estudio de la variabilidad de gluteninas y gliadinas en variedades locales y cultivares primitivos españoles de trigo duro. Invest. Agric. Prod. Prot. Veg. 1998, 13, 291–305. [Google Scholar]
- Cherdouh, A.; Khelifi, D.; Carrillo, J.; Nieto-Taladriz, M. The high and low molecular weight glutenin subunit polymorphism of Algerian durum wheat landraces and old cultivars. Plant Breed. 2005, 124, 338–342. [Google Scholar] [CrossRef]
- Brites, C.; Romano, M.; Sousa, R.; Vazquez, J.; Carrillo, J. Caracterizaçao das proteinas de reserva da colecçao de trigos rijos Portugueses: Diversidade e qualidade tecnologica. Melhoramento 1996, 34, 55–66. [Google Scholar]
- Raciti, C.; Doust, M.; Lombardo, G.; Boggini, G.; Pecetti, L. Characterization of durum wheat mediterranean germplasm for high and low molecular weight glutenin subunits in relation with quality. Eur. J. Agron. 2003, 19, 373–382. [Google Scholar] [CrossRef]
- Babay, E.; Hanana, M.; Mzid, R.; Slim-Amara, H.; Carrillo, J.M.; Rodríguez-Quijano, M. Influence of allelic prolamin variation and localities on durum wheat quality. J. Cereal Sci. 2015, 63, 27–34. [Google Scholar] [CrossRef]
- Vallega, V.; Mello-Sampayo, T. Variation of high-molecular-weight glutenin subunits amongst cultivars of Triticum turgidum L. from Portugal. Euphytica 1987, 36, 755–762. [Google Scholar] [CrossRef]
- Branlard, G.; Autran, J.; Monneveux, P. High molecular weight glutenin subunit in durum wheat (T. durum). Theor. Appl. Genet. 1989, 78, 353–358. [Google Scholar] [CrossRef] [PubMed]
- Igrejas, G.; Guedes-Pinto, H.; Carnide, V.; Branlard, G. The high and low molecular weight glutenin subunits and ω-gliadin composition of bread and durum wheats commonly grown in Portugal. Plant Breed. 1999, 118, 297–302. [Google Scholar] [CrossRef]
- Ribeiro, M.; Rodríguez-Quijano, M.; Giraldo, P.; Pinto, L.; Vázquez, J.F.; Carrillo, J.M.; Igrejas, G. Effect of allelic variation at glutenin and puroindoline loci on bread-making quality: Favorable combinations occur in less toxic varieties of wheat for celiac patients. Eur. Food Res. Technol. 2017, 243, 743–752. [Google Scholar] [CrossRef]
- Rodriguez-Quijano, M.; Vazquez, J.; Carrillo, J.; Moita Brites, C. Allelic variation of HMW glutenin subunits in Portuguese landraces of Triticum aestivum ssp. vulgare. J. Genet. Breed. 1998, 52, 95–98. [Google Scholar]
- Brites, C.; Carrillo, J. Inheritance of gliadin and glutenin proteins in four durum wheat crosses. Cereal Res. Commun. 2000, 28, 239–246. [Google Scholar]
- Martinez, M.C.; Ruiz, M.; Carrillo, J.M. New B low Mr glutenin subunit alleles at the Glu-A3, Glu-B2 and Glu-B3 loci and their relationship with gluten strength in durum wheat. J. Cereal Sci. 2004, 40, 101–107. [Google Scholar] [CrossRef]
- Rodríguez-Quijano, M.; Lucas, R.; Ruiz, M.; Giraldo, P.; Espí, A.; Carrillo, J.M. Allelic variation and geographical patterns of prolamins in the USDA-ARS Khorasan wheat germplasm collection. Crop Sci. 2010, 50, 2383–2391. [Google Scholar] [CrossRef]
- Ribeiro, M.; Carvalho, C.; Carnide, V.; Guedes-Pinto, H.; Igrejas, G. Towards allelic diversity in the storage proteins of old and currently growing tetraploid and hexaploid wheats in Portugal. Genet. Resour. Crop Evol. 2011, 58, 1051–1073. [Google Scholar] [CrossRef]
- Aguiriano, E.; Ruiz, M.; Fité, R.; Carrillo, J.M. Analysis of genetic variability in a sample of the durum wheat (Triticum durum Desf.) Spanish collection based on gliadin markers. Genet. Resour. Crop Evol. 2006, 53, 1543–1552. [Google Scholar] [CrossRef][Green Version]
- Peña, R.; Trethowan, R.; Pfeiffer, W.; Ginkel, M.V. Quality (end-use) improvement in wheat: Compositional, genetic, and environmental factors. J. Crop Prod. 2002, 5, 1–37. [Google Scholar] [CrossRef]
- Brites, C.; Carrillo, J. Influence of high molecular weight (HMW) and low molecular weight (LMW) glutenin subunits controlled by Glu-1 and Glu-3 loci on durum wheat quality. Cereal Chem. 2001, 78, 59–63. [Google Scholar] [CrossRef]
- Martinez, M.C.; Ruiz, M.; Carrillo, J.M. Effects of different prolamin alleles on durum wheat quality properties. J. Cereal Sci. 2005, 41, 123–131. [Google Scholar] [CrossRef]
- Magallanes-López, A.M.; Ammar, K.; Morales-Dorantes, A.; González-Santoyo, H.; Crossa, J.; Guzmán, C. Grain quality traits of commercial durum wheat varieties and their relationships with drought stress and glutenins composition. J. Cereal Sci. 2017, 75, 1–9. [Google Scholar] [CrossRef]
- Nieto-Taladriz, M.T.; Rodriguez-Quijano, M.; Carrillo, J.M. Glutenin proteins as markers for durum wheat quality selection. In Proceedings of the Actes du 1er Symposium International sur la Filière Blé, Office Algérien Interprofessionnel des céréales, Algiers, Algeria, 7–9 February 2010; pp. 267–270. [Google Scholar]
- Cros, D.; Wrigley, C.; Hare, R. Prediction of durum-wheat quality from gliadin-protein composition. Aust. J. Agric. Res. 1982, 33, 429–442. [Google Scholar] [CrossRef]
- Pogna, N.; Autran, J.-C.; Mellini, F.; Lafiandra, D.; Feillet, P. Chromosome 1B-encoded gliadins and glutenin subunits in durum wheat: Genetics and relationship to gluten strength. J. Cereal Sci. 1990, 11, 15–34. [Google Scholar] [CrossRef]
- Aguiriano, E.; Ruiz, M.; Fité, R.; Carrillo, J. Effects of N fertilisation, year and prolamin alleles on gluten quality in durum wheat (Triticum turgidum L. ssp. turgidum) landraces from Spain. Span. J. Agric. Res. 2009, 7, 342–348. [Google Scholar] [CrossRef]
- Shewry, P.R.; Halford, N.G.; Lafiandra, D. Genetics of wheat gluten proteins. In Advances in Genetics; Academic Press: San Diego, CA, USA, 2003; Volume 49, pp. 111–184. [Google Scholar]
- Gianibelli, M.C.; Larroque, O.R.; MacRitchie, F.; Wrigley, C.W. Biochemical, genetic, and molecular characterization of wheat glutenin and its component subunits. Cereal Chem. 2001, 78, 635–646. [Google Scholar] [CrossRef]


| Locus | Allele | Prolamin Subunits | No. | % |
|---|---|---|---|---|
| Glu-A1 (HMW glutenins) | a | 1 | 24 | 20.7 |
| b | 2* | 27 | 23.3 | |
| c | Null | 60 | 51.7 | |
| o | V | 4 | 3.4 | |
| - | new | 1 | 0.9 | |
| Glu-B1 (HMW glutenins) | a | 7 | 2 | 1.7 |
| b | 7+8 | 13 | 11.2 | |
| e | 20x+20y | 20 | 17.2 | |
| f | 13+16 | 11 | 9.5 | |
| an | 6 | 2 | 1.7 | |
| aq | 32+33 | 8 | 6.9 | |
| bd | 20x+8 | 1 | 0.9 | |
| - | 20x | 1 | 0.9 | |
| - | 6+(8) | 58 | 50.0 | |
| Glu-A3 (LMW glutenins) | a | 6 | 47 | 40.5 |
| b | 5 | 9 | 7.8 | |
| d | 6+11 | 3 | 2.6 | |
| e | 11 | 9 | 7.8 | |
| h | Null | 35 | 30.2 | |
| q | 5+20 | 3 | 2.6 | |
| i | 8*+11 | 1 | 0.9 | |
| - | 5* | 1 | 0.9 | |
| - | 8* | 3 | 2.6 | |
| - | 5+8* | 3 | 2.6 | |
| - | 5*+20 | 1 | 0.9 | |
| - | 6+20 | 1 | 0.9 | |
| Glu-B3 (LMW glutenins) | a | 2+4+15+19 | 44 | 37.9 |
| b | 8+9+13+16 | 4 | 3.4 | |
| d | 2+4+15+17+19 | 2 | 1.7 | |
| e | 2+4+15+16+18 | 3 | 2.6 | |
| f | 2+4+15+17 | 14 | 12.0 | |
| g | 2+4+15+16 | 1 | 0.9 | |
| h | 1+3+14+18 | 18 | 15.5 | |
| i | 5+7+8+14+18 | 16 | 13.8 | |
| - | 1+3+13*+19 | 1 | 0.9 | |
| - | 1+3+13+19 | 1 | 0.9 | |
| - | 13*+18 | 1 | 0.9 | |
| - | 13*+15+19 | 3 | 2.6 | |
| - | 13+14+18 | 1 | 0.9 | |
| - | 13+19 | 4 | 3.4 | |
| - | 2+4+13+15+17 | 1 | 0.9 | |
| - | 2+4+13+16+19 | 2 | 1.7 | |
| Glu-B2 (LMW glutenins) | a | 12 | 58 | 50.0 |
| b | Null | 55 | 47.4 | |
| c | 12* | 3 | 2.6 | |
| Gli-B1 (γ-gliadins) | Null | 9 | 7.8 | |
| γ-40 | 1 | 0.9 | ||
| γ-41 | 2 | 1.7 | ||
| γ-42 | 4 | 3.4 | ||
| γ-43 | 2 | 1.7 | ||
| γ-44 | 21 | 18.1 | ||
| γ-45 | 75 | 64.6 | ||
| γ-46 | 1 | 0.9 | ||
| γ-47 | 1 | 0.9 |
| Source of Variation | Allele/Subunits | Protein (%) | SDSS (mm) | MT (s) | BDR (%) |
|---|---|---|---|---|---|
| Glu-A1 | a (1) | 14.7 ± 0.2 a | 34.7 ± 1.7 b | 55.6 ± 4.2 b | 35.3 ± 1.4 a |
| b (2*) | 14.4 ± 0.2 a | 27.3 ± 1.7 b | 45.5 ± 4.8 b | 35.1 ± 1.5 a | |
| c (null) | 14.6 ± 0.1 a | 28.6 ± 1.1 b | 57.5 ± 2.6 b | 30.2 ± 0.9 a | |
| o (V) | 13.9 ± 0.5 a | 60.4 ± 4.8 a | 99.8 ± 8.6 a | 21.7 ± 2.9 b | |
| F-value # | 2.10 | 15.3 *** | 11.0 *** | 12.1 *** | |
| Glu-B1 | b (7+8) | 14.0 ± 0.3 b | 38.8 ± 2.5 a | 63.5 ± 6.1 a | 31.9 ± 2.1 ab |
| e (20x+20y) | 14.8 ± 0.2 a | 25.8 ± 1.7 c | 54.8 ± 4.2 a | 31.2 ± 1.4 ab | |
| f (13+16) | 14.6 ± 0.3 ab | 32.1 ± 2.4 b | 62.4 ± 5.6 a | 29.1 ± 1.9 ab | |
| aq (32+33) | 14.5 ± 0.3 ab | 26.5 ± 2.4 c | 55.6 ± 6.2 a | 28.2 ± 2.1 b | |
| 6+(8) | 14.6 ± 0.1 ab | 33.5 ± 1.2 ab | 56.5 ± 2.9 a | 33.9 ± 1.0 a | |
| F-value | 2.84 * | 1.58 | 0.23 | 2.24 | |
| Glu-A3 | a (6) | 14.6 ± 0.1 abc | 34.2 ± 1.2 ab | 64.1 ± 3.0 a | 28.9 ± 1.0 b |
| b (5) | 15.5 ± 0.5 a | 27.0 ± 4.8 bcd | 58.5 ± 12.1 ab | 34.3 ± 4.1 ab | |
| d (6+11) | 15.1 ± 0.4 ab | 19.0 ± 4.8 d | 33.0 ± 12.1 b | 40.4 ± 4.1 a | |
| e (11) | 13.8 ± 0.3 c | 19.7 ± 2.5 cd | 37.3 ± 6.3 ab | 35.1 ± 2.1 ab | |
| h (null) | 14.5 ± 0.1 abc | 31.0 ± 1.3 bc | 56.4 ± 3.3 ab | 32.8 ± 1.1 ab | |
| q (5+20) | 14.3 ± 0.5 abc | 30.5 ± 4.7 bcd | 48.0 ± 12.1 ab | 36.0 ± 4.1 ab | |
| 8* | 14.3 ± 0.5 abc | 30.5 ± 4.3 bc | 64.6 ± 10.4 a | 30.6 ± 3.5 ab | |
| 5+8* | 13.9 ± 0.5 bc | 43.3 ± 4.7 a | 66.0 ± 12.1 a | 31.3 ± 4.1 ab | |
| F-value | 1.91 | 3.73 ** | 3.44 ** | 2.84 * | |
| Glu-B3 | a (2+4+15+19) | 14.5 ± 0.1 ab | 35.2 ± 1.2 ab | 64.9 ± 2.9 a | 28.8 ± 1.0 bc |
| b (8+9+13+16) | 14.3 ± 0.4 ab | 26.6 ± 3.3 b | 54.0 ± 8.6 a | 32.8 ± 2.9 abc | |
| e (2+4+15+16+18) | 14.6 ± 0.5 ab | 28.9 ± 4.8 ab | 64.5 ± 12.1 a | 24.2 ± 4.1 c | |
| f (2+4+15+17) | 14.1 ± 0.3 ab | 27.5 ± 2.4 b | 50.0 ± 5.3 a | 33.8 ± 1.8 ab | |
| h (1+3+14+18) | 15.0 ± 0.2 a | 27.3 ± 1.9 b | 53.4 ± 4.6 a | 33.9 ± 1.6 ab | |
| i (5+7+8+14+18) | 15.1 ± 0.3 a | 27.9 ± 2.4 ab | 50.2 ± 6.4 a | 36.7 ± 2.1 ab | |
| 13*+15+19 | 13.7 ± 0.5 b | 38.3 ± 4.7 a | 63.0 ± 12.1 a | 30.5 ± 4.1 abc | |
| 13+19 | 14.4 ± 0.5 ab | 36.1 ± 4.7 ab | 49.5 ± 12.1 a | 39.2 ± 4.1 a | |
| F-value | 2.17 * | 2.22 * | 1.36 | 2.22 * | |
| Glu-B2 | a (12) | 14.3 ± 0.1 a | 33.0 ± 1.2 a | 60.2 ± 2.9 a | 29.6 ± 1.0 a |
| b (null) | 14.7 ± 0.1 a | 30.8 ± 1.2 a | 55.7 ± 2.8 a | 33.7 ± 1.0 a | |
| c (12*) | 14.2 ± 0.5 a | 29.4 ± 4.2 a | 54.0 ± 9.9 a | 35.1 ± 3.3 a | |
| F-value | 2.13 | 0.31 | 0.22 | 1.54 | |
| Gli-B1 | γ-42 | 14.3 ± 0.4 a | 26.6 ± 3.3 b | 54.0 ± 8.6 a | 32.8 ± 2.9 a |
| γ-44 | 14.7 ± 0.2 a | 29.2 ± 1.6 ab | 51.6 ± 4.1 a | 34.6 ± 1.4 a | |
| γ-45 | 14.5 ± 0.1 a | 33.7 ± 1.0 a | 60.3 ± 2.4 a | 30.7 ± 0.8 a | |
| F-value | 0.11 | 0.29 | 0.18 | 0.29 | |
| Year | 2012 | 14.5 ± 0.1 a | 29.6 ± 1.1 b | 56.1 ± 2.0 | 31.9 ± 0.7 |
| 2015 | 14.5 ± 0.1 a | 35.3 ± 1.2 a | |||
| F-value | 0.11 | 7.05 ** |
© 2020 by the authors. Licensee MDPI, Basel, Switzerland. This article is an open access article distributed under the terms and conditions of the Creative Commons Attribution (CC BY) license (http://creativecommons.org/licenses/by/4.0/).
Share and Cite
Chacón, E.A.; Vázquez, F.J.; Giraldo, P.; Carrillo, J.M.; Benavente, E.; Rodríguez-Quijano, M. Allelic Variation for Prolamins in Spanish Durum Wheat Landraces and Its Relationship with Quality Traits. Agronomy 2020, 10, 136. https://doi.org/10.3390/agronomy10010136
Chacón EA, Vázquez FJ, Giraldo P, Carrillo JM, Benavente E, Rodríguez-Quijano M. Allelic Variation for Prolamins in Spanish Durum Wheat Landraces and Its Relationship with Quality Traits. Agronomy. 2020; 10(1):136. https://doi.org/10.3390/agronomy10010136
Chicago/Turabian StyleChacón, Efraín A., Francisco J. Vázquez, Patricia Giraldo, José M. Carrillo, Elena Benavente, and Marta Rodríguez-Quijano. 2020. "Allelic Variation for Prolamins in Spanish Durum Wheat Landraces and Its Relationship with Quality Traits" Agronomy 10, no. 1: 136. https://doi.org/10.3390/agronomy10010136
APA StyleChacón, E. A., Vázquez, F. J., Giraldo, P., Carrillo, J. M., Benavente, E., & Rodríguez-Quijano, M. (2020). Allelic Variation for Prolamins in Spanish Durum Wheat Landraces and Its Relationship with Quality Traits. Agronomy, 10(1), 136. https://doi.org/10.3390/agronomy10010136