Article

The Unexploited Potential of Nutrient Analysis in Potato Tissues at the Onset of Tuberization for Tuber Yield Prediction

by
Witold Grzebisz
1,*,
Karolina Frąckowiak
1,2,
Jarosław Potarzycki
1,
Jean Diatta
1 and
Witold Szczepaniak
1
1
Department of Agricultural Chemistry and Environmental Biogeochemistry, Poznan University of Life Sciences, Wojska Polskiego 28, 60-637 Poznan, Poland
2
Yara International ASA Drammensveien, 131 0277 Oslo, Norway
*
Author to whom correspondence should be addressed.
Agronomy 2020, 10(1), 103; https://doi.org/10.3390/agronomy10010103
Submission received: 20 October 2019 / Revised: 22 December 2019 / Accepted: 8 January 2020 / Published: 10 January 2020
(This article belongs to the Section Crop Breeding and Genetics)

Abstract

:
Nutrient analysis of potato leaves in early growth is not sufficient for a reliable prediction of tuber yield. This hypothesis was verified based on a field experiment conducted during 2006–2008. The experimental factors were: nitrogen (N) rates (60, 120 kg ha−1), fertilizers (Urea, Urea + inhibitor—NBPT ([N-(n-butyl) thiophosphoric triamide]), and sulfur rates (0, 50 kg ha−1). Plant material for nutrient determination (N, P, K, Mg, Ca, Fe, Mn, Zn, Cu), which included leaves, stems, and stolons + roots (R+S), was sampled at BBCH 39/40. The marketable tuber yield (MTY) was in the ranges of 43–75, 44–70, and 24–38 t ha−1, in 2006, 2007, and 2008, respectively. The MTY and contents of N, Zn, and Cu, irrespective of the potato tissue, showed the same seasonal pattern, reaching the lowest values in the dry 2008. The N content in stems was the best tuber yield predictor. A shortage of K in stems and Mg and Cu in R+S, due to the opposite effect of Ca, reduced the N content. An N:Ca ratio in stems greater than 10:1 resulted in yield decrease. A reliable indication of nutrients limiting the tuber yield at the onset of potato tuberization requires data on the nutrient status in both leaves and stems.

1. Introduction

Owing to the high content of starch in its tubers, the potato (Solanum tuberosum L.) is usually treated as a source of energy, i.e., as food for humans and fodder for animals. This is the main reason for its cultivation in all regions of the world [1,2,3]. More than 4000 cultivars are grown in 149 countries, which indicates the high plasticity of this species to contrastive environments. However, in spite of its high adaptability to harsh growth conditions, potato is very sensitive to stresses both abiotic (drought, high and low temperatures) and biotic (pathogens, insects) [4,5]. The requirement of potato for nutrients is high, both for macronutrients and micronutrients. A shortage of nutrients, concomitant with frequent drought, leads to extremely high year-to-year variability in tuber yields [3,6,7].
The number of tubers per plant and their initial rate of growth are the key attributes of the high-yielding potato [8]. Tuberization and early bulking are the most critical stages for making the first prediction of the tuber yield. During the first of these two phases, potato stolons under the influence of both environmental and internal factors undergo transformation into tubers [9,10]. During tuberization, a relatively low temperature is required, as well as light intensity and a supply of N. In contrast, the high initial growth rate of a young tuber during early bulking requires a much higher temperature, light intensity, and supply of N [11]. Grzebisz et al. [12] showed that in a well-managed potato plantation, N content reaches its maximum during the intensive phase of stem growth (BBCH 31/33), after which it decreases slightly toward the tuberization stage (BBCH 39/40). This trend of N content is a prerequisite of a high potato yield. Plants well supplied with N at the onset of tuberization are able to reach their maximum photosynthetic efficiency, covering the requirements for assimilates of both the simultaneously growing stems and tubers [13].
There are numerous diagnostic methods and models that can be applied to predict the tuber yield in the early stages of potato growth [14,15,16]. The most recent approach to an evaluation of the nutrient status of the indicative plant tissue is the ionome, which is defined as the inorganic profile of plant tissues, comprising mineral nutrients and trace elements. This concept assumes that interactions between elements of the ionome require a genetic basis for explaining plant response to changes in the growth medium [17,18]. In spite of the high potential applicability of numerous diagnostic methods, including the ionome concept, the key challenge for researchers is to define the most suitable plant tissue and an appropriate sampling time, with respect to its worth for the final yield prediction. A reliable tuber yield prognosis depends significantly on the potato development stage. Grzebisz et al. [12] showed that the yield prognosis was more credible for BBCH 40 than for BBCH 31/33. The most frequently used methods rely on the chemical analysis of a particular part of the potato plant. The classical example is the fourth leaf on the potato stem, which is collected at the onset of tuberization (BBCH 40). Based on leaf analysis, standardized ranges of nutrient contents have been developed, which are used for evaluation of the current nutritional status of a potato plant [15,19].
The assumption of most diagnostic methods relying on the fourth leaf analysis is that the mature leaves, reaching their highest photosynthetic efficiency, become the net source of assimilates for the growing tubers [11]. However, there arises a question as to the real sink/source status of the leaf picked for chemical analysis. Leaf maturity depends on N supply, and leaf size significantly decreases in response to N shortage and increases in response to its excess [13]. Another frequently diagnostic approach relies on the analysis of the all leaves on a potato plant at the onset of tuberization. The picked leaves reflect the nutritional status of a potato at BBCH 40 fairly well and allow a reliable yield prognosis to be made [12,20]. A trustworthy yield prognosis should not be limited to the content of N but should also take into account the contents of other nutrients and ratios between them [16].
Mature potato leaves are considered as a pure physiological source, although during the rosette-forming phase the produced assimilates are also used for the growth of above- and below-ground potato parts, such as stems, stolons, and roots [8]. Therefore, efficient control of the nutritional status of potato at the onset of tuberization should not be limited to the traditional diagnostic tissues, i.e., to leaves. It is also necessary to include stolons in the diagnostic program, whose rate of growth and morphology depend significantly on water and N supply [14,21,22]. As a diagnostic tissue, potato stems are the most neglected, despite the fact they are responsible for both the transport of assimilates and the storage of the assimilates and nutrients required by a growing tuber [23,24].
The objective of the study was to evaluate the predictive value of three vegetative potato organs, i.e., leaves, stems, and stolons + roots at the onset of tuberization (BBCH 39/40). Step-wise regression analysis and path analysis were used to discriminate the reliability of the tuber yield prognosis based on the best set of nutrients for a particular potato tissue.

2. Materials and Methods

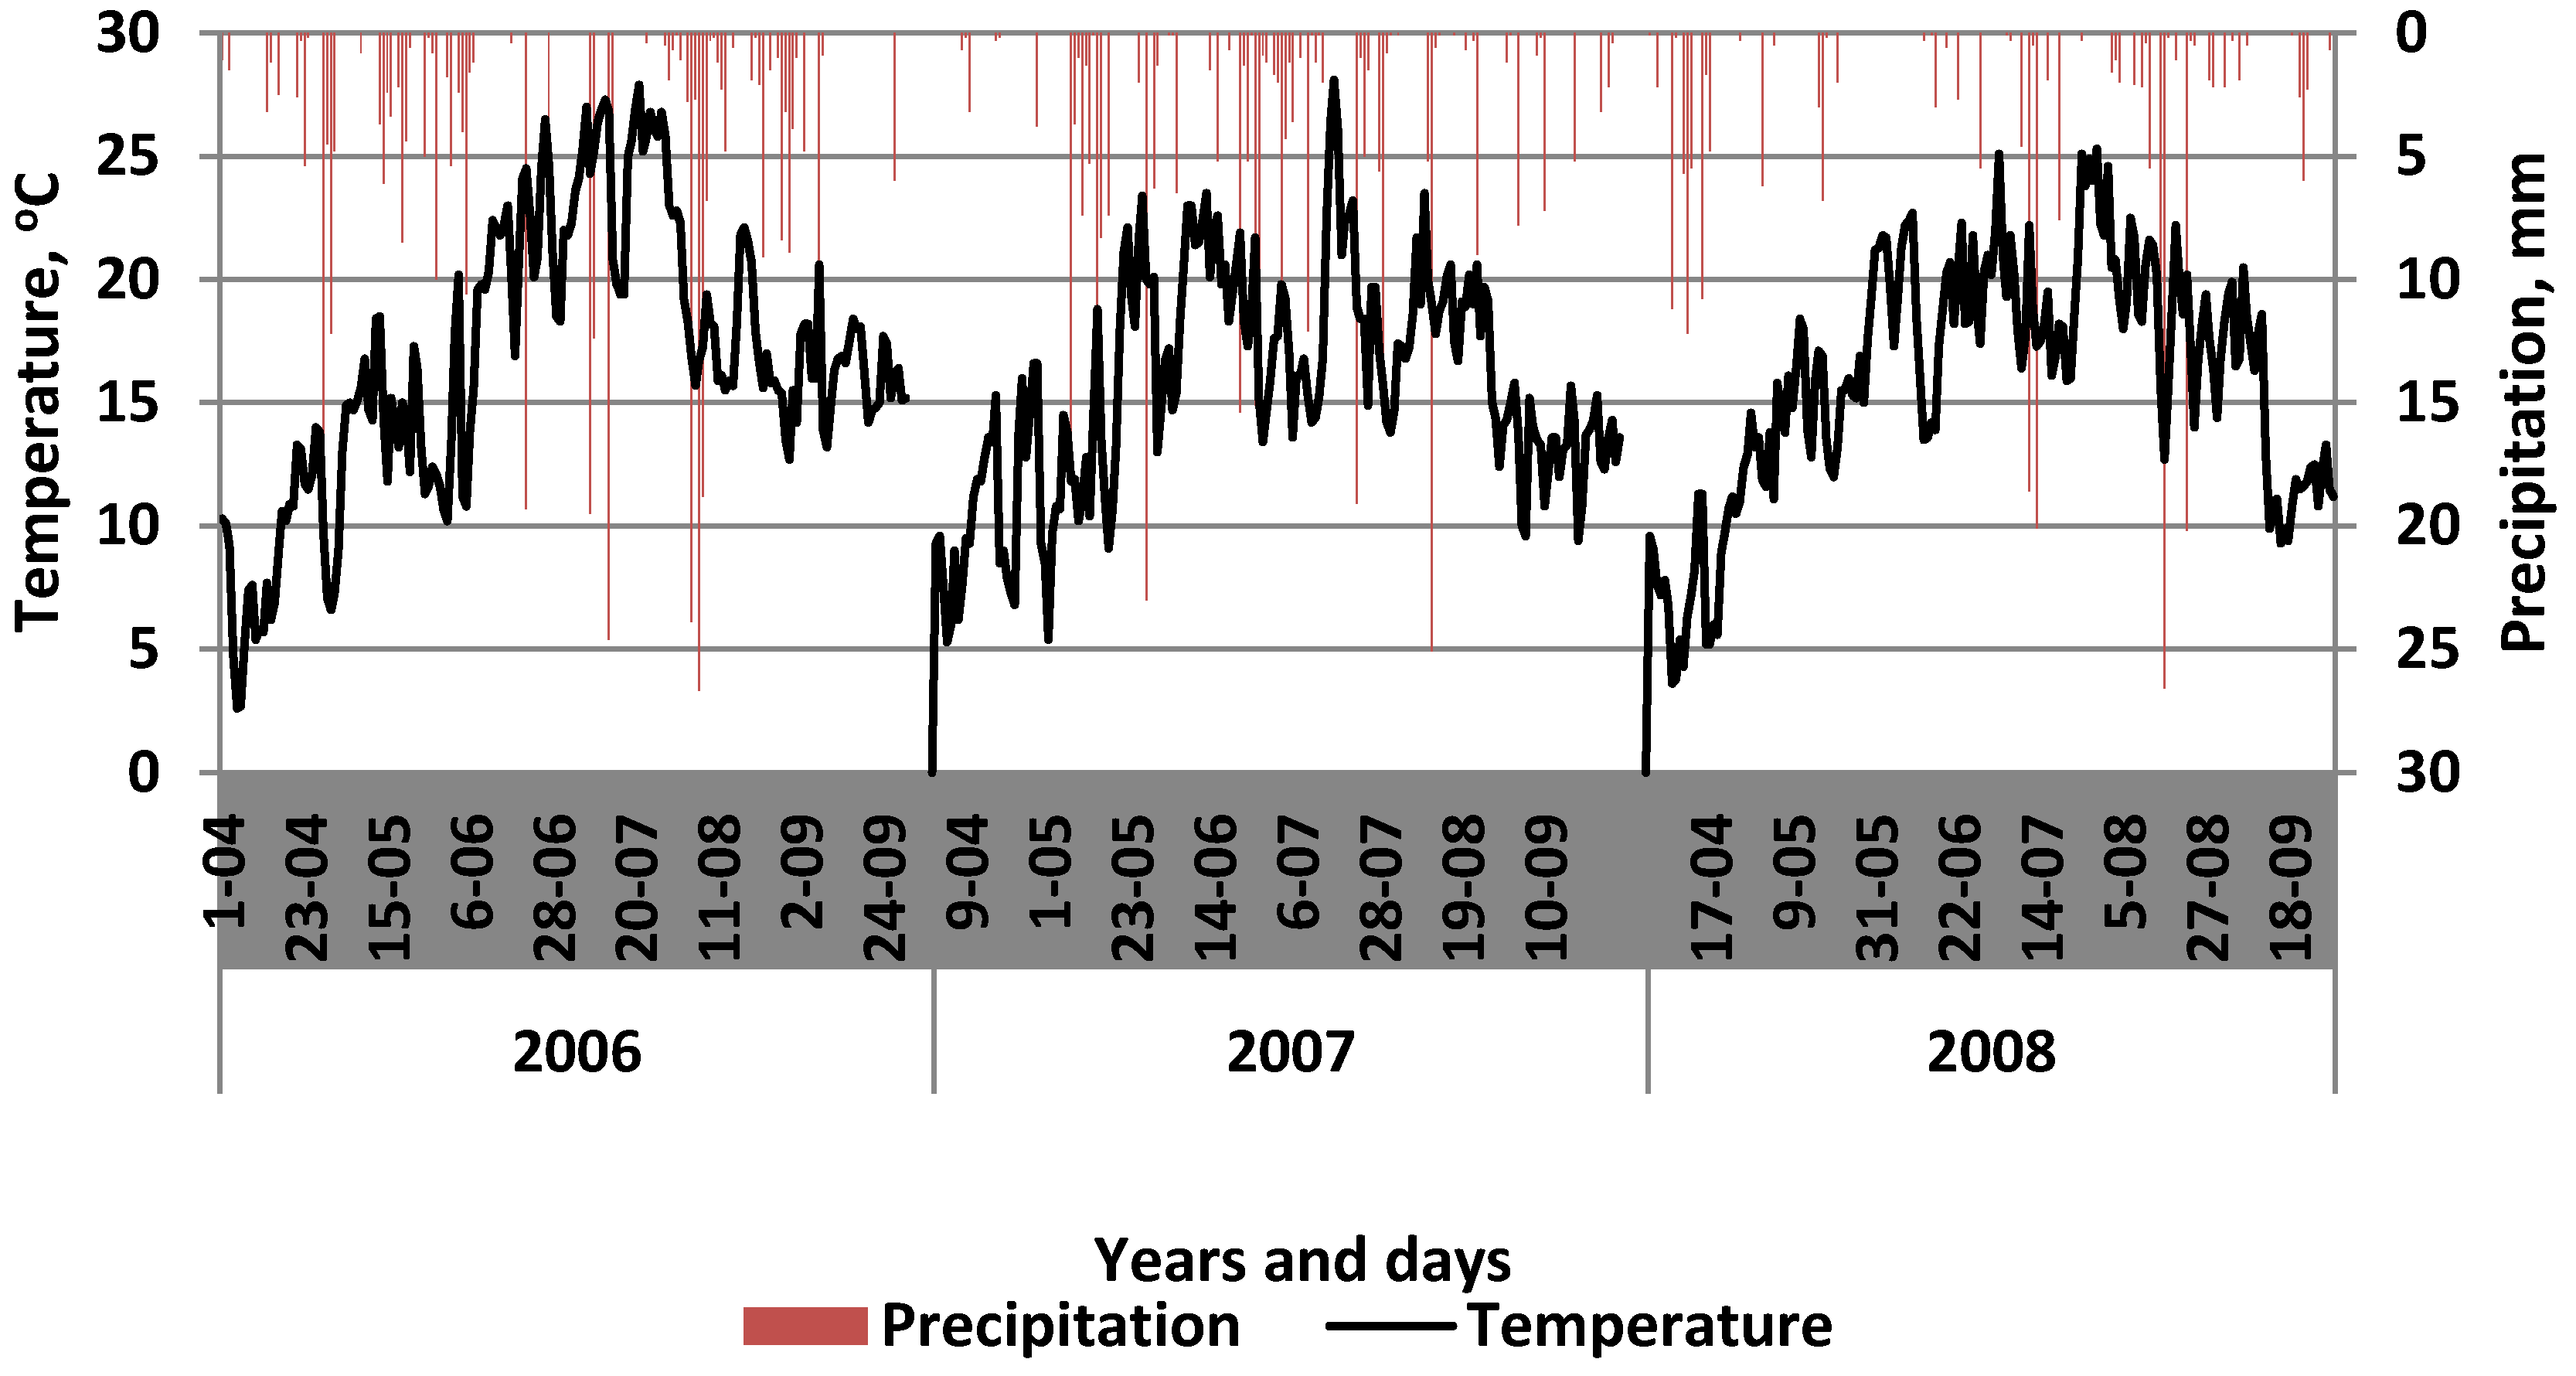
2.1. Site Description

The field experiment was established at Kicin (52°46′ N, 17°02′ E, Poland) on soil originated from a silty-clay loam, which was classified as Chernozems loamic. Soil fertility level was evaluated based on the content of organic (Corg), soil pH, and the content of available nutrients was, in general, high (Table 1).
The local climate, classified as intermediate between Atlantic and Continental, is seasonally variable, particularly during the summer (Figure 1). The total amount of precipitation for June and July, the critical months for potato growth, was 114 mm in 2006, 157 mm in 2007, and 66 mm in 2008, whereas the long-term average is 144 mm.

2.2. Experimental Design

The field experiment was arranged as a three-factorial split-block design, replicated fourfold:
(1)
N rate (acronym N): 60 and 120 kg N ha−1;
(2)
Nitrogen fertilizer type (F): Urea (U) and urea stabilized with urease inhibitor, i.e., NBPT [N-(n-butyl) thiophosphoric triamide] (Agrotain, SU);
(3)
Sulfur: without S (S0), with sulfur (S50).
Nitrogen was applied at the whole rate before potato planting. Phosphorus at a rate of 60 kg P2O5 ha−1 was applied as triple superphosphate (46% P2O5), K as potassium chloride at a rate of 120 kg K2O ha−1, and sulfur as elemental sulfur (S0) at a rate of 50 kg ha−1. All nutrients were applied together with N two weeks before potato planting. The total area of a single plot was 58.5 m2. The potato variety Zeus was planted each year in the second half of April and managed consistently with the codex of good agricultural practice. The preceding crop was spring barley. Potato tubers to the amount of 53,000 were planted in a row-space of 0.75 m, at a distance of 0.25 m within a row. The tubers were mechanically harvested 150 days after planting from an area of 19.5 m2.

2.3. Experimental Measurements and Chemical Analysis

The plant material used for dry matter determination and the measurement of nutrient concentrations was collected from three plants at BBCH 39/40 (the onset of tuberization). The above-ground potato parts were divided into leaves and stems. The below-ground plant parts, i.e., stolons and roots, treated together, were excavated from the soil to a depth of 30 cm from the top of the ridge. A running stream of tap water of pH about 7.0 was used for washing out stolons and roots on a sieve of 2 mm mesh. Then, the obtained tissues were dried at 60 °C and ground in a mill.
Nitrogen concentration in plant samples was determined using a standard macro-Kjeldahl procedure. For mineral nutrients, the harvested plant sample was dried at 65 °C and then mineralized at 550 °C. Then, the obtained ash was dissolved in 33% HNO3. Phosphorus concentration was measured by the vanadium–molybdenum method using a Specord 2XX/40 (Analytik Jena, Jena, Germany) at a wavelength of 436 nm. The concentration of K, Mg, Fe, Mn, Zn, and Cu was determined using atomic absorption spectrometry—flame type. The results are expressed on a dry matter basis.

2.4. Nutrient Standardized Range Calculation

The standardized nutrient ranges for a particular nutrient were calculated based on two regression models, i.e., linear and quadratic, as described below. For the contents of a nutrient following the linear and quadratic models, provided that it increased progressively with the MTY for the latter model, the nutrient’s borders were described as Ynmax ± 2SD (standard deviation for the third quarter of the analyzed set of data). For contents of nutrients following the quadratic models, presenting the dilution effect, the borders were decreased in accordance with the Yn trend above the MTYop. For content of nutrients that did not exhibit a statistically defined trend, the borders were defined as Ynave ± 2SD (the average nutrient content and double SD for the whole set of data).
The patterns of the relationships between the marketable tuber yield and nutrient content in potato tubers were described by two regression models:
(1)
Linear:
Yn = a × MTY + b
(2)
Quadratic:
Yn = a × MTY2 + b × MTY + c
The main estimated parameters of this function are:
MTYop = −b/2a
Ynmax = cb2/4a
where MTY is the marketable tuber yield, t ha−1; MTYop is the optimum for the nutrient content maximum-Ynmax; Yn is the nutrient content for a given MTY; Ynmax is a maximum of the particular nutrient content, g kg DM (macronutrients); mg kg DM (micronutrients); and a, b, and c are the constants for a particular regression model.

2.5. Statistical Analysis

The collected data were subjected to ANOVA, using STATISTICA® 10 (StatSoft, Krakow, Poland). The differences between the treatments were evaluated using Tukey’s test. In the second step of the diagnostic procedure, stepwise regression was applied to define an optimal set of variables for a given crop characteristic. In the computational procedure, a consecutive variable was removed from the multiple linear regressions in a step-by-step manner. The best regression model was chosen based on the highest F-value for the model and the significance of all the independent variables. Path analysis was conducted based on Konys and Wiśniewski [26].

3. Results

3.1. Tuber Yield

Marketable tuber yields (MTY) showed high variability in response to the experimental factors in consecutive years, ranging on average from 24 to 75 ha−1, but taking replication into account, from 19 to 83 t ha−1. The highest yield variability, as expected, was due to weather. In 2006 and 2007, i.e., in years with favorable growth conditions during tuberization and early bulking (Figure 1), the MTY averaged over fertilization treatments was 59 and 56 ha−1, respectively. In 2008, a year with a water shortage during these critical periods, the MTY was lower by almost 50% (Table 2). It is well documented that drought negatively impacts the development of both above- and below-ground potato stems. In consequence, the reduction of both organs, which is responsible for the production of assimilates (source) and development of the sink (tubers), leads to a significantly lower yield of tubers [11,22].

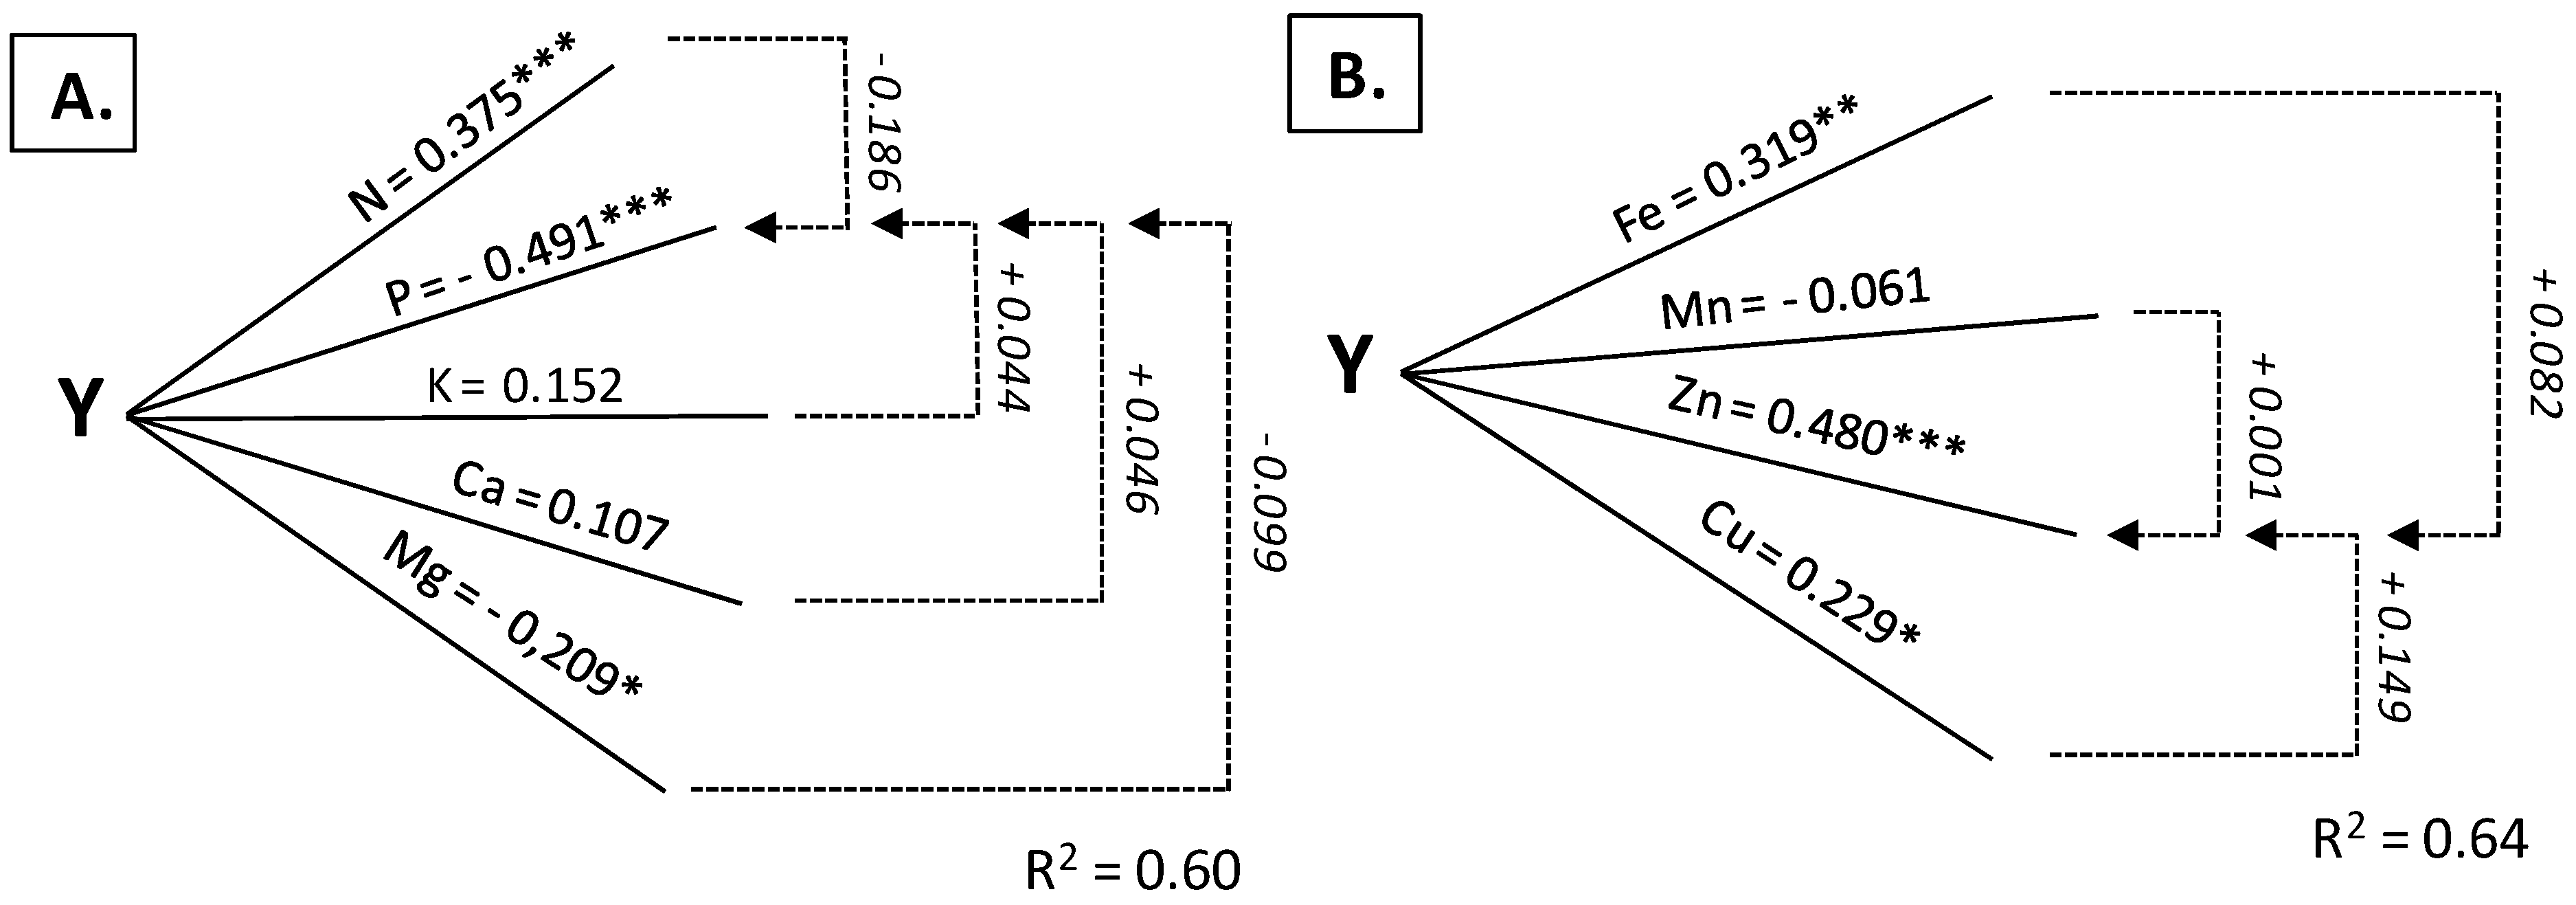
3.2. Leaves as Diagnostic Tissue

The nutrient content in leaves at the onset of tuberization was variable year to year (Table 2). Nitrogen content showed a significant decrease in the consecutive years of study, following the same trend as observed for the tuber yield. An identical trend was also found for zinc (Zn) and copper (Cu). A partially reverse trend was recorded for phosphorus (P), magnesium (Mg), and calcium (Ca). The three other nutrients, i.e., potassium (K), iron (Fe), and manganese (Mn), showed the highest values in the wet 2007, but they were significantly lower in 2006 and 2008. The effect of the N dose was recorded for five of the nine studied nutrients. An increase of nutrient content in response to the double N dose was recorded for Mg, Mn, and Cu, but Fe and Zn decreased. The stabilized urea (SU) affected only Mg and Zn, resulting in a fall in their content compared to the effect of pure urea (U). Applied elemental sulfur (S0) resulted in a significant increase in the contents of K, Mg, Fe, Zn, and Cu.
Among the studied nutrients, Mg was found to be show the highest sensitivity to the interactional effect of years and experimental factors (Table A1). However, its relationships with other nutrients were, in general, on a moderate level, as indicated by the values of correlation coefficients (r). In addition, most of these relationships, except P and K, were negative. The lowest variability in response to experimental factors and years was observed for N. The relationships between N content and other nutrients were, with the exception of Zn and Cu, mostly negative. The highest strengths of relationships between nutrient contents and MTY were recorded for P (r = −0.69) and for Zn (r = 0.71) (Table A2). The applied stepwise regression analysis corroborated the dominant effect of P on the MTY, but not Zn, as presented below:
MTY = 63.7*** − 11.8P*** + 3.9Cu***; for n = 96, R2 = 0.67
The obtained regression model clearly shows that the much higher P content in potato leaves as recorded in 2008 was not used for tuber yield development. Therefore, the excessive P and Mg contents can be treated as non-exploited production reserves. The regression equation was fully corroborated by path diagrams. The highest—although negative—direct effect on the MTY was exerted by P (Figure 2A). Its negative effect was indirectly strengthened by N and Mg (Table 3). With respect to micronutrients, the highest and at the same time positive effect on the MTY was exerted by Zn. The direct effect of Cu was significantly lower; its positive effect on the MTY resulted from the indirect impact of Zn (Figure 2B, Table 4).

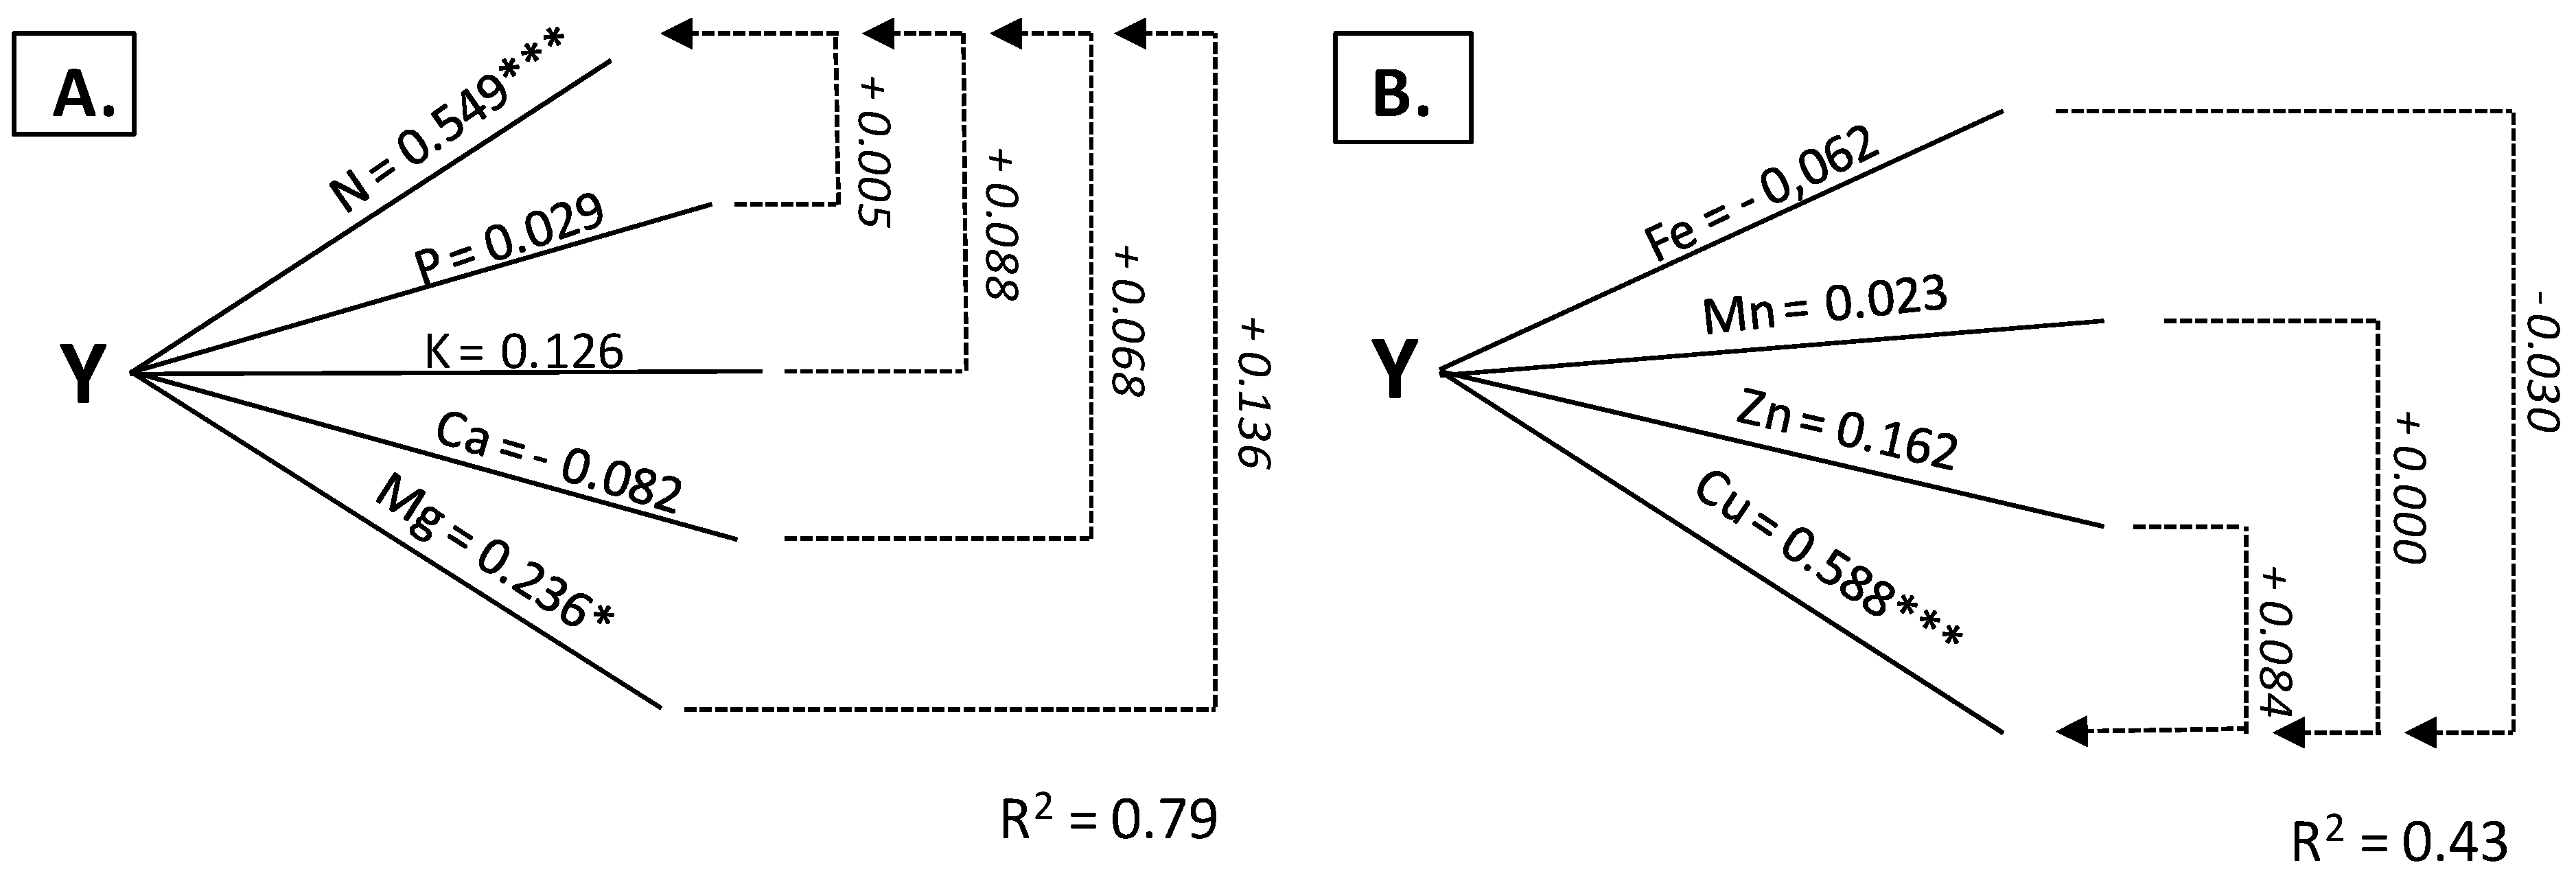
3.3. Stems as Diagnostic Tissue

The N content in potato stems declined in the consecutive years of study, following the trend obtained for the MTY (Table 5, Table A3). In 2008, N content was twofold lower as compared to that observed in 2006. The same seasonal trend was recorded for Zn and Cu. A completely reverse pattern was observed for Ca, whose content in the dry 2008 was almost twofold higher compared to 2006. The yearly pattern found for P was specific; its lowest content was recorded in the wet 2007. In other years, especially in 2006, it was much higher. The content of the remaining nutrients, such as K, Mg, Fe, and Mn, was highest in the wet 2007. The double N dose resulted in an increase in Fe content, but a simultaneous decrease in Zn content. The effects of N fertilizers and S0 on nutrient contents were much more pronounced. An increase in nutrient content in response to the application of SU was recorded for N, P, K, Ca, and Zn. The application of S0 resulted in a significantly increased content of P, K, Mg, and Mn. As shown in Table A4, the strongest and at the same time most positive impact on the MTY was recorded for N, followed by K and Mg. Both these nutrients were significantly and positively correlated with N, and also to each other. The stepwise regression analysis clearly showed that the MGY was determined by the interaction of N and K:
MGY = −12.9** + 1.34N*** + 0.57K***; for n = 96, R2 = 0.78.
It can be concluded that any increase in the contents of both nutrients in potato stems at the onset of tuberization resulted in a significant tuber yield increase. The regression model obtained clearly indicates that the shortage of both nutrients, which occurred in the dry 2008, was the key factor responsible for the significantly lower yield. The dominant impact of both nutrients on the MTY was fully corroborated by path diagrams. With respect to macronutrients, the greatest direct effect on the MTY was exerted by N (Figure 3A, Table 3). The impact of micronutrients on the MTY was much weaker, as indicated by the low value of the determination coefficient (Figure 3B). The strongest direct effect was exerted by Cu, corroborating the effect observed for leaves (Table 4).

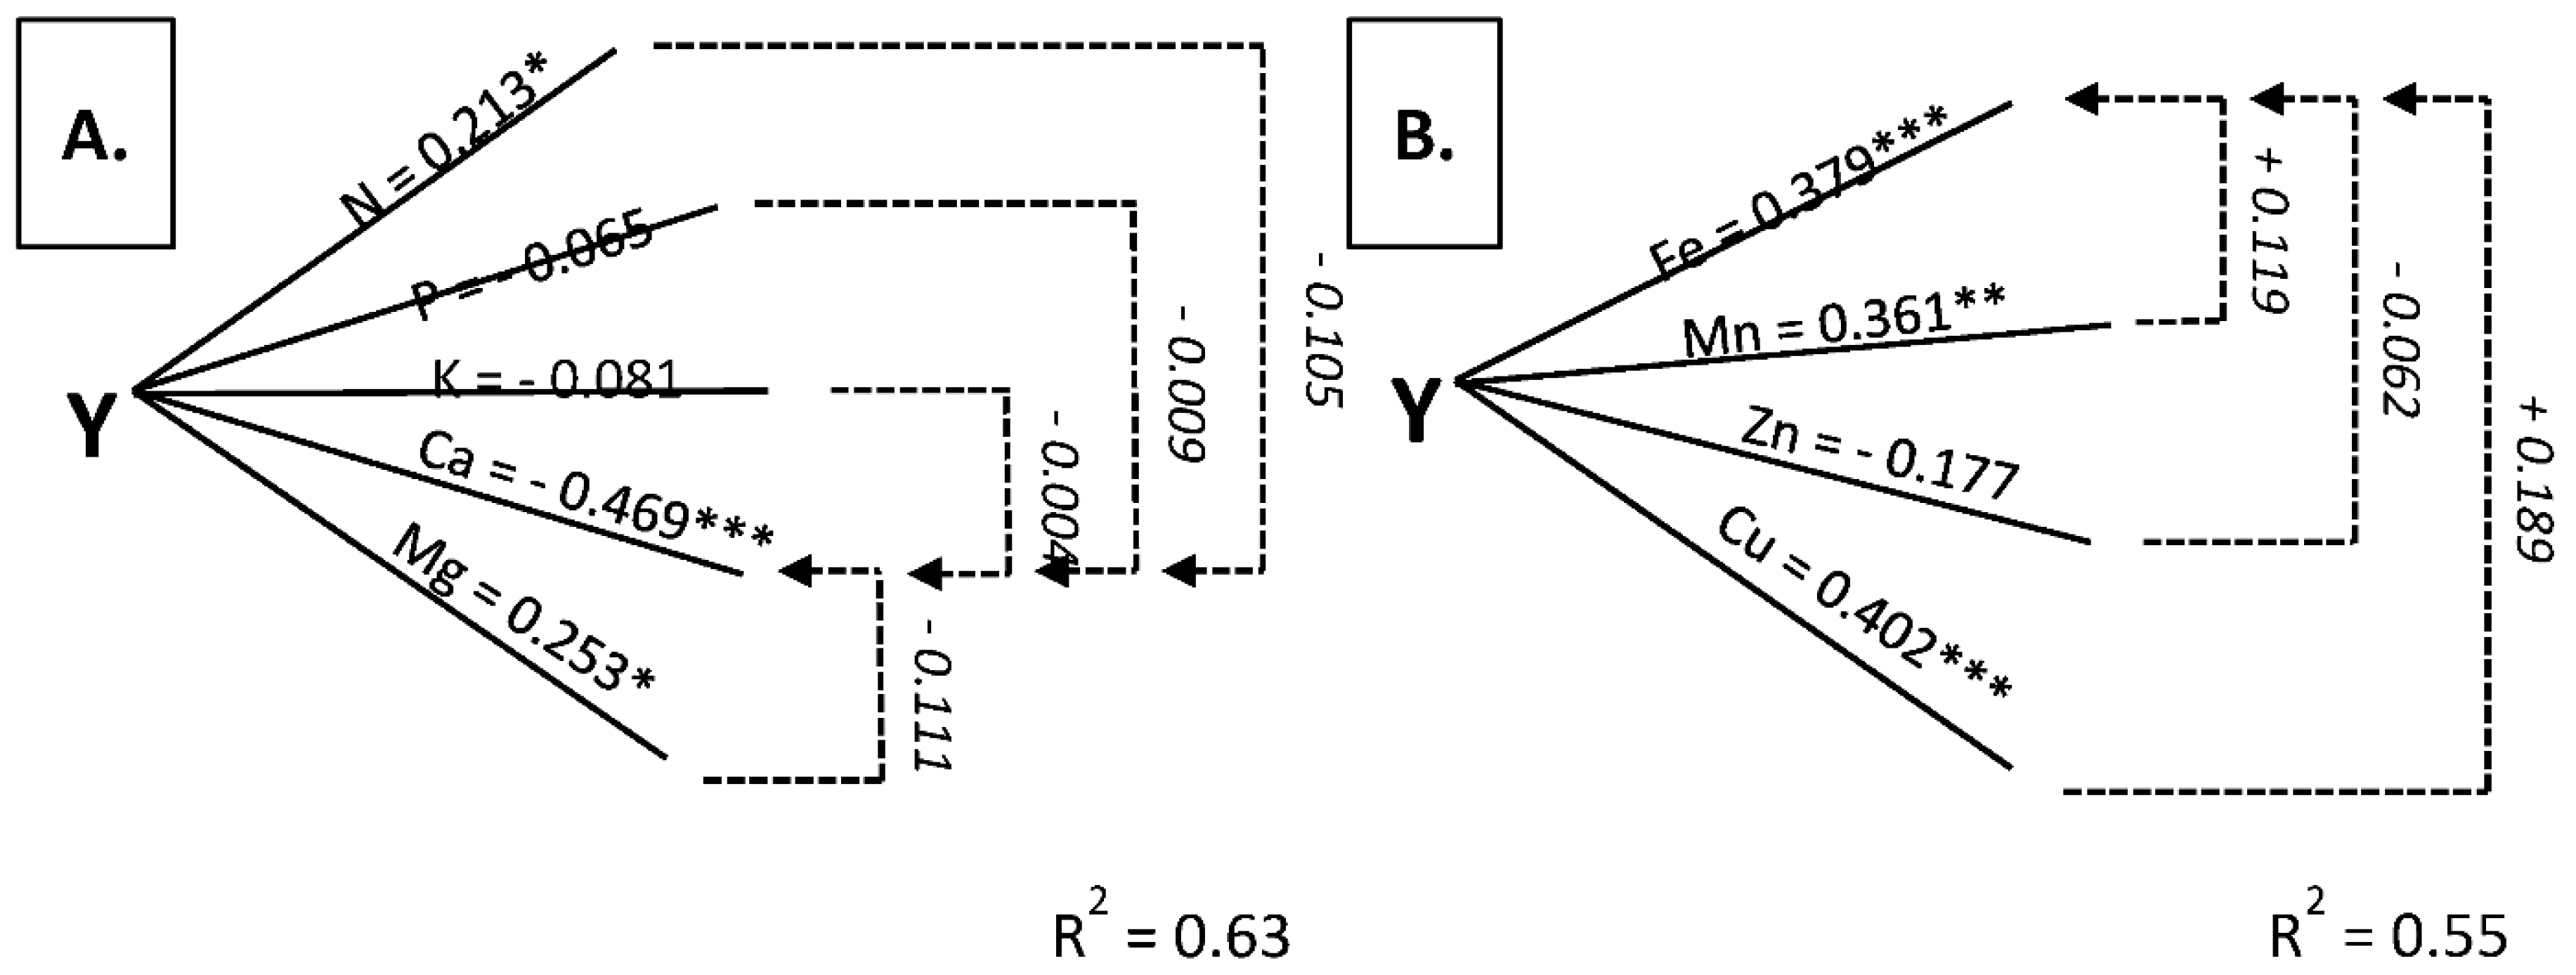
3.4. Stolons + Roots as Diagnostic Tissue

Three general patterns of nutrient content in stolons + roots can be distinguished in the consecutive years of the study (Table 6, Table A5). Nitrogen content showed the same annual trend as that observed for leaves and stems. In 2008, its content in stolons + roots constituted 60% of that recorded in 2006. An analogical trend was also observed for Fe, Zn, and Cu. A distinctly opposite seasonal pattern was found for Ca, whose content in 2008 was 80% higher than that recorded in 2006. Phosphorus and K contents were the lowest in the dry 2008 and significantly higher in the other two years. A reverse seasonal pattern was observed for Mg and Mn. The double N dose resulted in a significant increase in Mg, Ca, and Mn, but a decrease in K and Cu contents. The impact of N fertilizers was observed for Ca and Cu, which responded positively to the application of SU. Other nutrients such as P, Fe, Mn, and Zn responded negatively to this fertilizer. It was observed that the application of S0 had a positive effect on six of the nine nutrients; an increase in nutrient content was recorded for K, Mg, Ca, and Cu, but there was a decrease for N and Fe.
The highest significant—but at the same time negative—impact on the MTY was found for Ca. This nutrient showed negative relationships with N, Mg, and all micronutrients, and a positive relationship only with K (Table A6). The MTY, as a result of the stepwise regression, was significantly dependent on the content of five nutrients in stolons + roots:
Y = 33.33 + 7.05Mg** − 3.76Ca*** + 0.4Mn*** − 0.31Zn*** + 4.97Cu**
for n = 96; R2 = 0.66.
Path analysis results reveal that the highest, although negative, relationship with the MTY was for Ca, followed by Mg, whose impact was positive (Table 3). A clear direct effect was also exerted by Ca (Figure 4A). Its negative influence was strengthened by all macronutrients, especially by N and Mg. The highest correlation coefficient for the MTY was recorded for Fe, followed by Mn (Table 4). The greatest direct effect on the MTY was exerted by Cu, and a slightly lower one was recorded for Fe and Mn. The observed impact of Fe on the MTY was mostly due to the indirect effects of Cu and Mn (Figure 4B).

4. Discussion

4.1. Potato Nutritional Status—Indicatory Nutrients

The MTY showed extremely high variability, ranging from the level of 24–38 to 43–75 t ha−1, depending on the year and fertilization treatments. This variability clearly stresses the high sensitivity of potato to environmental conditions during early growth [27]. The favorable growth conditions during this study were guaranteed by the high amount of precipitation in June and July of about 150 mm (Figure 1). The 50% yield decrease in 2008 was due to a shortage of water. Its total amount in this particular year constituted about 40% of the amount of rainfall in each of the previous years. The top yields obtained under optimal weather conditions indirectly stress that the potential yield of this crop can be realized provided there is high, natural soil fertility (Table 1). Water shortage is the key factor disturbing nutrient supply to plants [28]. The impact of weather was best described by the seasonal trends in the content of three nutrients, i.e., N, Zn, and Cu. The content of each of these nutrients, irrespective of the potato tissue, decreased in the same pattern: 2006 > 2007 > 2008.
All three nutrients were significantly and positively correlated with the MTY. Therefore, they can be treated as the key yield limiting factors. Nitrogen availability was significantly disturbed by drought in 2008. It has been well documented that a decrease in the amount of water in soil leads to a drastic decrease in the N inflow into a plant, reducing tuber yields in consequence [29]. The subsequent decrease in the N content in the growth medium of potato plants significantly delays the growth of stems, in turn reducing the photosynthetic potential of potato [11]. The shortage of assimilates negatively affects the number of stolons and consequently the number of juvenile tubers [22,30]. A shortage of N during the young growth of tubers reduces their initial weight, which in turn has an adverse effect on the final tuber yield [31,32]. An early, negatively induced pattern of potato tuber growth lasts until the end of the potato growth season, resulting in a much lower yield [27].

4.2. Calcium as a Controller of Nutrient Content

In general, the Ca content in potato tissues increased in consecutive years of study. The seasonal variability pattern was weakly demonstrated for leaves, but it was strongly demonstrated for stems and stolons + roots: 2006 < 2007 < 2008.
The high Ca content in leaves, but at the same time much lower content in other potato tissues, can be explained by its transport with water through the xylem in accordance with the canopy transpiration rate [33]. The drastic decrease in the Ca content in stems with respect to leaves indirectly reflects the conditions of water transpiration, which were high in 2008 (Figure 1). Therefore, the seasonal variability in the Ca content in stems can be analyzed on the basis of the weather regime in a particular growing season. The reduction in Mg, Cu, Zn, and Fe contents in stolons + roots reflects the effect of geochemical conditions on microelement availability in soil naturally rich in calcium, as in the studied case [34]. However, the reduction in their content, with simultaneous increases in the content of Ca, indicates strong disturbance during their uptake and redistribution between plant tissues [35,36].
Special attention should be paid to the relationships between N and Ca. The strength of negative relationships between both nutrients, as reflected by the value of the correlation coefficients was potato tissue specific:
leaves (r = −0.40***) < stolons + roots (r = −0.50***) < stems (r = −0.83***).
A reverse seasonal trend of Ca was observed with respect to N. The increasing content of Ca in potato stems led to a simultaneous decrease in the N content as illustrated by the equation obtained:
N = 3.47Ca + 45.4; for n = 96, R2 = 0.69 and p ≤ 0.01.
Even more interesting is the reverse relationship, which was described by Equation (9):
Ca = 0.007N2 − 0.56N + 15.1; for n = 96, R2 = 0.73 and p ≤ 0.01.
The equation developed shows that an N content of 40 g kg−1 DW in potato stems resulted in a minimum Ca content of 3.9 g kg−1 DW. The broadest Ca:N ratio, indicating the highest Ca dilution in the stem, reached the level of 0.0975:1. As shown in Figure 5, this ratio is equal to a potato tuber yield of 66.5 t ha−1. The narrowest Ca/N ratio of 0.555 resulted in a tuber yield decrease to 29.2 t ha−1.
The low N productivity under conditions of Ca excess was due to the shortage of two groups of nutrients: macronutrients—i.e., K and Mg—and micronutrients, i.e., Fe, Zn, and Cu. The negative relationships of K and Mg contents in leaves with the MTY suggest their excess. This ostensible excess can be explained by the drastically decreased requirements for N by the juvenile tubers [32]. The real status of the K and Mg supply is best reflected by the nutritional status of stems. There was a shortage of both these nutrients due to excessively accumulated Ca (Table 5, Table A3]. It is well documented that the rate of NO3 ion uptake requires a good supply of K+ ions [37,38]. The shortage of Mg leads to a reduction in ATP synthesis, which in turn results in a lower uptake of nutrients, including N [39].
The sharp decrease of Zn and Cu in all the examined potato tissues requires an evaluation of the patterns of the Ca content in potato tissues. The effect of the negative impact of Ca on the content of Zn and Cu was low or moderate for leaves (Table A2). It increased significantly for stolons + roots (Table A6) but was strongest for stems (Table A4). The negative impact of Ca on the content of micronutrients, leading to a pronounced decrease in Cu and a minor decrease in Zn content, was notable in stolons + roots, i.e., potato organs are active in the transportation of nutrients from the soil solution to the stems and leaves [21,22].

4.3. Phosphorus–An Apparent Excess

The dominant opinion with respect to the management of P by potato assumes that its impact on the tuber number and yield is determined by the nutritional status of the canopy [40]. Based on this hypothesis, one can assume that the higher the P content in above-ground organs, the higher the expected tuber yield [41]. The P content in potato leaves in the dry 2008 was 33% higher as compared to both previous years, but at the same time, the potato yield was about 50% lower. These two contradictory trends clearly indicate that P was not the critical growth factor. The analysis of the P content in other potato tissues evidently corroborates the above conclusion.
The P content in stems and S+R was the lowest in 2007, which is a year that was favorable for high potato yield. The P content in S+R even in the dry 2008 was at the level recorded in other years with high tuber yields. The P content in R+S as recorded in 2008 indirectly indicates its good uptake from soil resources, in spite of the drought in June and July (Figure 1). It is well documented that water shortage can drastically decrease the transport of P ions toward potato roots [42]. Therefore, the recorded P excess can be treated as an indicator of the potato yield gap. The main reason for the P excess was the insufficient development of the potato sink capacity (number and size of tubers) at the onset of tuberization due to a low supply of N (32). This conclusion is supported by an analysis of the N × P relationship in leaves. As shown in Equation (6), N content exceeding 49.3 g kg−1 DW resulted in a minimum P content of 3.4 g kg−1 DW. The value obtained is slightly lower than that recorded in 2006 and 2007, i.e., in years with double tuber yields, as compared to the dry 2008.
P = 0.0027N2 − 0.266N + 9.94; for n = 96, R2 = 0.36 and p ≤ 0.01

4.4. Approximate Ranges of the Optimal Content of Nutrients in the Stems

Standardization of the nutrient content in indicatory plant tissue is a basic procedure for defining the optimum ranges for nutrient contents with respect to the yielding potential of cultivated crops [19]. In potato, foliar analysis was most commonly based on examination of the fourth leaf, which was also the case for DRIS (Diagnosis and Recommendation Integrated System) [16]. A recent study by Grzebisz et al. [12] showed that a reliable yield prognosis can also be based on the nutrient content of the whole potato foliage, measured in BBCH 33 and BBCH 40. Most of the norms used for diagnosis of the potato nutritional status were developed three or four decades ago, based on much lower tuber yields [15,16]. The simulated yield potential of currently cultivated potato varieties is extremely high, near 100 t ha−1 [43].
In the conducted study, for the examined potato tissues, the most accurate tuber yield prediction was obtained for the content of macronutrients measured in stems (Figure 3A). The prediction of optimal ranges for micronutrients based on their contents in stems was significantly weaker as compared with leaves (Figure 2B). It has been assumed in the applied standardizing procedure that the level of tuber yield determines the required nutrient content in the indicatory potato tissue. Three models of the optimum ranges were obtained for a particular nutrient. The quadratic model was dominant, allowing the optimum nutrient content range to be defined for the indicated level of the tuber yield (Table 7).
The quadratic regression model clearly shows that a tuber yield increases above the defined statistical optimum results in the phenomenon termed as the nutrient dilution effect [44]. This pattern of the relationship was observed for K, Ca, Mg, Fe, and Cu. The applied calculation procedure showed that the maximum nutrient content for Ca, Mg, and Cu was achieved for the optimum tuber yield of 80 t ha−1. For this set of nutrients, the standard range for the yield from 70 to 80 t ha−1 was defined based on the average content of a particular nutrient for the third quarter of the examined data set. The maximum content for K and Fe was much higher than the optimum range due to the dilution effect. The content of N and Zn increased progressively with the MTY increase. The standard range was also defined for the average of the third quarter of the examined data set. Two of the nine nutrients—i.e., P and Mn—did not show any significant relationship with the MTY. The standard content range was defined on the basis of the average of the whole population set. This study clearly showed that the most reliable ranges for the high-yielding potato were determined for nutrients whose content increased progressively with the tuber yield.

5. Conclusions

The broad range of marketable tuber yields (MTYs) owing to variable weather conditions modified by fertilization treatments provided a basis for potato nutritional status evaluation at the onset of potato tuberization. The MTY and contents of N, Zn, and Cu, irrespective of the potato tissue, showed the same seasonal pattern, reaching the lowest values in the dry 2008. A quite reverse trend, but only for stems and stolons + roots was recorded for Ca. The increase in Ca content and simultaneous decrease in the content of Zn, Cu in all potato tissues, except for Fe, K, and Mg also in stolons + roots indicates a disturbance during uptake and a redistribution of this set of nutrients due to an excess of accumulated Ca. The greatest Ca and N negative relationship was observed for stems. The shortage of N was due to an insufficient supply of K and Mg, as indicated by their relationships in stems, and by micronutrients, i.e., Zn and Cu, as indicated by their low content in all potato tissues, although the most pronounced decline was again recorded in stems.
The highest values of path and correlation coefficients for the relationship between the N content in stems and the MTY clearly identified the stems as the indicatory potato tissue for yield prognosis. However, a reliable tuber yield prediction should be based on the Ca:N ratio. The study showed that the reduction in the Ca:N ratio from 0.1:1 to 0.5:1 resulted in a decrease in the tuber yield by 50%. The relationships between the MTY and nutrient contents at the onset of potato plant tuberization were used to standardize their optimum ranges for the high-yielding potato. The nutrient content in stems was used as a source of data for macronutrients, and the nutrient content in leaves was used as a source of data for micronutrients. The most reliable ranges for the high-yielding potato were determined for nutrients whose content increased progressively with the tuber yield, i.e., for N, Ca, Mg, Fe, and Cu.

Author Contributions

Conceptualization, W.G. and K.F.; methodology, K.F. and W.G.; validation, J.P. and W.S.; formal analysis, W.G.; investigation, K.F. and J.P.; resources, J.D. and W.S.; data curation, W.G. and J.P.; writing—original draft preparation, W.G. and K.F.; writing—review and editing, W.G. and J.B.; visualization, W.S. and J.B.; supervision, W.G.; project administration, W.G. All authors have read and agreed to the published version of the manuscript.

Funding

This research received no external funding.

Acknowledgments

The authors would like to express their gratitude to Włodzimierz Frąckowiak and his wife Eliza for granting a permission to use the field for the research and also thank for the extensive service management of the experiment they provided.

Conflicts of Interest

The authors declare no conflict of interest.

Appendix A

Table A1. Analysis of variance for interactions of factors in potato leaves.
InteractionsMTYNPKMgCaFeMnZnCu
t ha−1g kg−1 DWmg kg−1 DW
Y × N11.9 ***2.51.71.770.0 ***7.4 **6.2 **10.6 ***7.2 **13.2 ***
Y × F8.8 ***1.62.35.0 **11.0 ***9.1 ***12.6 ***18.0 ***0.32.1
N × F36.2 ***1.40.95.9 *15.0 ***8.5 **65.5 ***0.20.00.0
Y × S2.90.82.46.5 ***14.7 ***0.610.4 ***0.12.18.0 ***
N × S1.40.41.06.1 *37.1 ***5.2 *1.61.35.6 *3.5
F × S4.3 *0.312.1 ***0.237.0 ***0.223.3 ***0.01.222.6 ***
Y × N × F 45.5 ***1.32.22.237.0 ***0.728.5 ***12.0 ***5.6 **0.1
Y × N × S 8.7 ***2.10.20.19.5 ***8.6 ***8.5 ***2.32.613.0 ***
Y × F × S 3.8 *3.8 *5.2 **0.57.6 ***12.6 ***2.83.4 *0.78.2 ***
N × F × S 2.91.414.4 ***0.05.6 *14.9 ***14.8 ***0.17.0 *34.6 ***
Y × N × F × S0.31.09.9 ***0.812.8 ***11.9 ***5.4 **0.92.86.3 **
***, **, and * significant at p < 0.001, < 0.01, and < 0.05.
Table A2. Correlation matrix of relationships between nutrients in potato leaves and MTY (n = 96).
Traits NPKMgCaFeMnZnCu
MTY 10.58 ***−0.69 ***−0.29 **−0.54 **−0.24 *0.49 ***0.050.71 ***0.62 ***
N1.00−0.50 ***−0.65 ***−0.52 **−0.40 ***0.14−0.110.82 ***0.58 ***
P 1.000.29 **0.46 *0.42 ***−0.48 ***−0.10−0.62 ***−0.29 **
K 1.000.44 **0.35 *0.150.13−0.58 **−0.22 *
Mg 1.000.21 *−0.26 *−0.08−0.54 ***−0.43 ***
Ca 1.00−0.050.02−0.41 ***−0.09
Fe 1.000.25 *0.26 *0.29 **
Mn 1.00−0.020.16
Zn 1.000.65 ***
1 Abbreviations: MTY – marketable tuber yield; ***, **, and * significant at p < 0.001, < 0.01, and < 0.05, respectively.
Table A3. Analysis of variance for interactions of factors in potato stems.
InteractionsNPKMgCaFeMnZnCu
g kg−1 DWmg kg−1 DW
Y × N1.27.7 ***0.31.352.4 ***0.29.3 ***16.3 ***6.5 **
Y × F9.3 ***7.1 ***1.92.439.0 ***10.5 ***2.061.1 ***4.7 *
N × F4.4 *4.1 *2.145.2 ***2.80.42.70.00.0
Y × S1.616.7 ***16.6 ***11.0 ***12.5 ***0.55.2 **52.9 ***4.8 *
N × S2.913.3 ***0.010.0 **0.67.3 **0.00.01.0
F × S0.31.14.2 *5.3 **0.21.18.2 **3.90.7
Y × N × F 10.3 ***4.3 *1.11.63.4 *10.9 ***5.9 **3.6 *4.7 *
Y × N × S 0.10.03.9 *3.4 *1.86.7 **6.1 **74.1 ***0.9
Y × F × S 0.818.2 ***0.02.82.21.30.117.1 ***6.1 *
N × F × S 0.00.40.10.47.1 **52.7 ***0.02.622.3 ***
Y × N × F × S1.80.32.23.8 **7.7 ***0.86.4 **48.8 ***1.3
***, **, and * significant at p < 0.001, < 0.01, and < 0.05.
Table A4. Correlation matrix of relationships between nutrients in potato stems and MTY (n = 96).
Traits NPKMgCaFeMnZnCu
MTY 1 0.85 ***0.030.77 ***0.70 ***−0.76 ***0.28 **0.010.45 **0.64 ***
N1.000.180.70 ***0.57 ***−0.83 ***0.27 **−0.100.56 ***0.75 ***
P 1.00−0.21 *−0.31 **−0.06−0.22 *−0.33 **0.27 **0.15
K 1.000.88 ***−0.70 ***0.61 ***0.200.43 ***0.63 ***
Mg 1.00−0.56 **0.56 **0.21 *0.34 **0.47 ***
Ca 1.00−0.36 ***0.02−0.49 ***−0.79 ***
Fe 1.000.29 **0.30 **0.49 ***
Mn 1.000.040.04
Zn 1.000.52 ***
1 Abbreviations: MTY – marketable tuber yield; ***, **, and * significant at p < 0.001, < 0.01, and < 0.05, respectively.
Table A5. Analysis of variance for interactions of factors in potato stems.
InteractionsNPKMgCaFeMnZnCu
g kg−1 DWmg kg−1 DW
Y × N1.27.7 ***0.31.352.4 ***0.29.3 ***16.3 ***6.5 **
Y × F9.3 ***7.1 ***1.92.439.0 ***10.5 ***2.061.1 ***4.7 *
N × F4.4 *4.1 *2.145.2 ***2.80.42.70.00.0
Y × S1.616.7 ***16.6 ***11.0 ***12.5 ***0.55.2 **52.9 ***4.8 *
N × S2.913.3 ***0.010.0 **0.67.3 **0.00.01.0
F × S0.31.14.2 *5.3 **0.21.18.2 **3.90.7
Y × N × F 10.3 ***4.3 *1.11.63.4 *10.9 ***5.9 **3.6 *4.7 *
Y × N × S 0.10.03.9 *3.4 *1.86.7 **6.1 **74.1 ***0.9
Y × F × S 0.818.2 ***0.02.82.21.30.117.1 ***6.1 *
N × F × S 0.00.40.10.47.1 **52.7 ***0.02.622.3 ***
Y × N × F × S1.80.32.23.8 **7.7 ***0.86.4 **48.8 ***1.3
***, **, * significant at p < 0.001, < 0.01, and < 0.05.
Table A6. Correlation matrix of relationships between nutrients in potato roots and stolons, and MTY (n = 96).
Traits NPKMgCaFeMnZnCu
MTY 10.45 ***−0.19−0.49 ***0.53 ***−0.74 ***0.63 ***0.45 ***0.24 *0.50 ***
N1.000.20−0.060.05−0.50 ***0.41 ***0.120.41 ***0.63 ***
P 1.000.20−0.34 **0.130.16−0.20 *0.080.11
K 1.00−0.50 ***0.62 **−0.55 ***-0.22 *−0.14−0.17
Mg 1.00−0.44 ***0.41 ***0.29 **0.32 **0.15
Ca 1.00−0.77 ***−0.39 ***−0.38 **−0.59 ***
Fe 1.000.33 **0.35 **0.47 ***
Mn 1.000.27 **0.03
Zn 1.000.47 ***
1 Abbreviations: MTY – marketable tuber yield; ***, **, and * significant at p < 0.001, < 0.01, and < 0.05, respectively.

References

  1. Andre, C.M.; Legay, S.; Iammarino, C.; Ziebel, J.; Guignard, C.; Larondelle, Y.; Hausman, J.-F.; Evers, D.; Miranda, L.M. The potato in the human diet: A complex matrix with potential health benefits. Potato Res. 2014, 57, 201–214. [Google Scholar] [CrossRef]
  2. De Jong, H. Impact of potato on society. Am. J. Potato Res. 2016, 93, 415–429. [Google Scholar] [CrossRef]
  3. FAOSTAT. Food and Agriculture Organization of the United Nations. Available online: http://faostat.fao.org/site/567/default.aspx#ancor (accessed on 25 September 2019).
  4. Birch, P.R.J.; Bryan, G.; Fenton, B.; Gilroy, E.M.; Hein, I.; Jones, J.T.; Prashar, A.; Taylor, M.A.; Torrance, L.; Toth, I.K. Crops that feed the world 8: Potato: Are the trends of increased global production sustainable? Food Secur. 2012, 4, 477–508. [Google Scholar] [CrossRef]
  5. Van Niekerk, C.; Schönfeldt, H.; Hall, N.; Pretorius, B. The role of biodiversity in food security and nutrition: A potato cultivar case study. Food Nutr. Sci. 2016, 7, 371–382. [Google Scholar] [CrossRef] [Green Version]
  6. Sardans, J.; Peňuelas, J. Potassium: A neglected nutrient in global change. Glob. Ecol. Biogeogr. 2015, 24, 262–275. [Google Scholar] [CrossRef] [Green Version]
  7. Westermann, D.T. Nutritional requirements of potatoes. Am. J. Potato Res. 2005, 82, 301–307. [Google Scholar] [CrossRef]
  8. Da Silva Oliveira, C.A. Potato crop growth as affected by nitrogen and plant density. Pesqui. Agropecu. Bras. 2000, 35, 939–950. [Google Scholar]
  9. Jackson, S.D. Multiple signaling pathway control tuber induction in potato. Plant Physiol. 1999, 119, 1–8. [Google Scholar] [CrossRef] [Green Version]
  10. O’Brien, P.J.; Allen, E.J.; Firman, D.M. A review of some studies into tuber initiation in potato (Solanum tuberosum) crops. J. Agric. Sci. Camb. 1998, 130, 251–270. [Google Scholar] [CrossRef]
  11. Katoh, A.; Ashida, H.; Kasajima, I.; Shigeoka, S.; Yokota, A. Potato yield enhancement through intensification of sink and source performances. Breed. Sci. 2015, 65, 77–85. [Google Scholar] [CrossRef] [Green Version]
  12. Grzebisz, W.; Potarzycki, J.; Biber, M. The early prognosis of tuber yield based on nitrogen status in potato. tops. Plant Soil Environ. 2018, 64, 539–545. [Google Scholar] [CrossRef] [Green Version]
  13. Vos, J.; van der Putten, P.E.L. Effect of nitrogen supply on leaf growth, leaf nitrogen economy and photosynthetic capacity in potato. Field Crop. Res. 1998, 59, 63–72. [Google Scholar] [CrossRef]
  14. Gayler, S.; Wang, E.; Priesack, E.; Schaaf, T.; Maidl, F.X. Modelling biomass growth, N-uptake and phenological development of potato crop. Geoderma 2002, 105, 367–383. [Google Scholar] [CrossRef]
  15. Walworth, J.L.; Muniz, J.E. A compendium of tissue nutrient concentrations for field-grown potatoes. Am. J. Potato Res. 1993, 70, 579–597. [Google Scholar] [CrossRef]
  16. Mackay, D.C.; Carefoot, J.M.; Entz, T. Evaluation of the DRIS procedure for assessing the nutritional status of potato (Solanum Tuberosum L.). Commun. Soil Sci. Plant Anal. 1987, 18, 1331–1353. [Google Scholar] [CrossRef]
  17. Baxter, I. Should we treat the ionome as a combination of individual elements, or should we be deriving novel combined traits? J. Exp. Bot. 2015, 66, 2127–2131. [Google Scholar] [CrossRef] [Green Version]
  18. Huang, X.-Y.; Salt, D.E. Plant ionomics: From elemental profiling to environmental adaption. Mol. Plant 2016, 9, 787–797. [Google Scholar] [CrossRef] [Green Version]
  19. Rosen, C. Tissue analysis as a nutrient management for potatoes. Minnesota. Veg. IPM Newsl. 2000, 3, 9. [Google Scholar]
  20. Musilová, L.; Lošák, T.; Hlušek, J.; Vitězová, M.; Jůzl, M.; Elzner, P.; Filipčík, R.; Jůzl, M.; Bennewitz, E. The effect of urea with urease inhibitor on the content of macronutrients in tubers and tops of potatoes (Solanum tuberosum L.). Agric. Et Silvic. Mendel. Brun. 2012, LX, 167–172. [Google Scholar]
  21. Gao, Y.; Jia, L.; Hu, B.; Alva, A.; Fan, M. Potato stolon and tuber growth influenced by nitrogen form. Plant Prod. Sci. 2014, 17, 138–143. [Google Scholar] [CrossRef] [Green Version]
  22. Lahlou, O.; Ledent, J.-F. Root mass and depth, stolons and roots formed on stolons in four cultivars of potato under water stress. Eur. J. Agron. 2005, 22, 159–173. [Google Scholar] [CrossRef]
  23. Reis, R., Jr.; Monnerat, P.H. Nutrient concentration in potato stem, petiole and leaflet in response to potassium fertilizer. Sci. Agric. 2000, 57, 251–255. [Google Scholar] [CrossRef]
  24. Alva, A.K.; Ren, H.; Moore, A.D. Water and nitrogen management effects on biomass accumulation and partitioning in two potato cultivars. Am. J. Plant Sci. 2012, 3, 164–170. [Google Scholar] [CrossRef] [Green Version]
  25. Mehlich, A. Mehlich 3 soil test extractant: A modification of Mehlich 2 extractant. Comm. Soil Sci. Plant Anal. 1984, 15, 1409–1416. [Google Scholar] [CrossRef]
  26. Konys, L.; Wiśniewski, P. Path analysis in cause and effect relationships. Rocz. AR W Pozn. 1984, CLIII, 37–54. (In Polish) [Google Scholar]
  27. Chang, D.C.; Jin, Y.K.; Nam, J.H.; Cheon, C.G.; Cho, J.H.; Kim, S.J. Early drought effect on canopy development under growth of potato cultivars with different maturities. Field Crop. Res. 2018, 215, 156–162. [Google Scholar] [CrossRef]
  28. Van Noordwijk, M.; van de Geijn, S. Root, shoot and soil parameters required for process-oriented models of crop growth limited by water or nutrients. Plant Soil 1996, 183, 1–25. [Google Scholar] [CrossRef]
  29. Li, H.; Parent, L.E.; Karam, A. Simulation modeling of soil and plant nitrogen use in potato cropping system in the humid and cool environment. Agric. Ecosyst. Environ. 2006, 115, 248–260. [Google Scholar] [CrossRef]
  30. Li, W.; Xiong, B.; Wang, S.; Deng, X.; Yin, L.; Li, H. Regulation effects of water and nitrogen on the source-sink relationship in potato during the tuber bulking stage. PLoS ONE 2016, 11, e0146877. [Google Scholar] [CrossRef] [Green Version]
  31. Khan, M.; Yin, X.; van der Putten, P.E.I.; Struik, P.C. An eco-physiological model analysis of yield differences within a set of contrasting cultivars and f1 segregating population of potato (Solanum tuberosum L.) grown under diverse environment. Ecol. Model. 2014, 290, 146–154. [Google Scholar] [CrossRef]
  32. Grzebisz, W.; Potarzycki, J. The in-season nitrogen concentration in the potato tuber as the yield driver. Agron. J. 2020, in press. [Google Scholar] [CrossRef]
  33. Busse, J.S.; Palta, J.P. Investigating the in vivo calcium transport path to developing potato tuber using 45Ca: A new concept in potato tuber calcium nutrition. Physiol. Plant. 2006, 128, 313–323. [Google Scholar] [CrossRef]
  34. Gupta, U.C.; Kening, W.; Siyuan, L. Micronutrients in soils, crops and livestock. Earth Sci. Front. 2008, 15, 110–125. [Google Scholar] [CrossRef]
  35. Fageria, V.D. Nutrient interactions in crop plants. J. Plant Nutr. 2001, 24, 1269–1290. [Google Scholar] [CrossRef]
  36. Karley, A.J.; White, P.J. Moving cationic minerals to edible tissues: Potassium, magnesium, calcium. Curr. Opin. Plant Biol. 2009, 12, 291–298. [Google Scholar] [CrossRef]
  37. Forde, B.; Lorenzo, H. The nutritional control of root development. Plant Soil 2001, 232, 51–68. [Google Scholar] [CrossRef]
  38. Marschner, H.; Kirkby, E.A.; Cakmak, I. Effect of mineral nutrition status on shoot-root partitioning of photoassimilates and cycling of mineral nutrients. J. Exp. Bot. 1996, 47, 1255–1263. [Google Scholar] [CrossRef]
  39. Maathuis, F.J.M. Physiological functions of mineral macronutrients. Curr. Opin. Plant Biol. 2009, 12, 250–258. [Google Scholar] [CrossRef]
  40. White, P.J.; Bradshaw, J.E.; Brown, L.K.; Finlay, M.; Dale, B.; Dupuy, L.X.; George, T.S.; Hammond, J.P.; Subramanian, N.K.; Thompson, J.A.; et al. Juvenile root vigour improves phosphorus use efficiency of potato. Plant Soil 2018, 432, 45–63. [Google Scholar] [CrossRef]
  41. Rosen, C.J.; Birman, P.M. Potato yield and tuber set as affected by phosphorus fertilization. Am. J. Potato Res. 2008, 85, 110–120. [Google Scholar] [CrossRef]
  42. Fixen, P.E.; Bruulsema, T.W. Potato management challenges created by phosphorus chemistry and plant roots. Am. J. Potato Res. 2014, 91, 121–131. [Google Scholar] [CrossRef]
  43. Haverkort, A.J.; Franke, A.C.; Steyn, J.M.; Pronk, A.A.; Caldiz, D.O.; Kooman, P.L. A robust potato model: LINTUL-POTATO-DSS. Potato Res. 2015, 58, 313–327. [Google Scholar] [CrossRef] [Green Version]
  44. Jarrel, W.M.; Beverly, R.B. The dilution effect in plant nutrition studies. Adv. Agron. 1981, 34, 197–224. [Google Scholar] [CrossRef]
Figure 1. Daily mean air temperature and total precipitation at the Kicin Synoptic Station.
Agronomy 10 00103 g001
Figure 2. Path diagram of the impact of macronutrients (A) and micronutrients (B) contents in potato leaves at the onset of tuberization on the marketable tuber yield. ***, **, * significant at p < 0.001; < 0.01; < 0.05, respectively.
Agronomy 10 00103 g002
Figure 3. Path diagram of the impact of macronutrients (A) and micronutrients (B) contents in potato stems at the onset of tuberization on the marketable tuber yield. ***, * significant at p < 0.001; <0.05, respectively.
Agronomy 10 00103 g003
Figure 4. Path diagram of the impact of macronutrients (A) and micronutrients (B) contents in potato stolons + roots at the onset of tuberization on the marketable tuber yield. ***, **, * significant at p < 0.001; < 0.01; < 0.05, respectively.
Agronomy 10 00103 g004
Figure 5. The MTY as a function of Ca:N ratio in potato stems.
Agronomy 10 00103 g005
Table 1. Soil fertility indicators before the experiment setup.
Year Layer
cm
Corg 1pH 2K 3Ca 3Mg 3P 3Nmin 4
MeanSD 5MeanSDMeanSDMeanSDMeanSDMeanSDMeanSD
g kg−1 kg ha−1mg kg−1
20060–30330.96.60.525311716051371171430571336
30–60150.47.60.288261105725851919971275
60–9080.27.70.155202436356813781328
20070–30270.17.00.116013167861910639267284110
30–60180.37.20.41808212599669144277584211
60–9090.47.20.28132165685418221905117
20080–30550.47.00.12254721906251394134435379
30–60460.37.20.1149142274838816625228694212
60–90440.97.30.27450222065513410168374311
1 loss–on-ignition (LOI); 2 1.0 M KCl; 3 Mehlich 3 [25]; 4 0.01M CaCl2 (1:5 soil/solution ratio); 5 SD: standard deviation.
Table 2. Nutrient content in potato leaves at the onset of tuberization (BBCH 39/40). MTY: Marketable tuber yields.
Factor Level of FactorMTYNPKMgCaFeMnZnCu
t ha−1g kg−1 DWmg kg−1 DW
Year (Y)200659.3 c50.2 c3.5 a24.4 a1.3 a13.1 a314.3 b47.6 a64.0 c9.6 c
200755.8 b36.6 b3.6 a30.1 b1.5 b15.7 b424.3 c51.6 b44.6 b8.4 c
200831.3 a29.7 a4.8 b30.3 b1.7 b15.6 b234.0 a46.9 a29.3 a6.5 a
Nitrogen (N), kg ha−16048.738.73.927.81.4 a15.1336.9 b47.1 a47.1 b8.0 a
12048.939.14.028.71.5 b14.5311.5 a50.3 b44.8 a8.3 b
N Fertilizer (F)U45.6 a38.54.028.21.5 b14.6317.748.546.8 b8.1
SU52.0 b39.24.028.31.4 a14.9330.748.945.1 a8.2
Sulfur Rate (S) kg ha−1045.4 a39.63.927.3 a1.4 a14.9313.0 a47.845.1 a7.9 a
5052.3 b38.14.029.2 a1.5 b14.6335.4 b49.646.8 b8.4 b
Source of Variation
Year (Y)467.8 ***173.1 ***105.9 ***63.1 ***176.2 ***29.0 ***184.6 ***6.4 **648.9 ***115.1 ***
Nitrogen Rate (N)0.10.22.83.031.1 ***2.79.7 ***7.8 **8.9 **5.0 *
Nitrogen Fertilizer (F)51.7 ***0.60.00.07.8 **1.02.60.24.9 *1.1
Sulfur (S)59.8 ***2.70.914.6 ***132.8 ***0.87.6 **2.54.9 *10.3 ***
***, **, * significant at p < 0.001; < 0.01; < 0.05, respectively; a the same letter indicates a lack of significant differences within the treatment.
Table 3. Correlation and path coefficients for relationships between macronutrient content and tuber yield. (n = 96).
TraitsLeavesStemsStolons + Roots
Correlation Path Correlation Path Correlation Path
Nitrogen0.584 ***0.375 ***0.846 ***0.549 ***0.0448 ***0.213 *
Phosphorus−0.686 ***−0.491 ***0.0390.029−0.187−0.065
Potassium−0.286 **0.1520.769 ***0.126−0.492 ***−0.081
Magnesium−0.545 ***−0.209 *0.700 ***0.236 *0.531 ***0.253 *
Calcium−0.246 ***0.107−0.761 ***−0.082−0.738 ***−0.469 ***
***, **, * significant at p < 0.001; < 0.01; <0.05, respectively.
Table 4. Correlation and path coefficients for relationships between micronutrient content and tuber yield (n = 96).
TraitsLeavesStemsStolons + Roots
Correlation Path CorrelationPathCorrelationPath
Iron0.494 ***0.319 **0.281 **−0.0620.625 ***0.379 ***
Manganese0.046−0.0610.0140.0230.446 ***0.361 **
Zinc0.712 ***0.480 ***0.450 ***0.1620.2418−0.177
Copper0.624 ***0.229 *0.642 ***0.588 ***0.303 **0.402 ***
***, **, * significant at p < 0.001; < 0.01; <0.05, respectively.
Table 5. Nutrient content in the potato stems at the onset of tuberization (BBCH 39/40).
FactorLevel of FactorNPKMgCaFeMnZnCu
g kg−1 DWmg kg−1 DW
Year (Y)200632.6 c2.8 c50.2 b2.1 b4.3 a82.7 b22.5 a62.3 c6.0 a
200726.8 b1.3 a56.3 c2.7 c5.1 b94.3 c28.3 b48.8 b5.2 a
200817.3 a2.2 b35.6 a1.3 a7.8 c72.6 a24.4 a37.9 a3.7 a
Nitrogen (N), kg ha−16025.62.147.32.05.6 a80.7 a25.151.1 b4.9
12025.62.147.52.15.8b85.7 b25.148.3 a5.1
N Fertilizer (F)U25.0 a2.0 a46.82.05.6 a82.225.748.3 a5.0
SU26.1 b2.2 b48.02.05.8 b84.224.551.1 b4.9
Sulfur Rate (S) kg ha−1025.11.9 a45.7 a1.9 a5.5 a83.024.0 a49.54.9
5026.02.3 b49.1 b2.1 b5.9 b83.426.2 b49.95.0
Source of Variation
Year (Y)337.7 ***168.8 ***592.5 ***260.5 ***929.0 ***78.1 ***20.1 ***195.0 ***171.2 ***
Nitrogen Rate (N)0.00.00.22.94.5 *12.5 ***0.07.4 **3.3
N Fertilizer (F)4.7 *6.4 *5.4 ***0.311.3 **2.12.57.6 **0.2
Sulfure Rate (S)3.542.8 ***45.2 ***14.7 ***26.8 ***0.18.3 **0.20.1
***, **, * significant at p < 0.001; < 0.01; < 0.05, respectively; the same letter indicates a lack of significant differences within the treatment.
Table 6. Nutrient content in potato stolons and roots at the onset of tuberization (BBCH 39/40).
FactorLevel of FactorNPKMgCaFeMnZnCu
g kg−1DWmg kg−1 DW
Year (Y)200625.4 c3.2 b15.7 b1.8 b4.3 a457.2 c38.5 b53.2 c5.7 c
200717.6 b2.5 a14.9 a2.7 c5.1 b404.3 b40.5 b50.4 b4.5 b
200815.5 a3.1 b17.4 c1.3 a7.7 c305.2 a31.1 a38.4 a3.7 a
Nitrogen (N), kg ha−16019.92.916.4 b1.8 a5.6 a374.5 a34.9 a48.14.8 b
12019.13.015.6 a2.0 b5.8 b403.2 b38.5 b46.64.4 a
N Fertilizer (F)U19.03.1 b16.21.95.6 a400.7 b38.1 b52.7 b4.6 a
SU20.02.8 a15.91.95.8 b377.1 a35.3 a42.0 a4.7 b
Sulfur Rate (S) kg ha−1020.2 b2.915.8 a1.9 a5.5 a402.2 b36.047.04.5 a
5018.8 a3.016.3 b2.0 b5.9 b375.6 a37.447.74.8 b
Source of Variation
Year (Y)101.9 ***32.8 ***79.0 ***186.3 ***593.7 ***207.2 ***46.6 ***135.3 ***238.9 ***
Nitrogen Rate (N)1.50.521.6 ***10.6 **5.0 *21.5 ***18.1 ***3.637.0 ***
N Fertilizer (F)2.716.2 ***2.40.18.0 **14.4 ***10.9 ***188.3 ***4.2 *
Sulfur Rate (S)5.8 *2.97.9 **5.4 *23.3 ***18.4 ***2.90.921.7 ***
***, **, * significant at p < 0.001; < 0.01; < 0.05, respectively; the same letter indicates a lack of significant differences within the treatment.
Table 7. Approximate nutrient standards for high-yielding potato based on nutrient content in stems at BBCH 39/40. (n = 96).
Nutrient EquationOptimum Yield
MTYop, t ha−1
Maximum Nutrient Content for MTYopApproximate Nutrient Range for Y → 70–80 t ha−1
Stems
Nitrogen (N), g kg−1N = 0.38MTY + 7.1, for R2 = 0.71, p ≤ 0.01--28–38
Phosphorus (P), g kg−1---1.3–2.9
Potassium (K), g kg−1K = −0.015MTY2 + 1.86MTY – 6.36
for R2 = 0.71, p ≤ 0.01
6251.350–60 *
Calcium (Ca), g kg−1Ca = −0.0014MTY2 + 0.222MTY + 12.8
for R2 = 0.63, p ≤ 0.01
79.34.03.0–5.0 **
Magnesium (Mg), g kg−1Mg = −0.0005MTY2 + 0.082MTY − 0.64
for R2 = 0.52, p ≤ 0.01
82.02.71.3–4.1 **
Leaves
Iron (Fe), mg kg−1Fe = −0.118MTY2 + 15.18MTY + 107.6
for p = 0.31, p ≤ 0.05
64.3375300–400 *
Manganese (Mn), mg kg−1---33–65
Zinc (Zn), mg kg−1Zn = 0.69MTY + 12.2, for R2 = 0.51, p ≤ 0.01--31–65
Copper (Cu), mg kg−1 Cu = −0.0011MTY2 + 0.186MTY + 2.03
for R2 = 0.41, p ≤ 0.05
84.59.97.5–12.3 **
* assessed from the model; ** Ca, Mg, Cumax ±2SD±.

