
Investigation on the Influence of Chain Extenders on the Performance of One-Component Moisture-Curable Polyurethane Adhesives


Abstract
:1. Introduction
2. Experimental
2.1. Materials
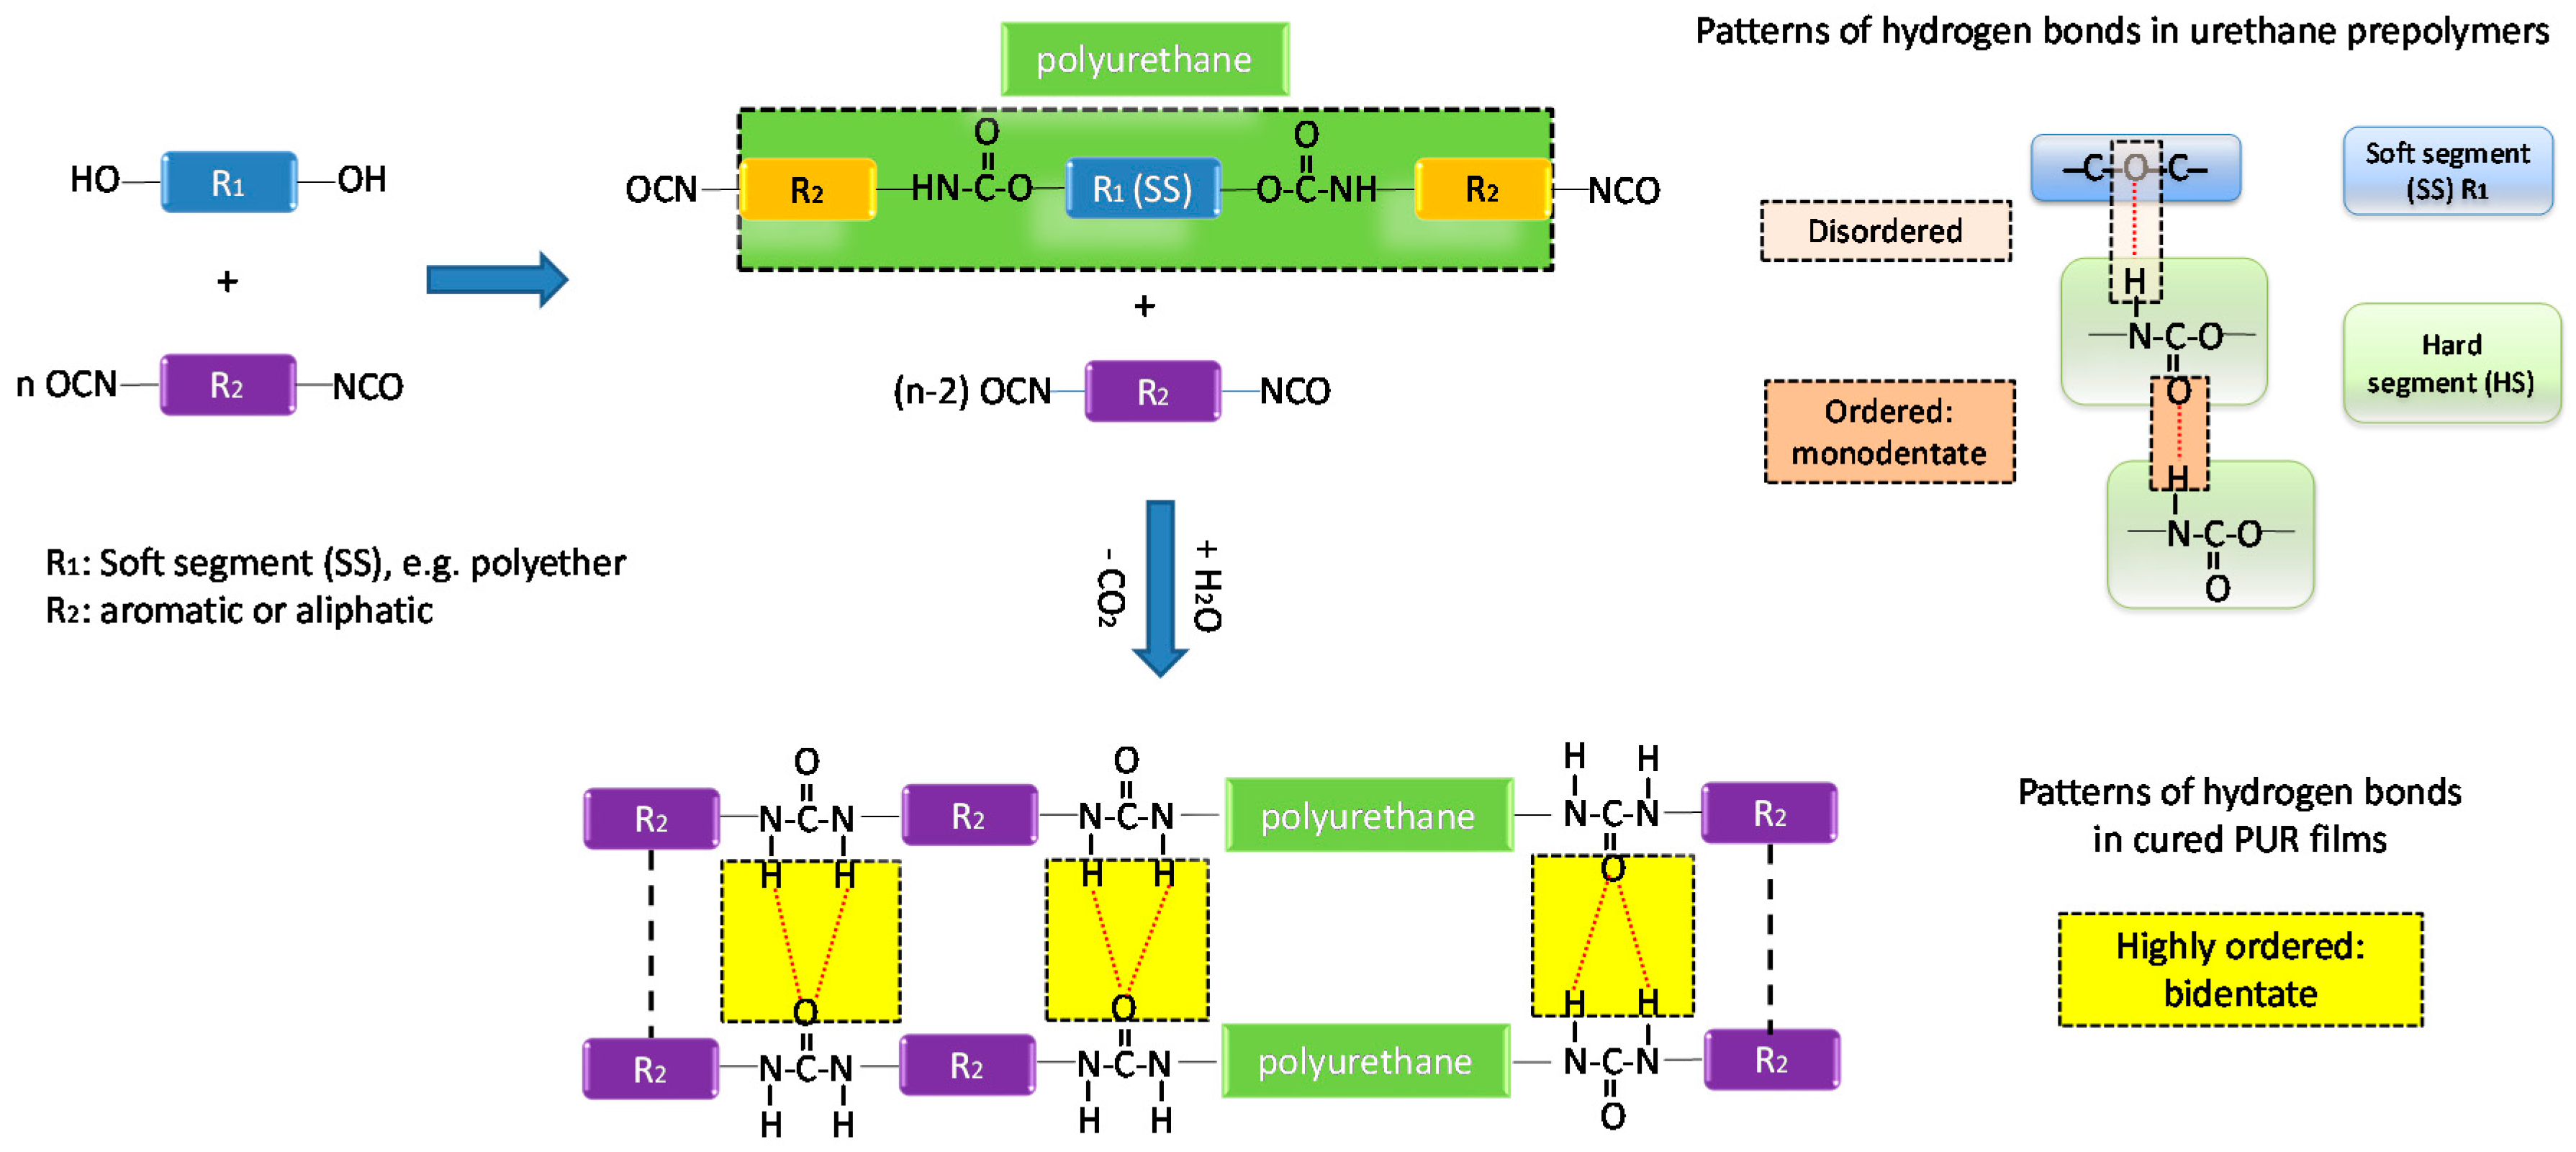
2.2. The Synthesis of Urethane Prepolymers
2.2.1. One Shot Process
2.2.2. Two-Stage Process
2.3. Characterization Methods
3. Results and Discussion
3.1. Characterization and Properties of Polyurethane Prepolymers
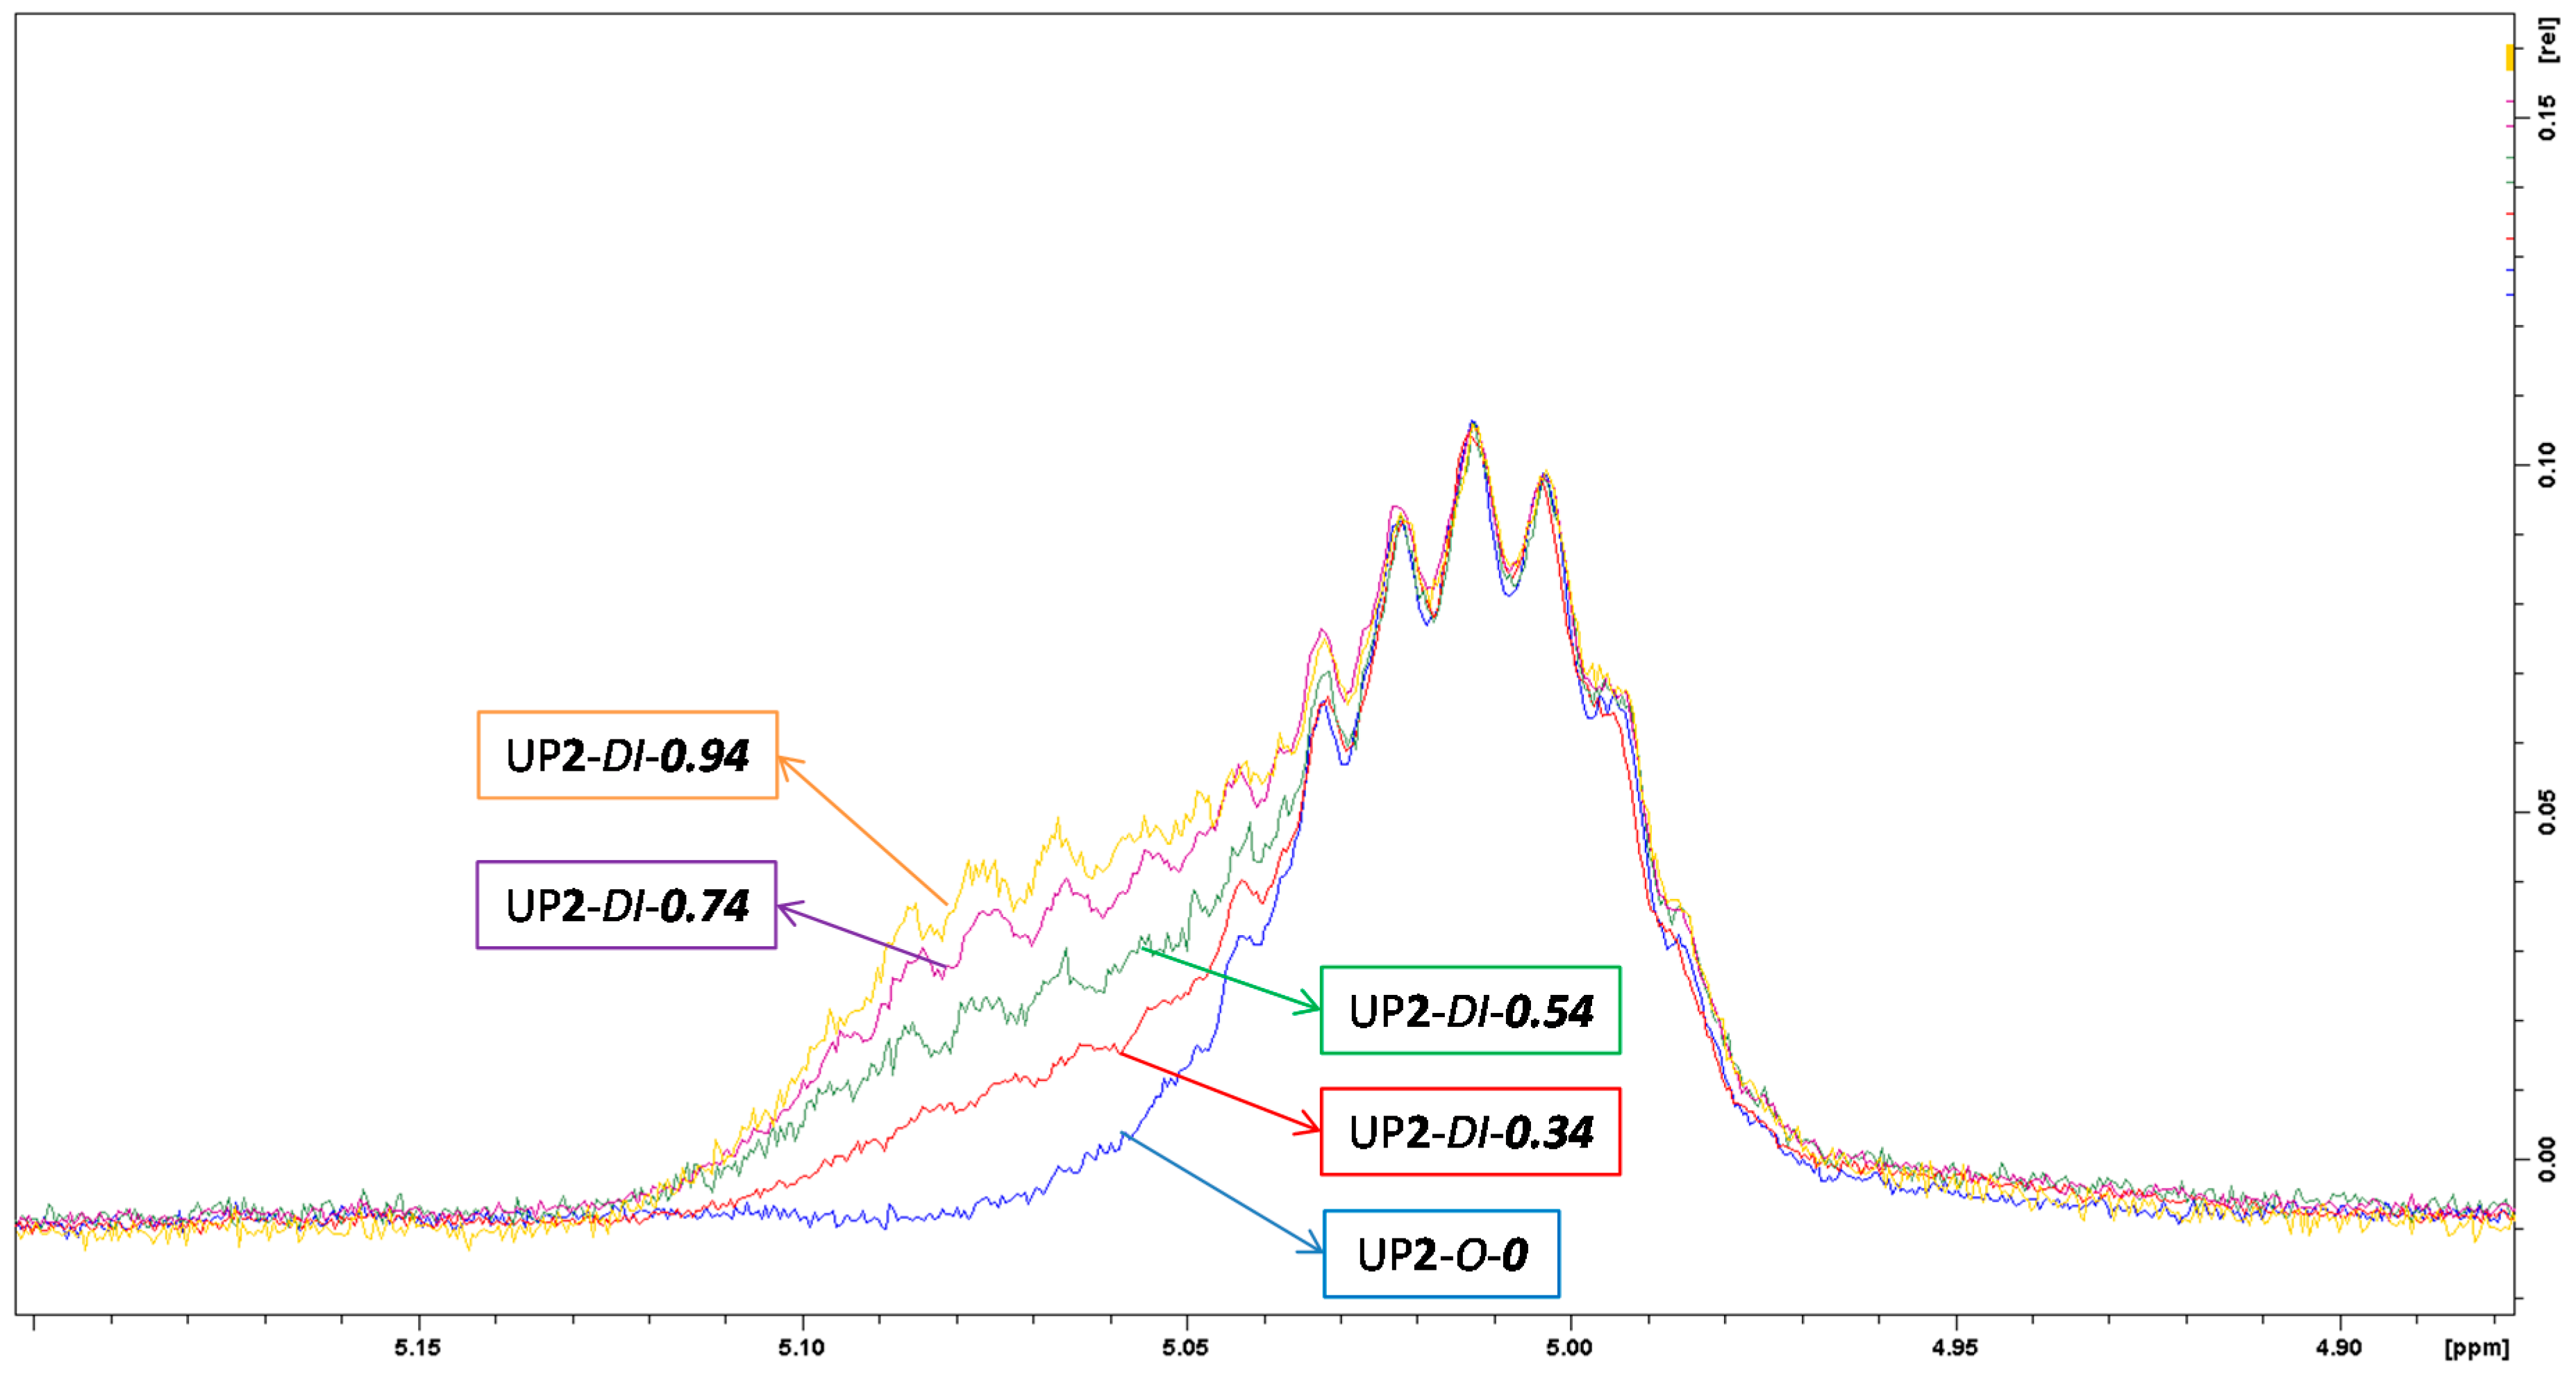
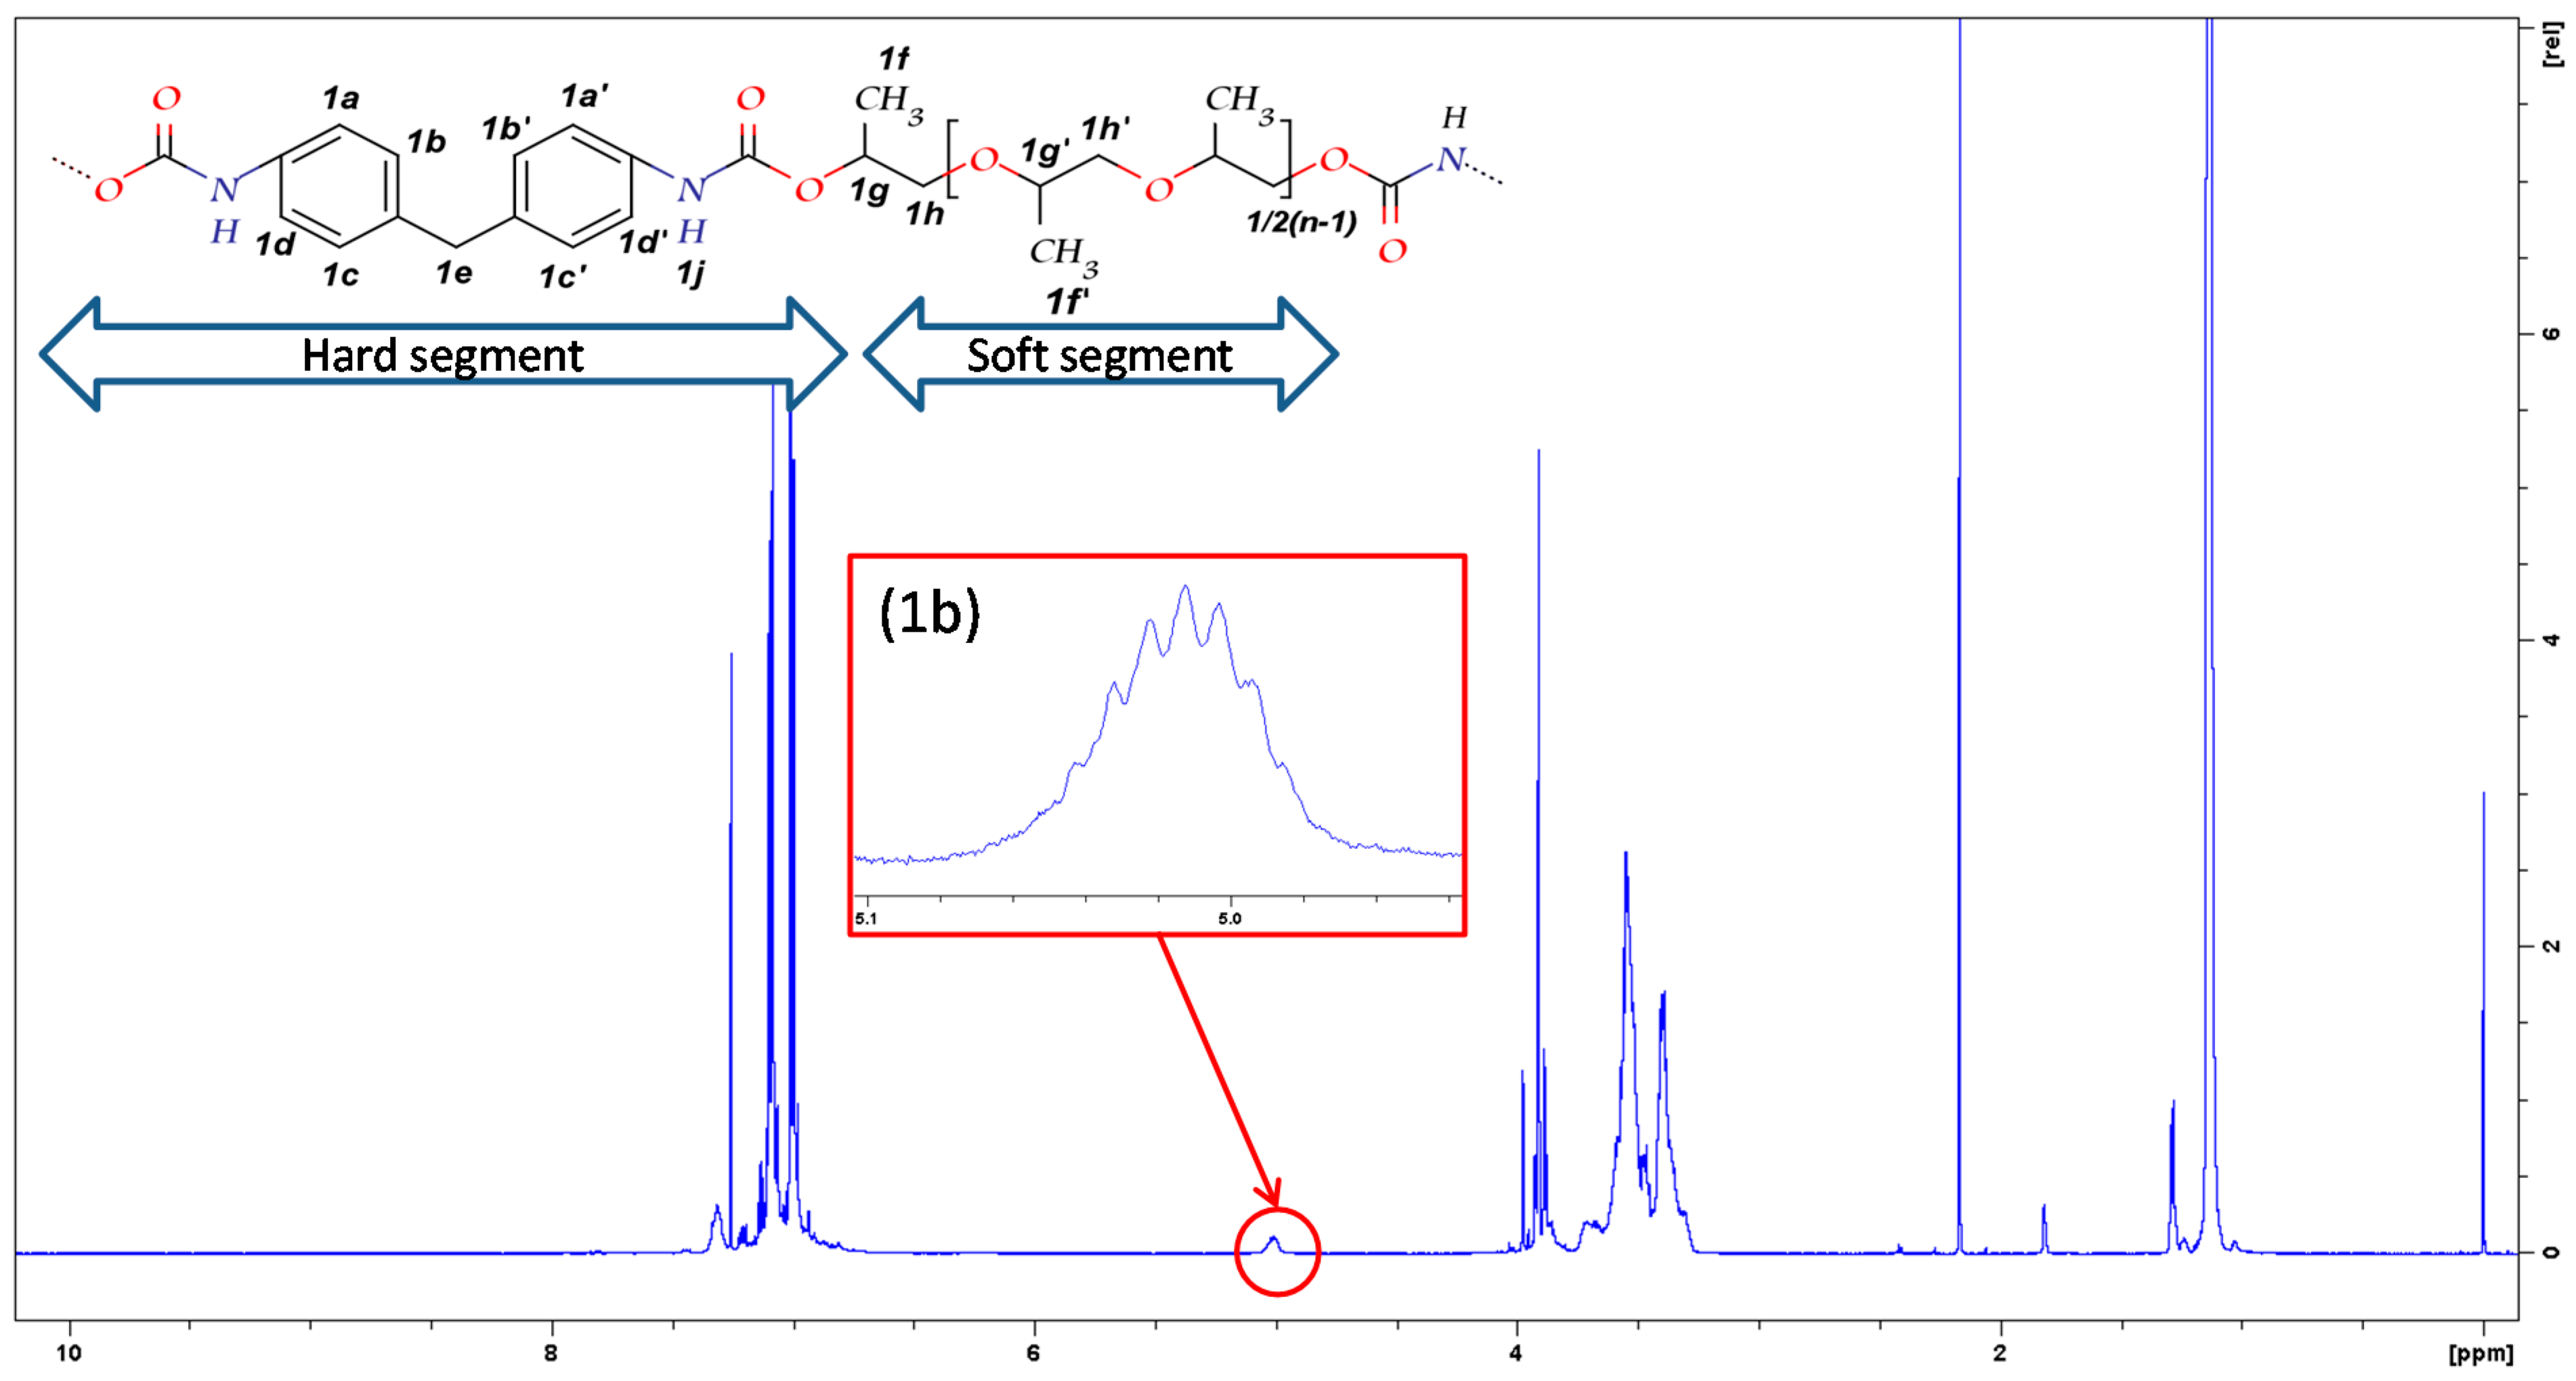
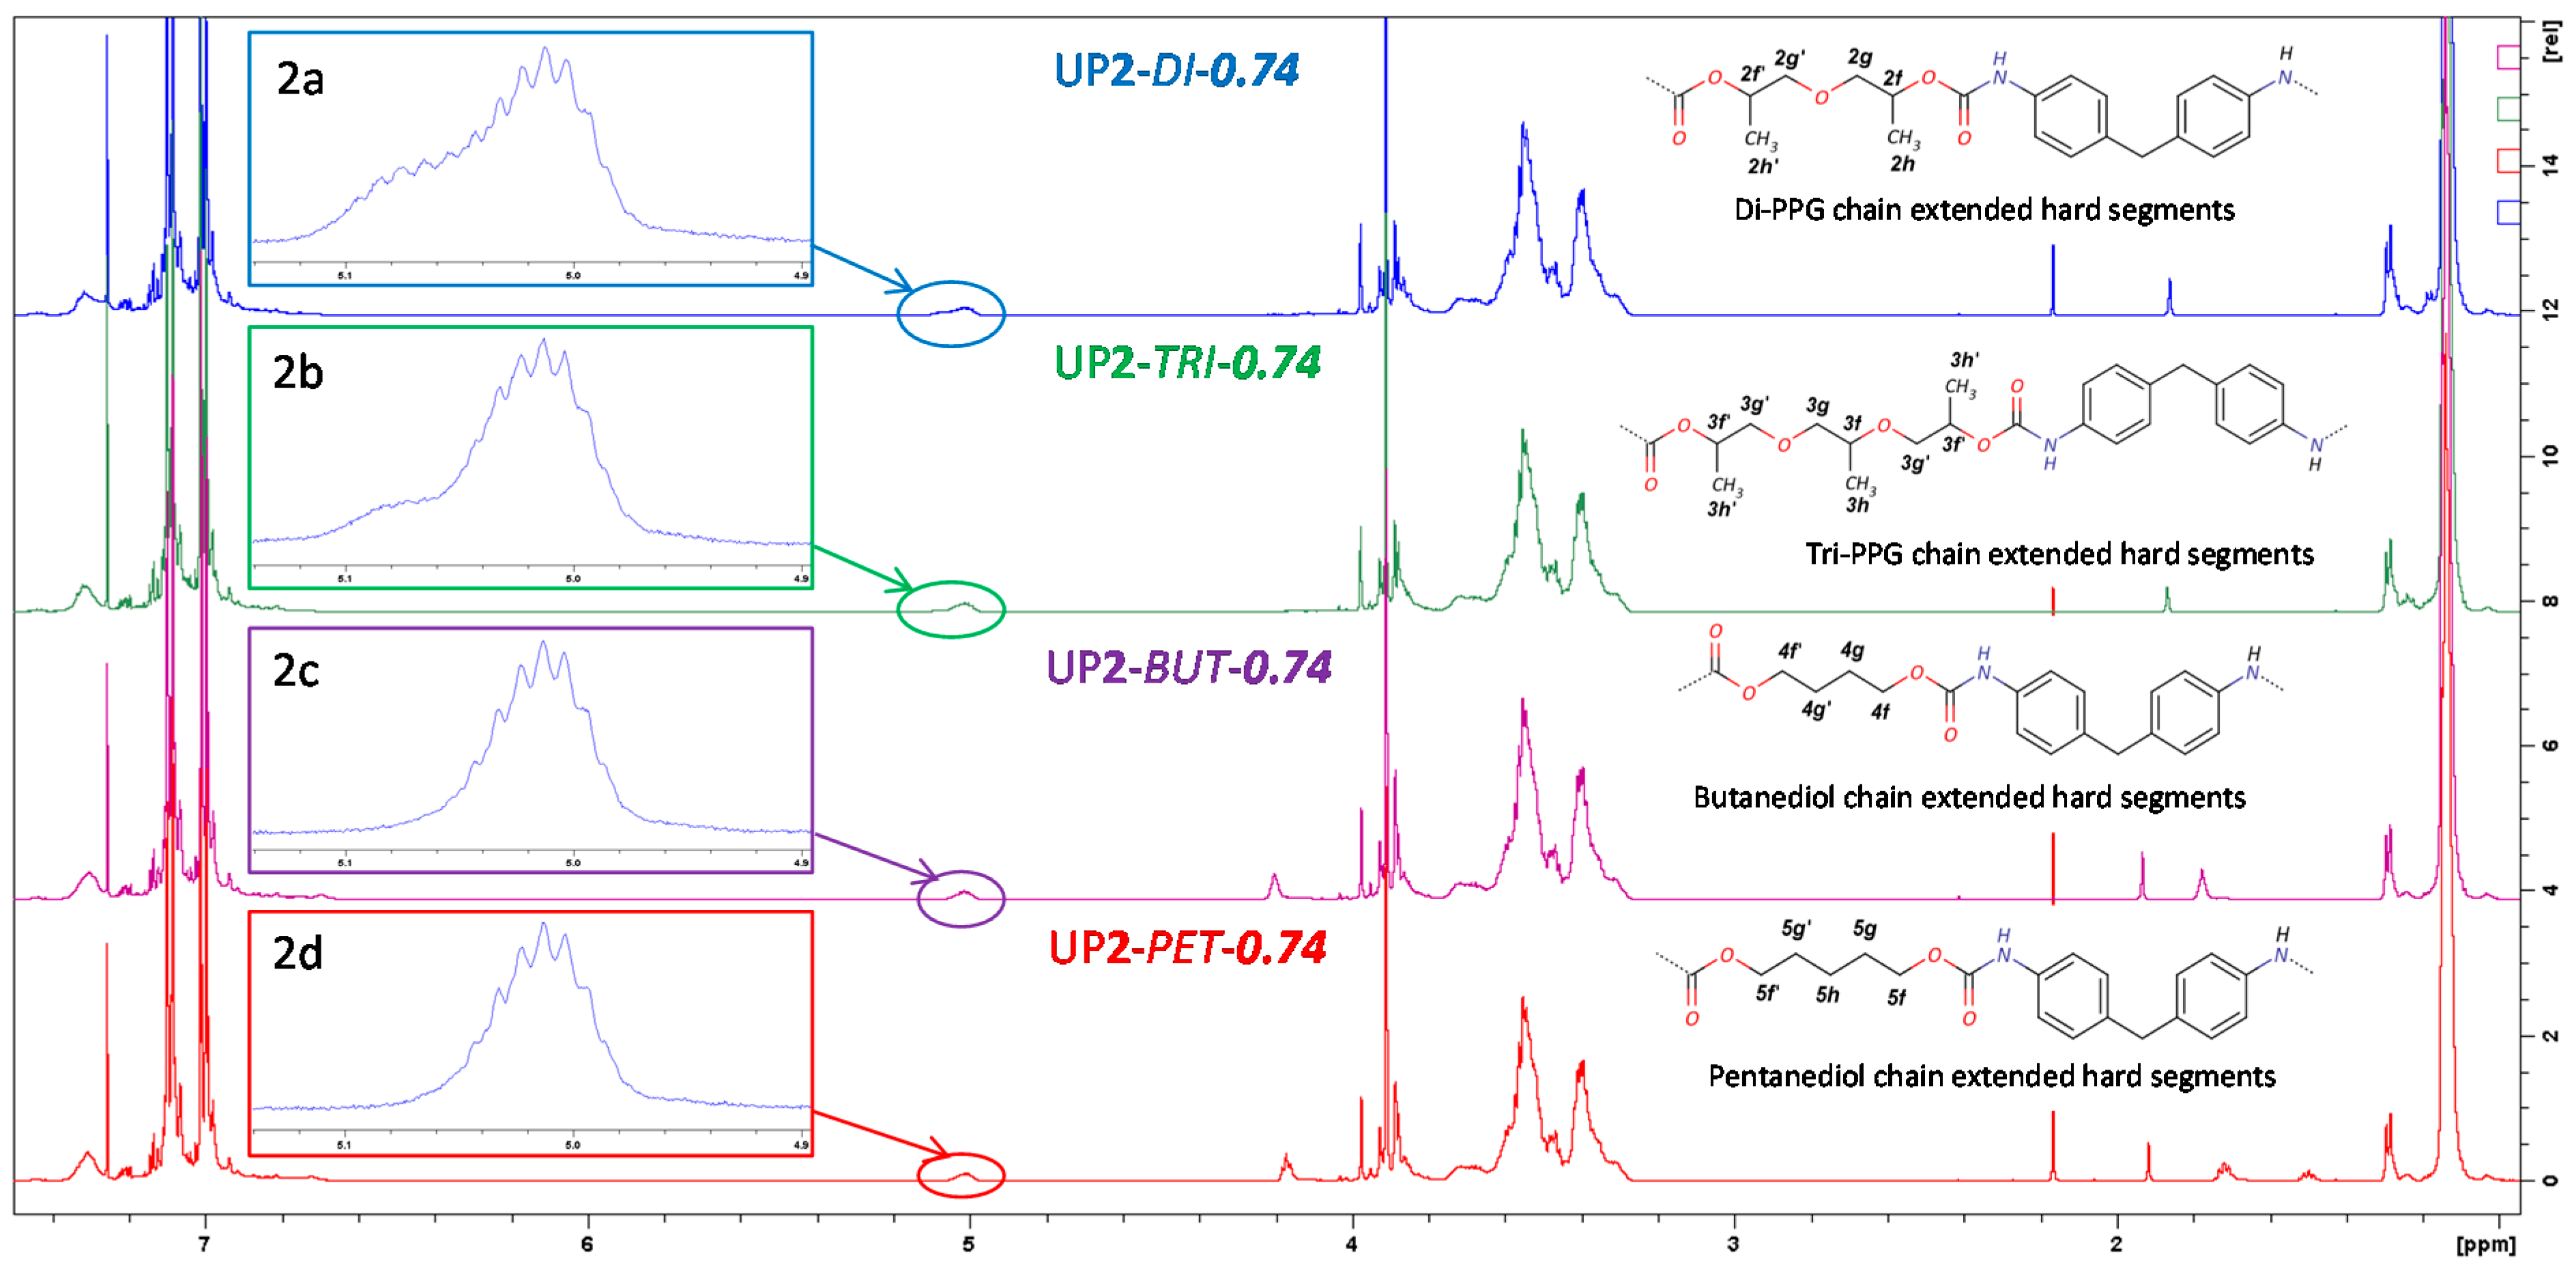
3.1.1. NMR
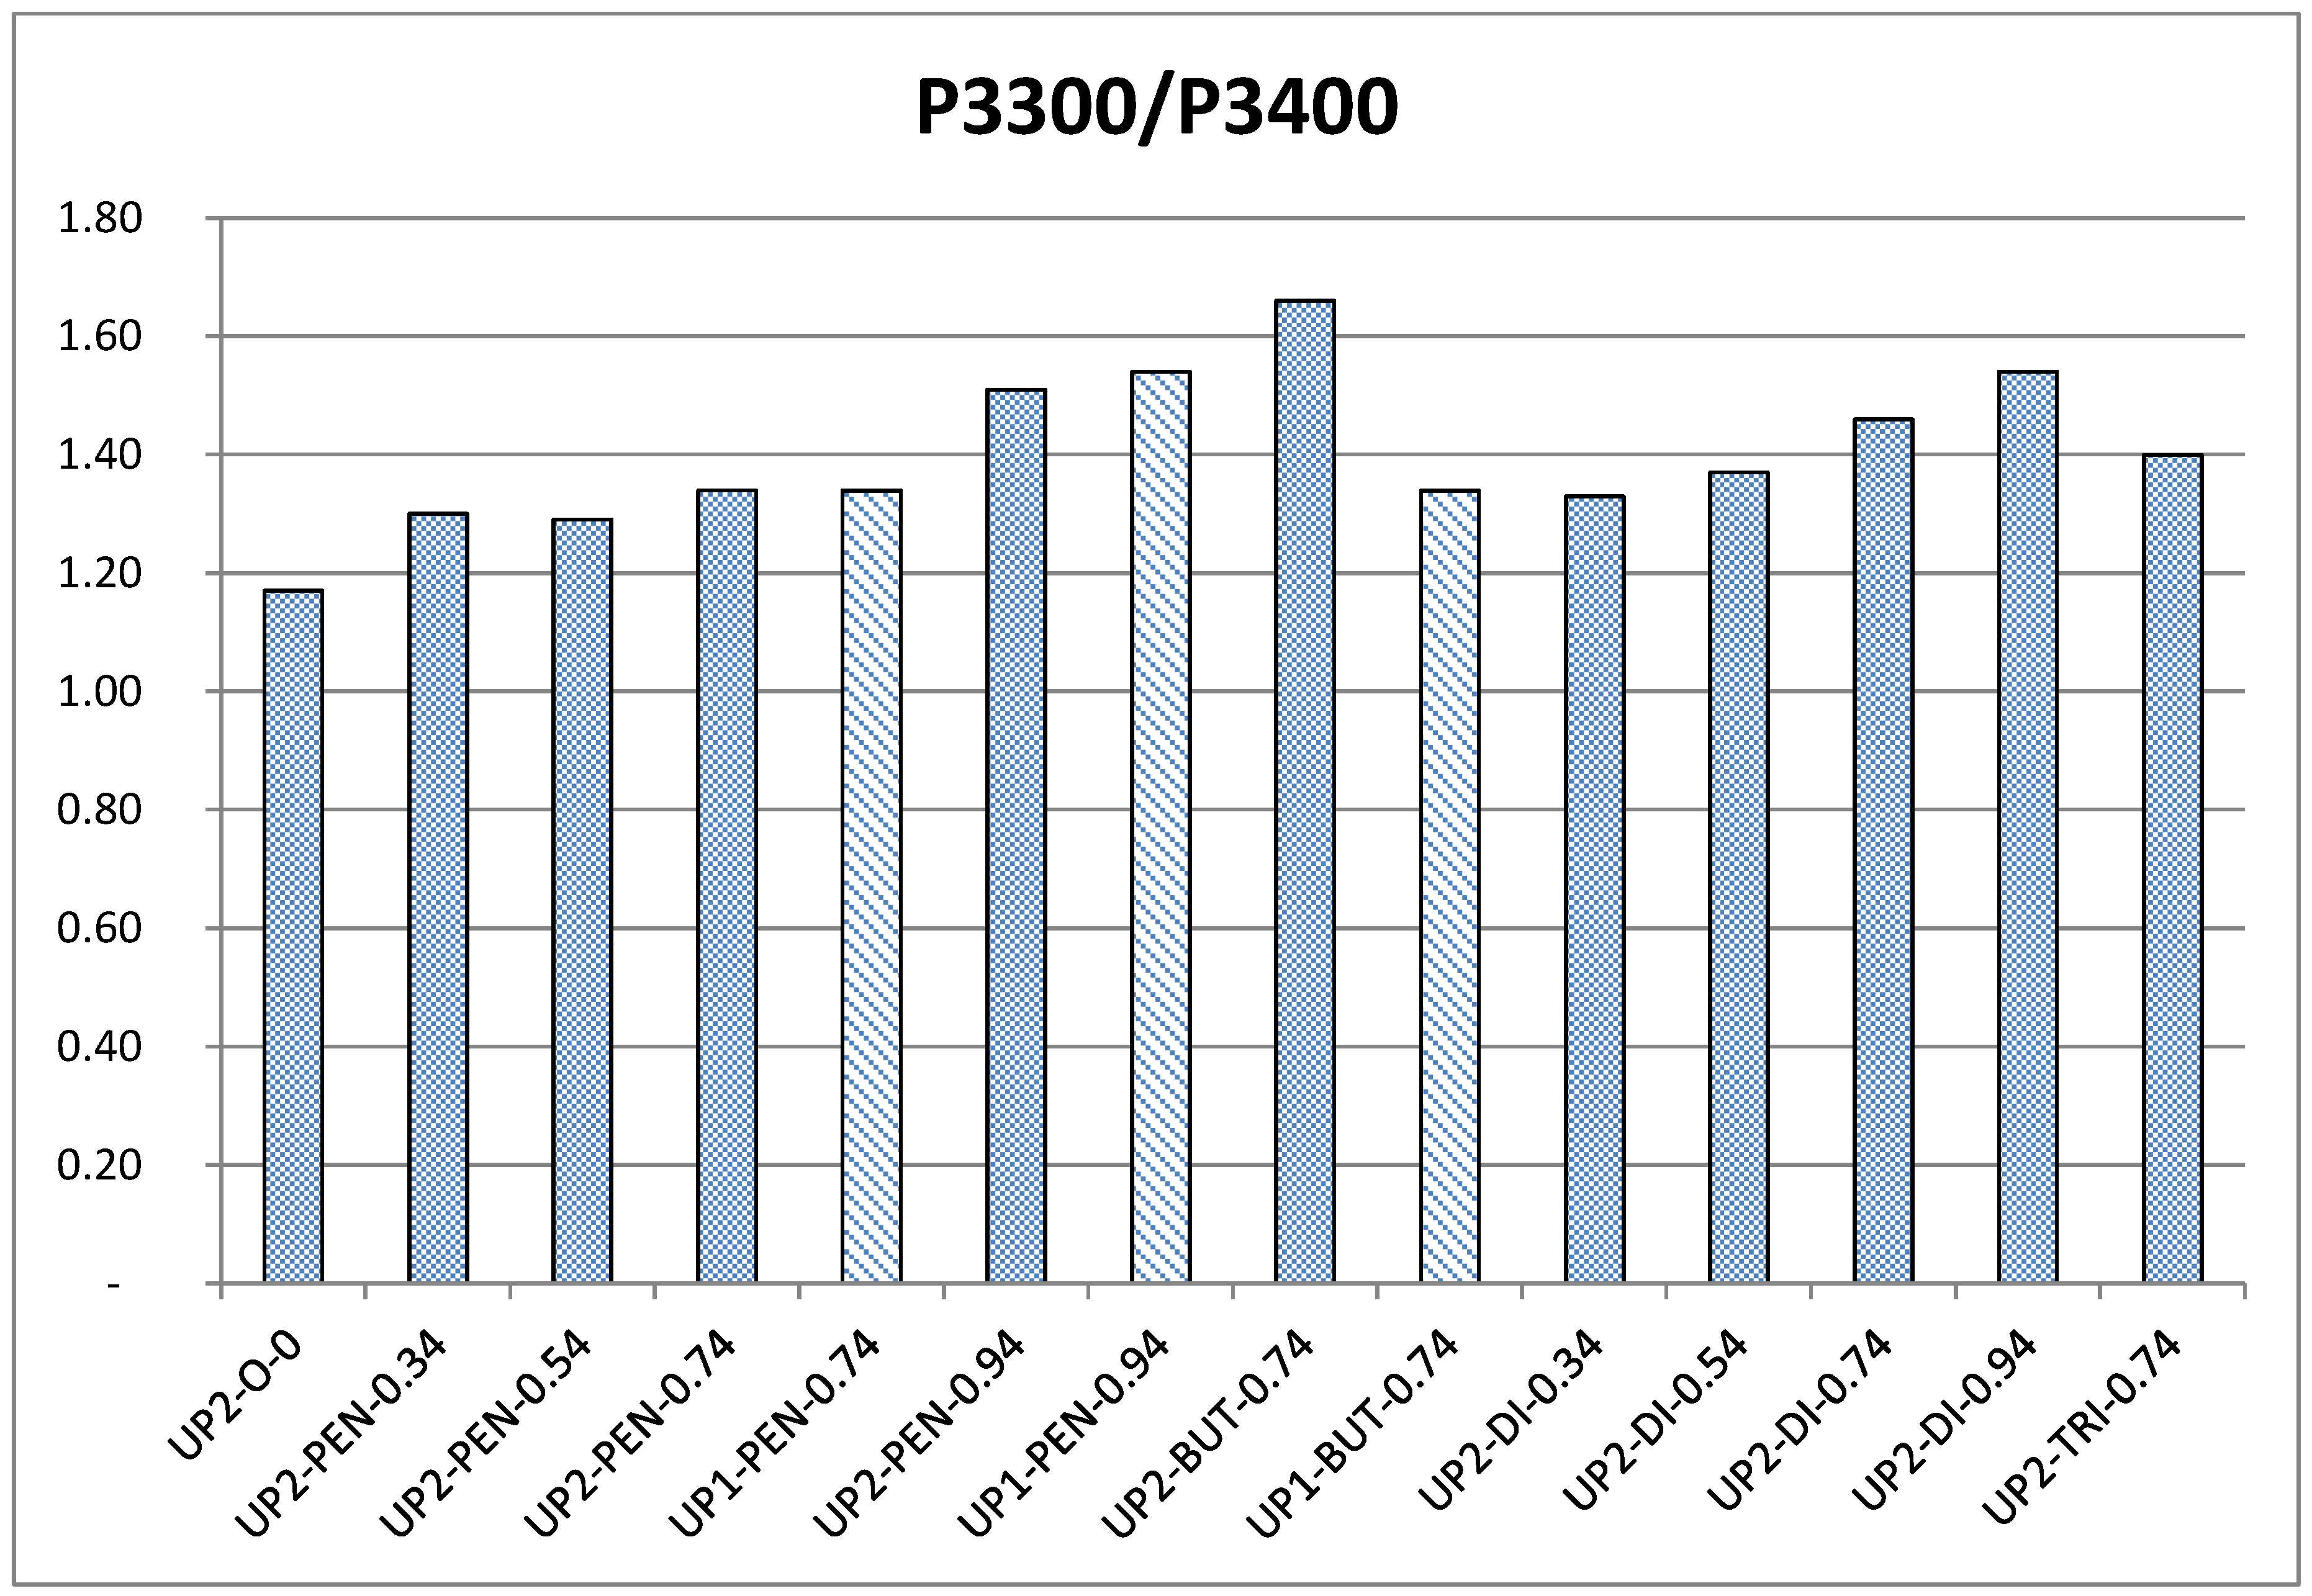
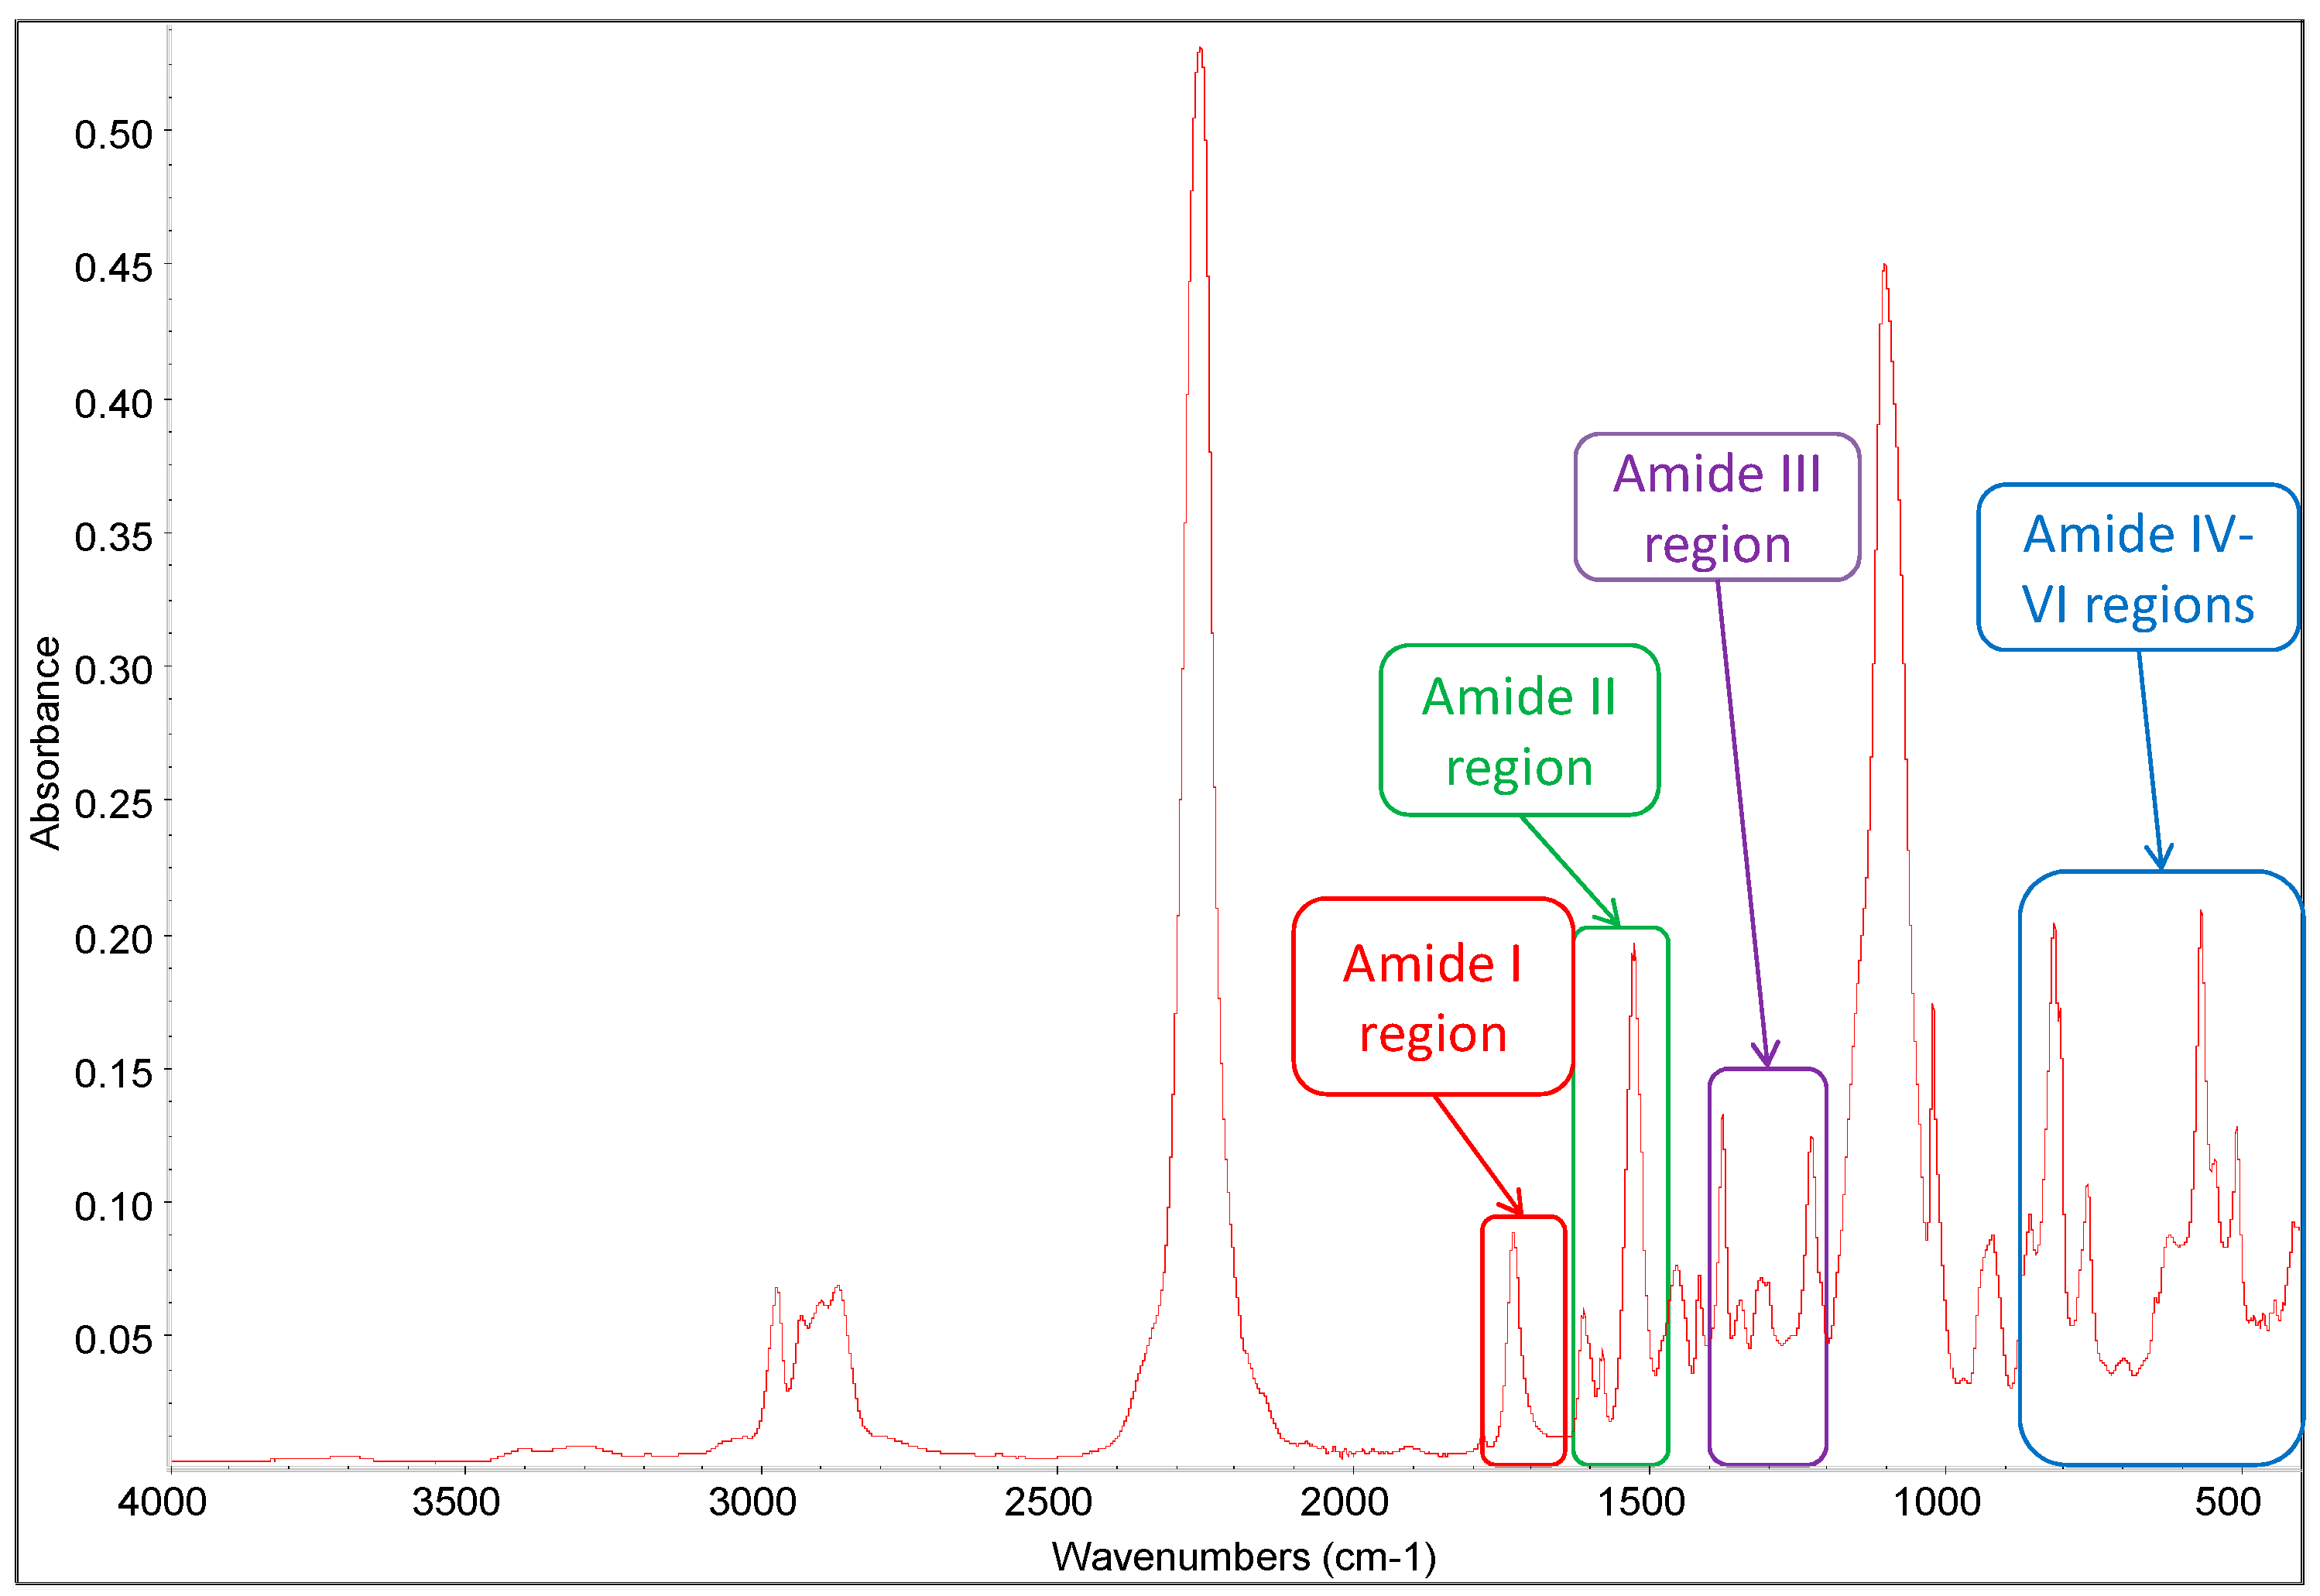
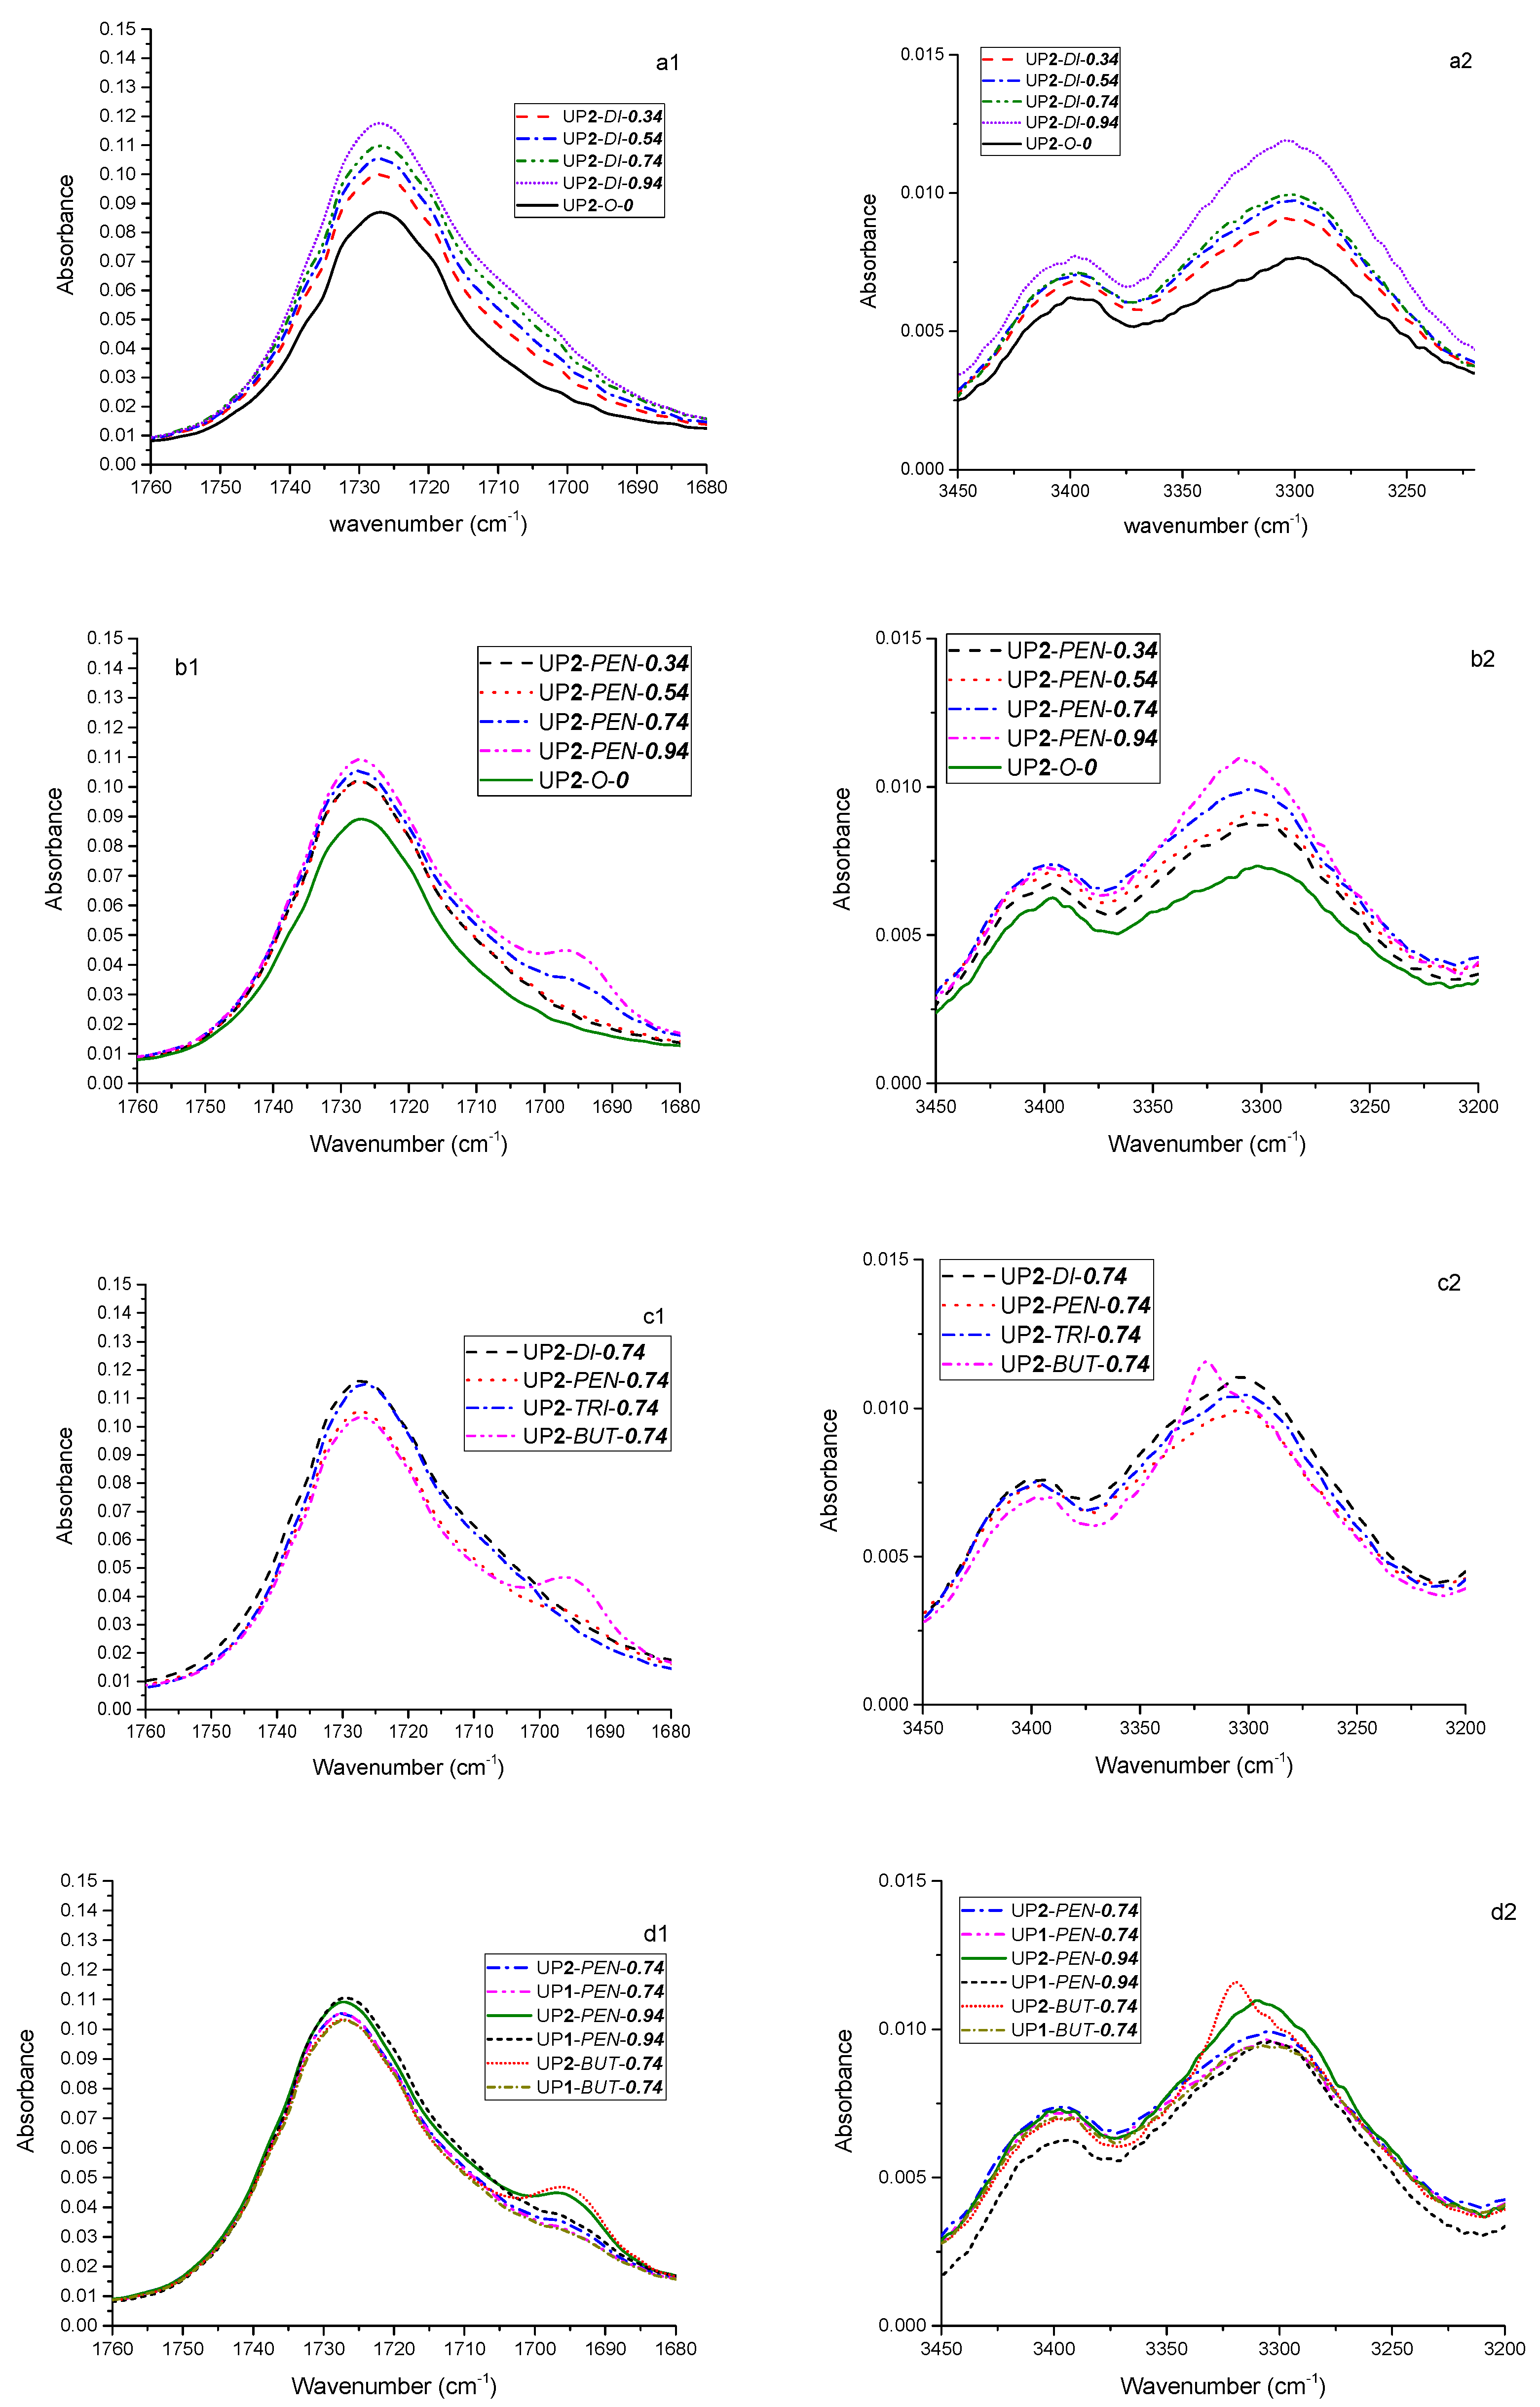
3.1.2. Attenuated Total Reflectance Infrared Spectroscopy
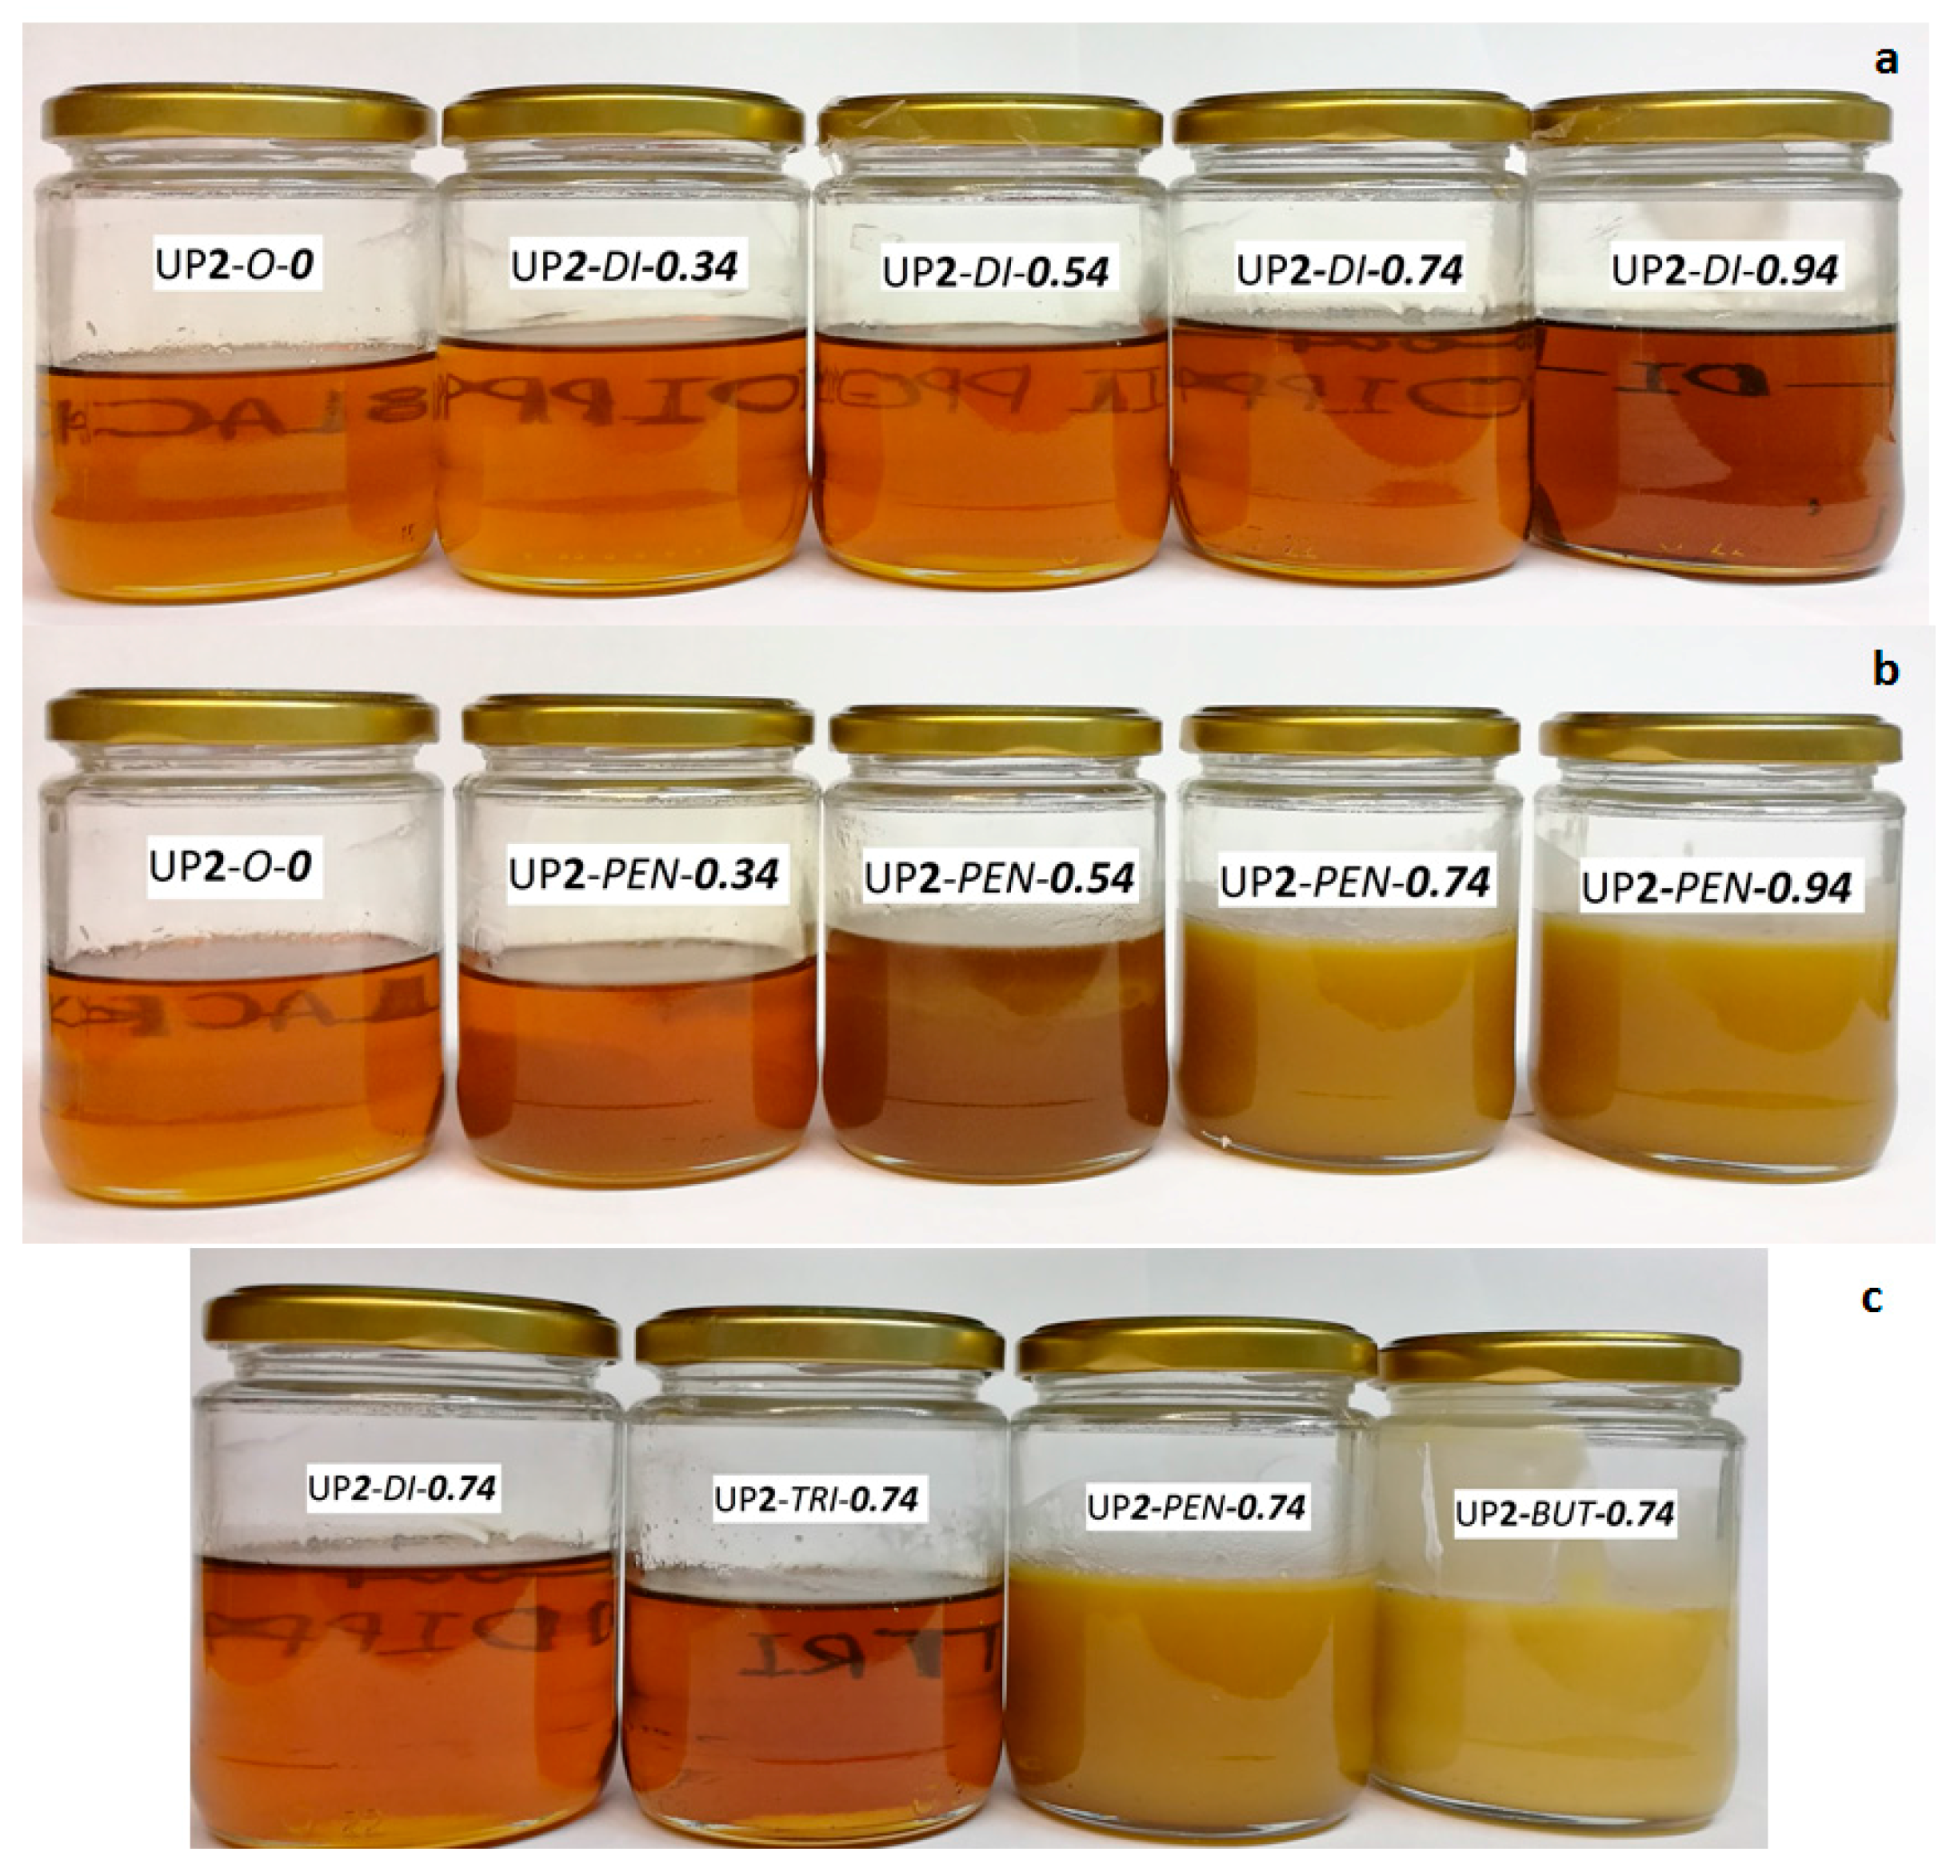
3.1.3. Appearance
3.1.4. Differential Scanning Calorimetry
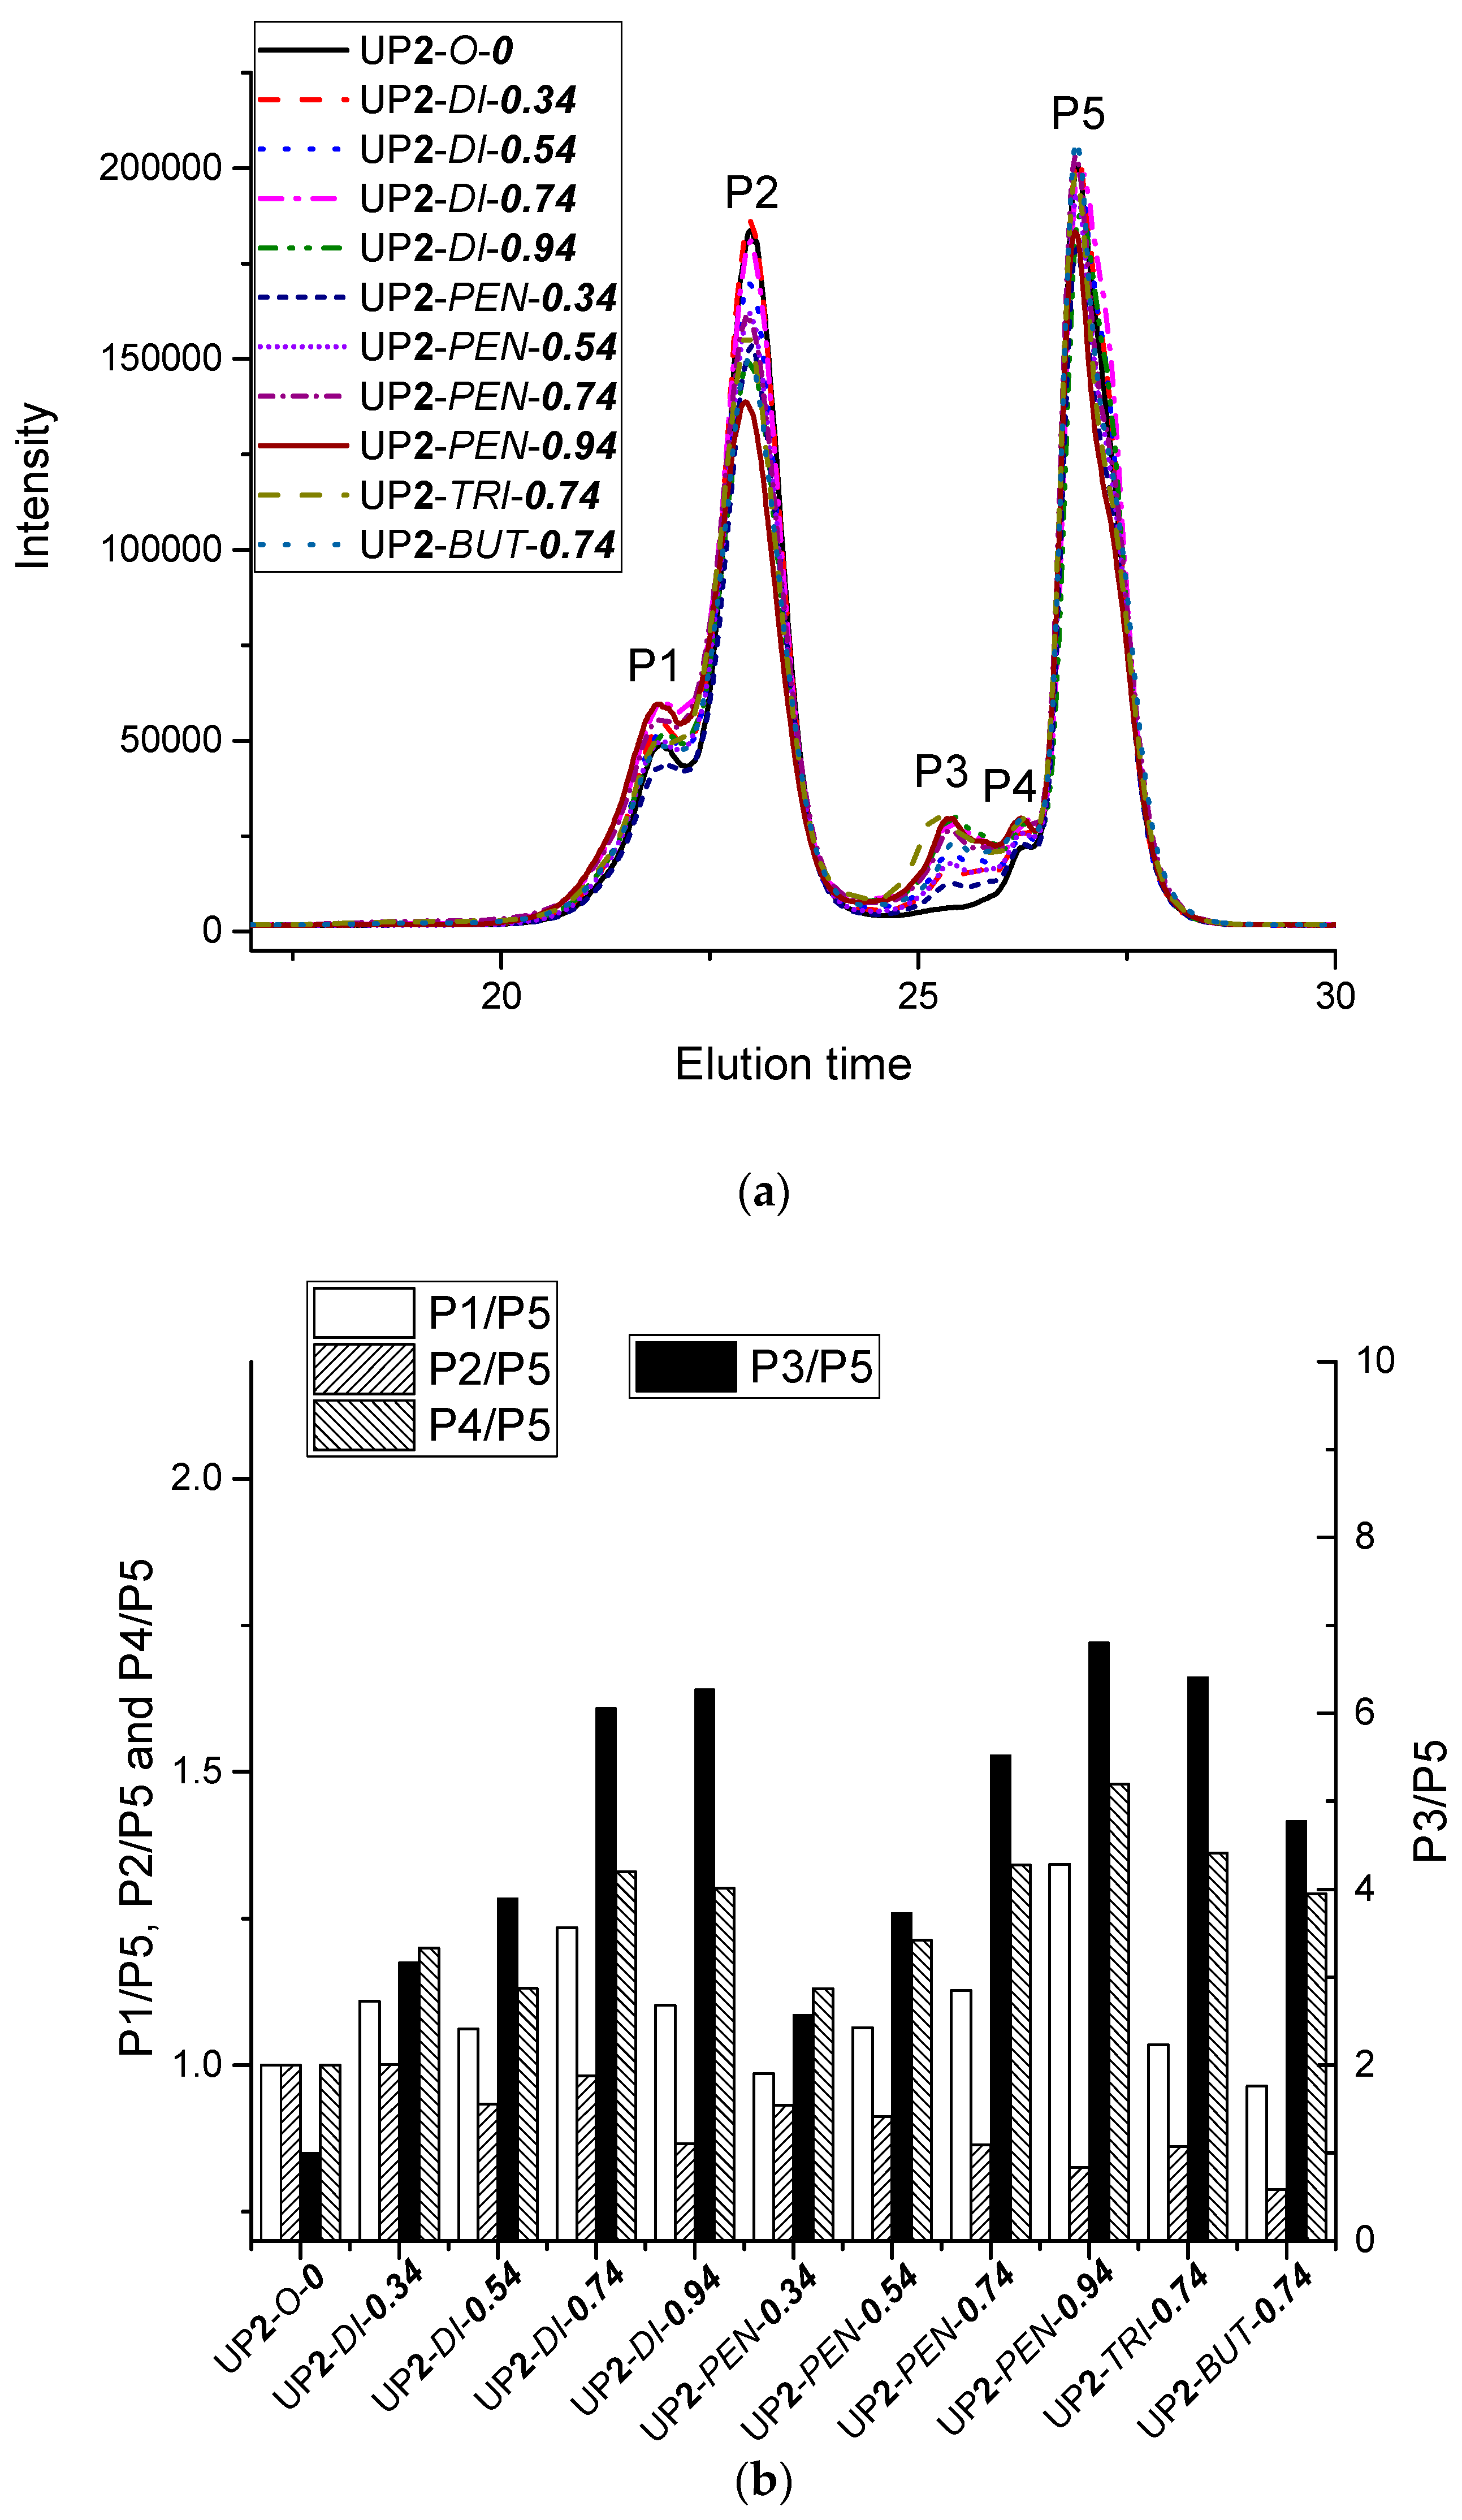
3.1.5. Size Exclusion Chromatography
3.2. Properties of Cured Polyurethane Films
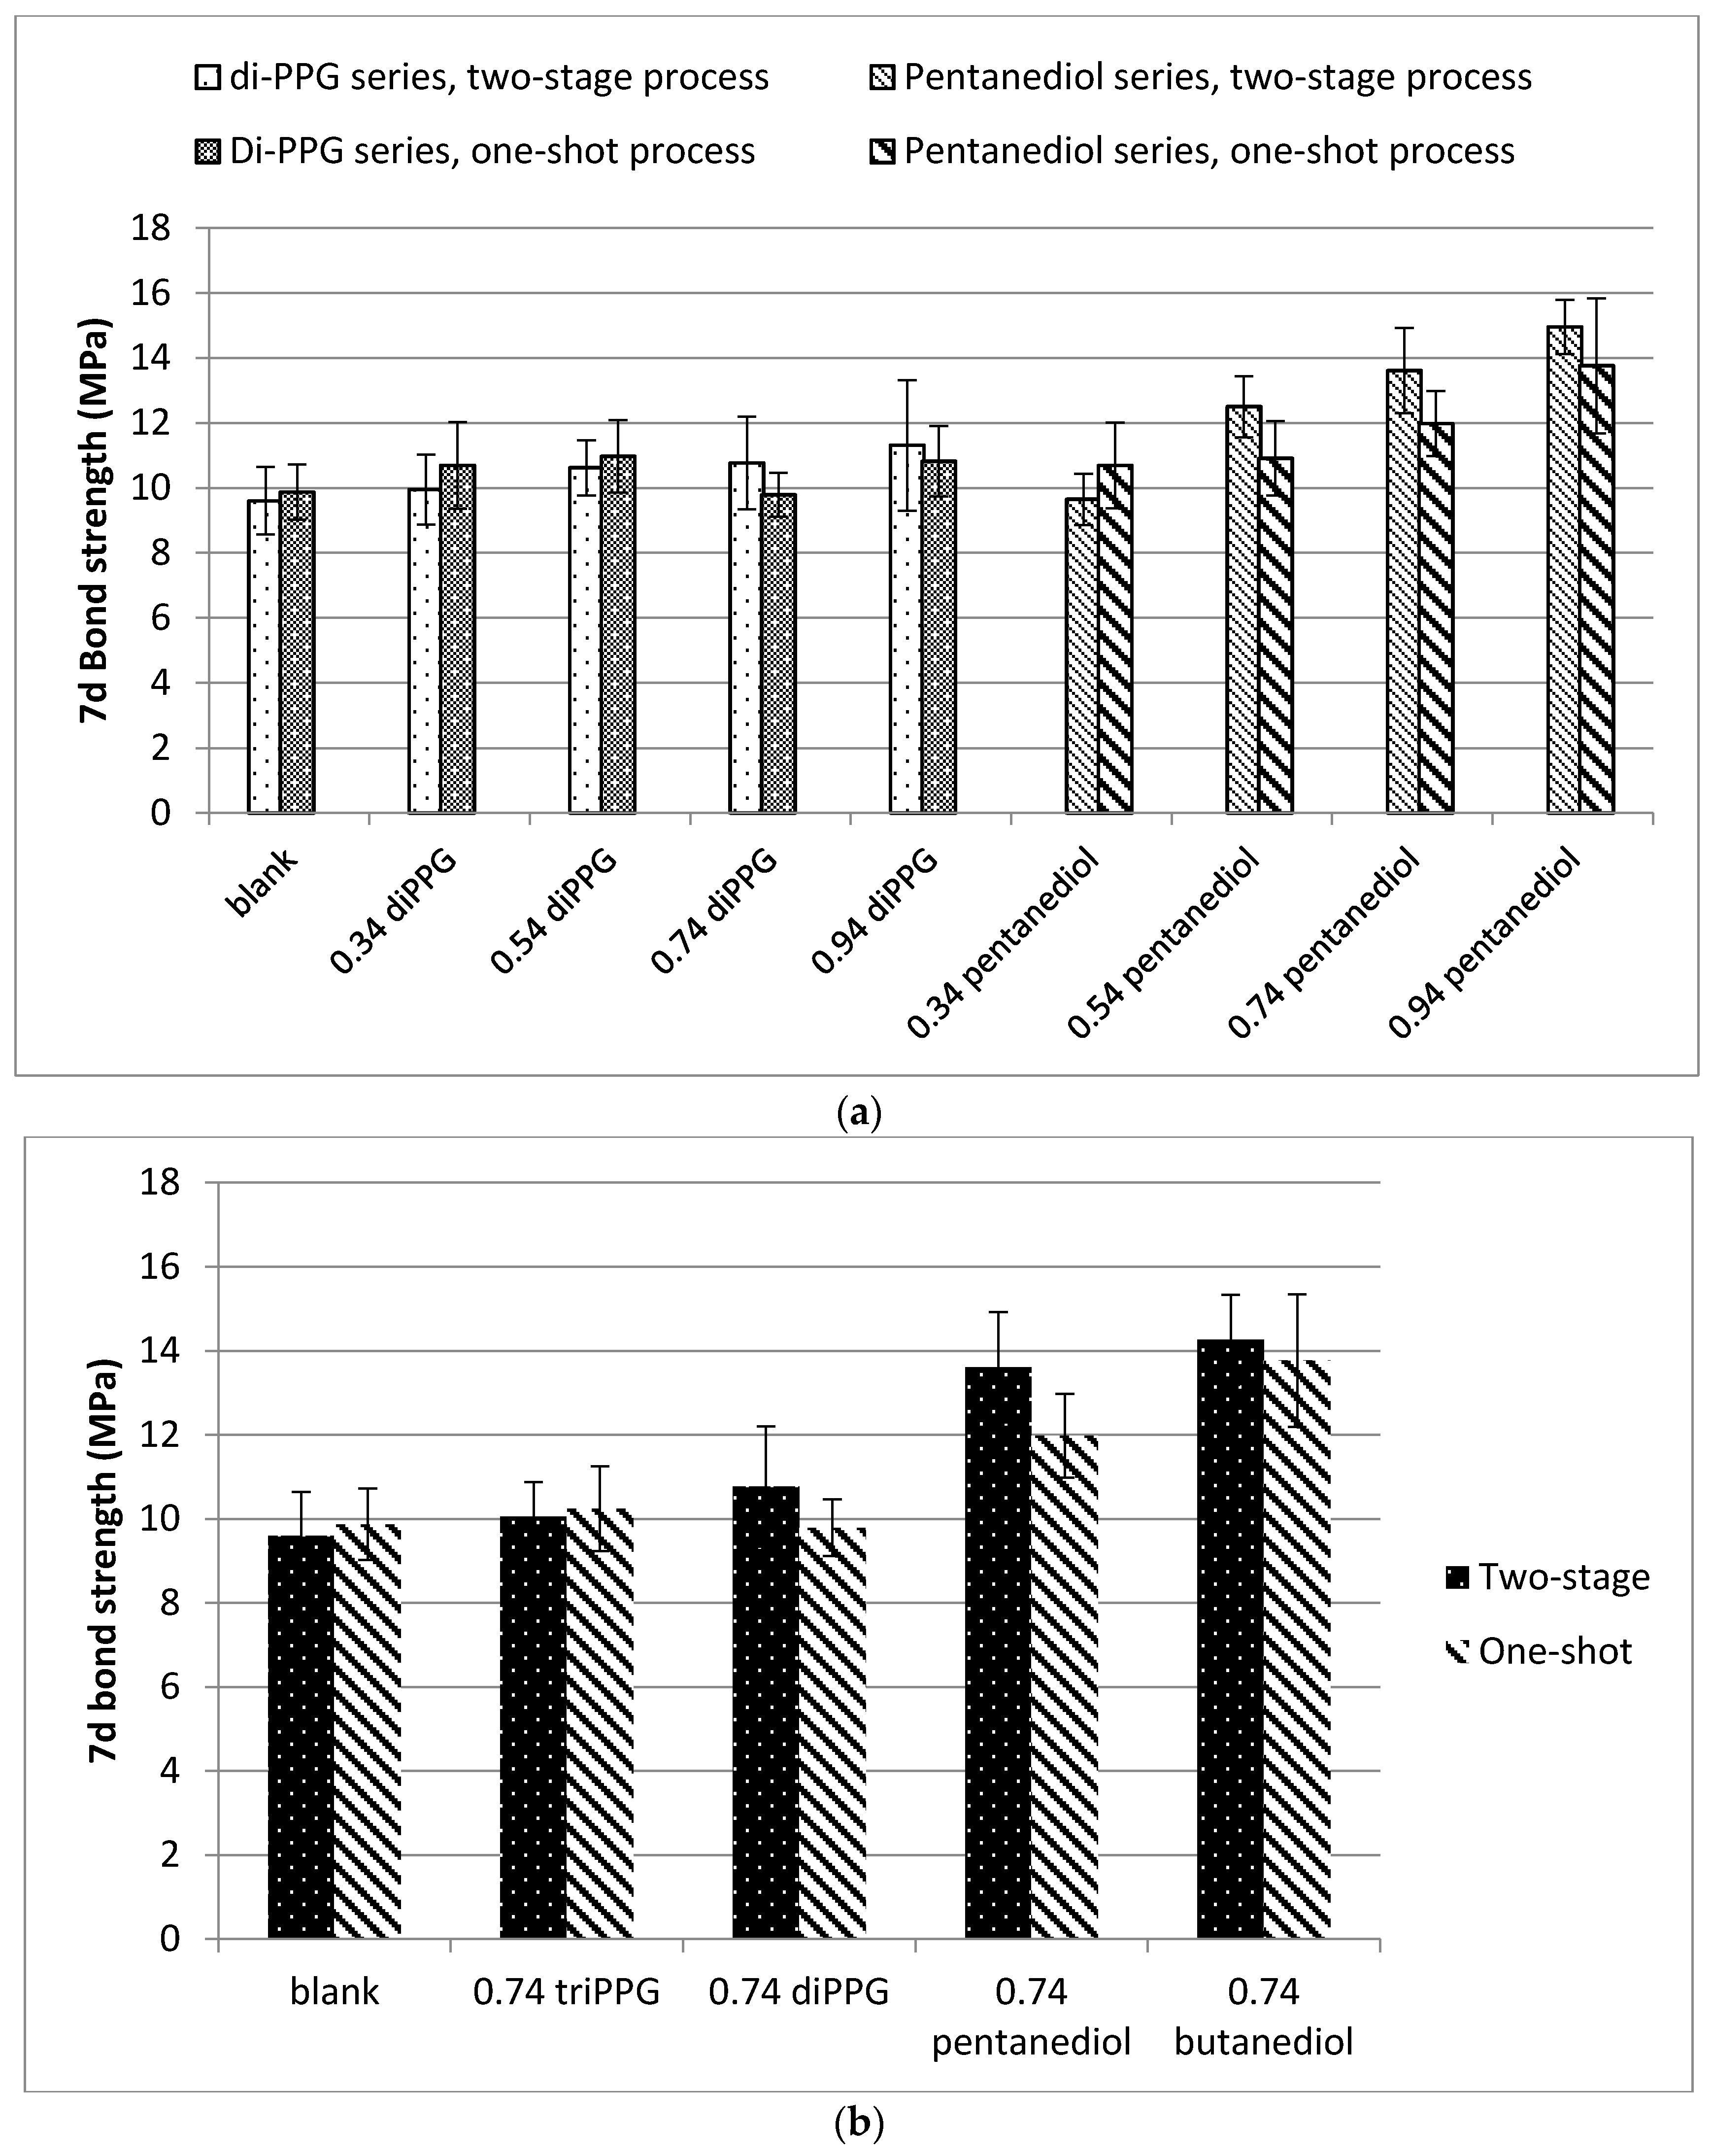
Bond Strength
4. Conclusions
Acknowledgments
Author Contributions
Conflicts of Interest
References
- Šebenik, U.; Krajnc, M. Influence of the soft segment length and content on the synthesis and properties of isocyanate-terminated urethane prepolymers. Int. J. Adhes. Adhes. 2007, 27, 527–535. [Google Scholar] [CrossRef]
- Müller, B.; Rath, W. Formulating Adhesives and Sealants: Chemistry, Physics and Applications. In Formulating Adhesives and Sealants: Chemistry, Physics and Applications; Müller, B., Rath, W., Eds.; Vincentz Network: Hannover, Germany, 2010; pp. 100–136. [Google Scholar]
- Klinedinst, D.B.; Yilgör, I.; Yilgör, E.; Zhang, M.; Wilkes, G.L. The effect of varying soft and hard segment length on the structure–property relationships of segmented polyurethanes based on a linear symmetric diisocyanate, 1,4-butanediol and PTMO soft segments. Polymer (Guildf) 2012, 53, 5358–5366. [Google Scholar] [CrossRef]
- Clauß, S. Influence of the adhesive formulation on the mechanical properties and bonding performance of polyurethane prepolymers. Holzforschung 2011, 65, 835–844. [Google Scholar] [CrossRef]
- Clauβ, S.; Dijkstra, D.J.; Gabriel, J.; Kläusler, O.; Matner, M.; Meckel, W.; Niemz, P. Influence of the chemical structure of PUR prepolymers on thermal stability. Int. J. Adhes. Adhes. 2011, 31, 513–523. [Google Scholar] [CrossRef]
- Lehringer, C.; Gabriel, J. Review of Recent Research Activities on One-Component PUR-Adhesives for Engineered Wood Products. In Materials and Joints in Timber Structures: Recent Developments of Technology; Aicher, S., Reinhardt, H.-W., Garrecht, H., Eds.; Springer Netherlands: Dordrecht, the Netherlands, 2014; pp. 405–420. [Google Scholar]
- Sterley, M.; Trey, S.; Lundevall, Å.; Olsson, S. Influence of cure conditions on the properties of a one-component moisture-cured polyurethane adhesive in the context of green gluing of wood. J. Appl. Polym. Sci. 2012, 126, E297–E304. [Google Scholar] [CrossRef]
- Engels, H.-W.; Pirkl, H.-G.; Albers, R.; Albach, R.W.; Krause, J.; Hoffmann, A.; Casselmann, H.; Dormish, J. Polyurethanes: Versatile materials and sustainable problem solvers for today’s challenges. Angew. Chem. Int. Ed. Engl. 2013, 52, 9422–9441. [Google Scholar] [CrossRef] [PubMed]
- Saralegi, A.; Rueda, L.; Fernández-D’Arlas, B.; Mondragon, I.; Eceiza, A.; Corcuera, M.A. Thermoplastic polyurethanes from renewable resources: Effect of soft segment chemical structure and molecular weight on morphology and final properties. Polym. Int. 2013, 62, 106–115. [Google Scholar] [CrossRef]
- Papon, E.; Villenave, J. Rheological characterization of thermoplastic polyurethane elastomers. Polym. Int. 2000, 598, 591–598. [Google Scholar]
- Chattopadhyay, D.K.; Sreedhar, B.; Raju, K.V.S.N. Effect of chain extender on phase mixing and coating properties of polyurethane ureas. Ind. Eng. Chem. Res. 2005, 44, 1772–1779. [Google Scholar] [CrossRef]
- Stoeckel, F.; Konnerth, J.; Gindl-Altmutter, W. Mechanical properties of adhesives for bonding wood—A review. Int. J. Adhes. Adhes. 2013, 45, 32–41. [Google Scholar] [CrossRef]
- Lee, D.-K.; Tsai, H.-B.; Tsai, R.-S.; Chen, P.H. Preparation and properties of transparent thermoplastic segmented polyurethanes derived from different polyols. Polym. Eng. Sci. 2007, 47, 695–701. [Google Scholar] [CrossRef]
- Delpech, M.C.; Miranda, G.S. Waterborne polyurethanes: Influence of chain extender in ftir spectra profiles. Cent. Eur. J. Eng. 2011, 2, 231–238. [Google Scholar] [CrossRef]
- Yoon, P.J.; Han, C.D. Effect of thermal history on the rheological behavior of thermoplastic polyurethanes. Macromolecules 2000, 33, 2171–2183. [Google Scholar] [CrossRef]
- Sheth, J.P.; Klinedinst, D.B.; Wilkes, G.L.; Yilgor, I.; Yilgor, E. Role of chain symmetry and hydrogen bonding in segmented copolymers with monodisperse hard segments. Polymer (Guildf) 2005, 46, 7317–7322. [Google Scholar] [CrossRef]
- Corcuera, M.A.; Rueda, L.; Fernandez d’Arlas, B.; Arbelaiz, A.; Marieta, C.; Mondragon, I.; Eceiza, A. Microstructure and properties of polyurethanes derived from castor oil. Polym. Degrad. Stab. 2010, 95, 2175–2184. [Google Scholar] [CrossRef]
- Das, S.; Yilgor, I.; Yilgor, E.; Inci, B.; Tezgel, O.; Beyer, F.L.; Wilkes, G.L. Structure–property relationships and melt rheology of segmented, non-chain extended polyureas: Effect of soft segment molecular weight. Polymer (Guildf) 2007, 48, 290–301. [Google Scholar] [CrossRef]
- Gogoi, R.; Alam, M.; Khandal, R. Effect of increasing NCO/OH molar ratio on the physicomechanical and thermal properties of isocyanate terminated polyurethane prepolymer. Int. J. Basic Appl. Sci. 2014, 3, 118–123. [Google Scholar] [CrossRef]
- Desai, S.; Thakore, I.; Sarawade, B.; Devi, S. Effect of polyols and diisocyanates on thermo-mechanical and morphological properties of polyurethanes. Eur. Polym. J. 2000, 36, 711–725. [Google Scholar] [CrossRef]
- Daniel da Silva, A.L.; Martín-Martínez, J.M.; Bordado, J.C.M. Influence of the free isocyanate content in the adhesive properties of reactive trifunctional polyether urethane quasi-prepolymers. Int. J. Adhes. Adhes. 2006, 26, 355–362. [Google Scholar] [CrossRef]
- Kamke, F.A.; Lee, J.N. Adhesive penetration in wood: A review. Wood Fiber Sci. 2007, 39, 205–220. [Google Scholar]
- Ren, D.; Frazier, C.E. Structure-property behavior of moisture-cure polyurethane wood adhesives: Influence of hard segment content. Int. J. Adhes. Adhes. 2013, 45, 118–124. [Google Scholar] [CrossRef]
- Gurke, T. New advances in polymeric MDI variants. Paint Resin Times 2002, 1, 22–23. [Google Scholar]
- Heintz, A.M.; Duffy, D.J.; Hsu, S.L.; Suen, W.; Chu, W.; Paul, C.W. Effects of reaction temperature on the formation of polyurethane prepolymer structures. Macromolecules 2003, 36, 2695–2704. [Google Scholar] [CrossRef]
- He, Y.; Xie, D.; Zhang, X. The structure, microphase-separated morphology, and property of polyurethanes and polyureas. J. Mater. Sci. 2014, 49, 7339–7352. [Google Scholar] [CrossRef]
- Lapprand, A.; Boisson, F.; Delolme, F.; Méchin, F.; Pascault, J.P. Reactivity of isocyanates with urethanes: Conditions for allophanate formation. Polym. Degrad. Stab. 2005, 90, 363–373. [Google Scholar] [CrossRef]
- Master, B. Study of Coatings Based on Polyisocyanates of Moisture Cure Depending on Its Resins and Water Scavengers. Master’s thesis, Universitat Politècnica de Catalunya, BarcelonaTech, Barcelona, Spain, 2013. [Google Scholar]
- Pegoraro, M.; Galbiati, A.; Ricca, G. 1H nuclear magnetic resonance study of polyurethane prepolymers from toluene diisocyanate and polypropylene glycol. J. Appl. Polym. Sci. 2003, 87, 347–357. [Google Scholar] [CrossRef]


| Sample (UPX-CE-Y) * | pMDI:PPG2000:CE molar ratio | NCO/OH molar ratio | HS/SS |
|---|---|---|---|
| UP1-O-0 | 7.44:1:0 | 8.57 | 1.12 |
| UP2-O-0 | |||
| UP1-DI-0.34 | 8.08:1:0.34 | 6.94 | 1.23 |
| UP2-DI-0.34 | |||
| UP1-DI-0.54 | 8.46:1:0.54 | 6.33 | 1.29 |
| UP2-DI-0.54 | |||
| UP1-DI-0.74 | 8.84:1:0.74 | 5.85 | 1.36 |
| UP2-DI-0.74 | |||
| UP1-DI-0.94 | 9.22:1:0.94 | 5.47 | 1.42 |
| UP2-DI-0.94 | |||
| UP1-PEN-0.34 | 8.08:1:0.34 | 6.94 | 1.23 |
| UP2-PEN-0.34 | |||
| UP1-PEN-0.54 | 8.46:1:0.54 | 6.33 | 1.29 |
| UP2-PEN-0.54 | |||
| UP1-PEN-0.74 | 8.84:1:0.74 | 5.85 | 1.36 |
| UP2-PEN-0.74 | |||
| UP1-PEN-0.94 | 9.22:1:0.94 | 5.47 | 1.42 |
| UP2-PEN-0.94 | |||
| UP1-TRI-0.74 | 8.84:1:0.74 | 5.85 | 1.36 |
| UP2-TRI-0.74 | |||
| UP1-BUT-0.74 | 8.84:1:0.74 | 5.85 | 1.36 |
| UP2-BUT-0.74 |
| Segment | Assignment of protons | Shift (δ, ppm) |
|---|---|---|
| Hard | 1a–1d and 1a′–1d′ | 6.9–7.1 |
| 1e | 3.9–4.0 | |
| 1j | 7.3 | |
| Soft | 1f′ | 1.1–1.2 |
| 1f | 1.3 | |
| 1g | 5.0 | |
| 1g′, 1h, 1h′ | 3.2–3.8 |
| Sample Code | Assignment of protons | Shift (δ, ppm) |
|---|---|---|
| UP2-DI-0.74 | 2h, 2h′ | 1.3 |
| 2f, 2f′ | 5.0 | |
| 2g, 2g′ | 3.2–3.8 | |
| UP2-TRI-0.74 | 3h, 3h′ | 1.3 |
| 3f′ | 5.0 | |
| 3f, 3g, 3g′ | 3.2–3.8 | |
| UP2-BUT-0.74 | 4f, 4f′ | 4.2 |
| 4g, 4g′ | 1.8 | |
| UP2-PEN-0.74 | 5h | 1.5 |
| 5g, 5g′ | 1.7 | |
| 5f, 5f′ | 4.2 |
| Functional group | Wavenumber/cm−1 |
|---|---|
| pMDI N=C=O stretching | 2270 |
| pMDI aromatic C=C stretching | 1611, 1578 |
| Urethane prepolymer (UP) urethane N–H stretching | 3200–3400 |
| UP urethane C=O stretching | 1680–1760 |
| UP urethane N–H bending and C–N stretching | 1524–1527 |
| UP urethane C–O stretching | 1220–1222 |
| UP aromatic C=C stretching | 1598 |
| PPG 2000 C–O–C stretching | 1100 |
| PPG 2000 CH2 stretching vibration (symmetric and asymmetric) | 2857–2940 |
| Sample (UPX-CE-Y) * | DSC results | Viscosity | ||
|---|---|---|---|---|
| Tg1 of 1st heating | Tm of 1st heating | Melting enthalpy | ||
| UP1-O-0 | −48.58 | -- | -- | 3640 |
| UP2-O-0 | −50.01 | -- | -- | 3640 |
| UP1-DI-0.34 | −45.98 | -- | -- | 6500 |
| UP2-DI-0.34 | −46.27 | -- | -- | 6060 |
| UP1-DI-0.54 | −44.68 | -- | -- | 6150 |
| UP2-DI-0.54 | −43.67 | -- | -- | 7740 |
| UP1-DI-0.74 | −43.82 | -- | -- | 8600 |
| UP2-DI-0.74 | −42.93 | -- | -- | 11,080 |
| UP1-DI-0.94 | −39.63 | -- | -- | 22,400 |
| UP2-DI-0.94 | −39.05 | -- | -- | 12,000 |
| UP1-PEN-0.34 | −48.15 | -- | -- | 6920 |
| UP2-PEN-0.34 | −47.43 | -- | -- | 5100 |
| UP1-PEN-0.54 | −44.83 | -- | -- | 9220 |
| UP2-PEN-0.54 | −44.54 | -- | -- | 6820 |
| UP1-PEN-0.74 | −43.10 | 59.98 | 2.176 | 17,500 |
| UP2-PEN-0.74 | −45.41 | 53.25 | 1.688 | 45,600 |
| UP1-PEN-0.94 | −43.82 | 58.28 | 2.138 | 50,880 |
| UP2-PEN-0.94 | −42.52 | 56.52 | 2.304 | 52,600 |
| UP1-TRI-0.74 | −38.91 | -- | -- | 9950 |
| UP2-TRI-0.74 | −40.35 | -- | -- | 9600 |
| UP1-BUT-0.74 | −43.10 | 83.58 | 3.016 | 36,200 |
| UP2-BUT-0.74 | −43.53 | 81.41 | 3.229 | 44,000 |
| Sample (UPX-CE-Y) * | Total average of P1 and P2 | ||
|---|---|---|---|
| Mn | Mw | Mw/Mn | |
| UP2-O-0 | 4330 | 5250 | 1.21 |
| UP2-DI-0.34 | 4430 | 5450 | 1.23 |
| UP2-DI-0.54 | 4500 | 5570 | 1.24 |
| UP2-DI-0.74 | 4560 | 5710 | 1.25 |
| UP2-DI-0.94 | 4540 | 5630 | 1.24 |
| UP2-PEN-0.34 | 4380 | 5320 | 1.22 |
| UP2-PEN-0.54 | 4480 | 5600 | 1.25 |
| UP2-PEN-0.74 | 4540 | 5740 | 1.27 |
| UP2-PEN-0.94 | 4760 | 6090 | 1.28 |
| UP2-TRI-0.74 | 4480 | 5580 | 1.25 |
| UP2-BUT-0.74 | 4460 | 5490 | 1.23 |
© 2017 by the authors. Licensee MDPI, Basel, Switzerland. This article is an open access article distributed under the terms and conditions of the Creative Commons Attribution (CC BY) license (http://creativecommons.org/licenses/by/4.0/).
Share and Cite
Tan, C.; Tirri, T.; Wilen, C.-E. Investigation on the Influence of Chain Extenders on the Performance of One-Component Moisture-Curable Polyurethane Adhesives. Polymers 2017, 9, 184. https://doi.org/10.3390/polym9050184
Tan C, Tirri T, Wilen C-E. Investigation on the Influence of Chain Extenders on the Performance of One-Component Moisture-Curable Polyurethane Adhesives. Polymers. 2017; 9(5):184. https://doi.org/10.3390/polym9050184
Chicago/Turabian StyleTan, Chen, Teija Tirri, and Carl-Eric Wilen. 2017. "Investigation on the Influence of Chain Extenders on the Performance of One-Component Moisture-Curable Polyurethane Adhesives" Polymers 9, no. 5: 184. https://doi.org/10.3390/polym9050184
APA StyleTan, C., Tirri, T., & Wilen, C.-E. (2017). Investigation on the Influence of Chain Extenders on the Performance of One-Component Moisture-Curable Polyurethane Adhesives. Polymers, 9(5), 184. https://doi.org/10.3390/polym9050184