3. Results and Discussion
The isothermal crystallization of PET homopolymers, as a function of time, was first characterized by polarizing optical microscopy utilizing two types of analytical techniques. In the first one, polarized light in thin films (with similar thickness) was
in situ detected with a photomonitor that registered the intensity of depolarized transmitted light (see normalized curves in
Figure 1). In the second one, sequential micrographs were taken at different time intervals, where selected micrographs are presented in
Figure 2.
Figure 1.
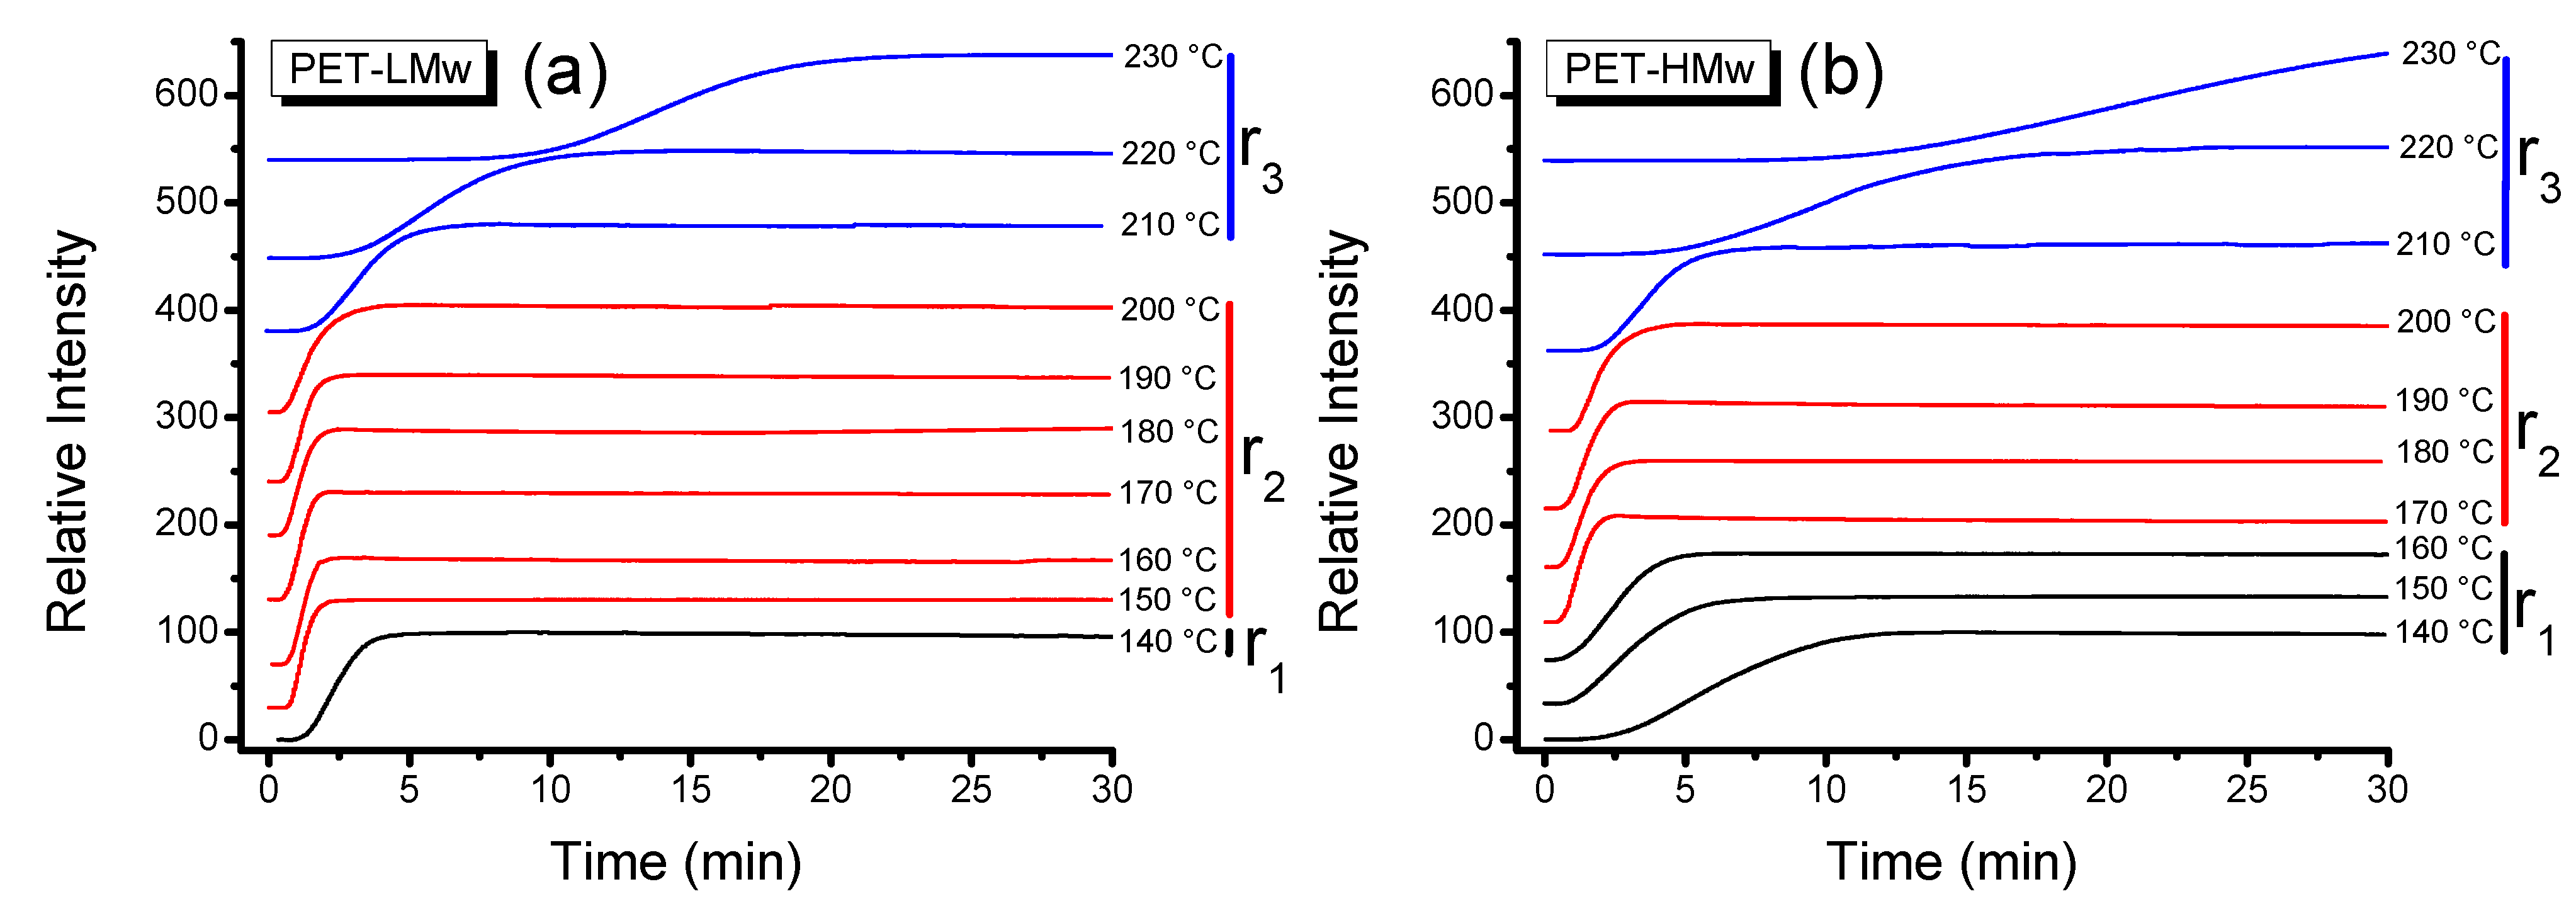
Evolution of transmitted depolarized light intensity during the isothermal crystallization (30 min) of PET samples at different temperatures: (a) PET-LMw; and (b) PET-HMw.
Figure 1.
Evolution of transmitted depolarized light intensity during the isothermal crystallization (30 min) of PET samples at different temperatures: (a) PET-LMw; and (b) PET-HMw.
According to the shape of curves depicted in
Figure 1, three different regions can be defined. In the first region (
r1), corresponding to low crystallization temperatures, the intensity increased slowly. In the second region (
r2), corresponding to intermediate
Tc, a sudden increase in intensity was observed. The third region (
r3), corresponding to high
Tc, exhibited a less pronounce rate of increase in intensity; this behavior is particularly observed in high molecular weight samples crystallized at these high temperatures. At the same time, micrographs in
Figure 2 showed that in
r1 and
r3 there is a partial crystallization with important amounts of amorphous material (micrographs in
Figure 2a,c,d,f), where as in
r2 the material seems to be completely crystallized (micrographs in
Figure 2b,e). Even though the use of a photomonitor is quite conventional for microscopic analysis, there are few reports in which this tool was used to explore the crystallization process of polymers. For instance, Bian
et al. by using this technique found important differences in the crystallization rate of PET isothermaly crystallized from low to high
Tc [
10]. Also, Chen
et al. reported a similar behavior from temperatures in the regions
r2 and
r3 [
11], however, these authors did not define specific morphological regions as those here described. In other studies, authors have defined differences in the crystallization of PET as a function of
Tc, but only utilizing few analytical techniques, such as SEM and WAXD [
6].
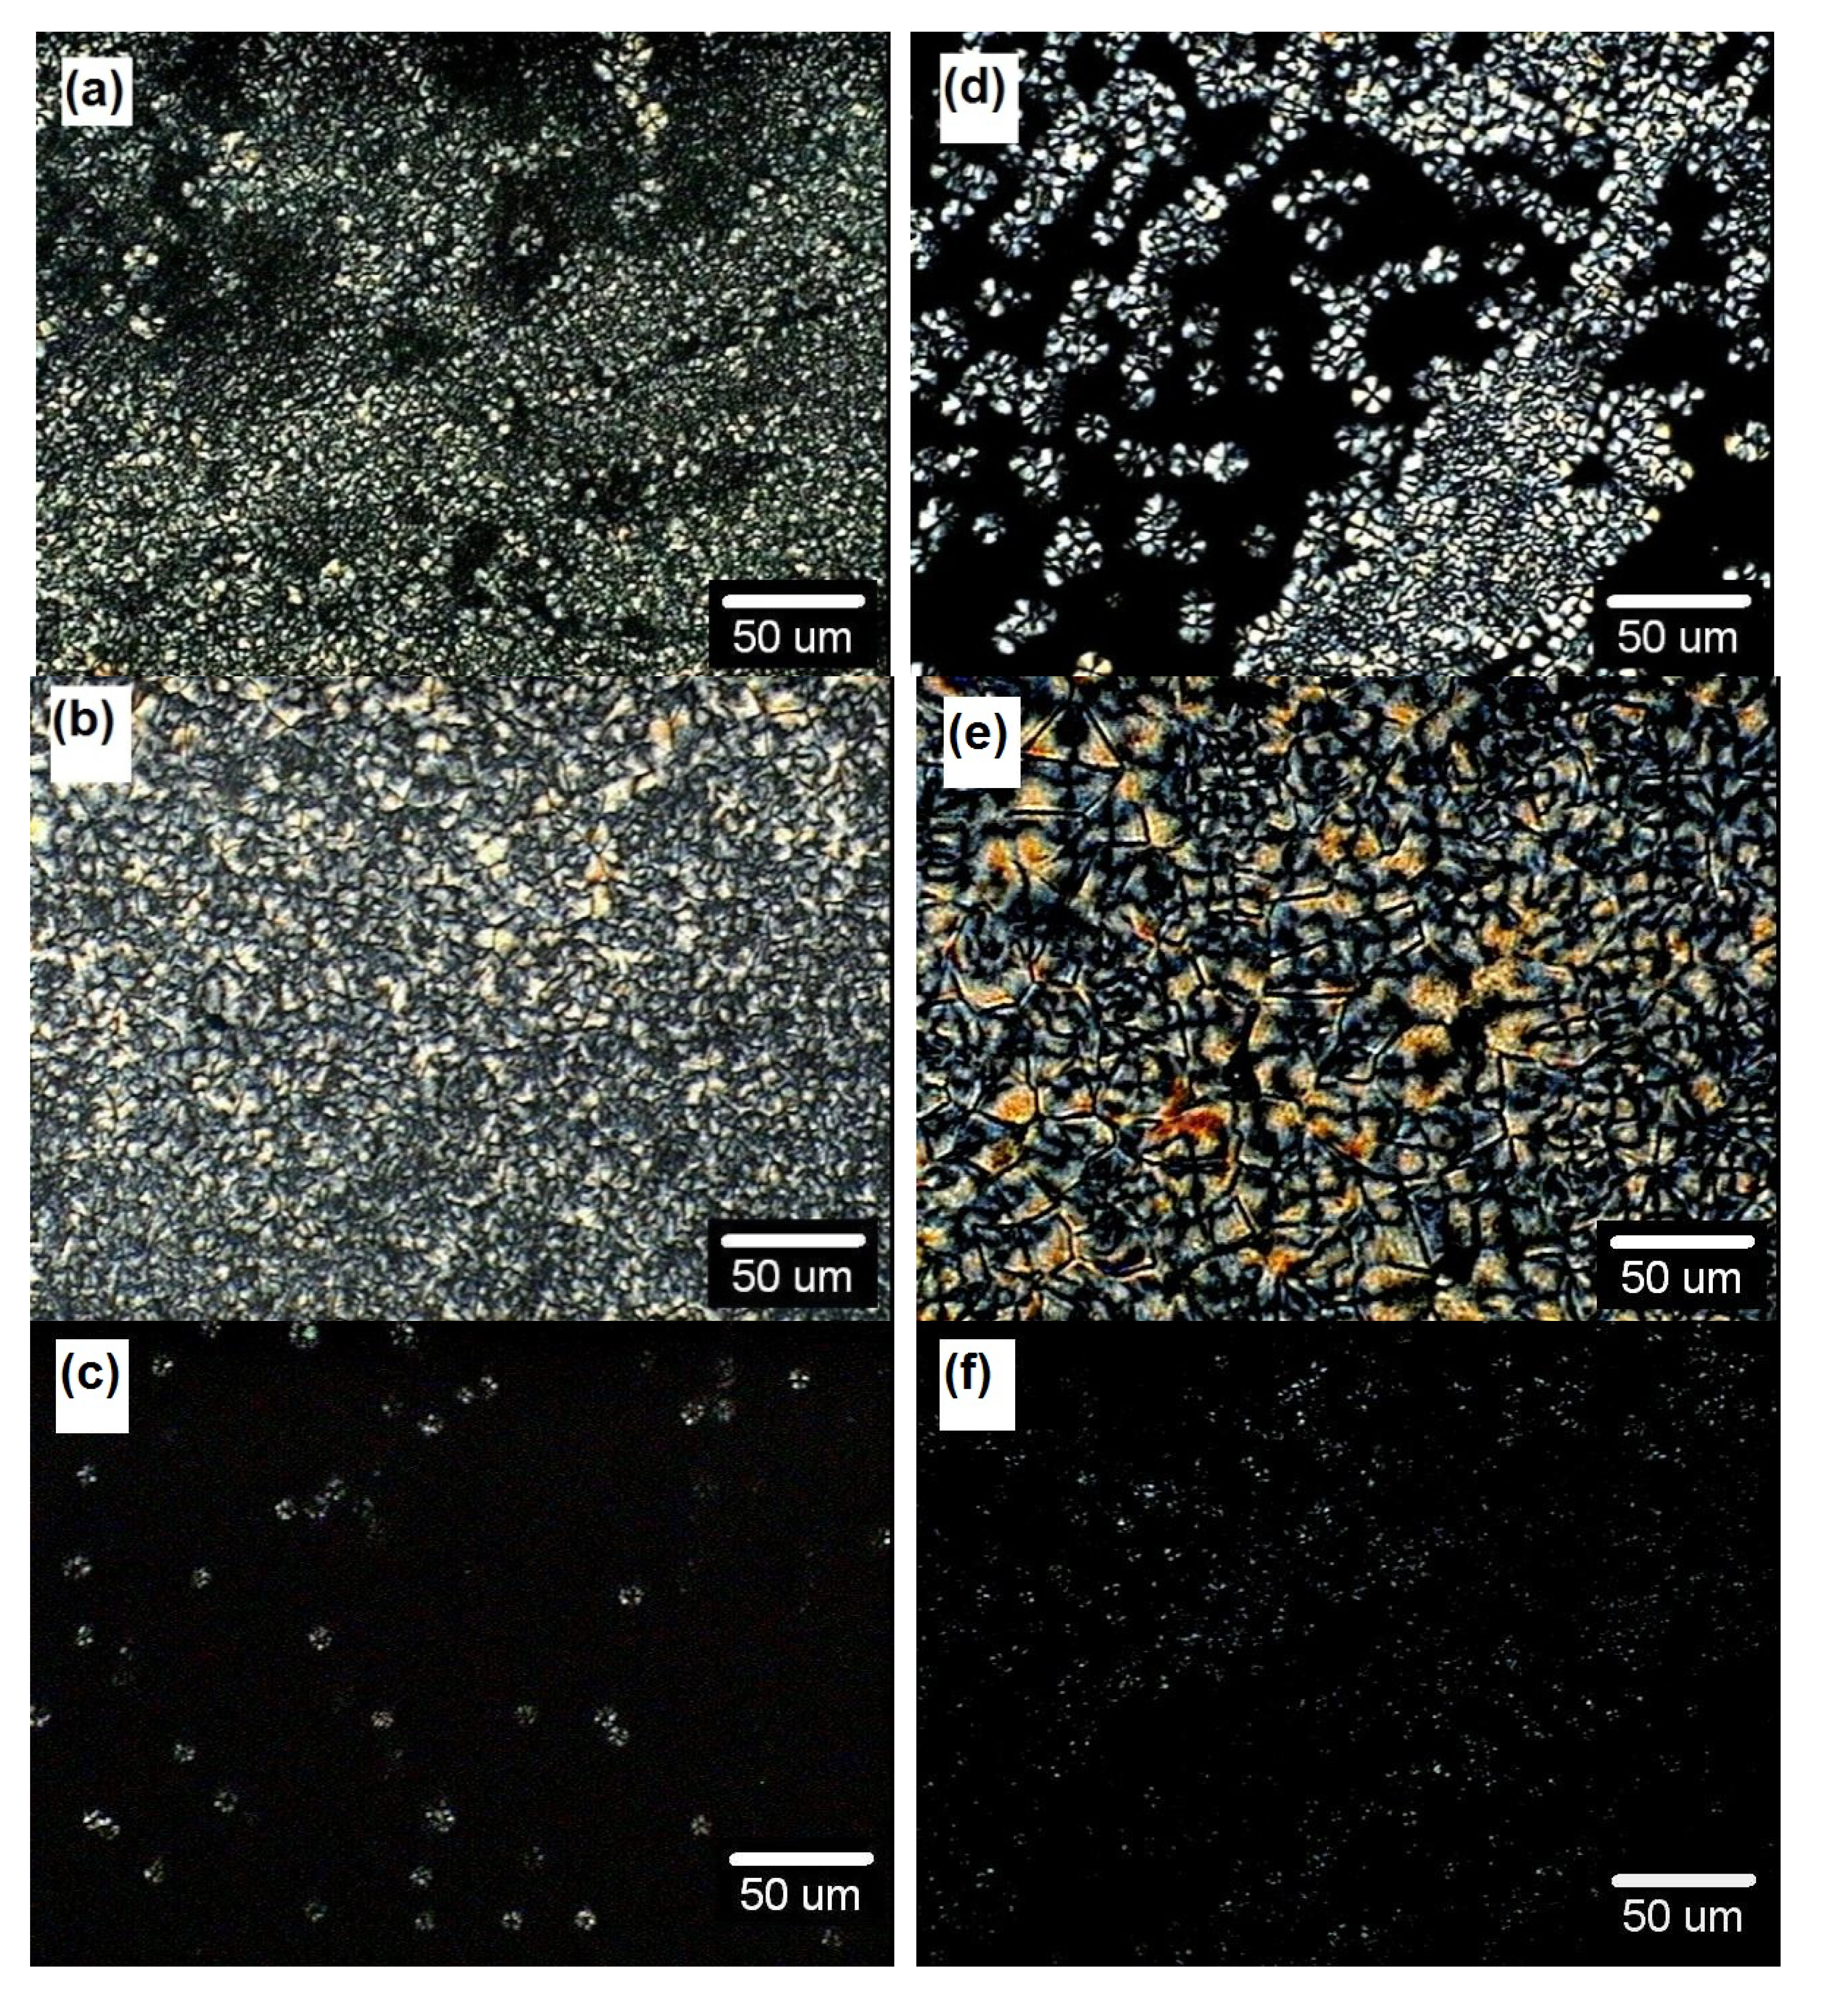
Figure 2.
Polarizing optical microscopy (POM) micrographs of isothermally crystallized (5 min) of PET samples at different temperatures. PET-LMw: (a) 140 °C; (b) 180 °C; and (c) 230 °C. PET-HMw: (d) 140 °C; (e) 180 °C; and (f) 230 °C.
Figure 2.
Polarizing optical microscopy (POM) micrographs of isothermally crystallized (5 min) of PET samples at different temperatures. PET-LMw: (a) 140 °C; (b) 180 °C; and (c) 230 °C. PET-HMw: (d) 140 °C; (e) 180 °C; and (f) 230 °C.
Figure 1 and
Figure 2 also show differences in crystallization as a function of molecular weight. In general, the increase of this variable produces both a systematic decrease in the crystallization rate and an increase in the amount of amorphous material. This behavior is attributed to the fact that a bigger macromolecular chain will require a greater amount of energy to effectively diffuse on the crystal growth interface; thus, the material crystallizes at a slower rate and facilitates the generation of larger sets of amorphous sections.
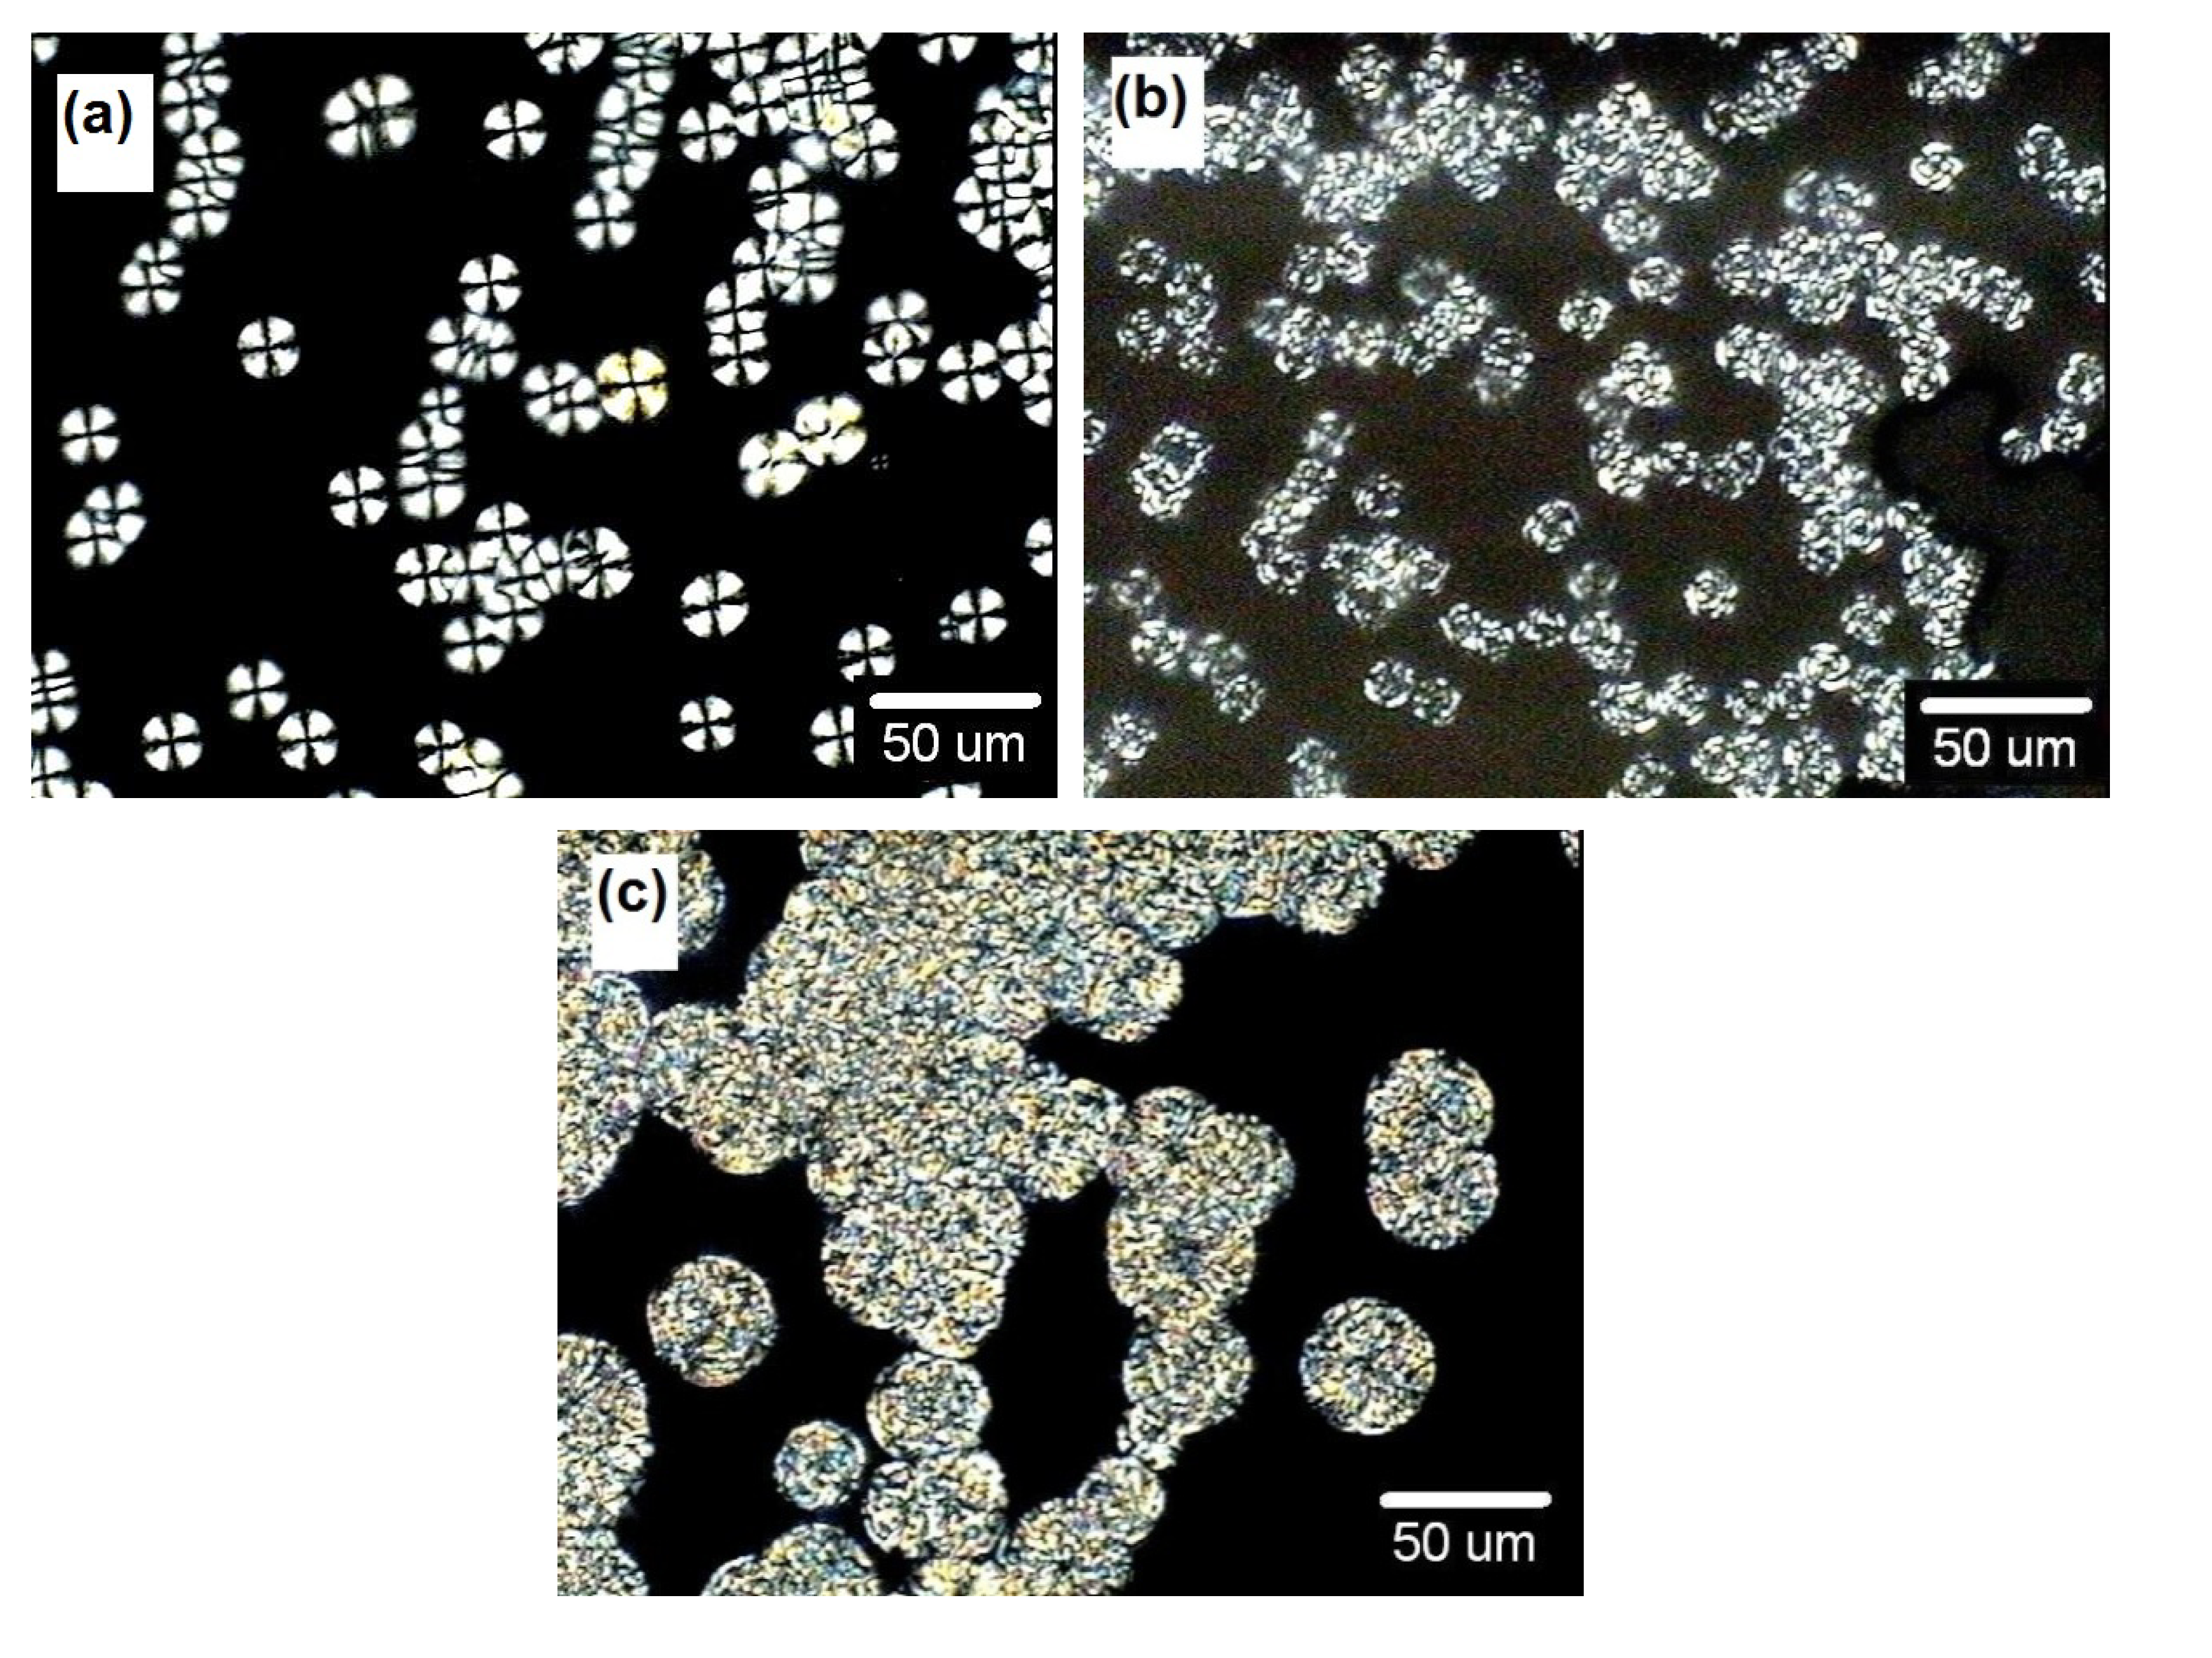
Representative micrographs of each crystallization region for PET, as a function of
Tc, are presented in
Figure 3. The typical spherulite morphology is observed in regions
r1 (
Figure 3a) and
r2 (
Figure 3b). In
r3 (
Figure 3c), the optical texture is a little different and seems to correspond to a disk-like morphology. However, by SEM analysis (
Figure 4a–c are regions
r1,
r2 and
r3, respectively) such disk-like morphology was not detected. Also, the radius of spherulites in
r3 was much bigger compared to those observed in the other two regions. Similar results for PET were found by van Antwerpen and van Krevelen, which have determined a maximum spherulite radius for the highest
Tc (200–210 °C) [
4].
Figure 3.
POM micrographs of isothermally crystallized PET-HMw at (a) 200 °C and 1 min; (b) 220 °C and 5 min; and (c) 230 °C and 12 min.
Figure 3.
POM micrographs of isothermally crystallized PET-HMw at (a) 200 °C and 1 min; (b) 220 °C and 5 min; and (c) 230 °C and 12 min.
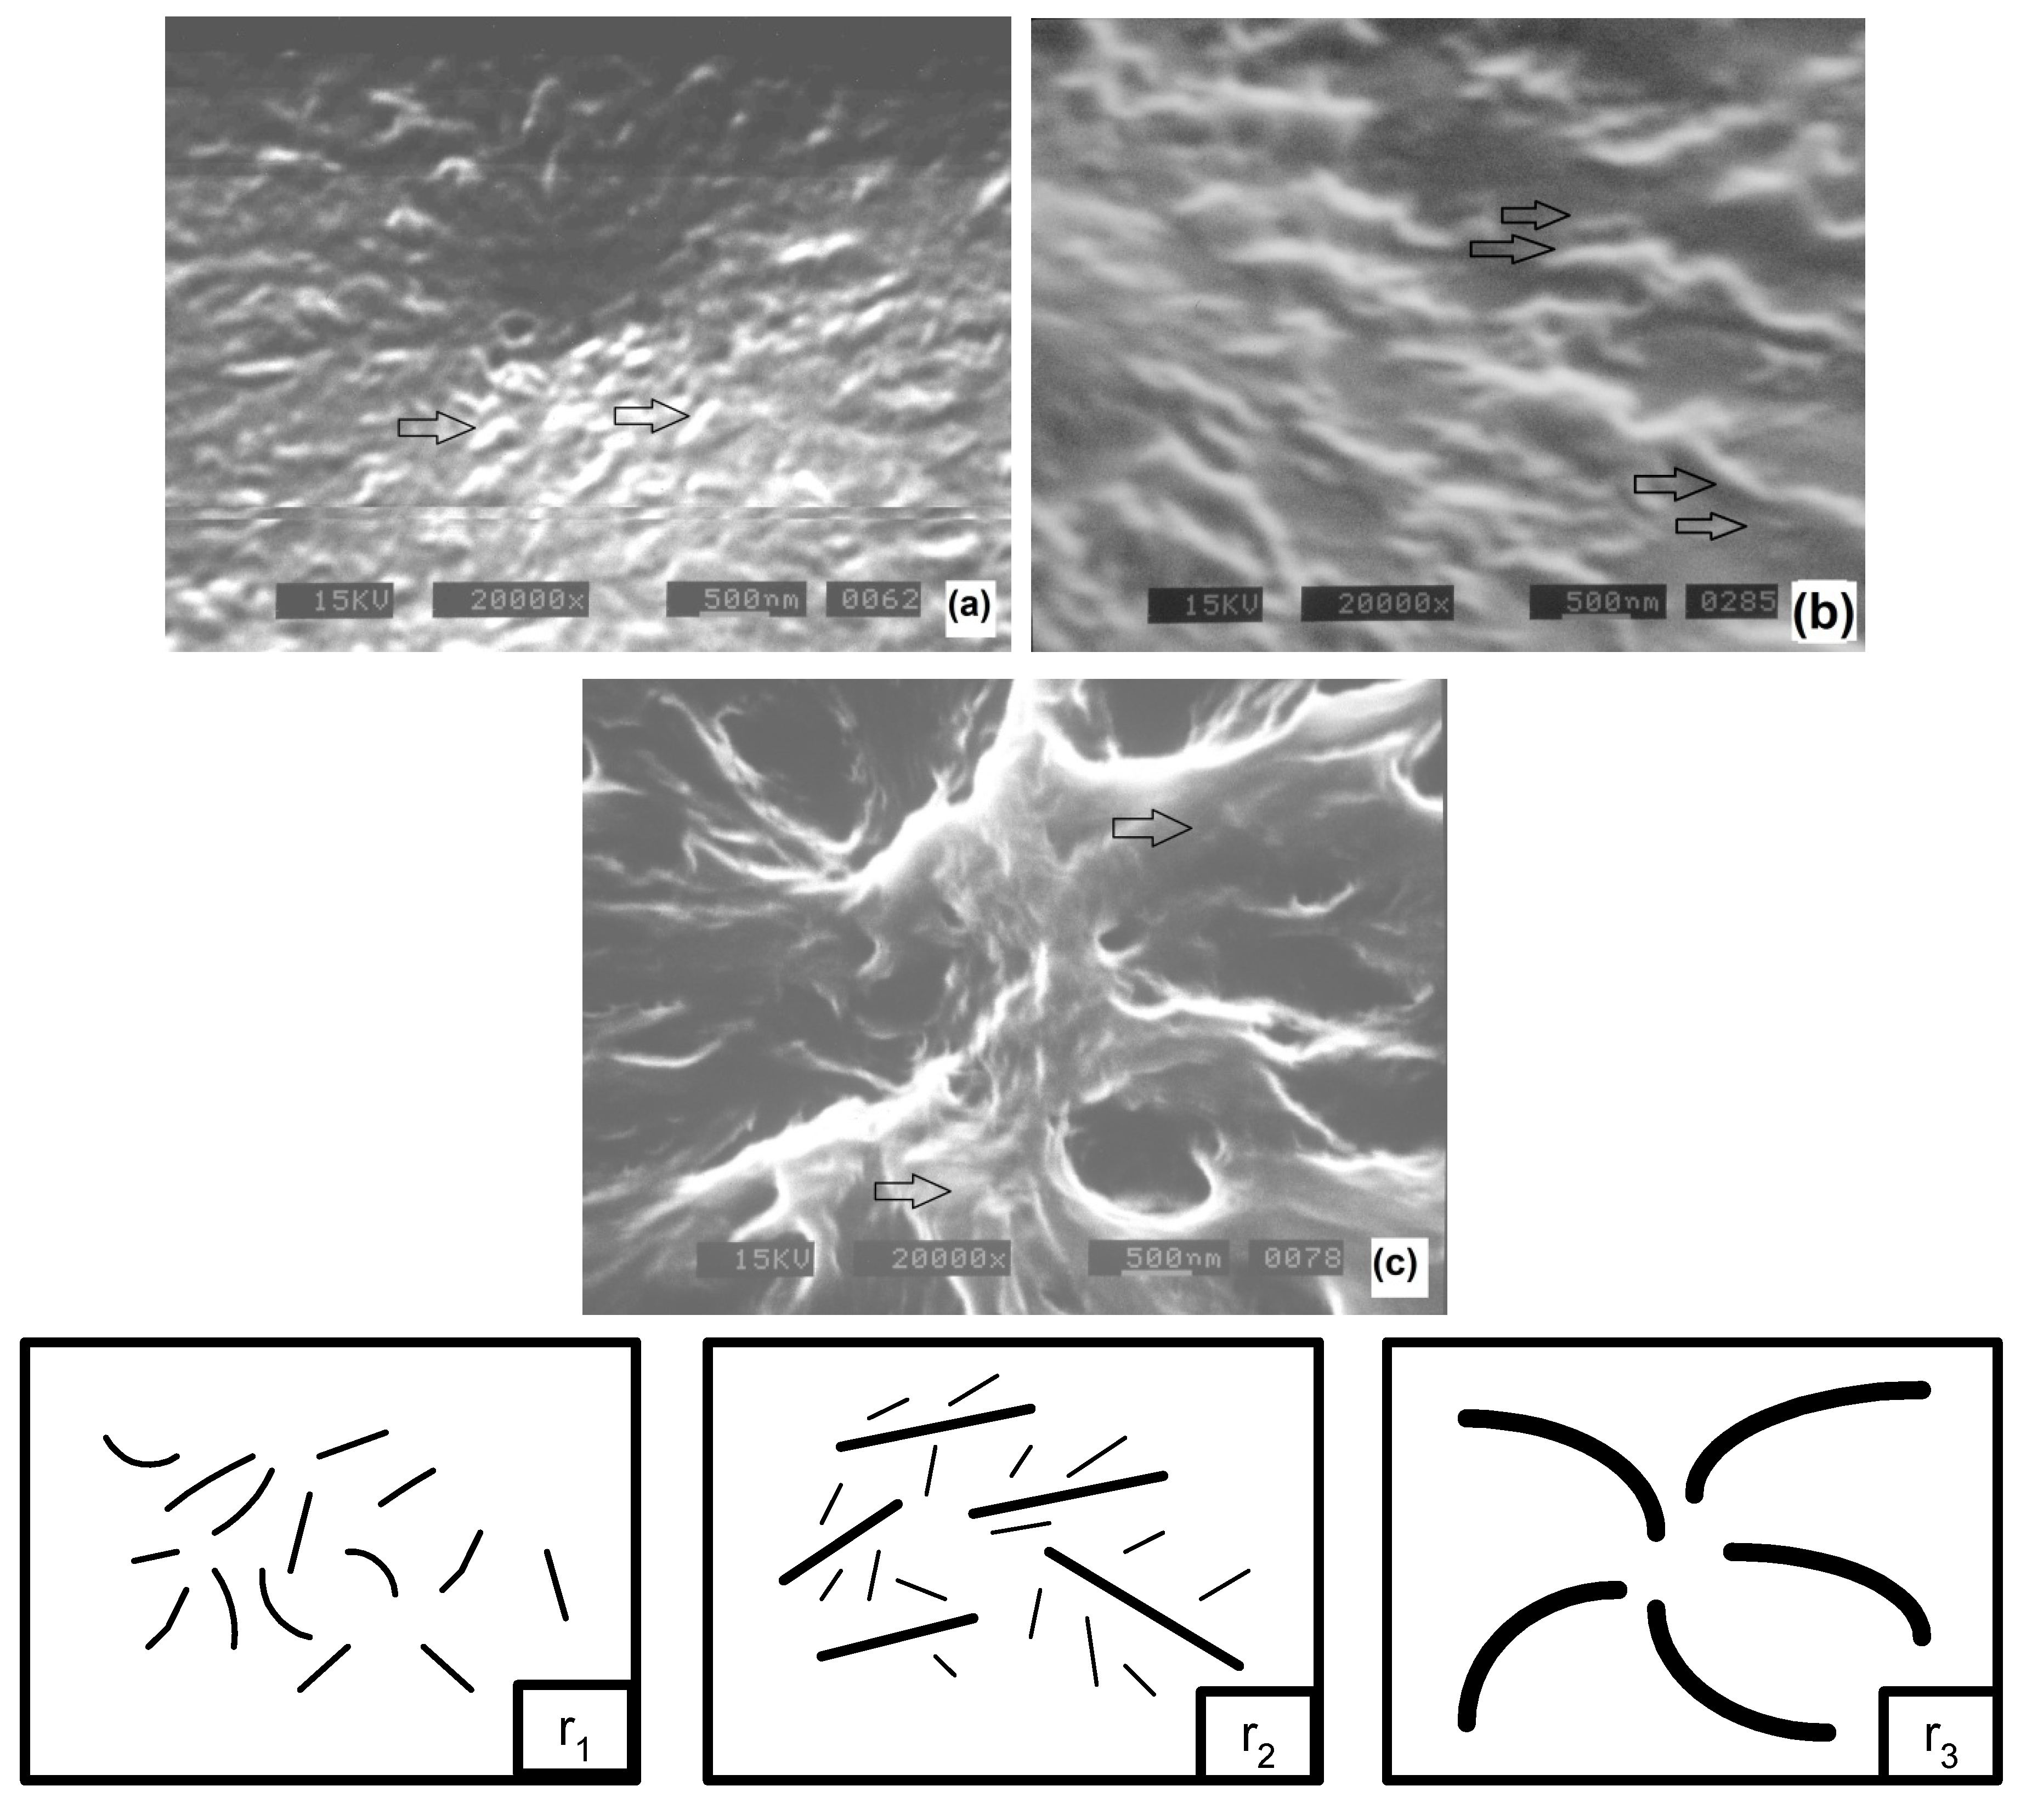
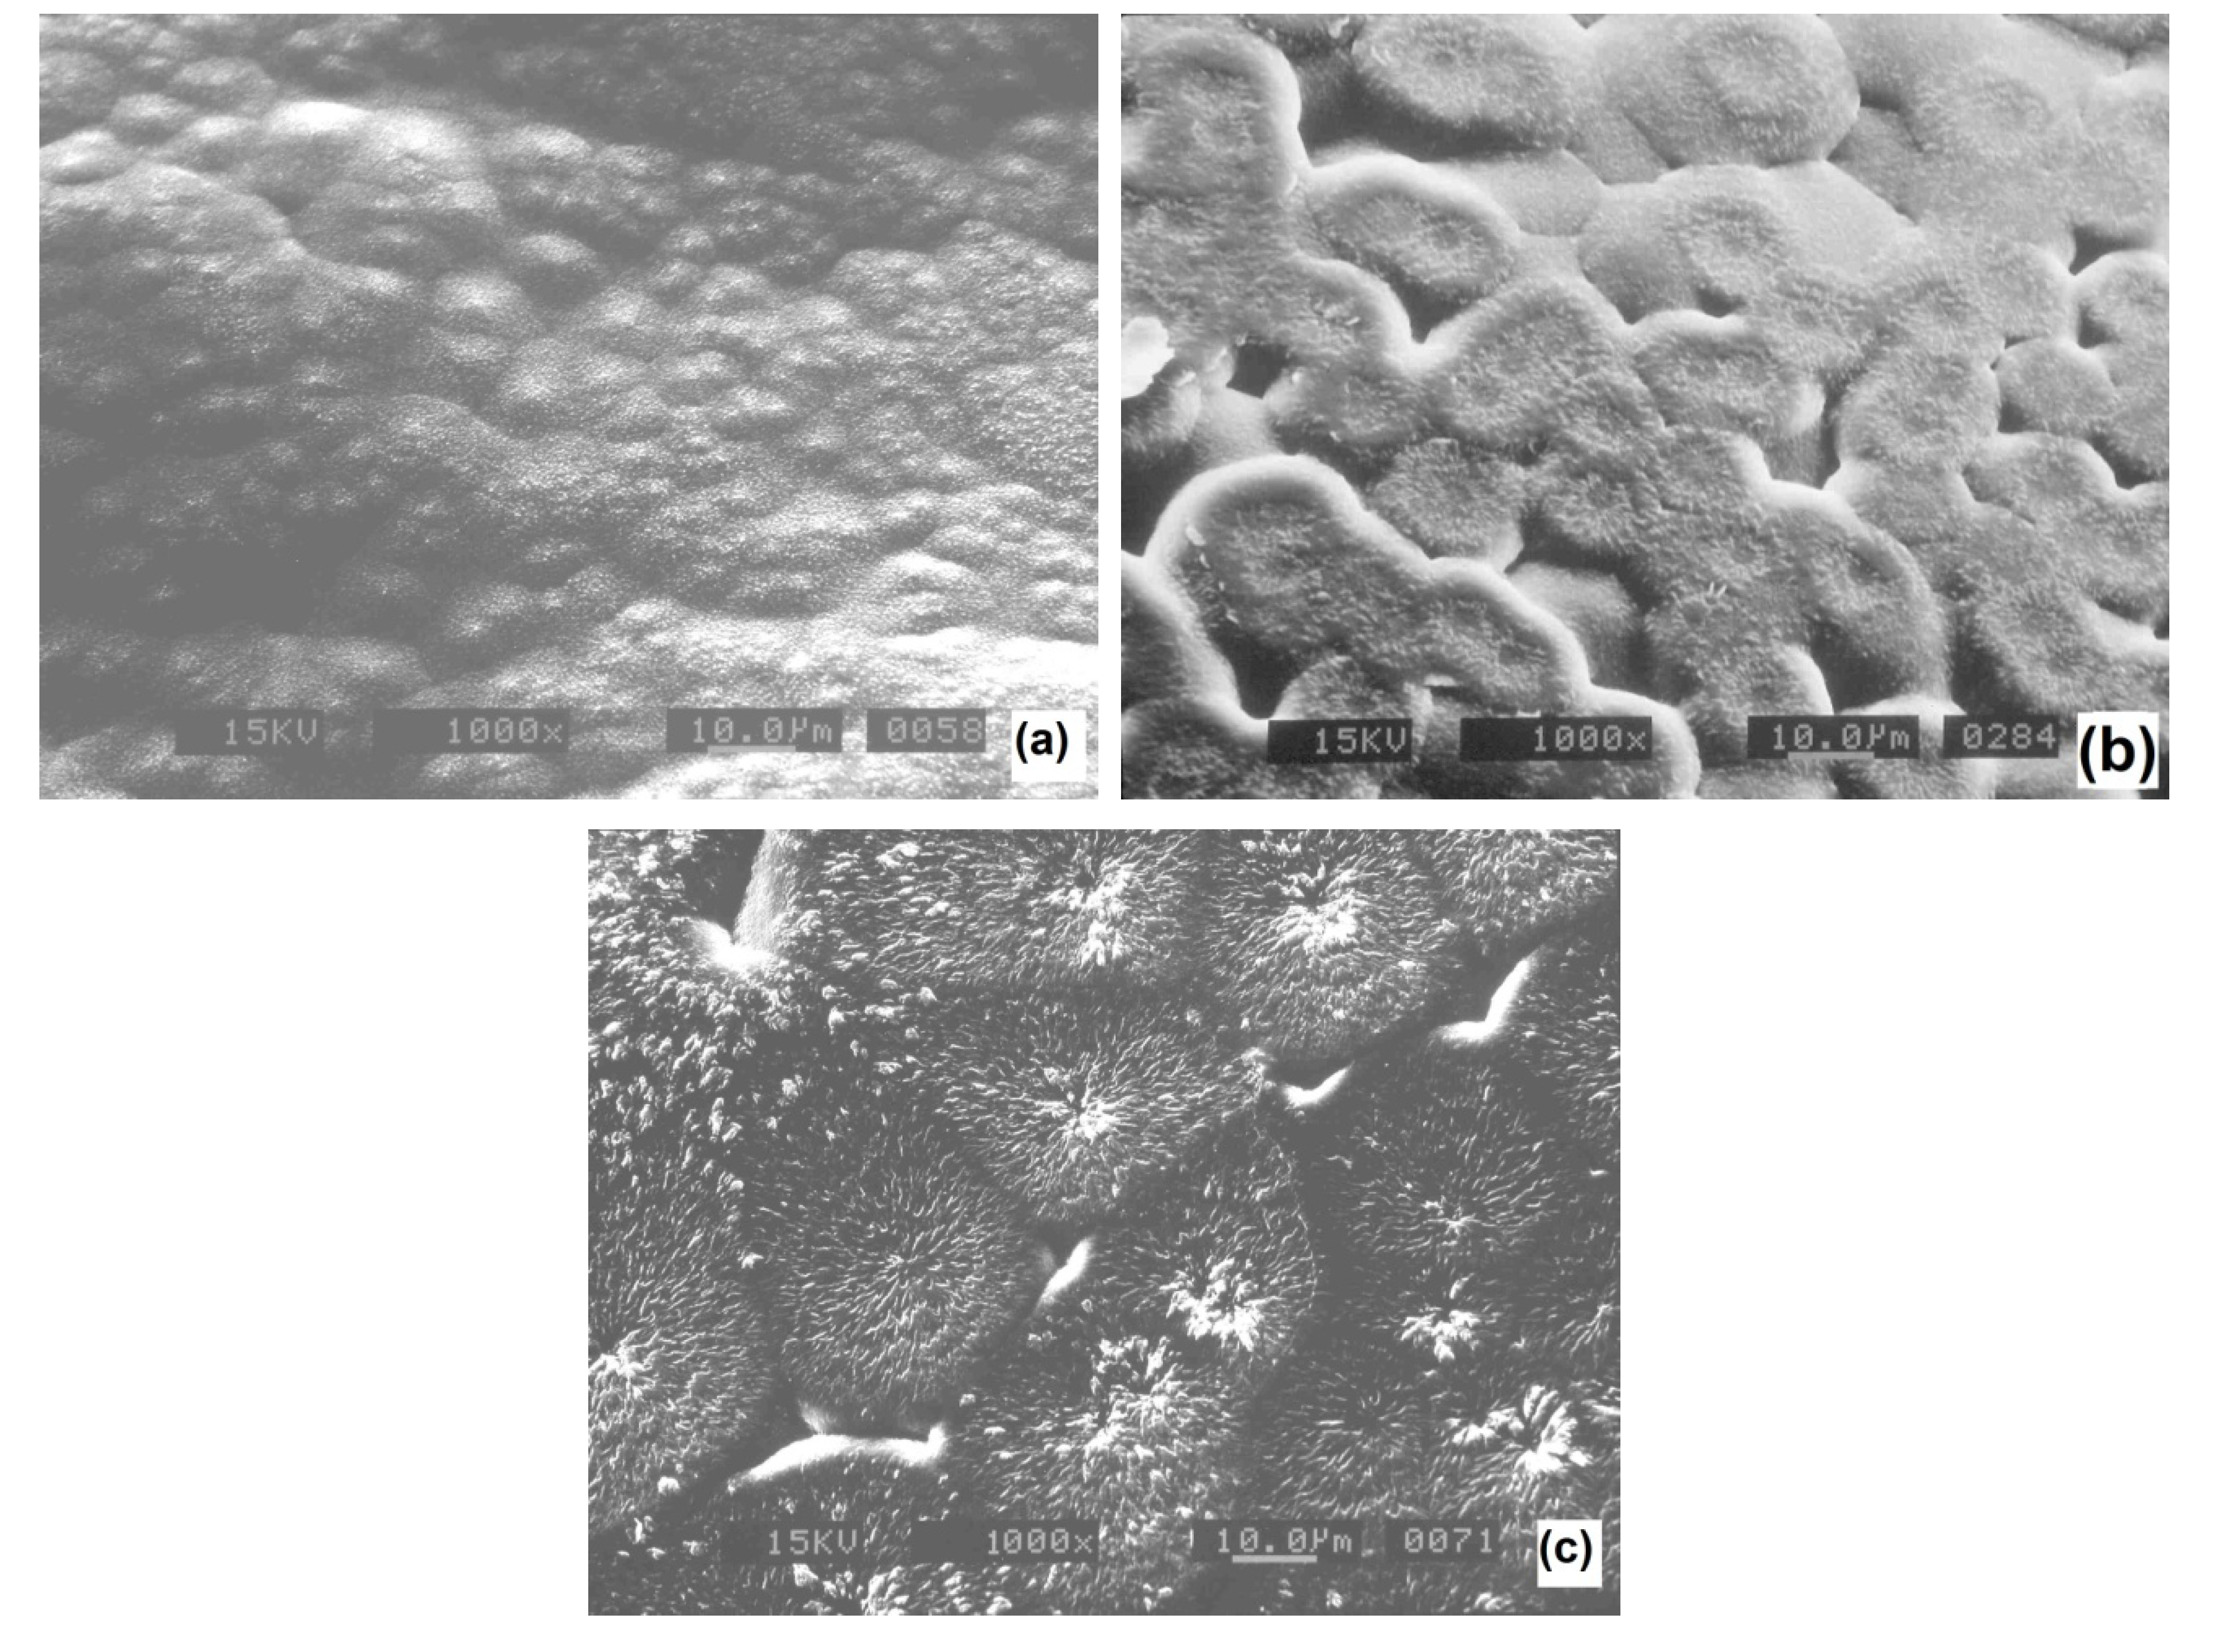
Figure 4.
SEM micrographs of isothermally crystallized (30 min) PET-HMw at different temperatures: (a) 140 °C; (b) 200 °C; and (c) 220 °C.
Figure 4.
SEM micrographs of isothermally crystallized (30 min) PET-HMw at different temperatures: (a) 140 °C; (b) 200 °C; and (c) 220 °C.
On the other hand, Hoffman
et al. reported three different growth regimes [
9]. In one of them, the nucleation rate is high while the diffusion rate is low; in the opposite regime, contrarily, the nucleation rate is low while diffusion rate is high. Then, it is expected that at one temperature limit, the formation of the nuclei dominates (high nucleation), while at the other one, diffusion of the material dominates and produces a small amount of nuclei (low nucleation). As seen in the POM and SEM micrographs in this study, high nucleation dominates at lower
Tc, while diffusion dominates at higher
Tc.
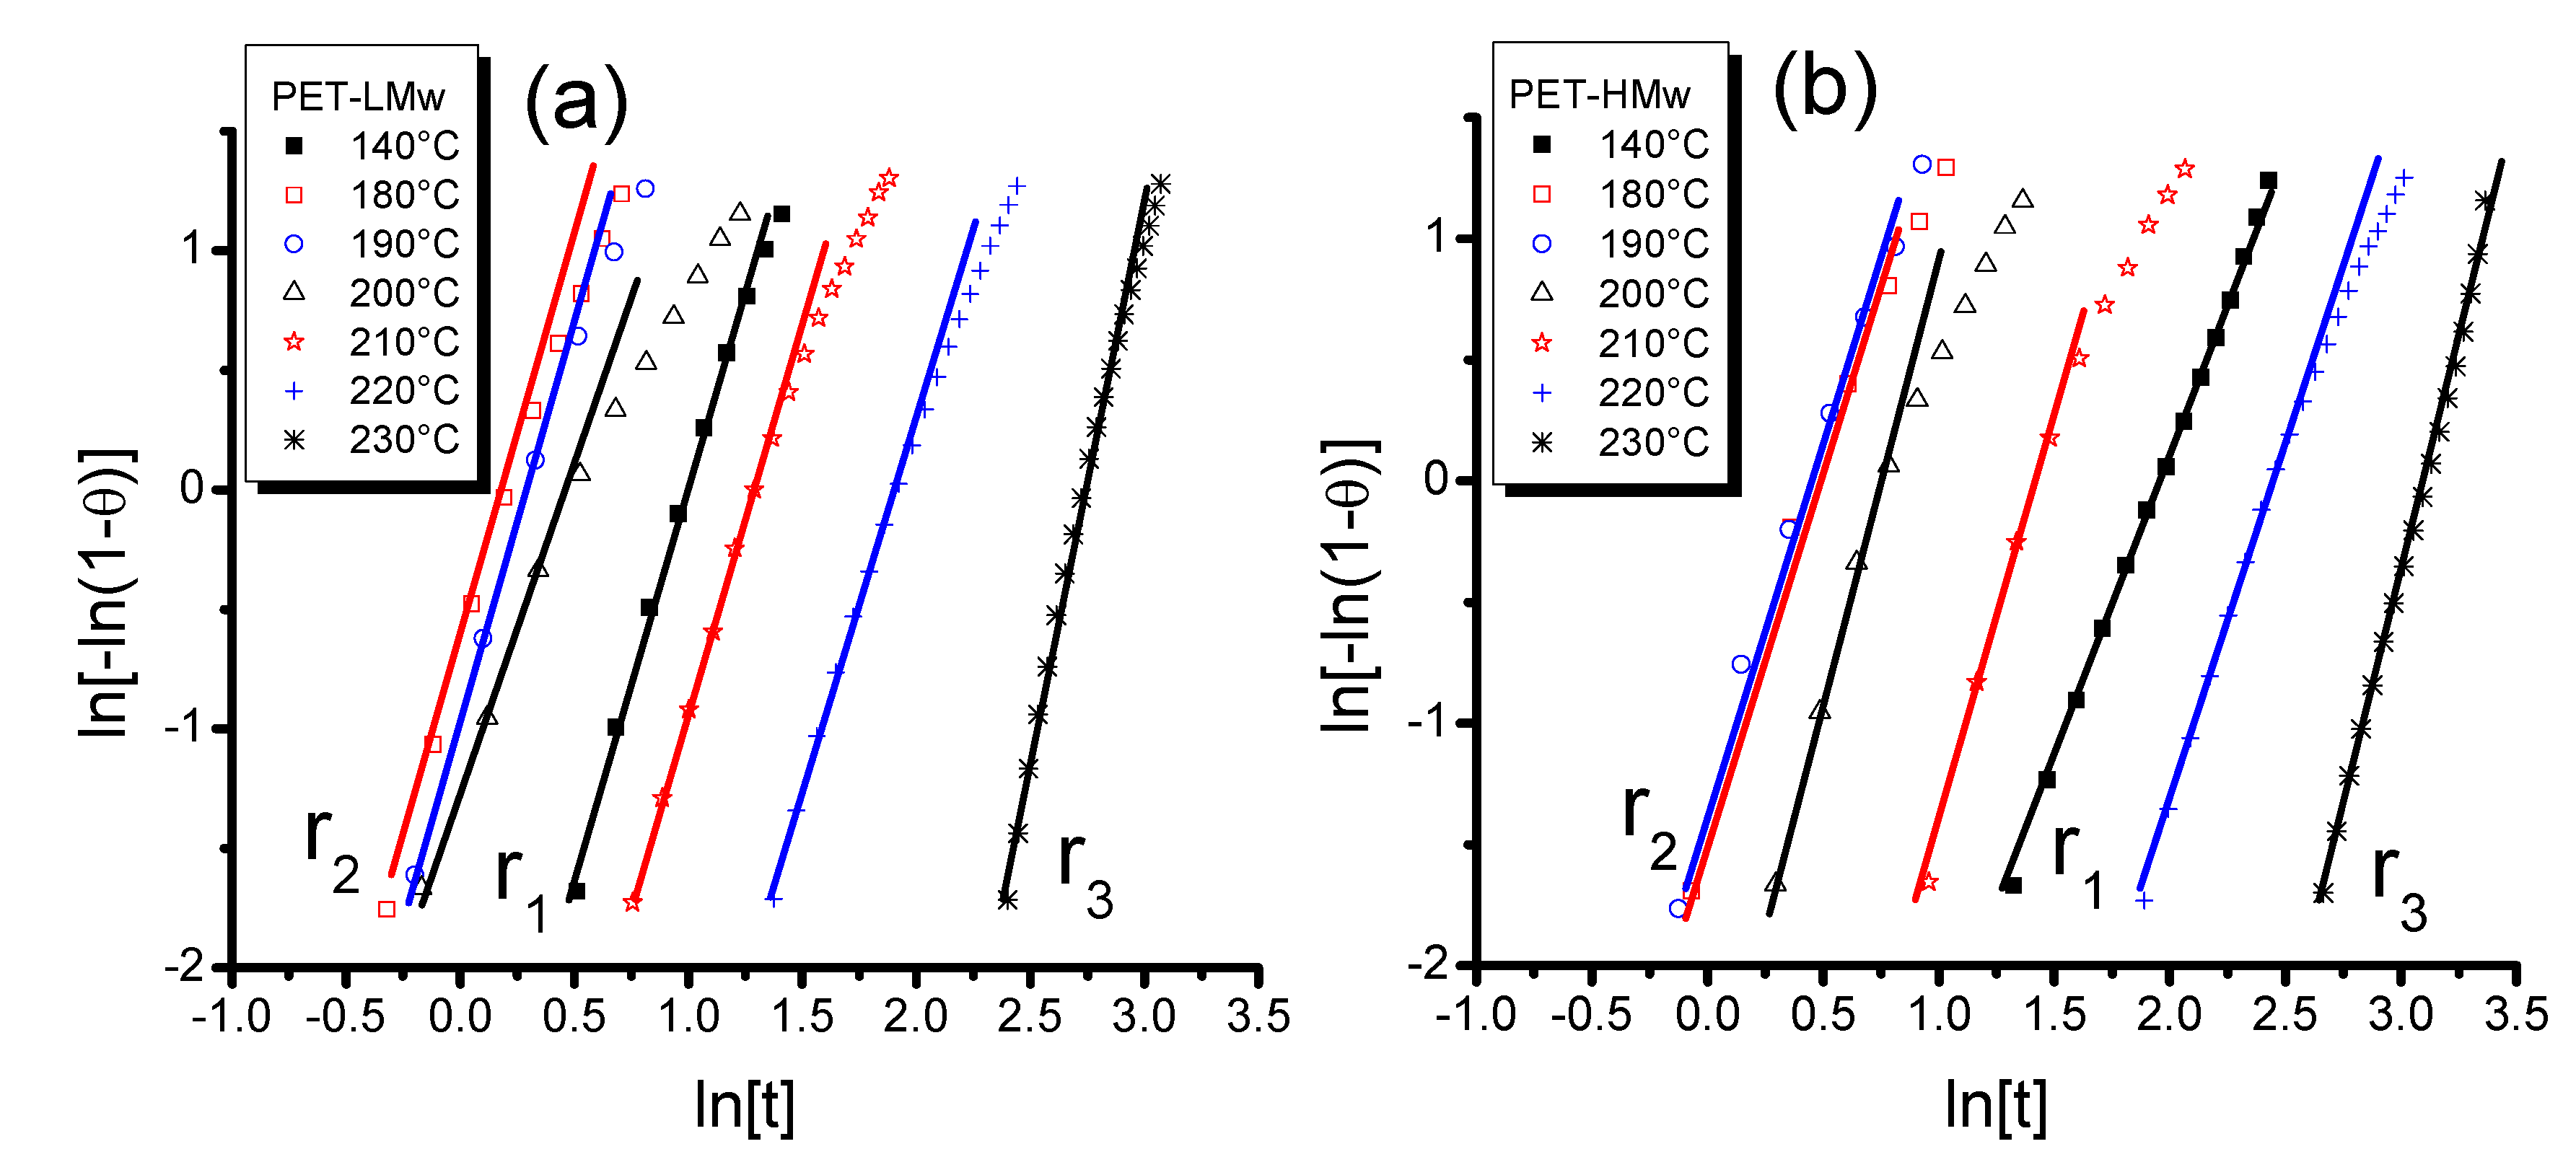
The Avrami equation was applied to data obtained from isothermal crystallization experiments (
Figure 1) and results are shown in
Figure 5 [
12,
13,
14]. For the range of temperatures in
r2, a deviation of the initial slope could be associated to secondary crystallization (
Table 1), and this event is occurring in conjunction or in a subsequent stage with respect to the primary crystallization mechanism [
15]. In general, secondary crystallization is insignificant at low
Tc (140–170 °C) and high
Tc (220–230 °C), whereas at intermediate
Tc (180–210 °C) it becomes important. For PET-LMw, the Avrami exponent (
n) is close to 3.0 in
r1 and
r2, but it attains values near 4.0 in
r3. For a spherulite morphology, values around 3 indicate an instantaneous nucleation along with a shape of growth, which produces small amounts of amorphous material [
15]. Values near 4 indicate the same shape growth, although in this case the crystallization is homogeneous and leads to the formation of spherulites of different size. Micrographs in
Figure 3 corroborate these predictions. The two slopes in
r2 suggest the formation of two crystal families. For PET-HMw, the exponents were on average close to 2.5 and 3 for
r1 and
r2, respectively. They were even close to 4 in
r3. For a spherulitic morphology, the value 2.5 indicates homogeneous nucleation with a shape growth by diffusion, producing important amorphous zones as can be seen in
Figure 3. These exponents agree with those reported for some authors. For instance, Rybnikar reported an
n = 4 for
Tc > 217 °C [
16], while Keller
et al. found
n values close to 3 in the range of 170–220 °C, which is consistent with results obtained at intermediate and high
Tc in the present work [
17].
Figure 5.
Avrami plots obtained from transmitted depolarized light intensity of different PET samples isothermally crystallized at different temperatures: (a) PET-LMw; and (b) PET-HMw.
Figure 5.
Avrami plots obtained from transmitted depolarized light intensity of different PET samples isothermally crystallized at different temperatures: (a) PET-LMw; and (b) PET-HMw.
Table 1.
Morphological parameters from Avrami analysis of isothermally crystallized PET samples at different temperatures.
Table 1.
Morphological parameters from Avrami analysis of isothermally crystallized PET samples at different temperatures.
| Temperature | n LMw | n HMw | Secondary crystallization | Slopes | Crystalline families |
|---|
| 140 °C | 2.8 | 2.2 | Null | 1 | 1 |
| 150 °C | 3.1 | 1.9 | Low | 1 | 1 |
| 160 °C | 2.9 | 2.5 | Low | 1 | 1 |
| 170 °C | 3.3 | 3.0 | Low | 1 | 1 |
| 180 °C | 3.3 | 3.3 | Medium | 2 | 2 |
| 190 °C | 3.0 | 3.1 | Medium | 2 | 2 |
| 200 °C | 2.7 | 3.6 | High | 2 | 2 |
| 210 °C | 2.9 | 3.3 | Medium | 2 | 2 |
| 220 °C | 3.7 | 3.1 | Low | 1 | 1 |
| 230 °C | 4.7 | 3.9 | Null | 1 | 1 |
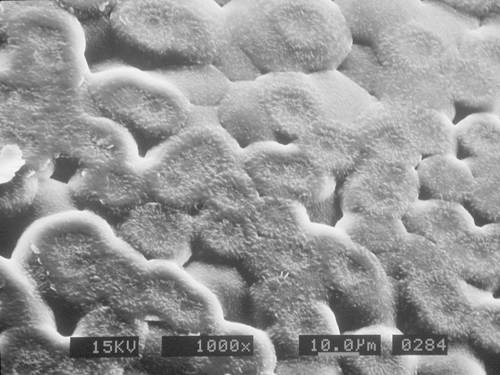
The presence of one or two crystalline lamellar stack families was also corroborated by SEM, as it is observed in micrographs depicted in
Figure 6. At 160 °C (
Figure 6a or
r1) and 220 °C (
Figure 6c or
r3) crystals are uniform, although in
r1 they are small and thin while in
r3 they are big and thick (arrows in the figure). In contrast, at 200 °C (
Figure 6b or
r2) a mixture of crystals, or two crystalline lamellar stack families of different size, is readily apparent (arrows in the figure). The observed thicker crystals in
r3 is in agreement with crystallization studies on PET and some other polymers like low density polyethylene (LDPE), but the presence of the two crystal lamellar stack families was not reported [
6,
18].
Figure 6.
SEM micrographs of isothermally crystallized (30 min) PET-HMw at different temperatures: (a) 140 °C; (b) 200 °C; and (c) 220 °C.
Figure 6.
SEM micrographs of isothermally crystallized (30 min) PET-HMw at different temperatures: (a) 140 °C; (b) 200 °C; and (c) 220 °C.
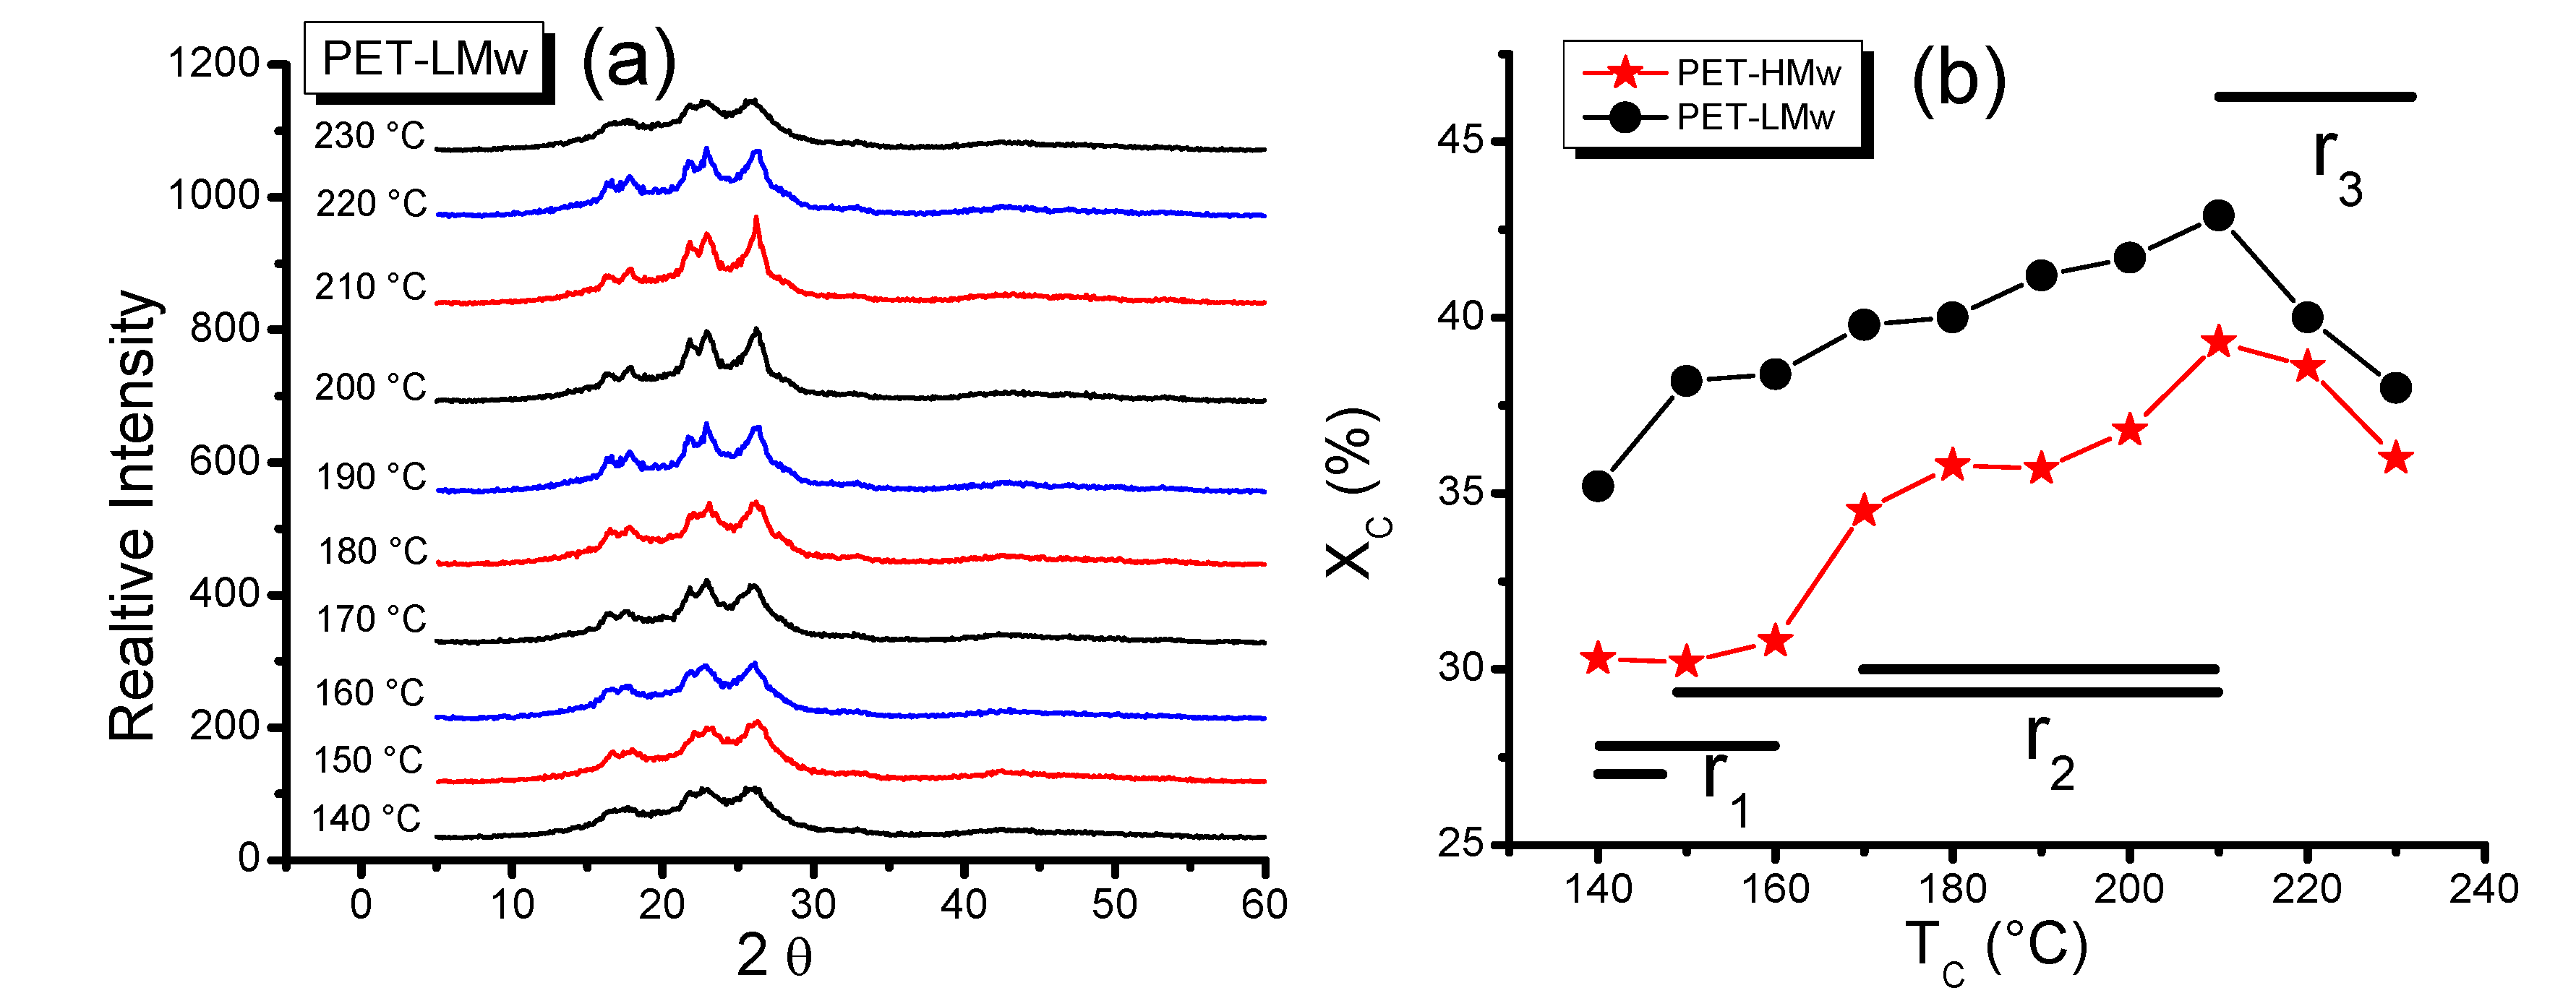
Wide angle X-ray diffraction patterns of PET-LMw samples crystallized at different
Tc are shown in
Figure 7a. Their analysis indicates a triclinic structure for this polymer, as it was reported by Farikov
et al. [
19]. From patterns, a plot of crystalline degree
versus Tc (
Figure 7b) was obtained and again three regions can be clearly delimited.
In
r1, the crystalline degree (%
Xc) for PET-HMw is low (near 30%) and remains almost constant along this region (140–160 °C), while for PET-LMw this parameter is higher (~35%) but limited to only one
Tc (140 °C). The constant %
Xc values observed for high molecular weight PET in
r1 suggest that mobility or diffusion of chains remains similar in this temperature region. From
r1 to
r2, there is a sudden increase in crystallinity, and in
r2 the cristallinity increases gradually up to a maximum (210 °C). This behavior can be associated with an increase in molecular diffusion that favors the molecular arrangement. In
r3 the crystalline degree shows a sharp decrease that can be explained in terms of a combination of molecular diffusion and molecular vibration. Both increase with temperature, although the former favors the crystal formation and the later perturbs it and becomes dominant at the highest temperatures. In crystallizing PET for longer times at different
Tc, Groenickx
et al. found that crystallinity increases monotonically up to a maximum [
6]. For the highest
Tc, no decrease in crystallinity was observed due to the relatively long time (17 h) used in their experiments [
6]. For instance, Karagiannidis
et al. reported crystalline degree of 31.4% for a PET sample crystallized at 115 °C for 30 min [
20], and Zhang
et al. reported a 28.6% and 30.9% values for samples crystallized at 110 °C for 20 and 40 min respectively, which is consistent with results obtained at low
Tc in the present work [
21].
Figure 7.
(a) Wide angle X-ray diffraction (WAXD) patterns of isothermally crystallized (30 min) PET-LMw at different temperatures; and (b) Crystalline degree of isothermally crystallized PET samples at different temperatures. Data were obtained from WAXD patterns.
Figure 7.
(a) Wide angle X-ray diffraction (WAXD) patterns of isothermally crystallized (30 min) PET-LMw at different temperatures; and (b) Crystalline degree of isothermally crystallized PET samples at different temperatures. Data were obtained from WAXD patterns.
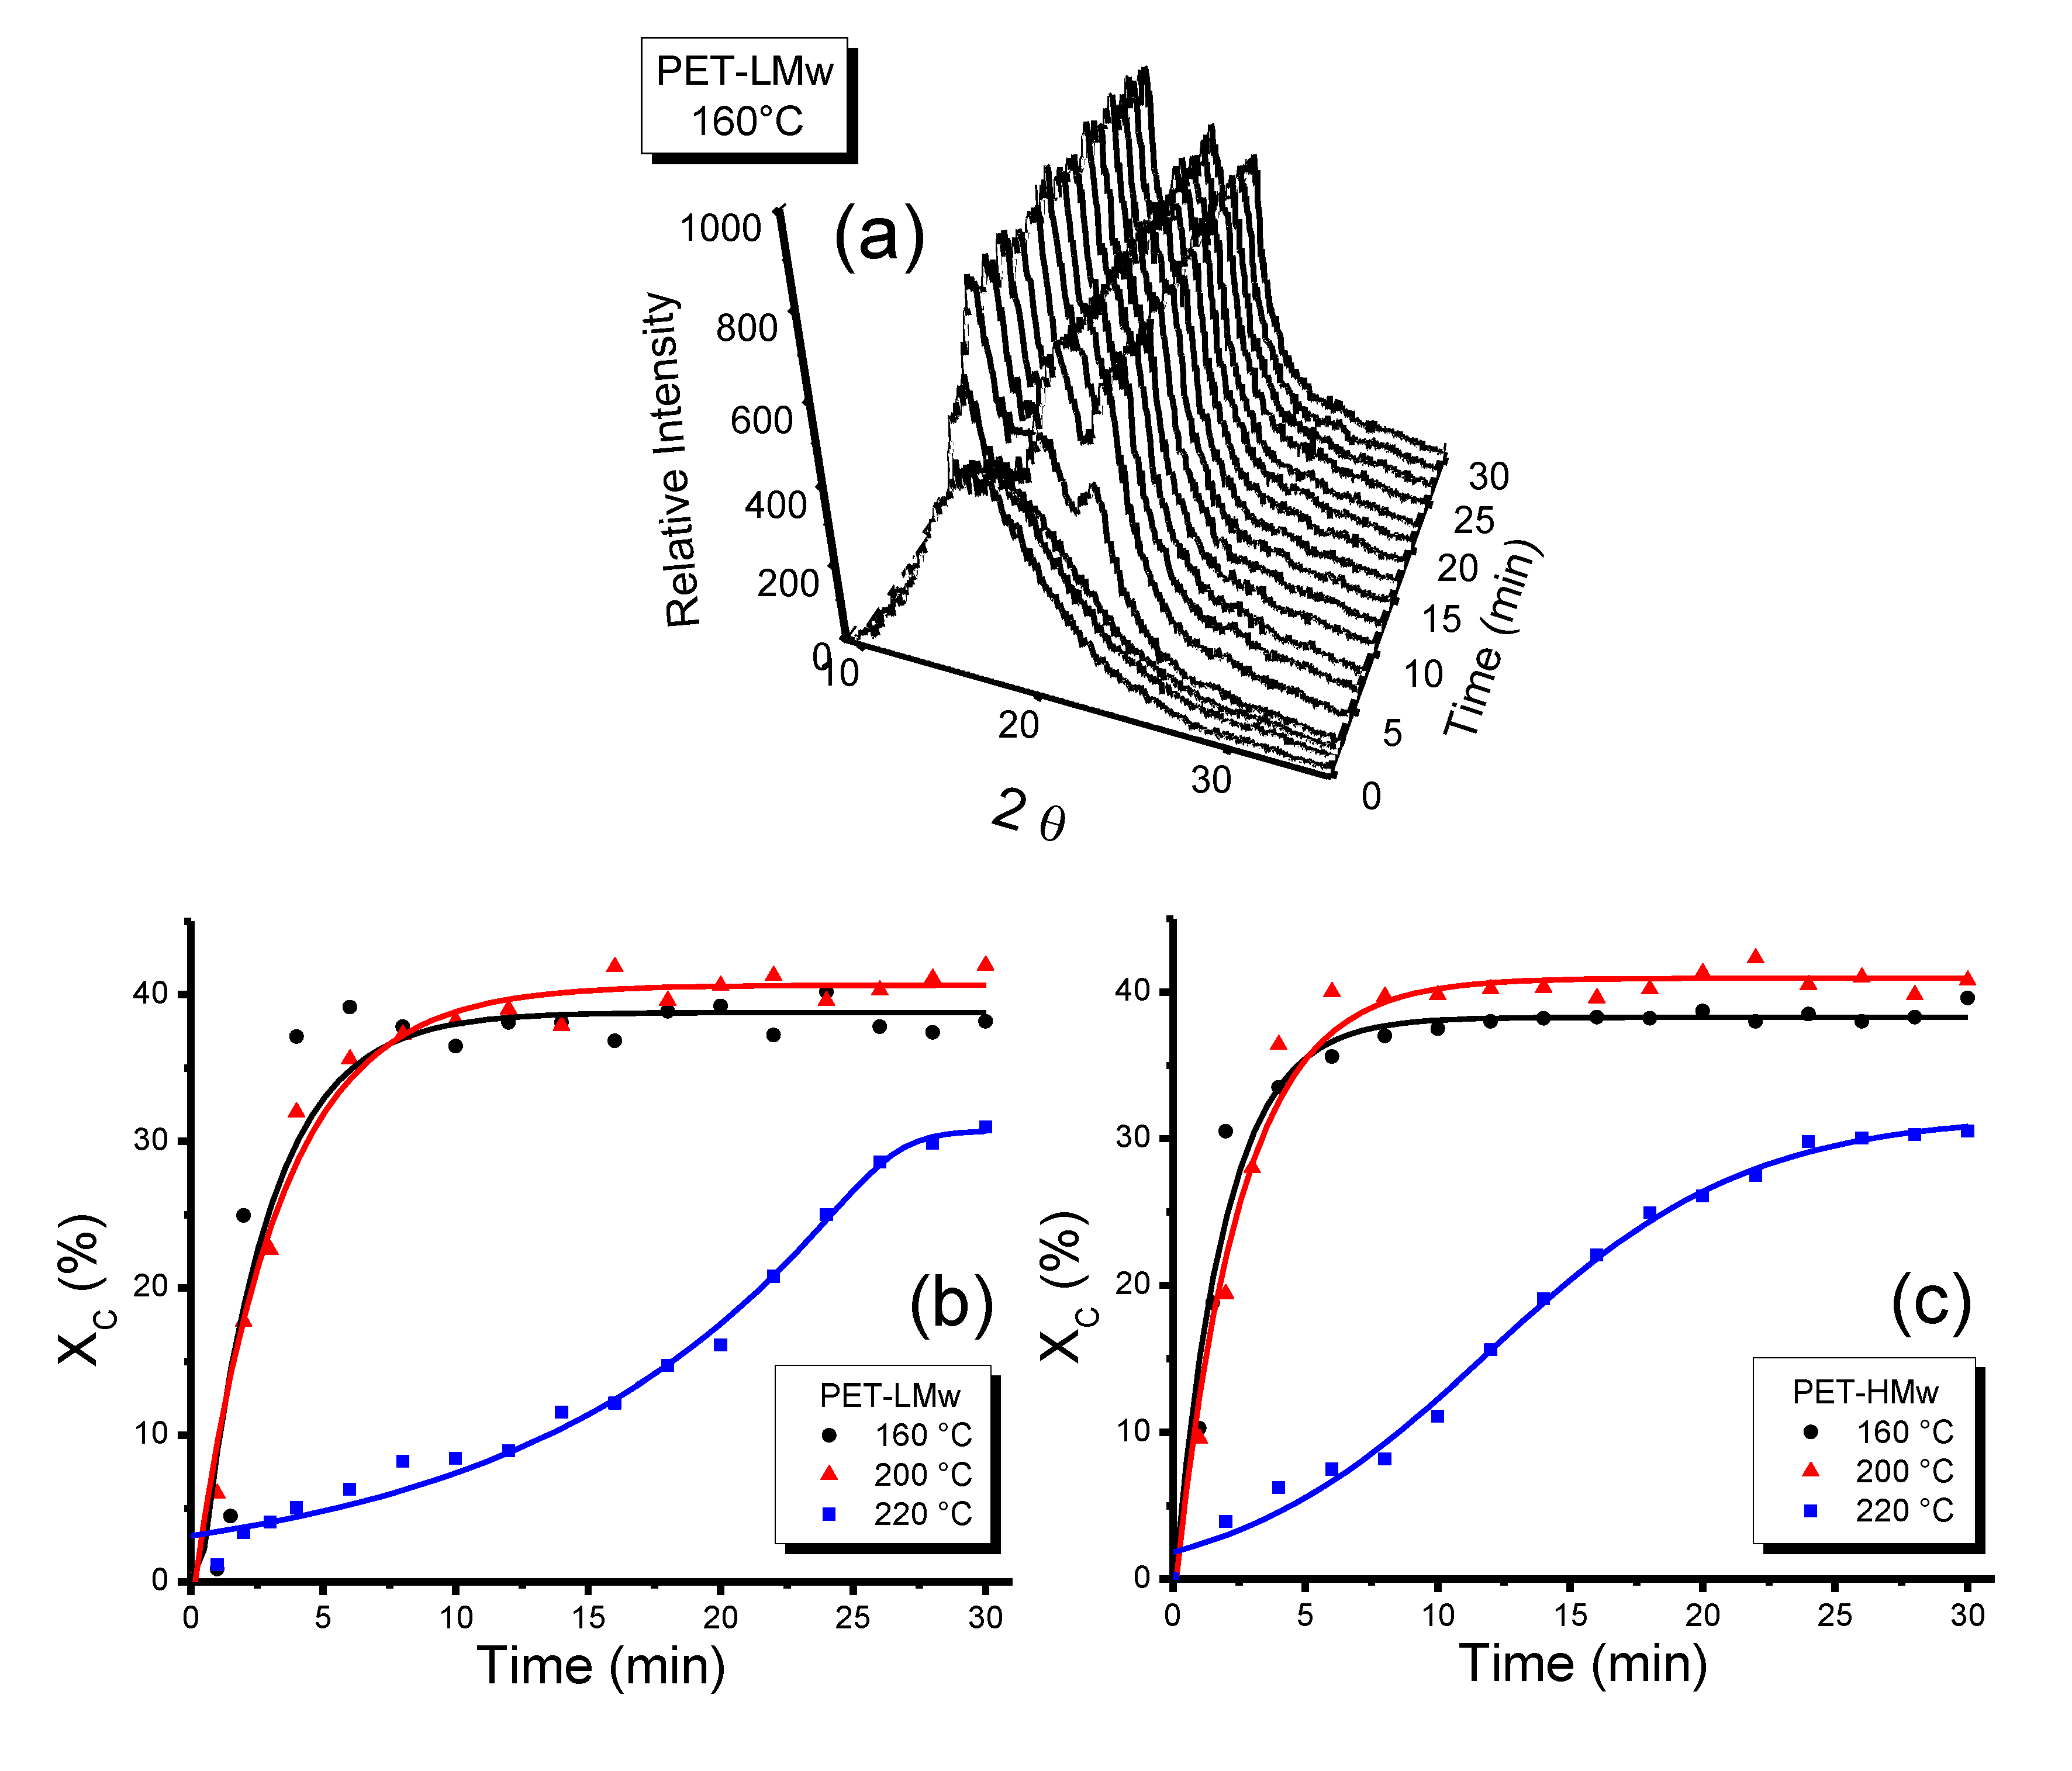
Figure 8a shows the evolution of the X-ray diffraction patterns, as a function of time, obtained by using time-resolved synchrotron radiation (TR-WAXD) and the crystalline degree (%
Xc) was plotted against time in
Figure 8b,c. Samples isothermally crystallized for 30 min were chosen for this analysis. It can be seen that at intermediate
Tc (200 °C) samples crystallized very fast, while at high
Tc (220 °C) crystallization proceeds very slowly. At low
Tc (160 °C) the crystallization rate is moderately lower than that observed at intermediate
Tc, although this variable depends on molecular weight as it was demonstrated by POM analysis (
Figure 1), where differences in crystallization curves were observed as the molecular weight increased.
Figure 8.
(a) Time-resolved WAXD patterns registered during the isothermal crystallization (30 min, 160 °C) of PET-LMw; Crystalline degree of isothermally crystallized PET at different temperatures: (b) PET-LMw; and (c) PET-HMw. Data were obtained from time resolved WAXD patterns.
Figure 8.
(a) Time-resolved WAXD patterns registered during the isothermal crystallization (30 min, 160 °C) of PET-LMw; Crystalline degree of isothermally crystallized PET at different temperatures: (b) PET-LMw; and (c) PET-HMw. Data were obtained from time resolved WAXD patterns.
Morphological parameters of semi-crystalline polymers like the average long period (
L), average crystalline lamellar thickness (
lc), average interlamellar amorphous layer thickness (
la), electron density difference between two phases (∆ρ), invariant (
Q), among others, can be determined by means of small angle X-ray scattering (SAXS) and time-resolved SAXS. These parameters are calculated by transforming the reciprocal space intensity data into a real-space by using mathematical models like the normalized correlation function γ
1(
r) or the interface distribution function
g1(
r) [
18,
22]. In the present work, the self correlation triangle method was used to solve γ
1(
r); calculations and simulations were done by using mathematical software (Matcad 4 and Origin 7) [
23,
24].
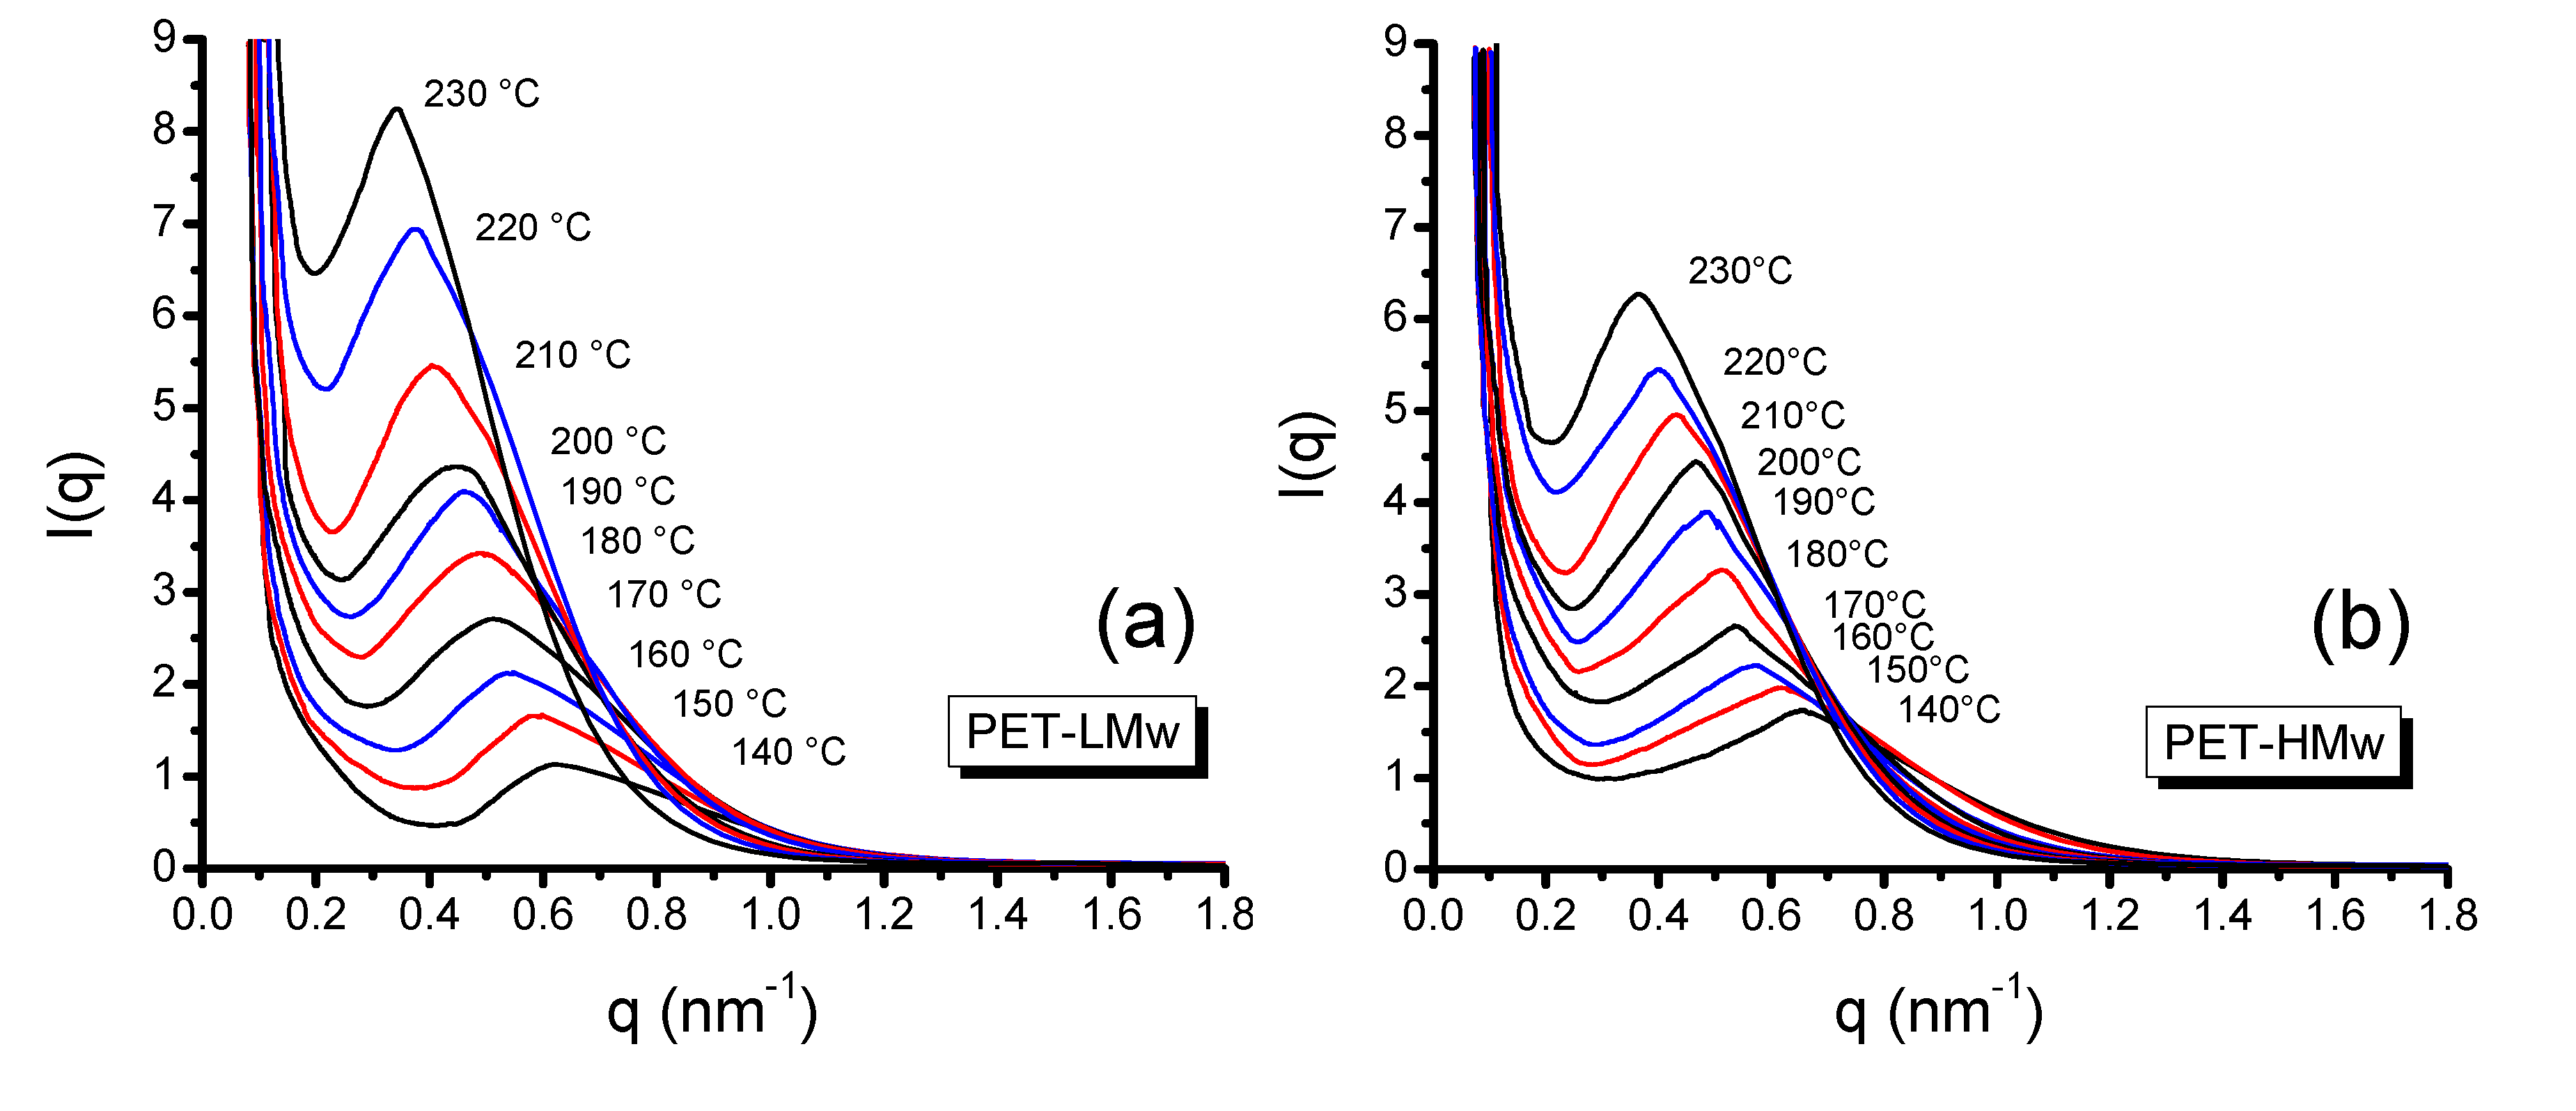
Figure 9 shows the scattering vector (
q)
versus the scattering intensity
I(
q) profiles for PET samples isothermally crystallized for 30 min. It can be seen that the maximum of curves decreases monotonically with temperature, which is indicative of an increment of the long period [
25]. The
lc,
la and
L parameters are obtained by simulation of γ
1(
r) (
Figure 10a,b), however, it is not clear which calculated value corresponds to
lc (or
la) [
22]. In this respect, some authors have proposed that the big one corresponds to
lc [
24,
25,
26,
27,
28,
29], while some others have proposed the opposite [
6,
22,
30,
31]. In the present work, the small calculated value was assigned to
lc because when it was used to calculate the crystalline degree (
Figure 10c), results agreed well with data obtained by WAXD [
22].
Figure 9.
SAXS patterns of isothermally crystallized (30 min) PET at different temperatures: (a) PET-LMw; (b) PET-HMw.
Figure 9.
SAXS patterns of isothermally crystallized (30 min) PET at different temperatures: (a) PET-LMw; (b) PET-HMw.
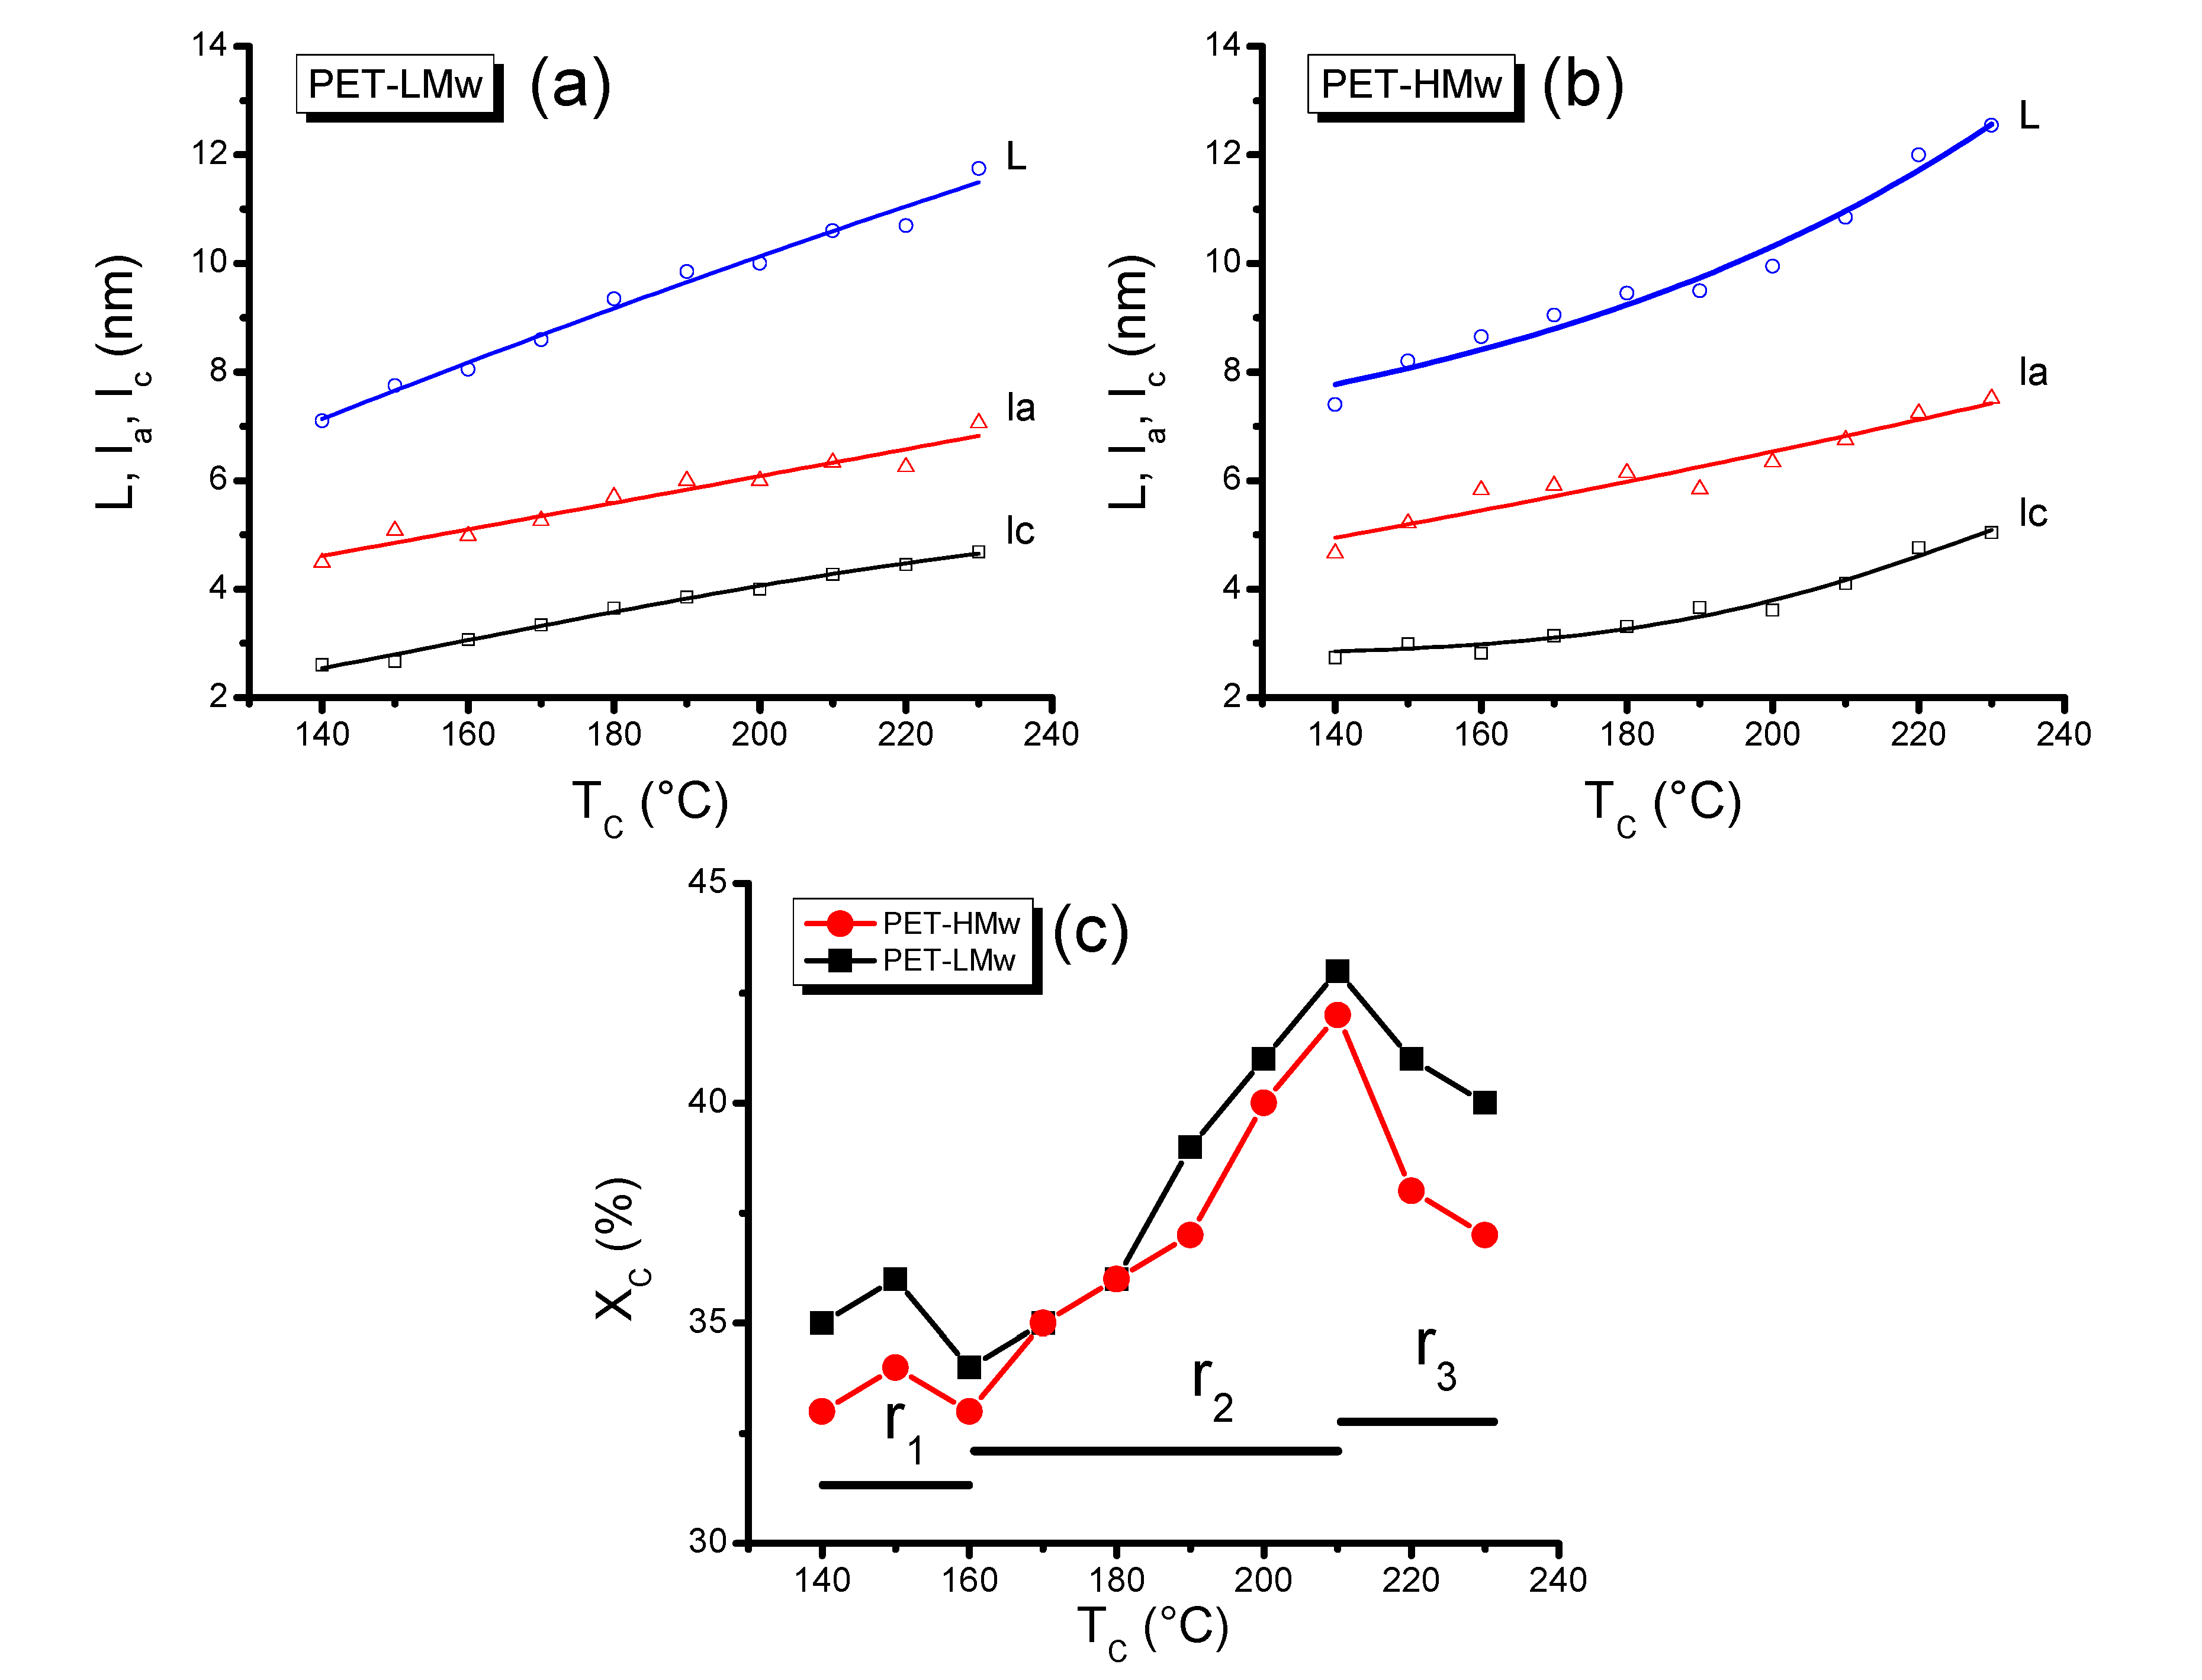
Figure 10.
Morphological parameters (L, la and lc) of isothermally crystallized PET at different temperatures: (a) PET-LMw; (b) PET-HMw; and (c) Crystalline degree of isothermally crystallized PET. Data were obtained from SAXS patterns.
Figure 10.
Morphological parameters (L, la and lc) of isothermally crystallized PET at different temperatures: (a) PET-LMw; (b) PET-HMw; and (c) Crystalline degree of isothermally crystallized PET. Data were obtained from SAXS patterns.
Figure 10 shows that
L,
la and
lc increase with
Tc, as deduced from SEM and POM micrographs, where thicker crystals were registered, respectively. As expected, the increase in molecular weight has produced higher values of
la. Again, this observation relates well with the increment of amorphous regions observed previously by WAXD results. The increase of
lc as a function of
Tc for PET and other polymers, like LDPE, has been reported and analyzed by other authors [
6,
18].
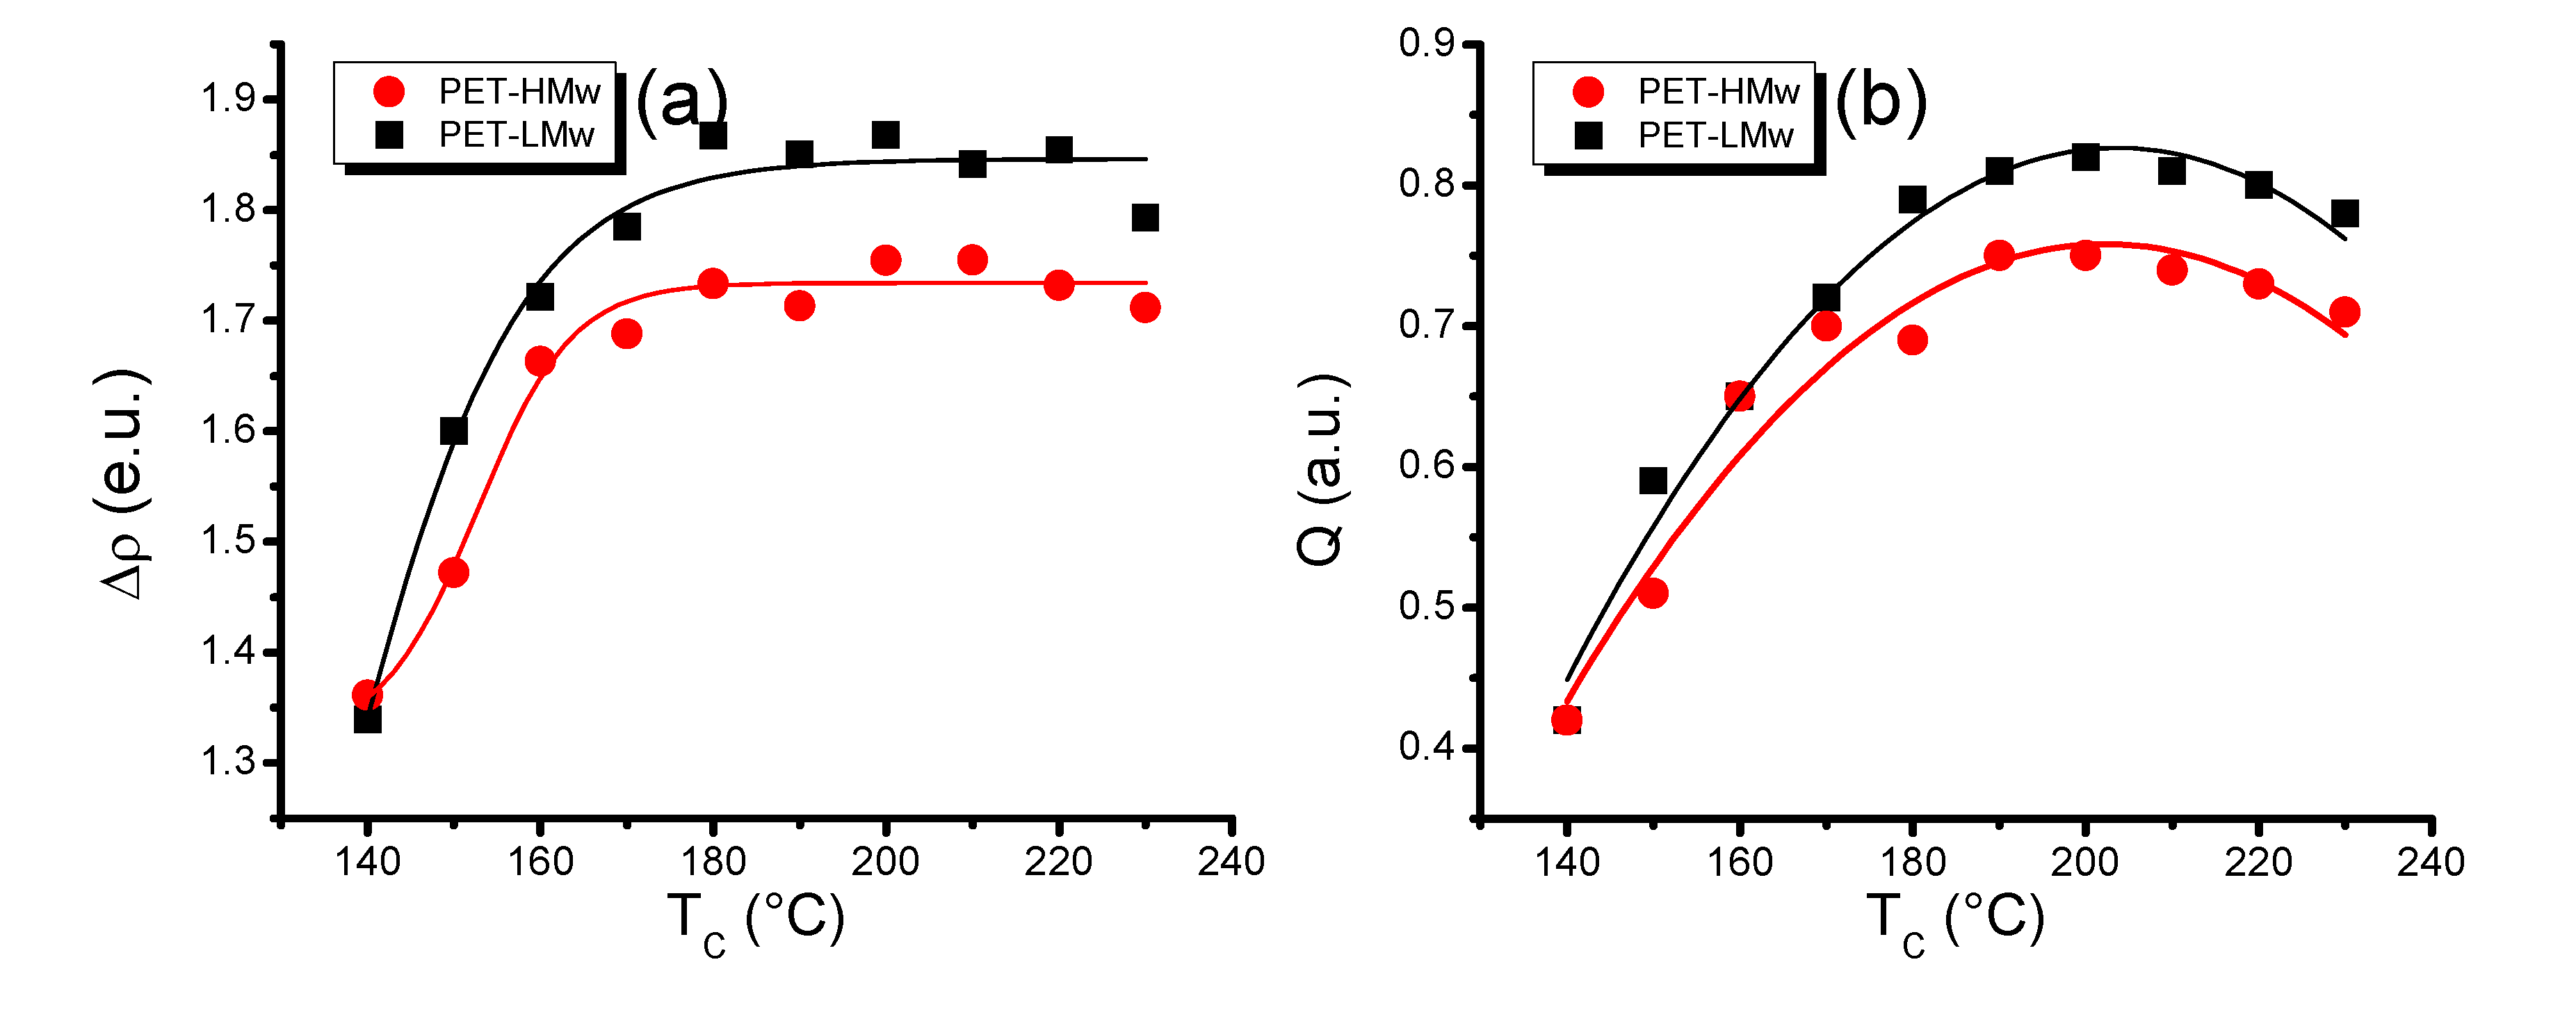
Differences in electron density (∆ρ) provide information about the crystal perfection.
Figure 11a shows a sharp increase of this variable at low
Tc (140–180 °C) and relatively constant values at high
Tc (190–220 °C). This observation indicates that the crystal perfection is substantially improved in the low temperature region and that it remains practically unaffected at higher temperatures.
The power of dispersion in characterized samples, as a function of
Tc, is indicated by the invariant
Q patterns shown in
Figure 11b. It can be noticed that
Q increases sharply up to a maximum (intermediate
Tc), then it decreases slowly. These curves are comparable to those obtained by WAXD (
Figure 7) that also showed a maximum of crystalline material at intermediate
Tc.
Figure 11.
(a) Differences in electron density (∆ρ); and (b) Invariant (Q) of isothermally crystallized PET at different temperatures.
Figure 11.
(a) Differences in electron density (∆ρ); and (b) Invariant (Q) of isothermally crystallized PET at different temperatures.
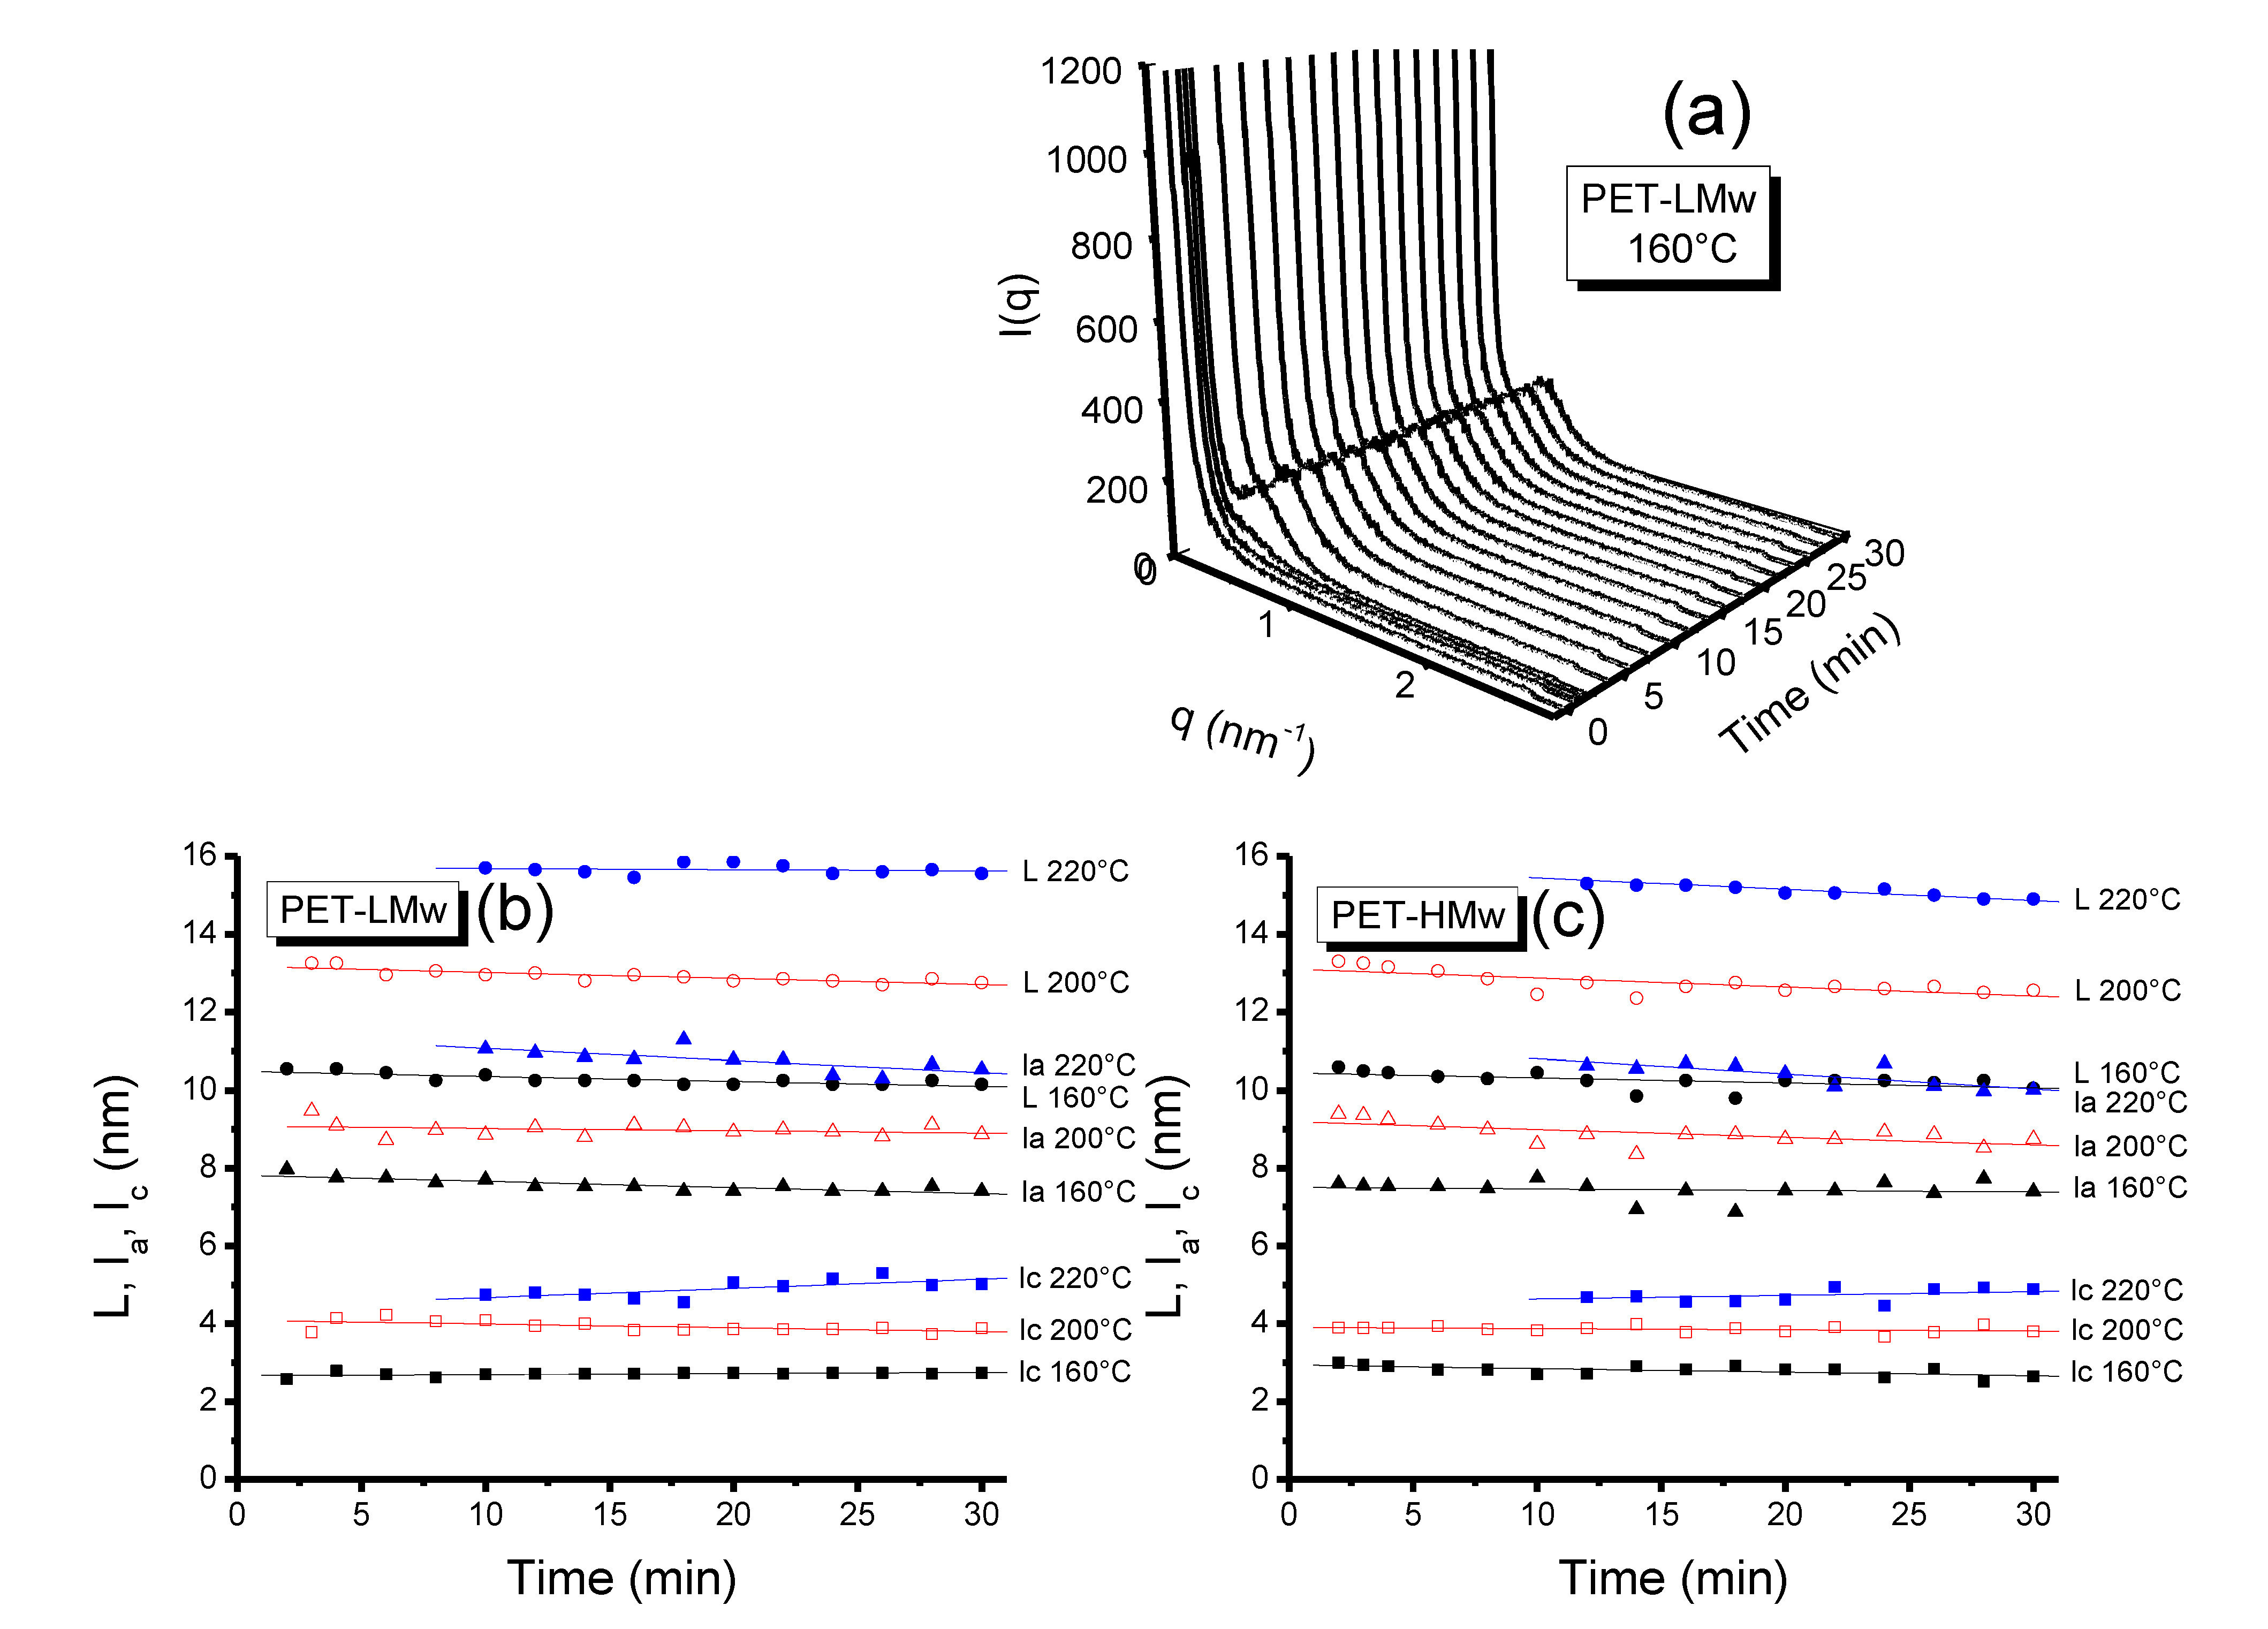
Figure 12a shows the time resolved SAXS patterns for PET-LMw. By applying the γ(
r) function to curves, the morphological parameters
L,
lc,
la were calculated and plotted in
Figure 12b,c [
18]. A retarding effect can be seen at the highest
Tc (220 °C), which is attributed to the slow crystallization process occurring at this temperature. Similar to SAXS, a general increase is observed in the value of morphological parameters as a function of
Tc. It can be noticed that
lc increases with time only at high
Tc (220 °C), while it remains almost unchanged at the other considered crystallization temperatures (160 and 200 °C). This behavior indicates that there is a lamellar thickening during crystallization. Simultaneously, the decreasing value of
la at high
Tc (220 °C) indicates that part of the amorphous material is incorporated into crystal structures.
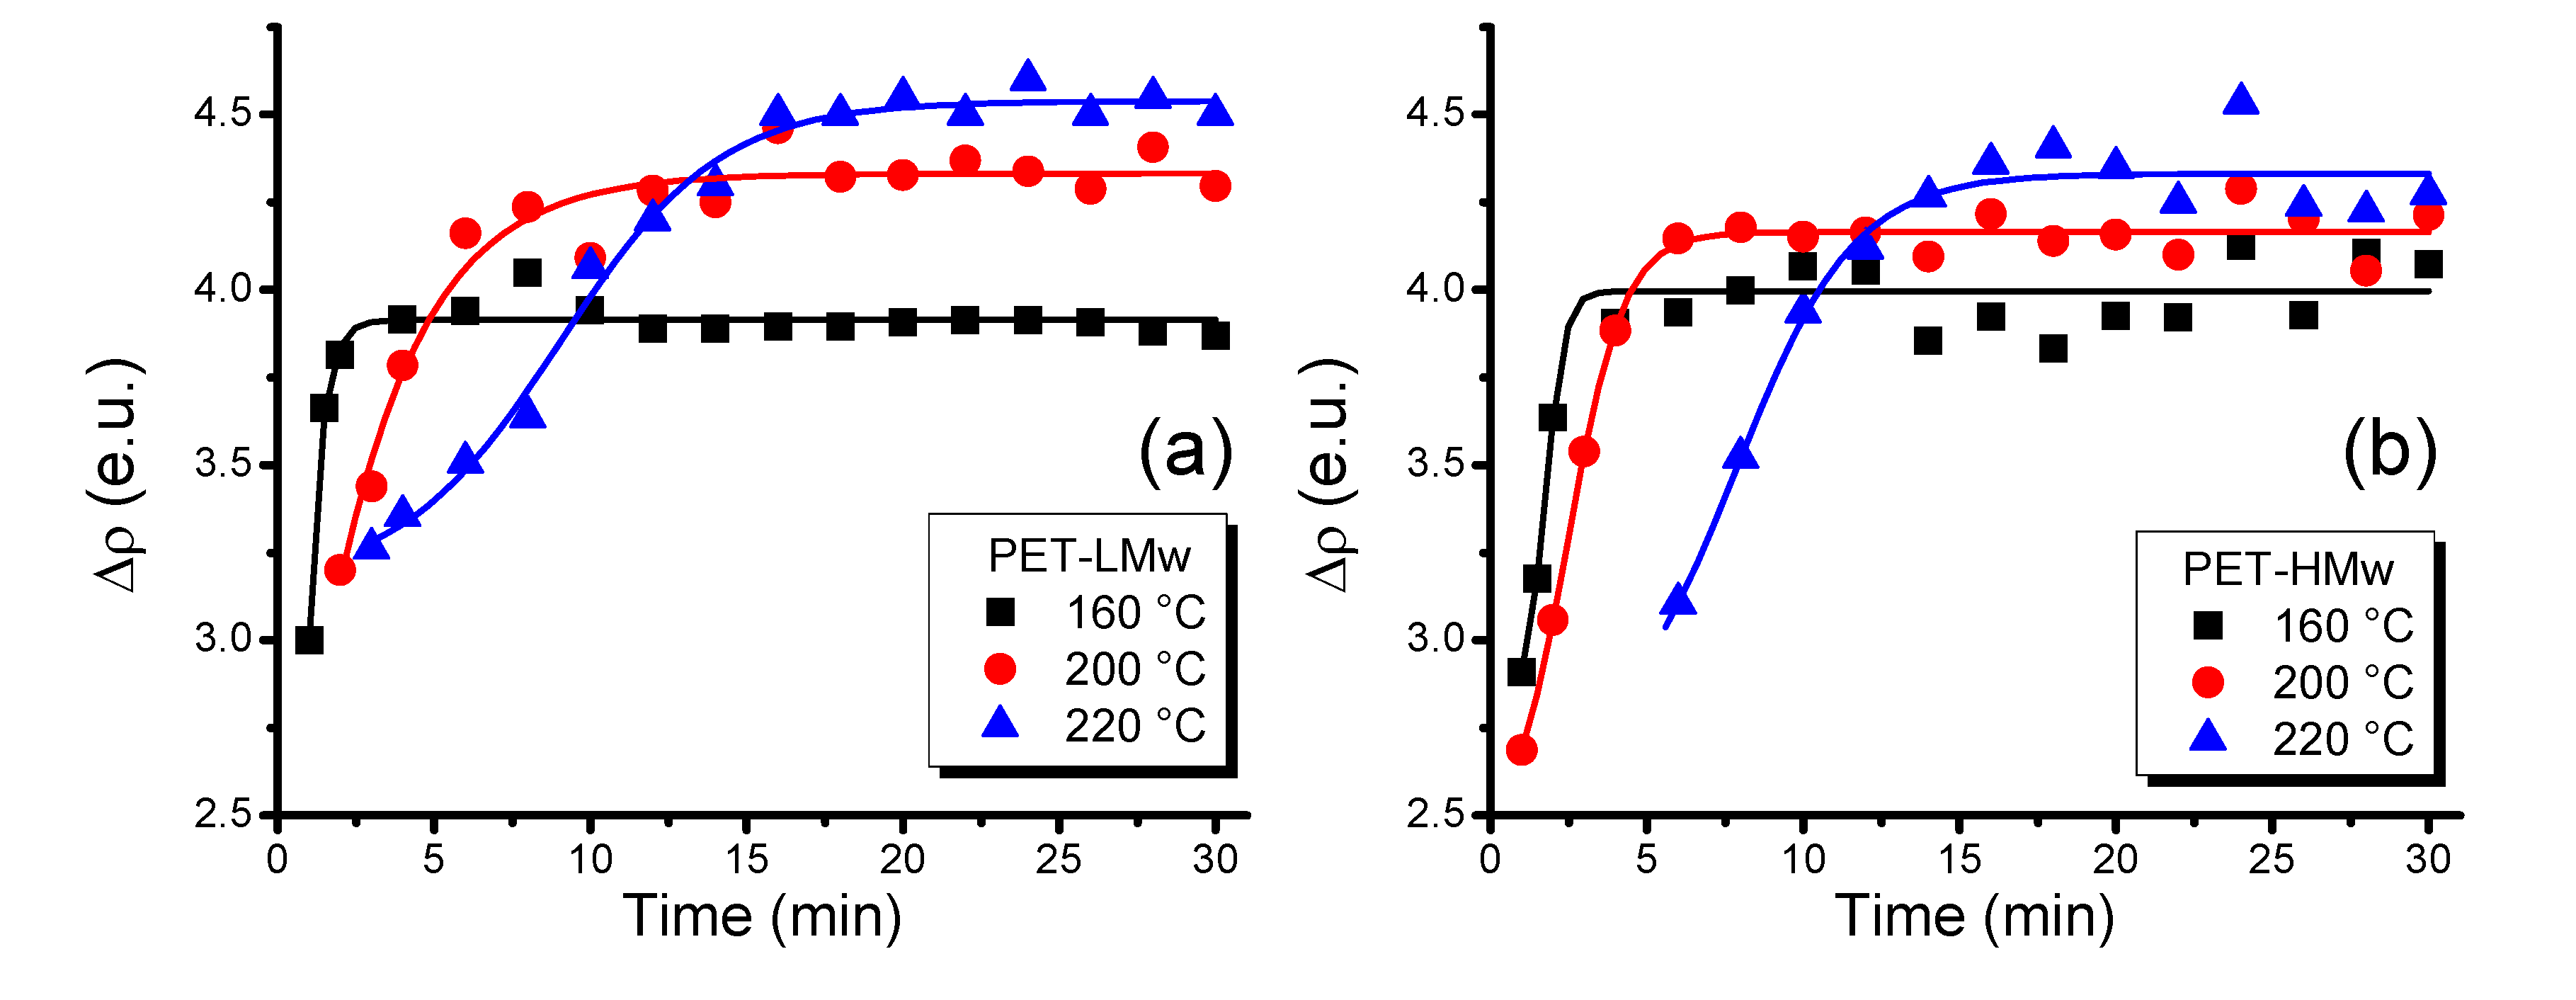
Time-resolved measurements for the electron density (∆ρ) in crystallized samples are shown in
Figure 13. It can be noticed that the highest values of ∆ρ are presented at high
Tc, indicating a higher crystalline perfection. The increase in molecular weight reduces the value of ∆ρ for samples crystallized at identical
Tc, indicating a minor crystalline perfection for the highest molecular weight sample (PET-HMw).
Figure 12.
(a) Time-resolved SAXS patterns of isothermally crystallized (30 min) PET-LMw at different temperatures; Evolution of morphological parameters (L, la and lc) (b) PET-LMw; and (c) PET-HMw. Data were obtained from time resolved SAXS patterns.
Figure 12.
(a) Time-resolved SAXS patterns of isothermally crystallized (30 min) PET-LMw at different temperatures; Evolution of morphological parameters (L, la and lc) (b) PET-LMw; and (c) PET-HMw. Data were obtained from time resolved SAXS patterns.
Figure 13.
Evolution of electron density (∆ρ) of isothermally crystallized PET at different temperatures: (a) PET-LMw; and (b) PET-HMw. Data were obtained from time-resolved SAXS patterns.
Figure 13.
Evolution of electron density (∆ρ) of isothermally crystallized PET at different temperatures: (a) PET-LMw; and (b) PET-HMw. Data were obtained from time-resolved SAXS patterns.
In addition, it is expected the formation of imperfect and thin crystals in the high nucleation regimen (low
Tc) due to the low diffusion of the material, while bigger and more perfect crystals are expected in the regime where diffusion predominates (high
Tc). In the present study, SEM, SAXS and TR-SAXS were used to analyze this behavior in a wide temperature range. The results obtained are in accordance with the growth regimes reported by Hoffman
et al. [
9].
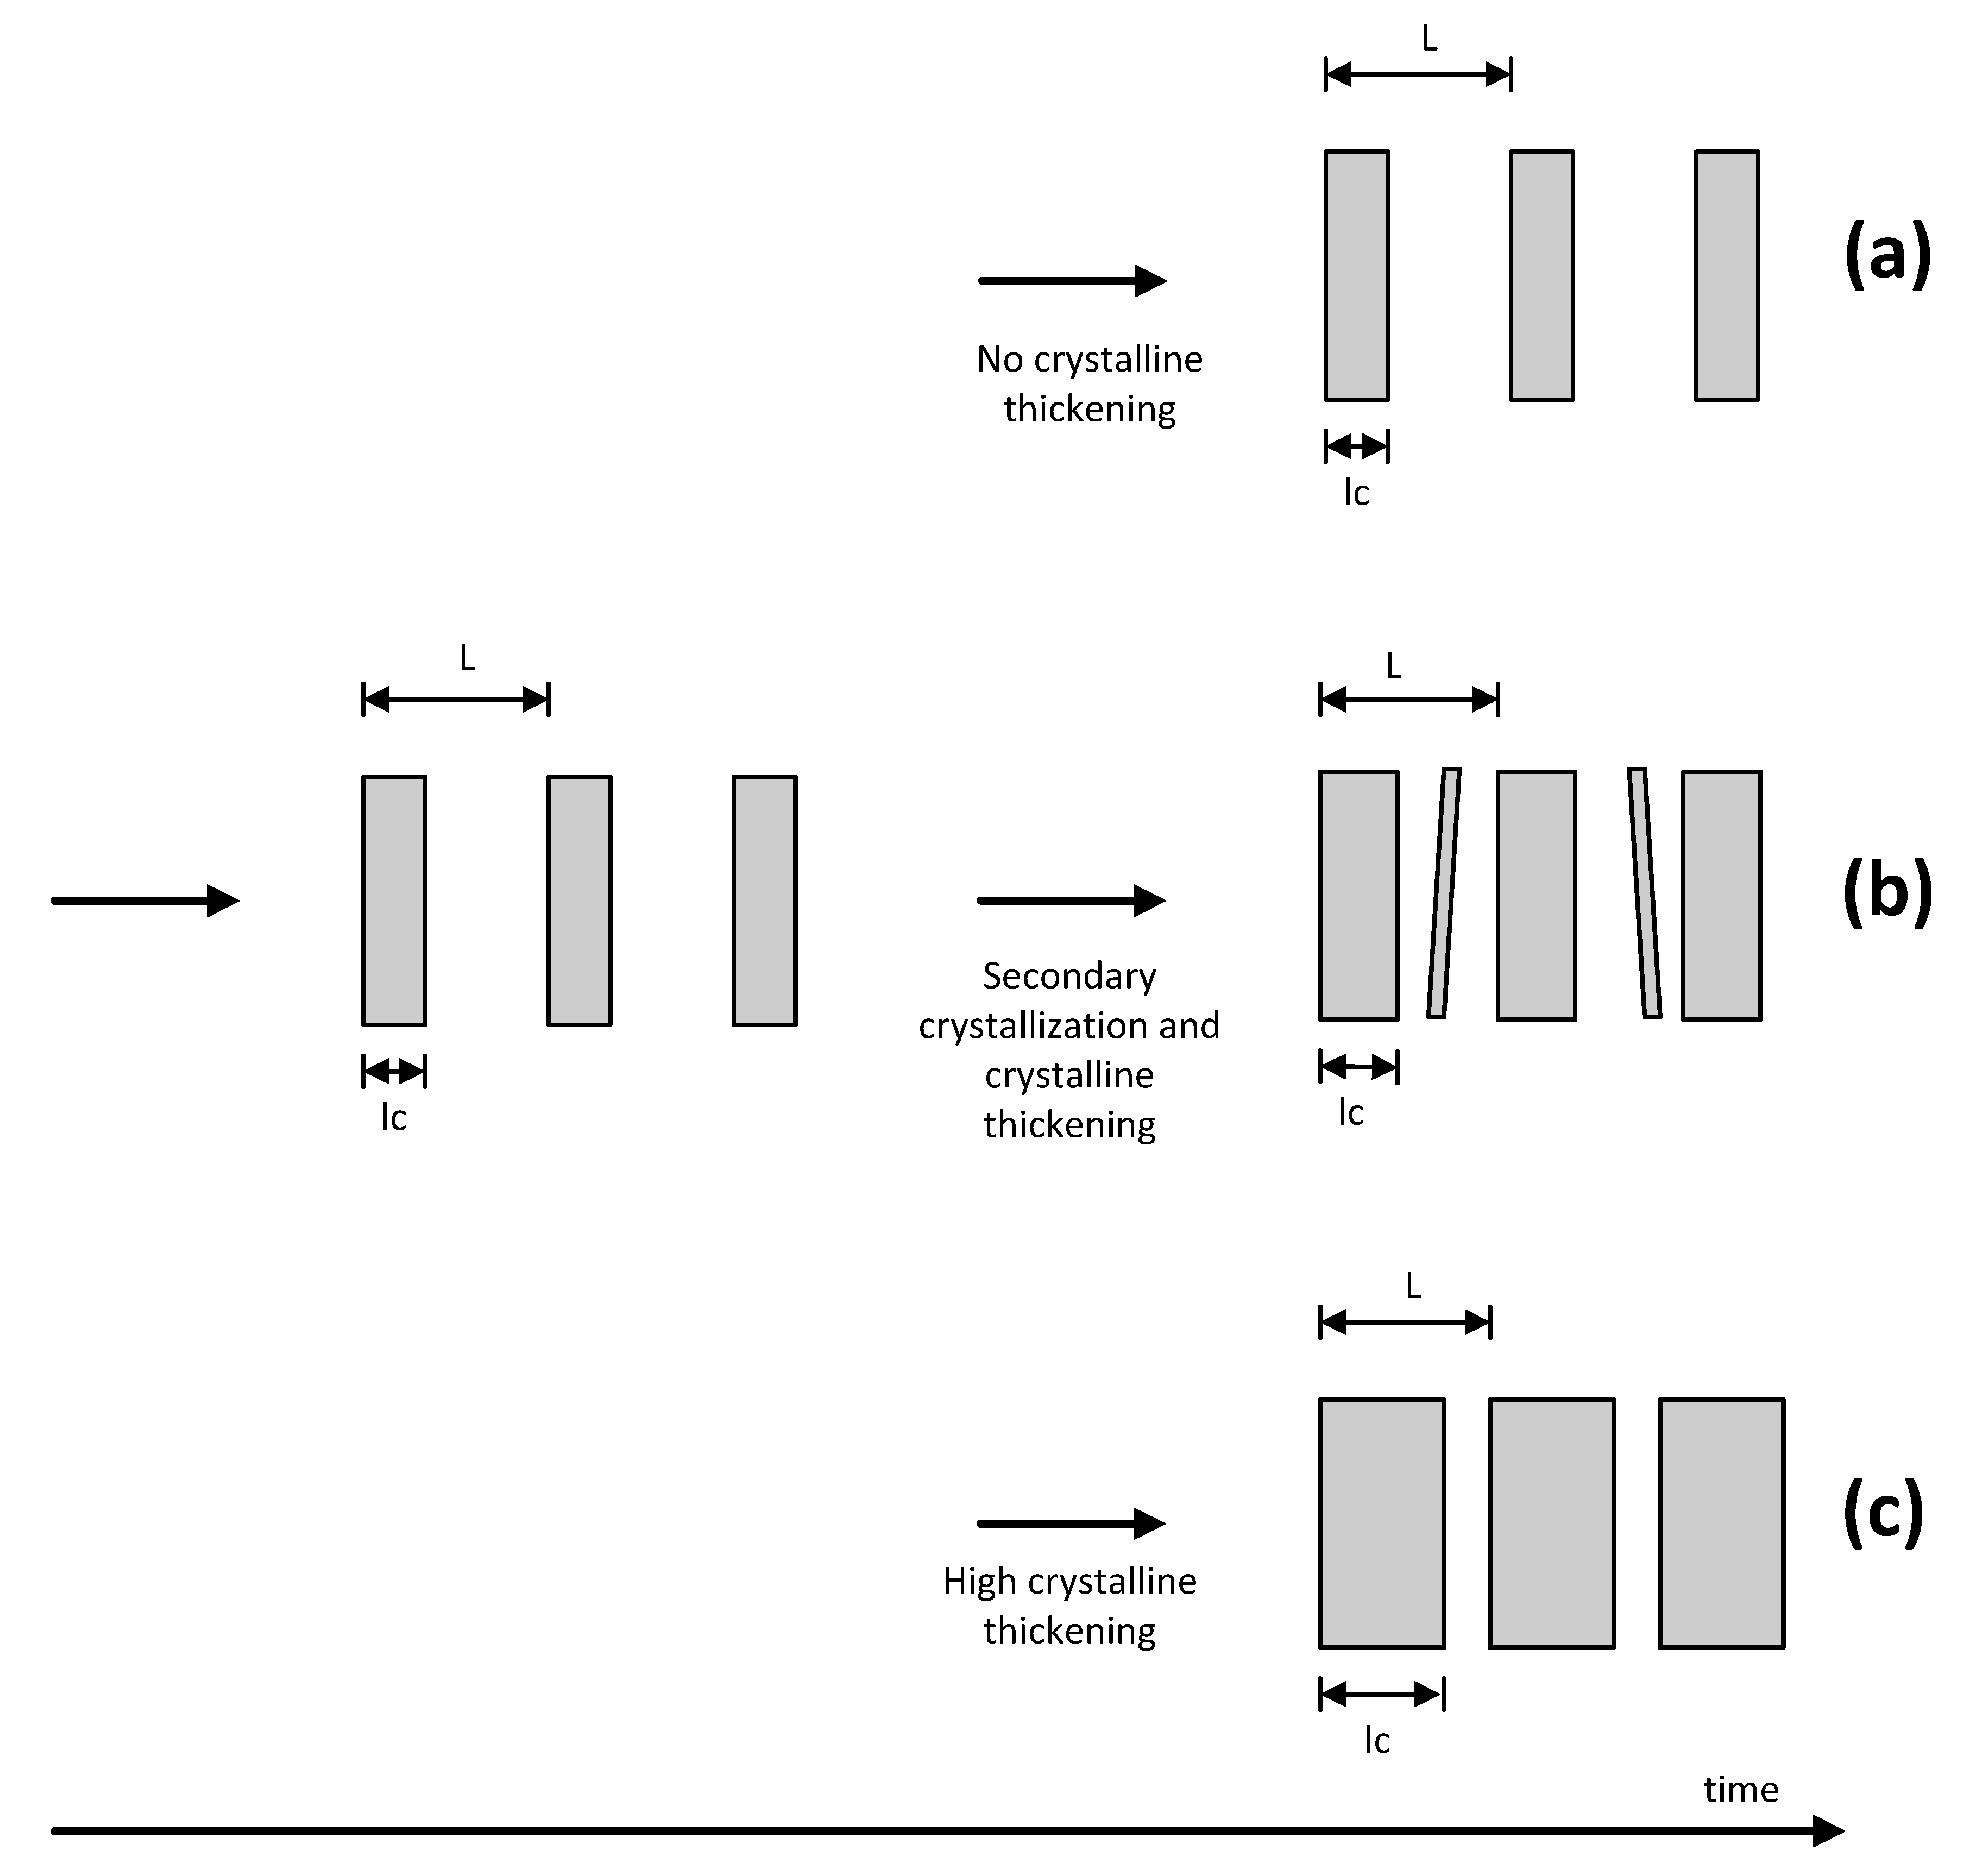
In order to provide a concise idea of the isothermal crystallization process for PET, in a wide temperature range, it is necessary to consider the three aforementioned regions r1, r2 and r3, each one following a different morphological pathway. In this respect, a model is proposed for each region.
In
r1 (low
Tc) the morphology was characterized by thin crystalline structures (SEM) and important amorphous zones (POM) or low crystalline degrees (WAXD). On the other hand, the Avrami analysis showed the presence of only one crystalline family, with relatively small values of
lc,
L and ∆ρ (SAXS) with respect those found in the other regions. As a function of time, the
lc (TR-SAXS) remained constant indicating that there is no crystal thickening during the process. From these results, a morphological model is proposed in which the initially formed thin crystalline structures do not evolve as a function of time as it is shown in
Figure 14a.
Figure 14.
Morphological model for the isothermal crystallization of PET: (a) Low temperatures (region 1); (b) Intermediate temperatures (region 2); and (c) High temperatures (region 3).
Figure 14.
Morphological model for the isothermal crystallization of PET: (a) Low temperatures (region 1); (b) Intermediate temperatures (region 2); and (c) High temperatures (region 3).
In
r2 (intermediate
Tc), both thin and thick structures were observed (SEM). Here, the highest crystalline degree was obtained (POM and WAXD) and associated with a high content of secondary crystals as detected by the Avrami analysis. The crystal perfection (SAXS) was higher than that observed in
r1, evolving gradually with time (TR-SAXS). From these results, the proposed model consists of thick primary structures that coexist with thin and small secondary structures. For this region, it is possible that the primary crystals are first formed, then, the formation of secondary crystals and thickening of primary crystals occurs simultaneously, as it is schematized in
Figure 14b.
In
r3 (high
Tc), thick structures (SEM) with significant amorphous regions were observed (POM and WAXD). Only one crystalline family was appreciated by the Avrami analysis. The
lc,
L and ∆ρ were higher with respect to those measured for the other two regions (SAXS). The
lc also increases as a function of time (TR-SAXS) in this region. Here, the proposed model considers a significant crystal thickening that occurs during crystallization, as it is shown in
Figure 14c.


 and
and 

