3.1. Experimental Results
Having performed the bending impact experiments allows us to comprehend the tendency of the supported composite beams and the hollow tubes. After the impact test,
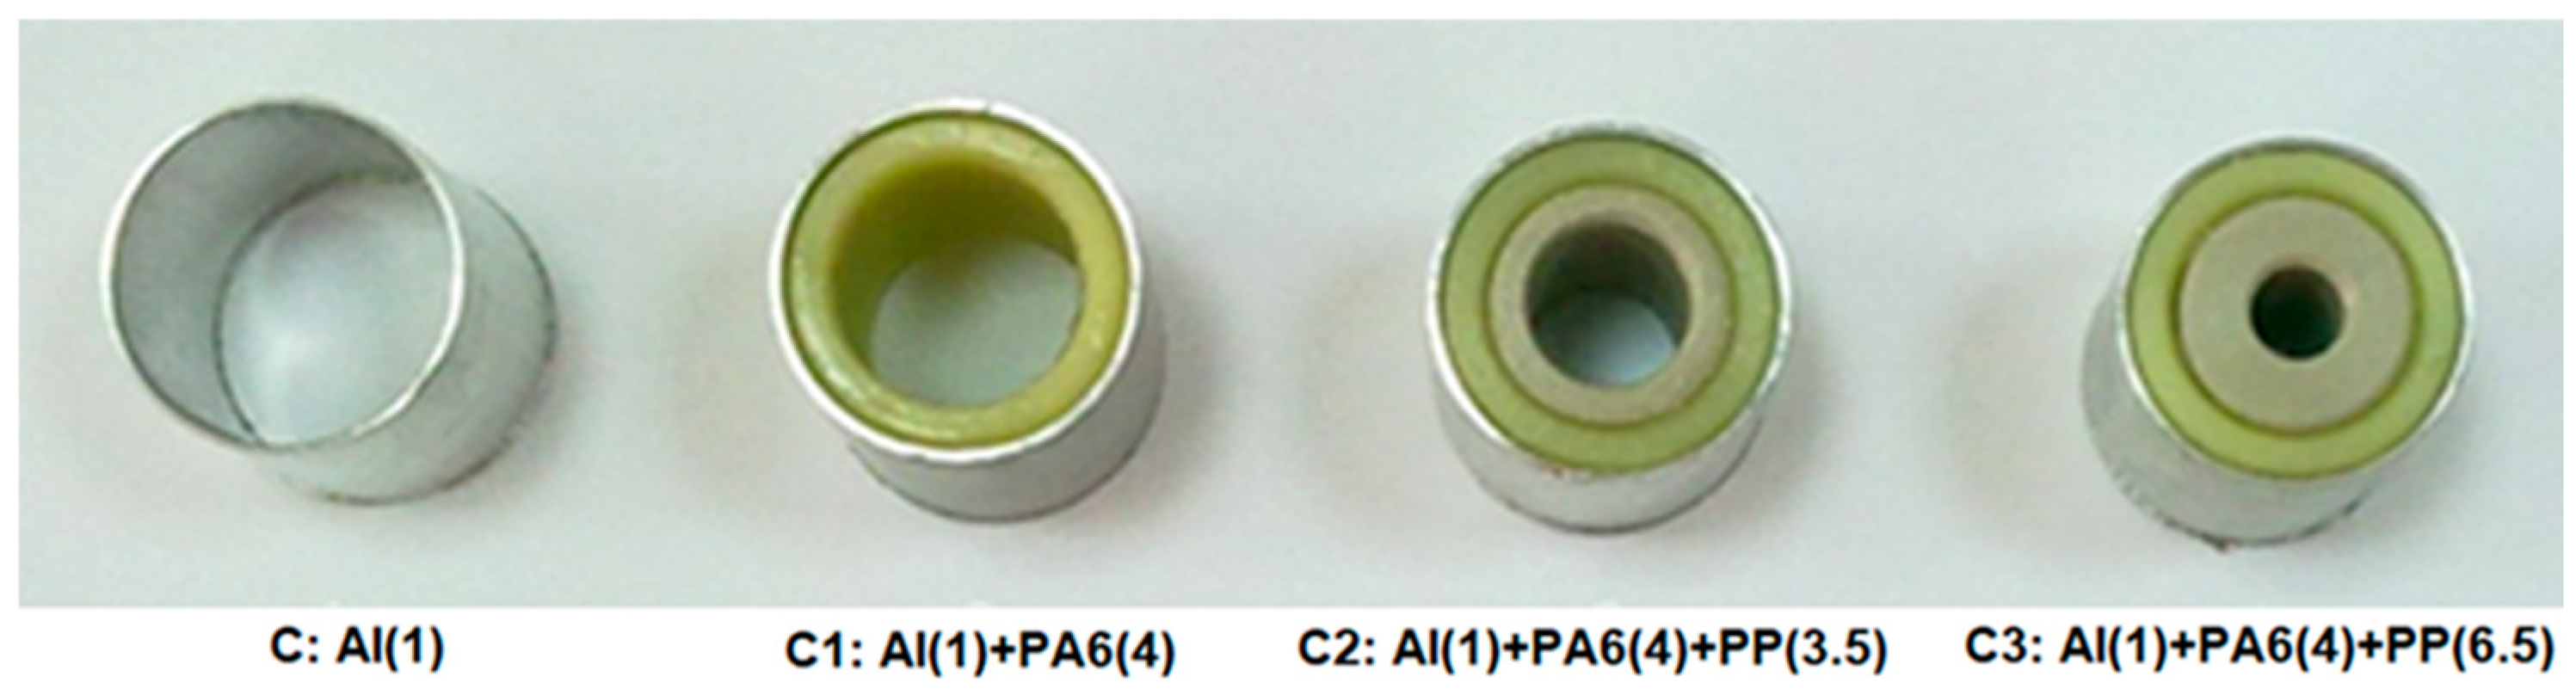
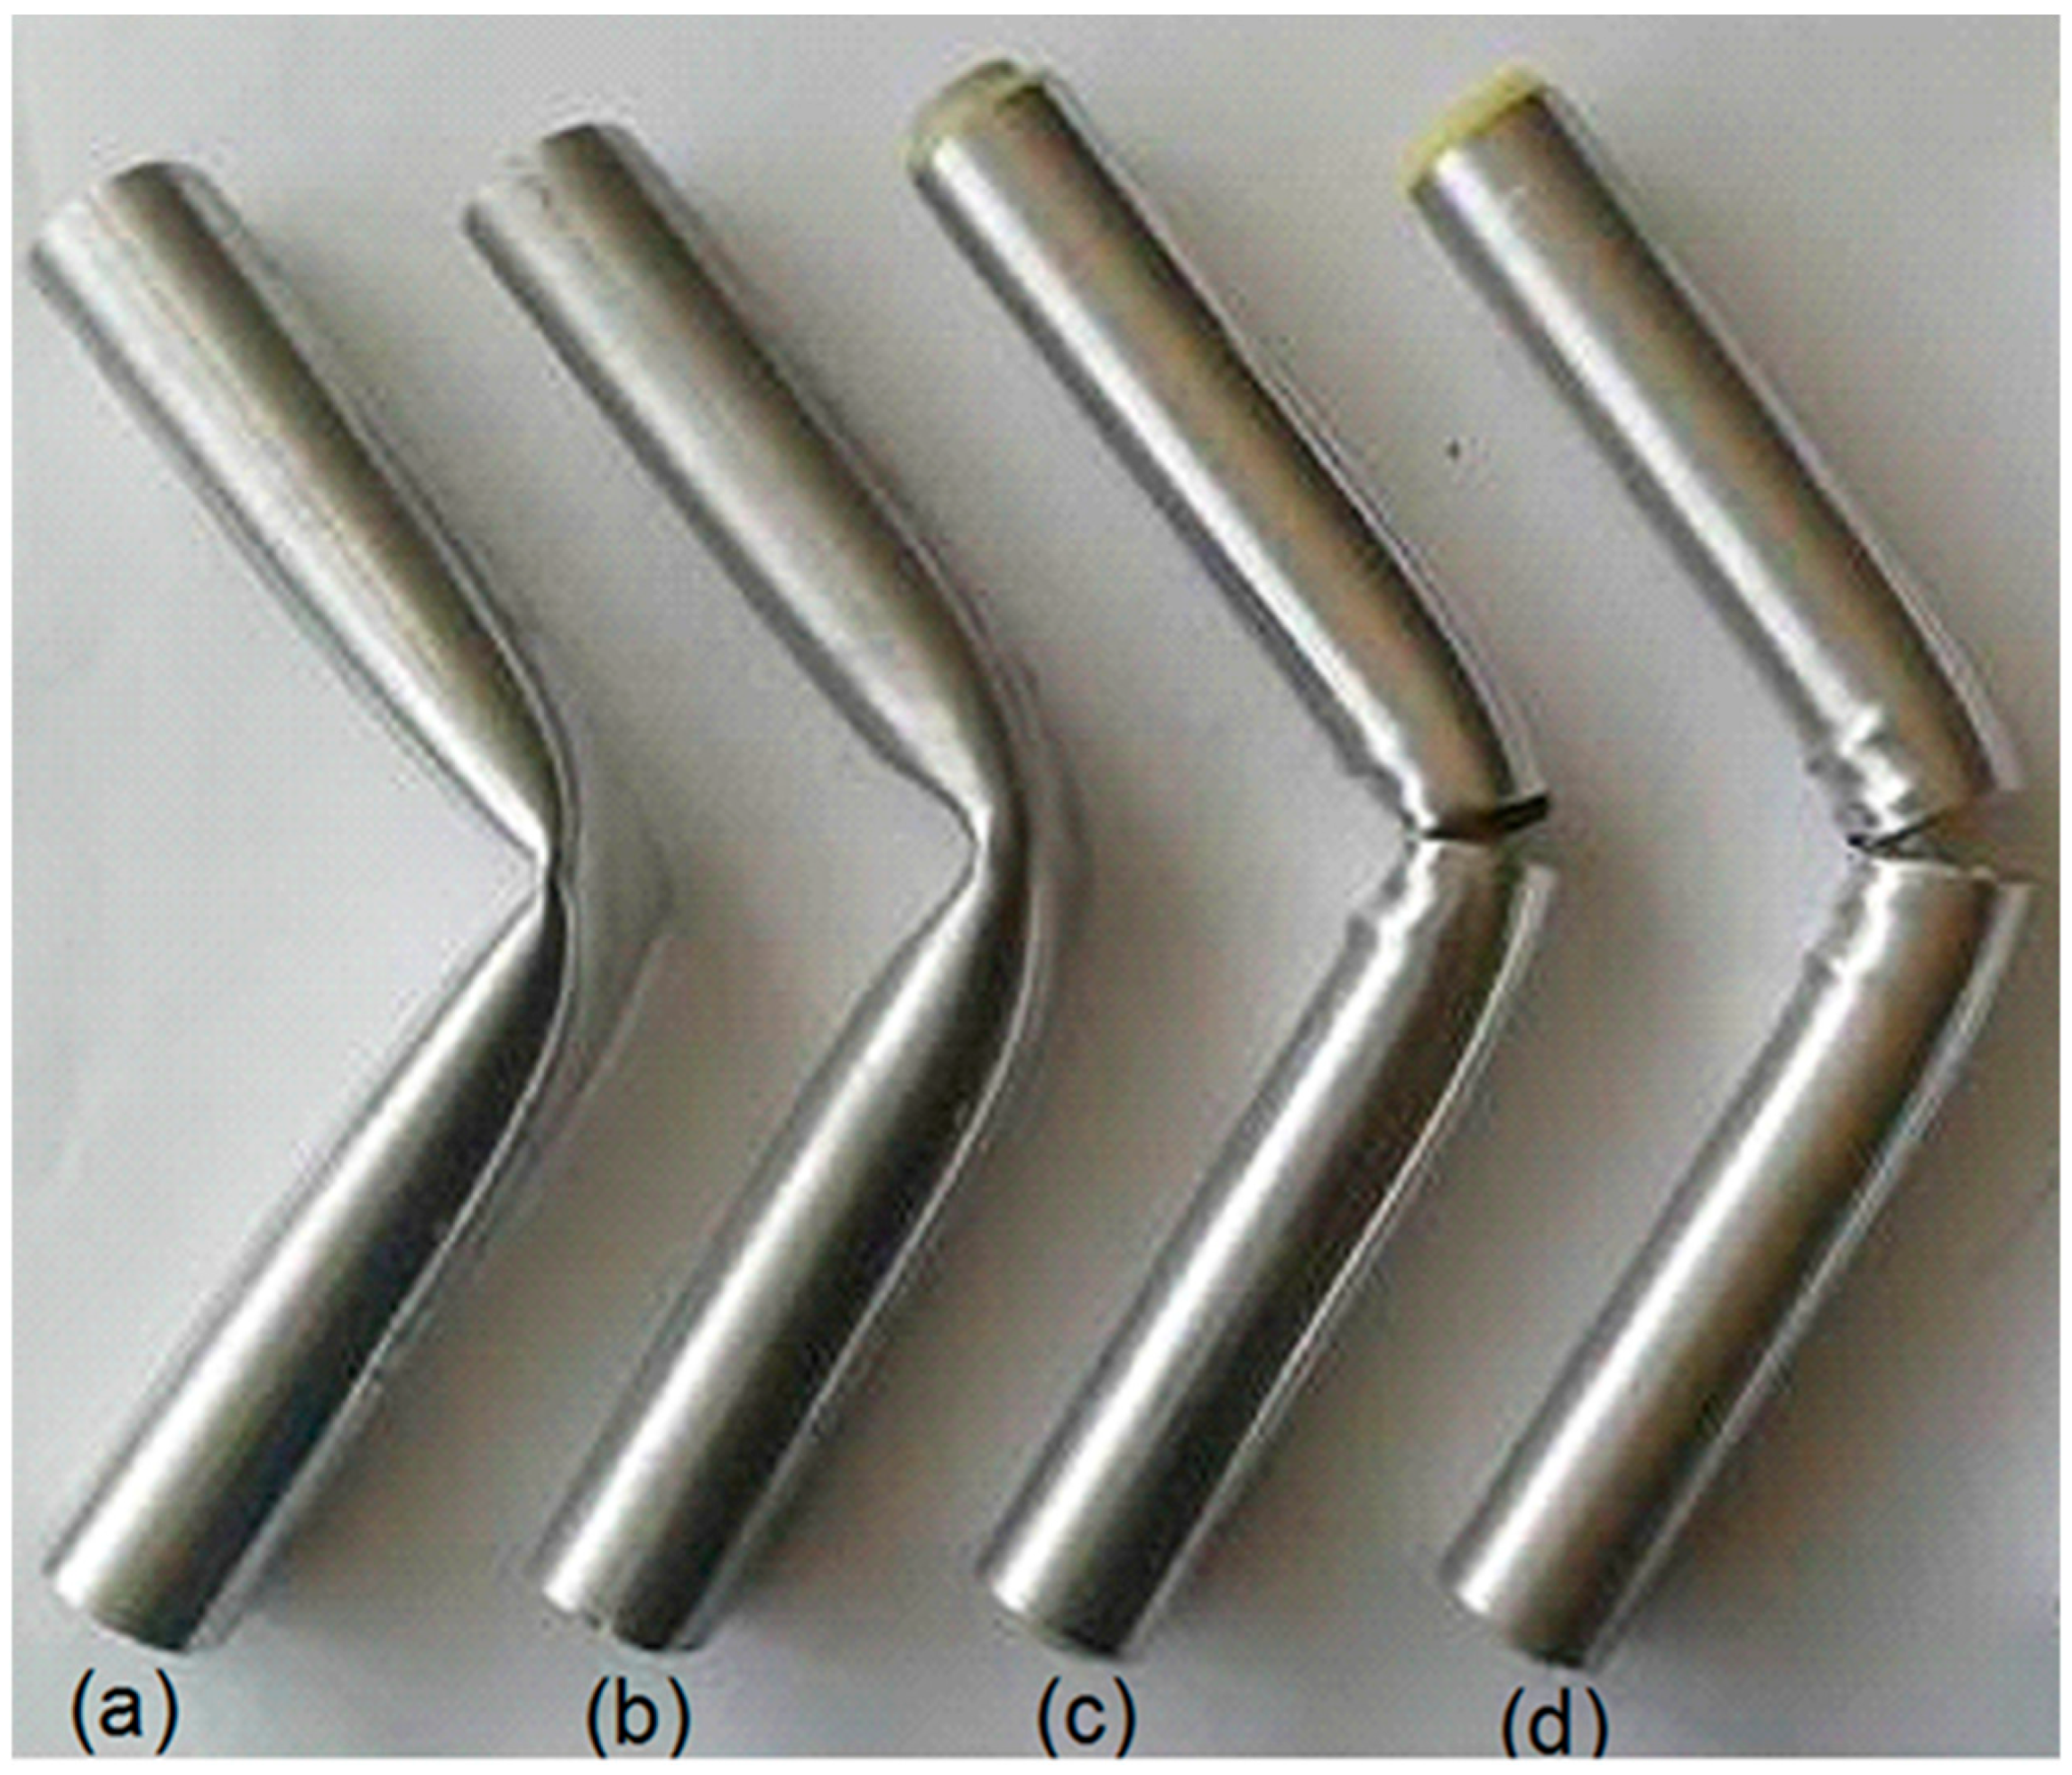
Figure 8 shows the representative view of the deformed specimens.
Plastic hinge formation can be seen in the unreinforced Al tube (
Figure 8a), and the local deformation in the middle of the reinforced specimens decreases in the plain tube, as in some studies. Additionally, we observe a similar, but less pronounced, hinge formation due to the inner reinforcement of the PA6-filled Al tube (
Figure 8b). The cross-sectional moment of inertia and the buckling behavior of the tube’s upper portion affect the bending performance, as reported in various studies [
17,
18,
29]. The wrinkling around the contact region of the impactor increases with the increment of the inner reinforcement and the bending radius. This behavior reflects the bending resistance of the composite beams from the internal reinforcements. Thus, the composite specimens’ bending impact energy-absorbing capability is enhanced with support inside, while the bending radius (curvature) increases as expected. The wall of the Al tube tends to tear as the reinforcement efficiency of the materials increases, where PP was used inside 4 mm thick PA6 for the specimens C2 (3.5 mm thick PP) and C3 (6.5 mm thick PP) (
Figure 8c,d).
The results of experiments and simulations of composite beams are presented in
Table 3, along with the convergence ranges between them, and the “absorbed energy/mass” as defined by Specific Energy Absorption (SEA) values is also provided. The absorbed energy values in the table for the experiments are for the entire composite beams, measured from the test rig and calculated. Based on the simulations, we have two buckled hinge specimens (C and C1) and two broken specimens (C2 and C3). After validating the simulation results against experiments on the C1 specimen, the C specimen (a hollow Al tube) was also found not to break, allowing us to simulate it using a quarter model. Moreover, the PP-reinforced C2 and C3 specimens were broken, which cannot be modeled using a quarter model, as we mentioned before. To observe the onset of the crack and its growth till failure, we need to use a half-simulation model. For quarter models, to calculate absorbed energy, we will sum the composite components’ behavior and multiply by 4; for half models, we will multiply by 2.
When the test results are reviewed, inner reinforcement with polymeric materials significantly improves the Al tube’s bending impact energy-absorbing capability, as evidenced by the C1 specimen, by about 4.3 times, as indicated by the average experimental results. Unfortunately, the 3.5 mm- and 6.5 mm thick PA6-reinforced C2 and C3 specimens broke. Although we supported the composite tube with a polymeric reinforcement of PP inside PA6, the composite tubes failed in bending, rather than showing an increase in bending failure with increasing cross-sectional moment of inertia. During the experiments, there was no high-speed camera to record crack growth, so we were unable to see the details of the failure. Because we have filled tubular structures, if the polymeric supports crack and fracture before the outer aluminum tube, there is no way to record the internal deformation, even with a high-speed camera. The explicit dynamic simulations give us a chance to clarify the polymeric support deformations before the outer aluminum tube’s fracture. If we measure the energy change and observe the final deformation, we compare the energy-absorbing values of experiments and simulations and converge on more than 90–95 percent that will satisfy the experiments. Thus, the failure mechanism will be analyzed using explicit finite element simulations later.
To understand the failure mechanism, we first wanted to examine the quasi-static loading behaviors of the materials. Eksi and Genel [
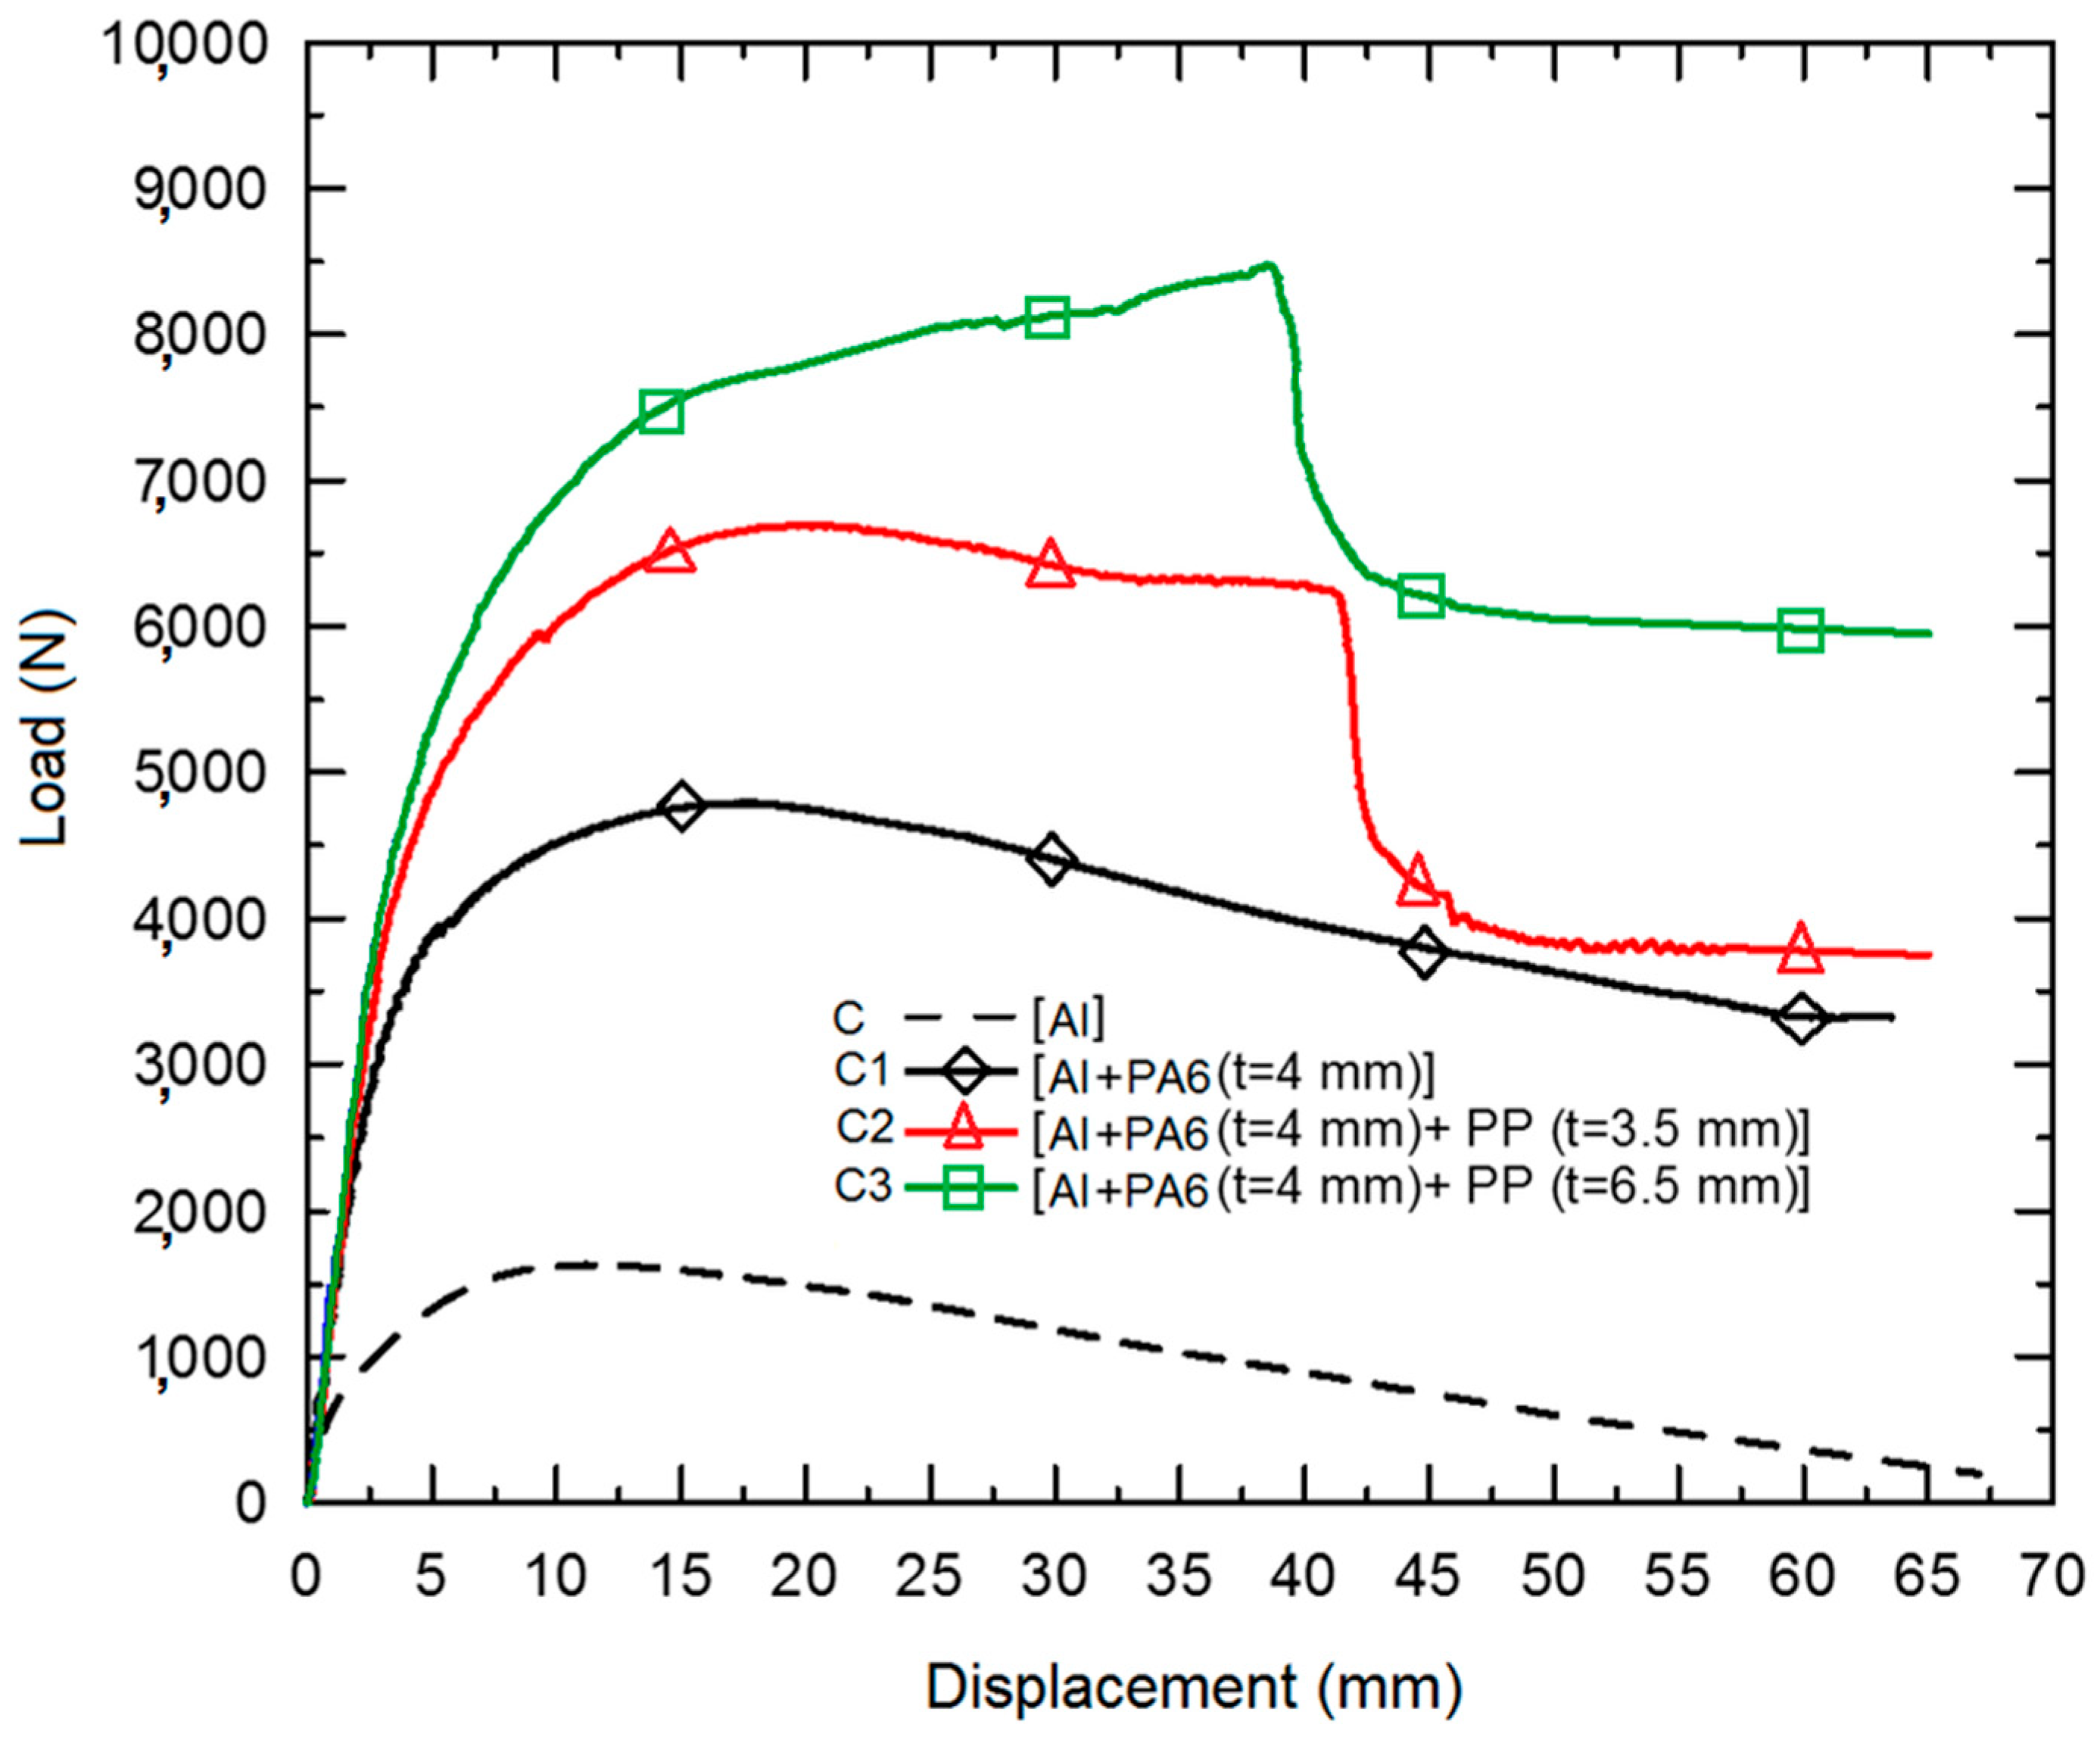
26], who are also from the same department, were previously studied using the same specimens but in quasi-static bending tests. According to their study, the load-displacement curves of the specimens shown in
Figure 9 emphasize the reactions of C2 and C3 during quasi-static bending. During these tests, they found that the inner reinforcements increased the load-carrying capacity and the beam’s toughness, as evidenced by higher bending loads and buckling displacements. In addition, the inner reinforcement material hinders local buckling; thus, the buckling resistance increases accordingly. They have also stated that after the peak buckling deformations, the load-carrying capability of the C2 and C3 specimens decreased suddenly, caused by the tearing of the tube’s bottom location.
This region was subjected to severe tensile stress due to the strain limitation in the radial direction of the inner reinforcement materials. Considering the failure displacements of C2 and C3 specimens, the failure formation is directly related to the stiffness of the reinforcements.
A similar behavior was also observed in the bending impact tests. In addition, increasing the inner reinforcements and thicknesses did not have a positive effect. It has a disadvantage, particularly in high bending displacements, when the continuity of the deformation is considered. For the specific composite beam, the general form of the bending stiffness (BS) can be calculated as follows:
where
n is the number of walls, E is the elasticity modulus in MPa, and I is the inertia moment in mm
4.
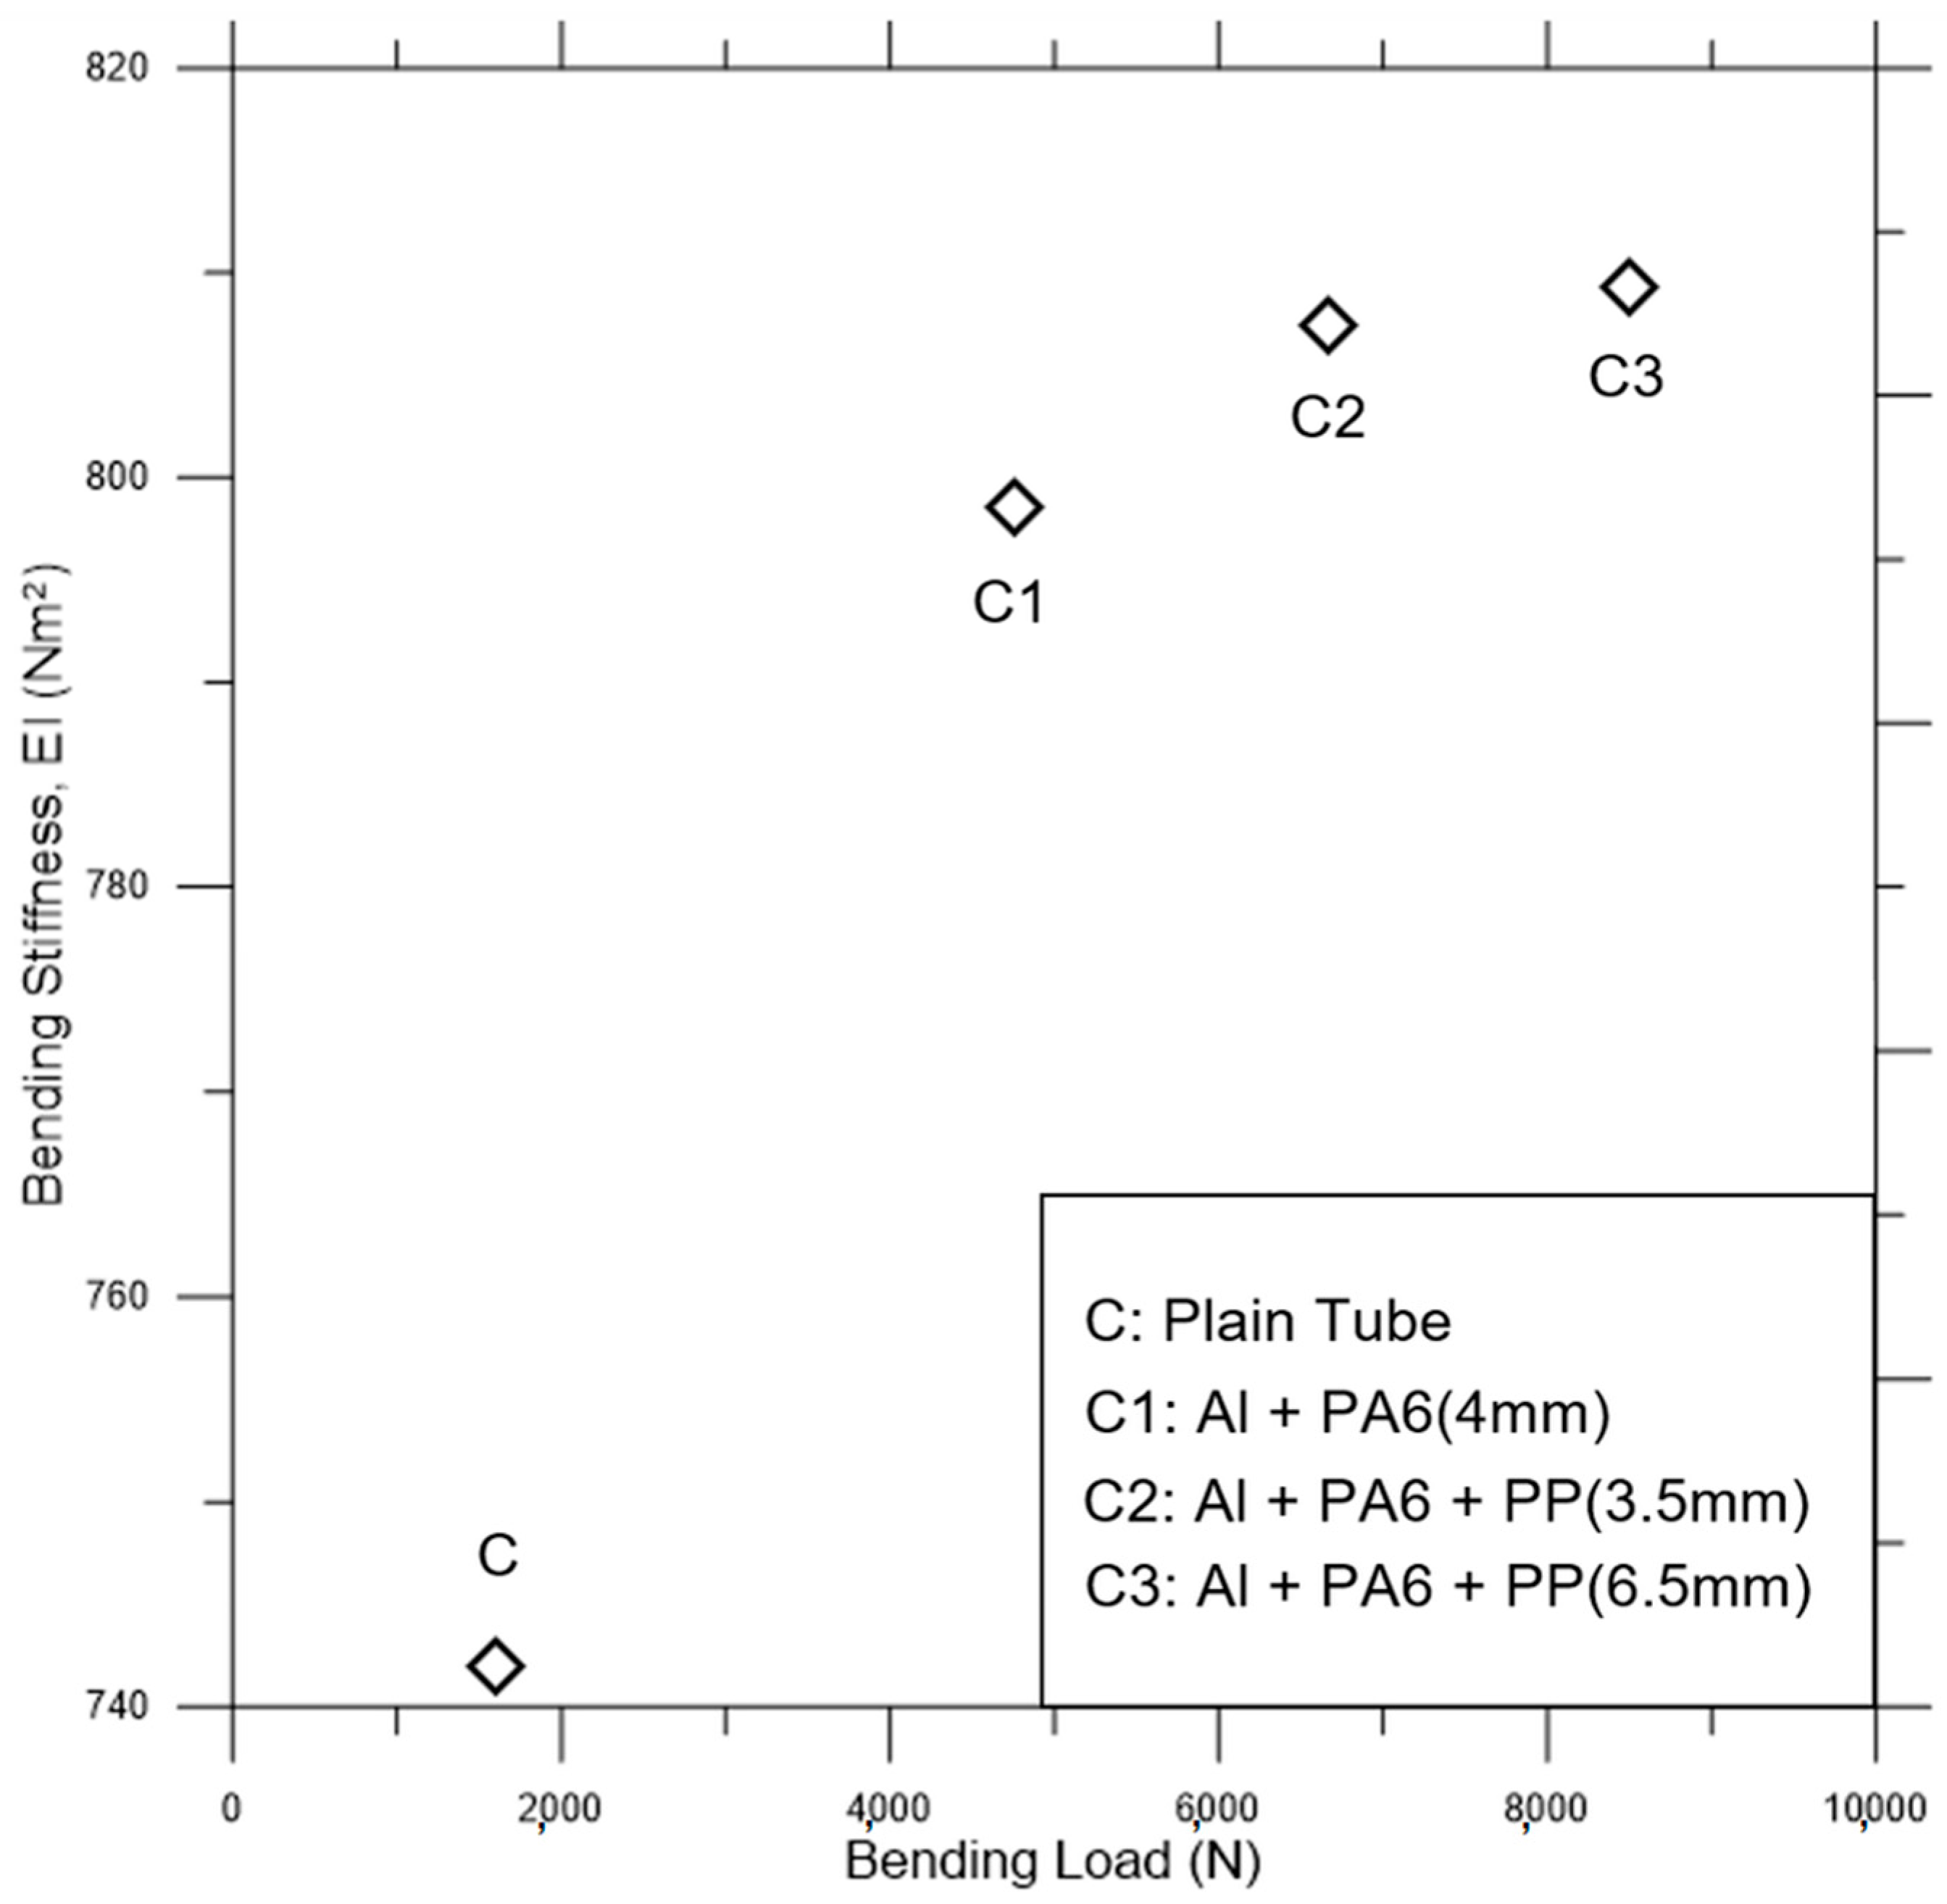
Figure 10 shows the quasi-static bending load versus bending stiffness for the specimens. It is possible to say that the bending performance of the composite is significantly increased depending on the reinforcement material’s contribution to the beam’s cross-sectional stiffness. Although there is not much difference between the bending stiffness of the composite beams, the bending load is considerably increased by the reinforcement (see C1–C3 in
Figure 10). Although the bending stiffness increases for the PP reinforced C2 and C3 specimens, it is not enough to avoid bending failure under extra-large loading conditions.
Depicting “the hindering of local buckling” on the bending improvement of the beams reveals that the bending stiffness is a significant factor for the hollow tube. Preventing local buckling is a primary effect of composite beams; therefore, the effects mentioned above are the main factors that improve composite performance [
4,
29]. Previous studies [
30,
31] found that load-carrying capacity was associated with local buckling. Until the displacement at which the load reached its maximum value, the load was mainly carried by the bottom portion of the tube’s cross-section.
To clarify, the effect of bending stiffness is that when it increases under quasi-static loading, its capability to hold static forces also increases. However, for explicit dynamic deformations, it would not work at the same performance. In this study, we will examine the details of deformations during impact, which sometimes increase breakability and amplify failure mechanisms in hollow fillers.
Considering the quasi-static bending test results, the failure mechanism explains the composite beam’s basic impact behavior. After the quasi-static bending experiment curves in
Figure 9, the bending stiffness data in
Figure 10 continued to show the quasi-static behavior of the specimens. Although the impact deformations differ from the provided static test results to understand the fundamental static approaches, we need to demonstrate how tubular structures bend statically to provide a starting point. However, for this study, we will focus on impact scenarios that share similar response measures at only some levels for static tests. The quasi-static bending experiments were not simulated, as the test results are adequate to compensate for the explicit dynamics simulation data on bending impacts.
During the impact tests, a large load was applied to the composite tubes by the pendulum, which pushes the tubes between the supports and continues pushing them to the ends of the supports. After extra-large deformations, the tubes bend, and hinges form with no return to the initial state in any elastic region. Thus, the springback after this deformation has no effect on all of the materials used.
3.2. Explicit Finite Element Analysis Results
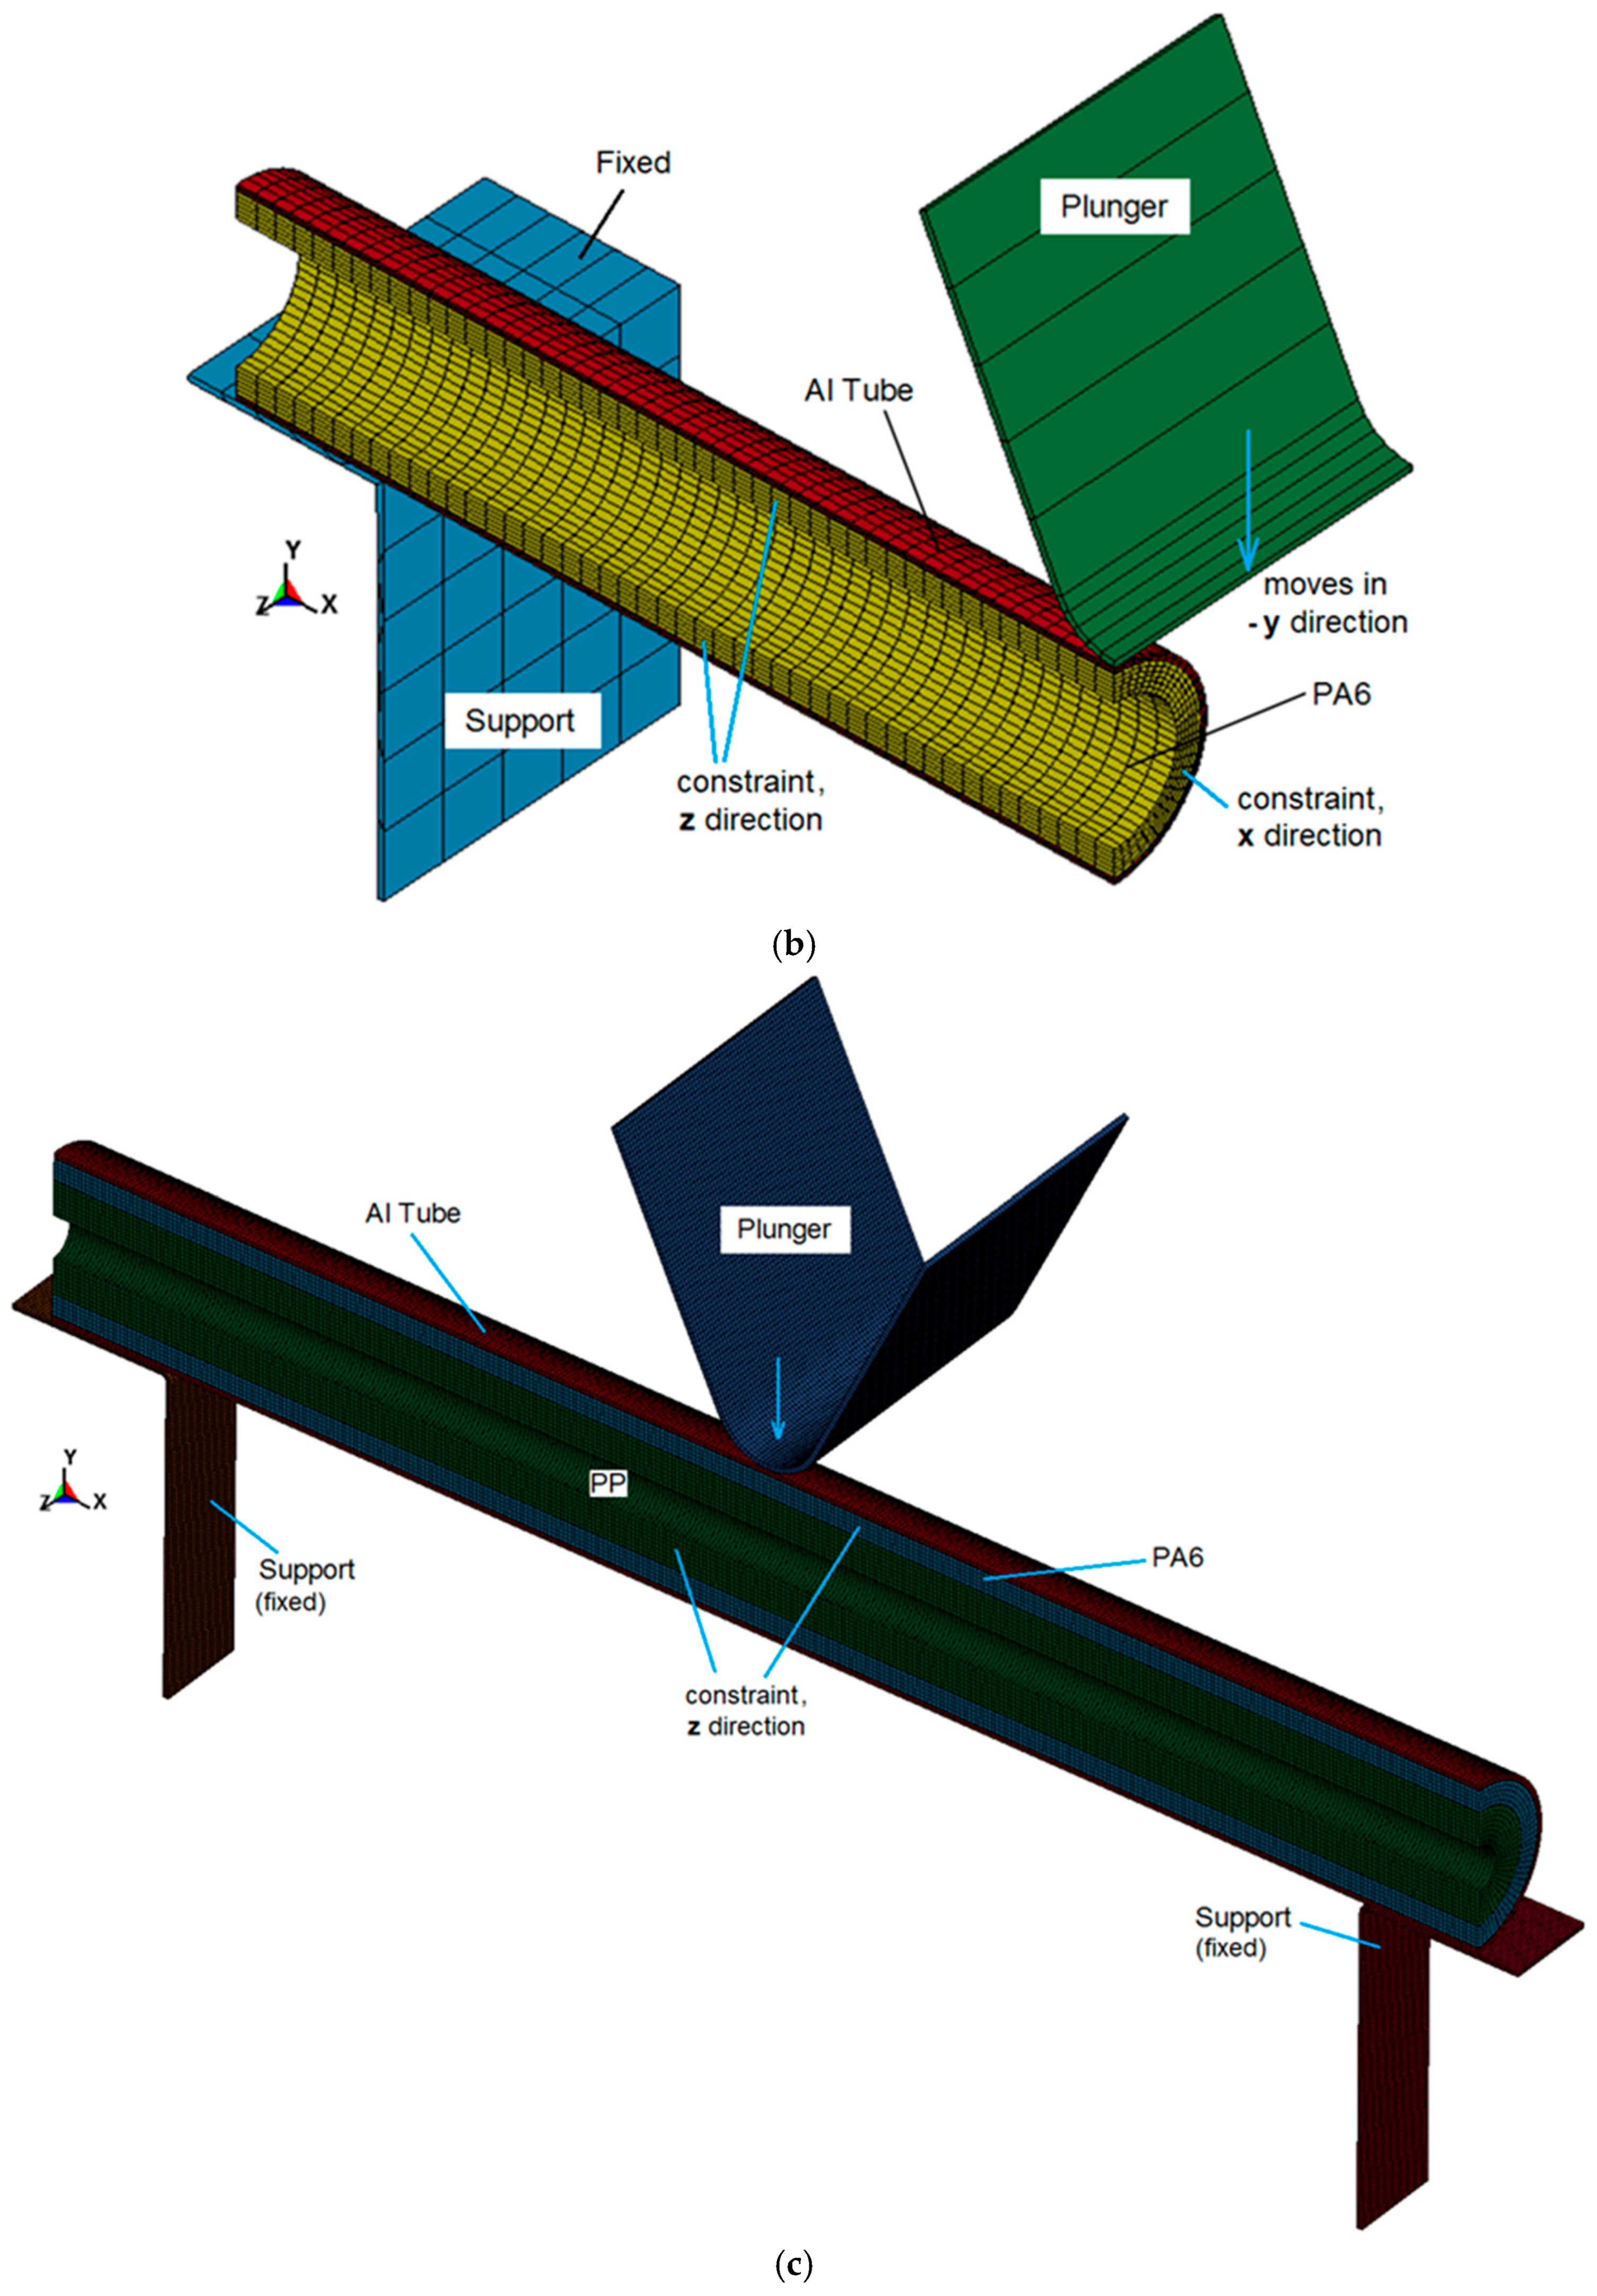
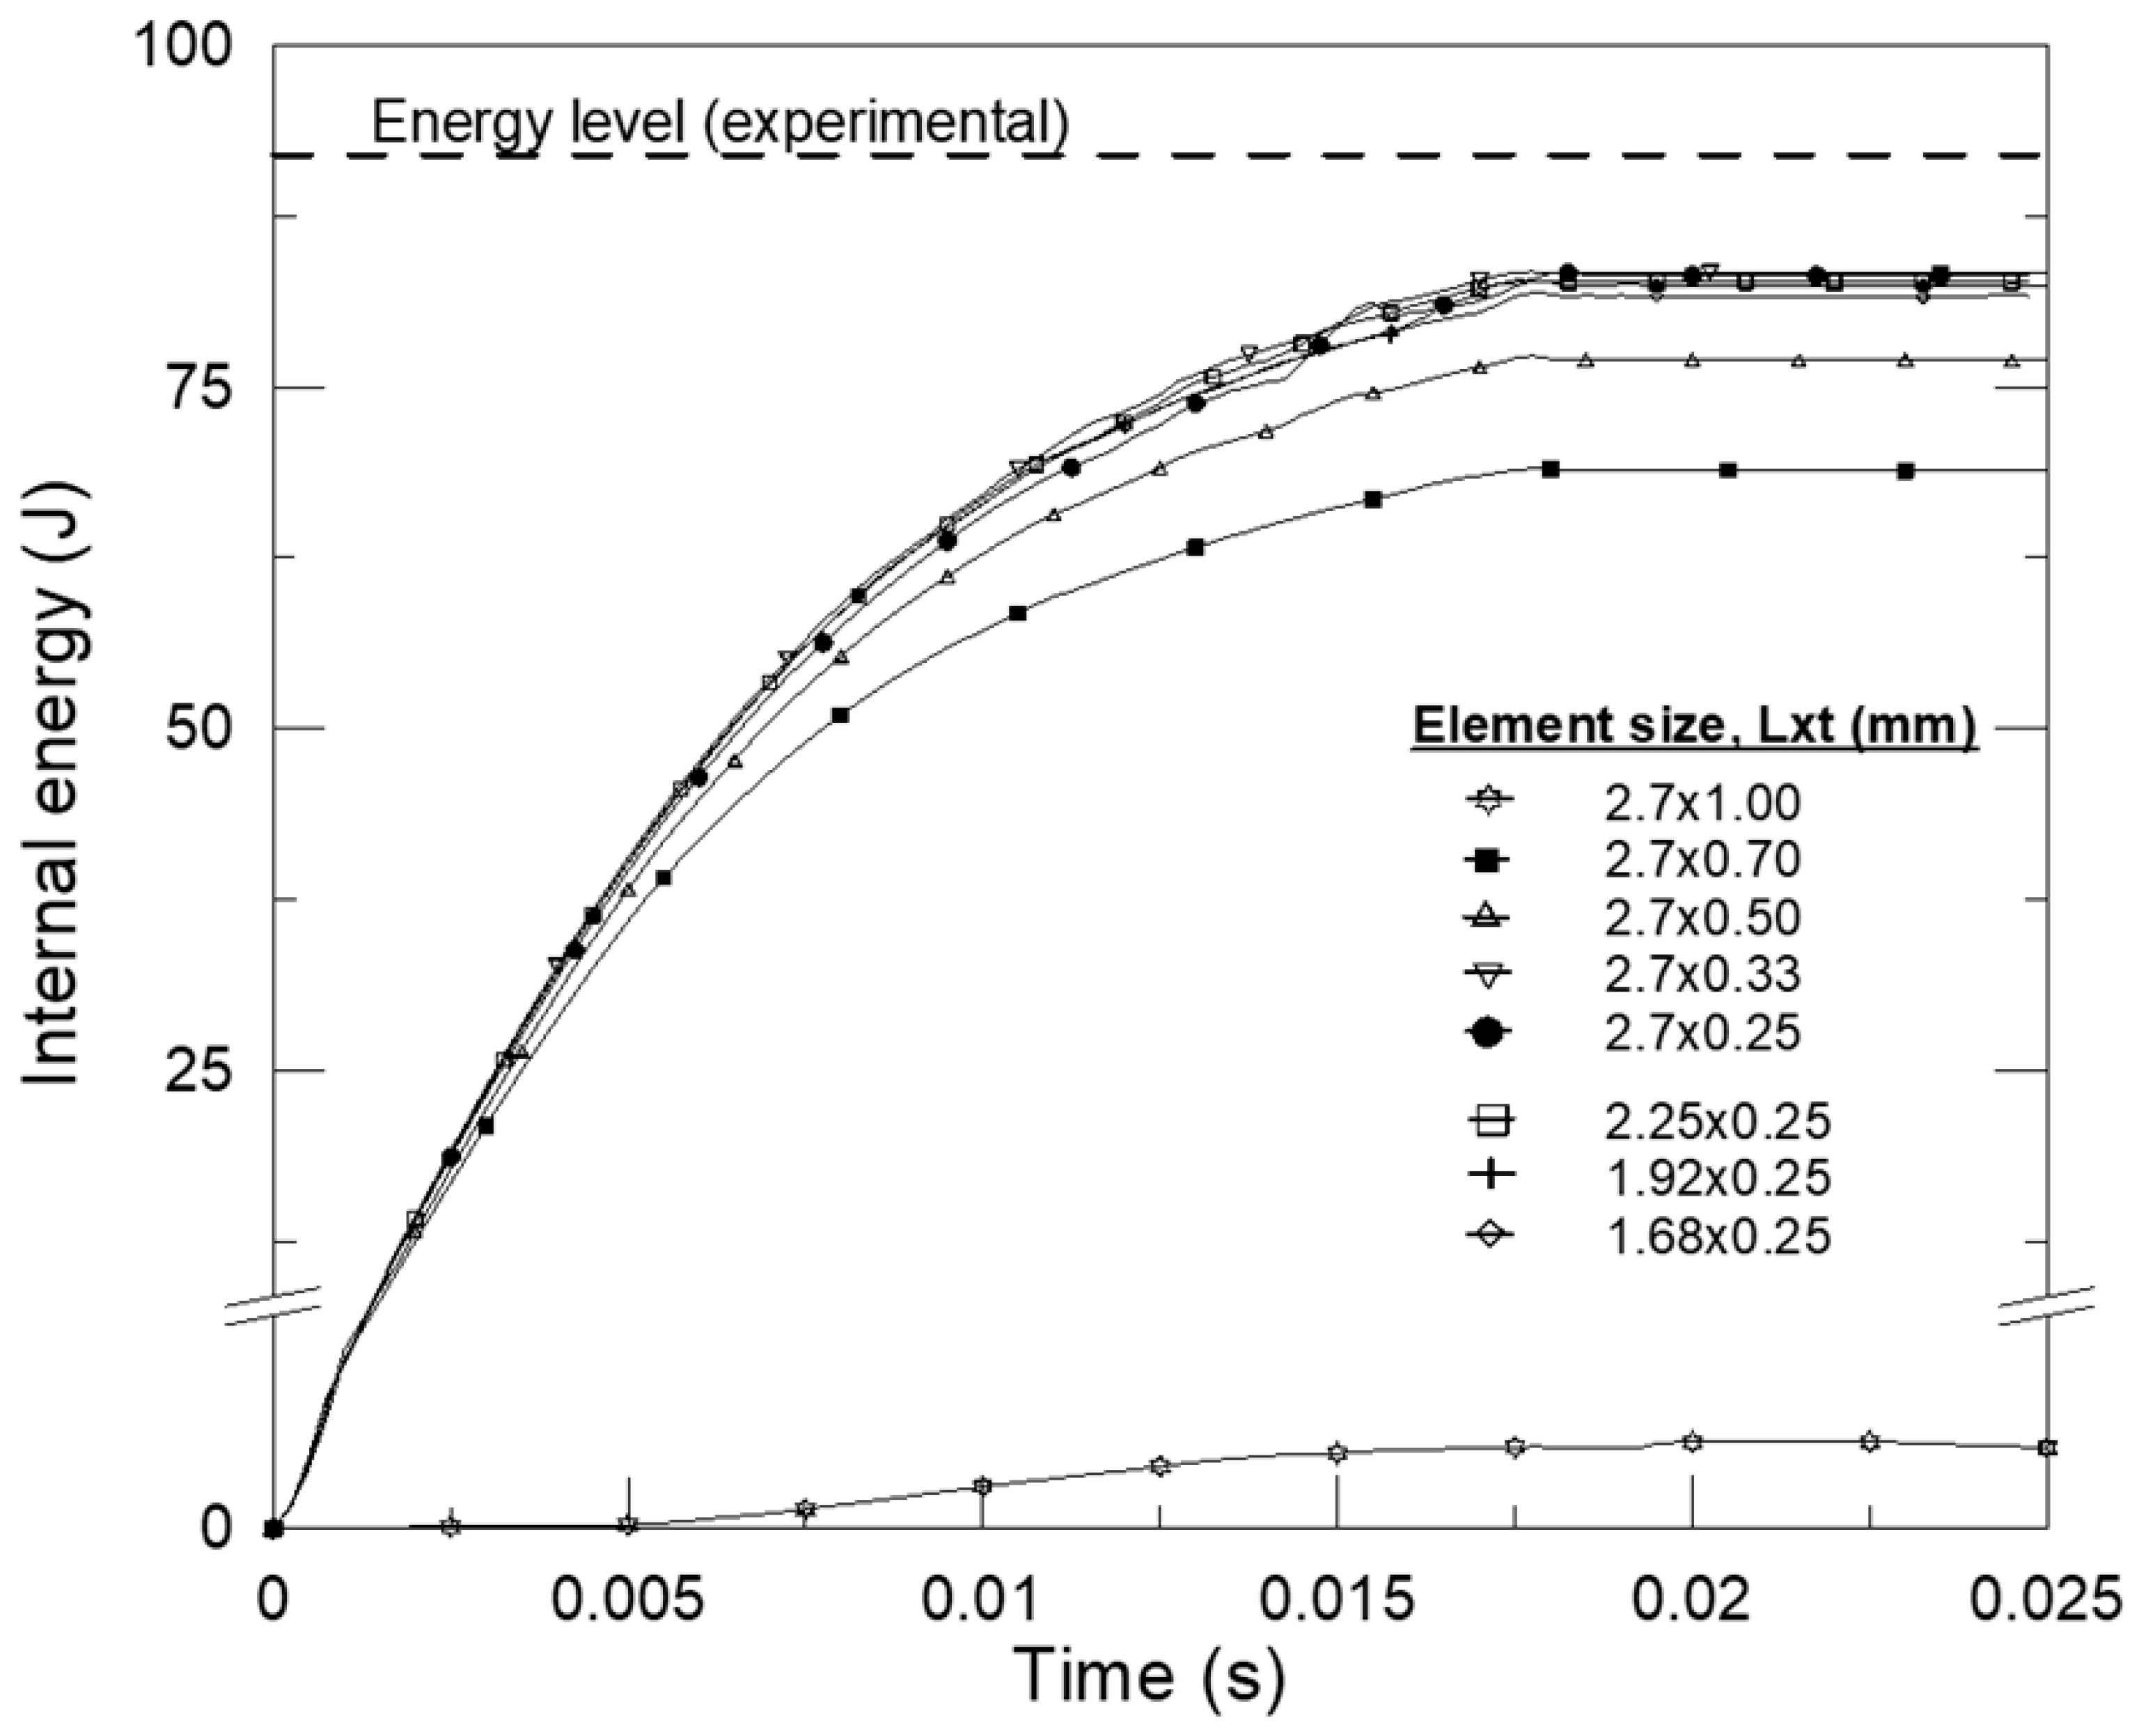
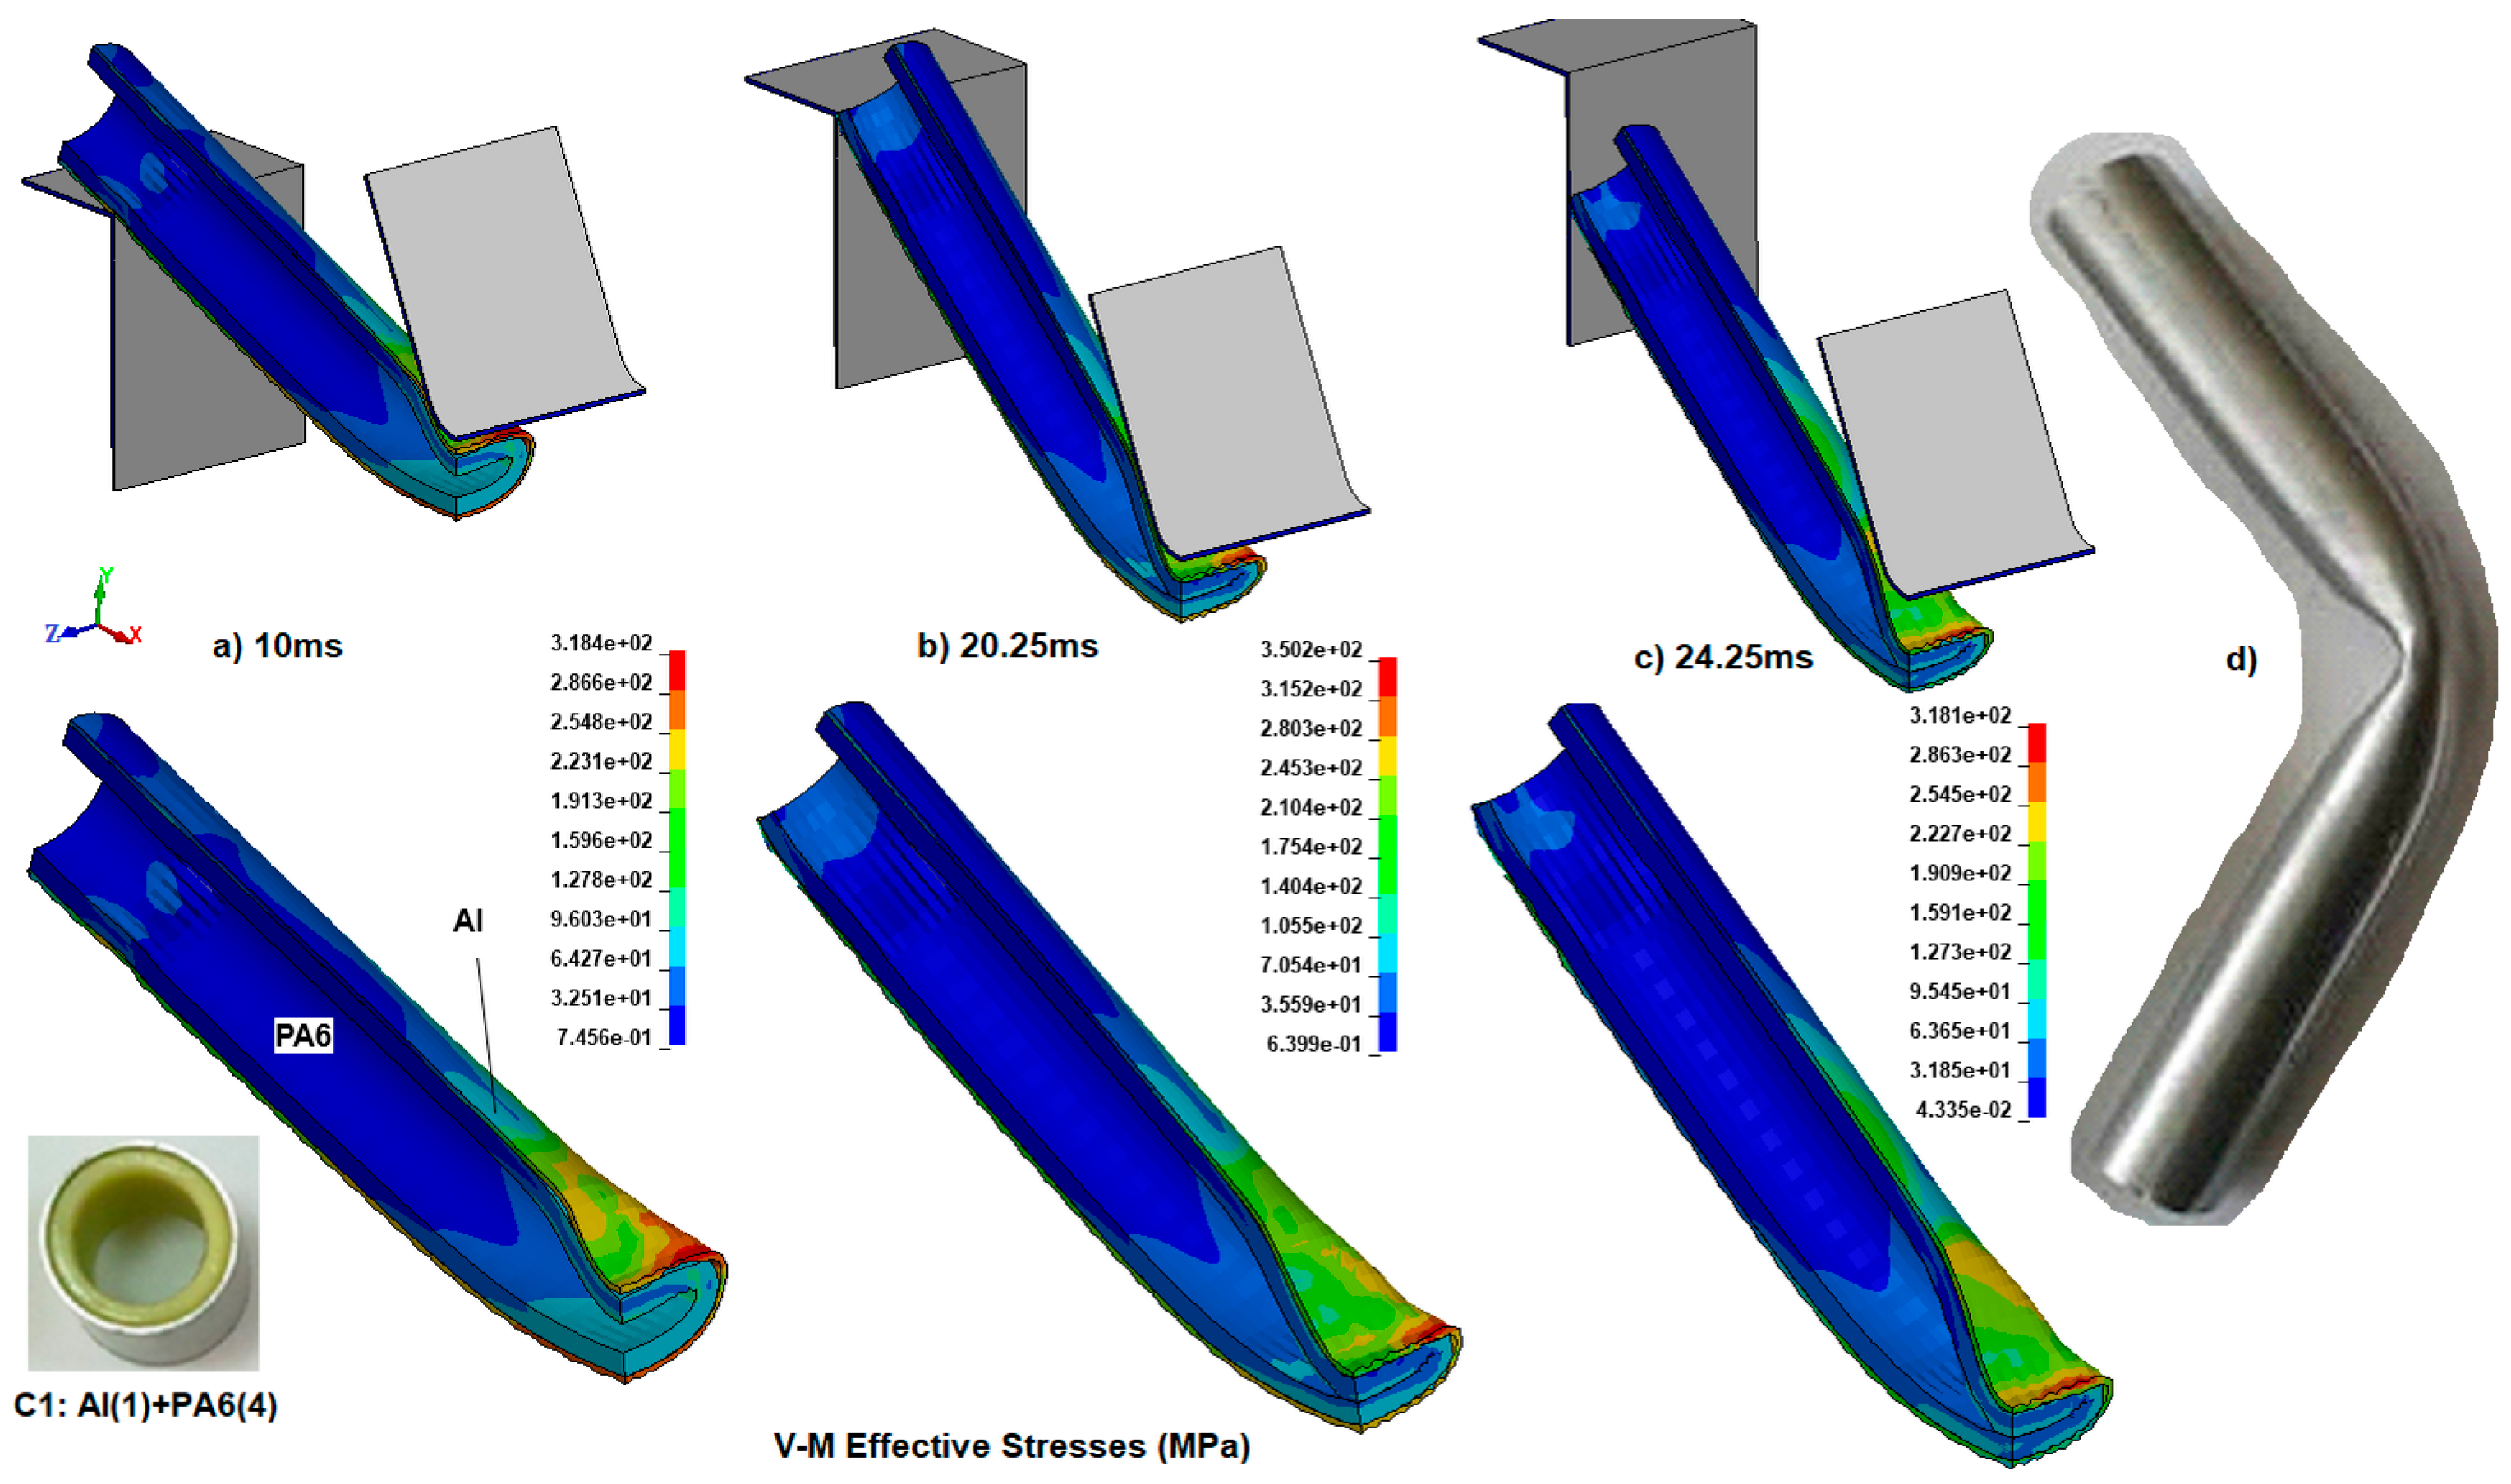
After the experiments, the deformation process, fracture initiation, crack growth, and failure (breakage) could not be determined precisely. To clarify the deformation and failure procedures of the specimens, time-dependent explicit dynamic simulations were run for all specimens using the LSDYNA explicit solver. After experimental validation of a not broken prior quarter finite element model of specimen C1, the results were shown in
Figure 6a–c. To continue with the not broken specimen C, which is a hollow, plain Al tube, the methodology of the C1 specimen was also applied to this FE model.
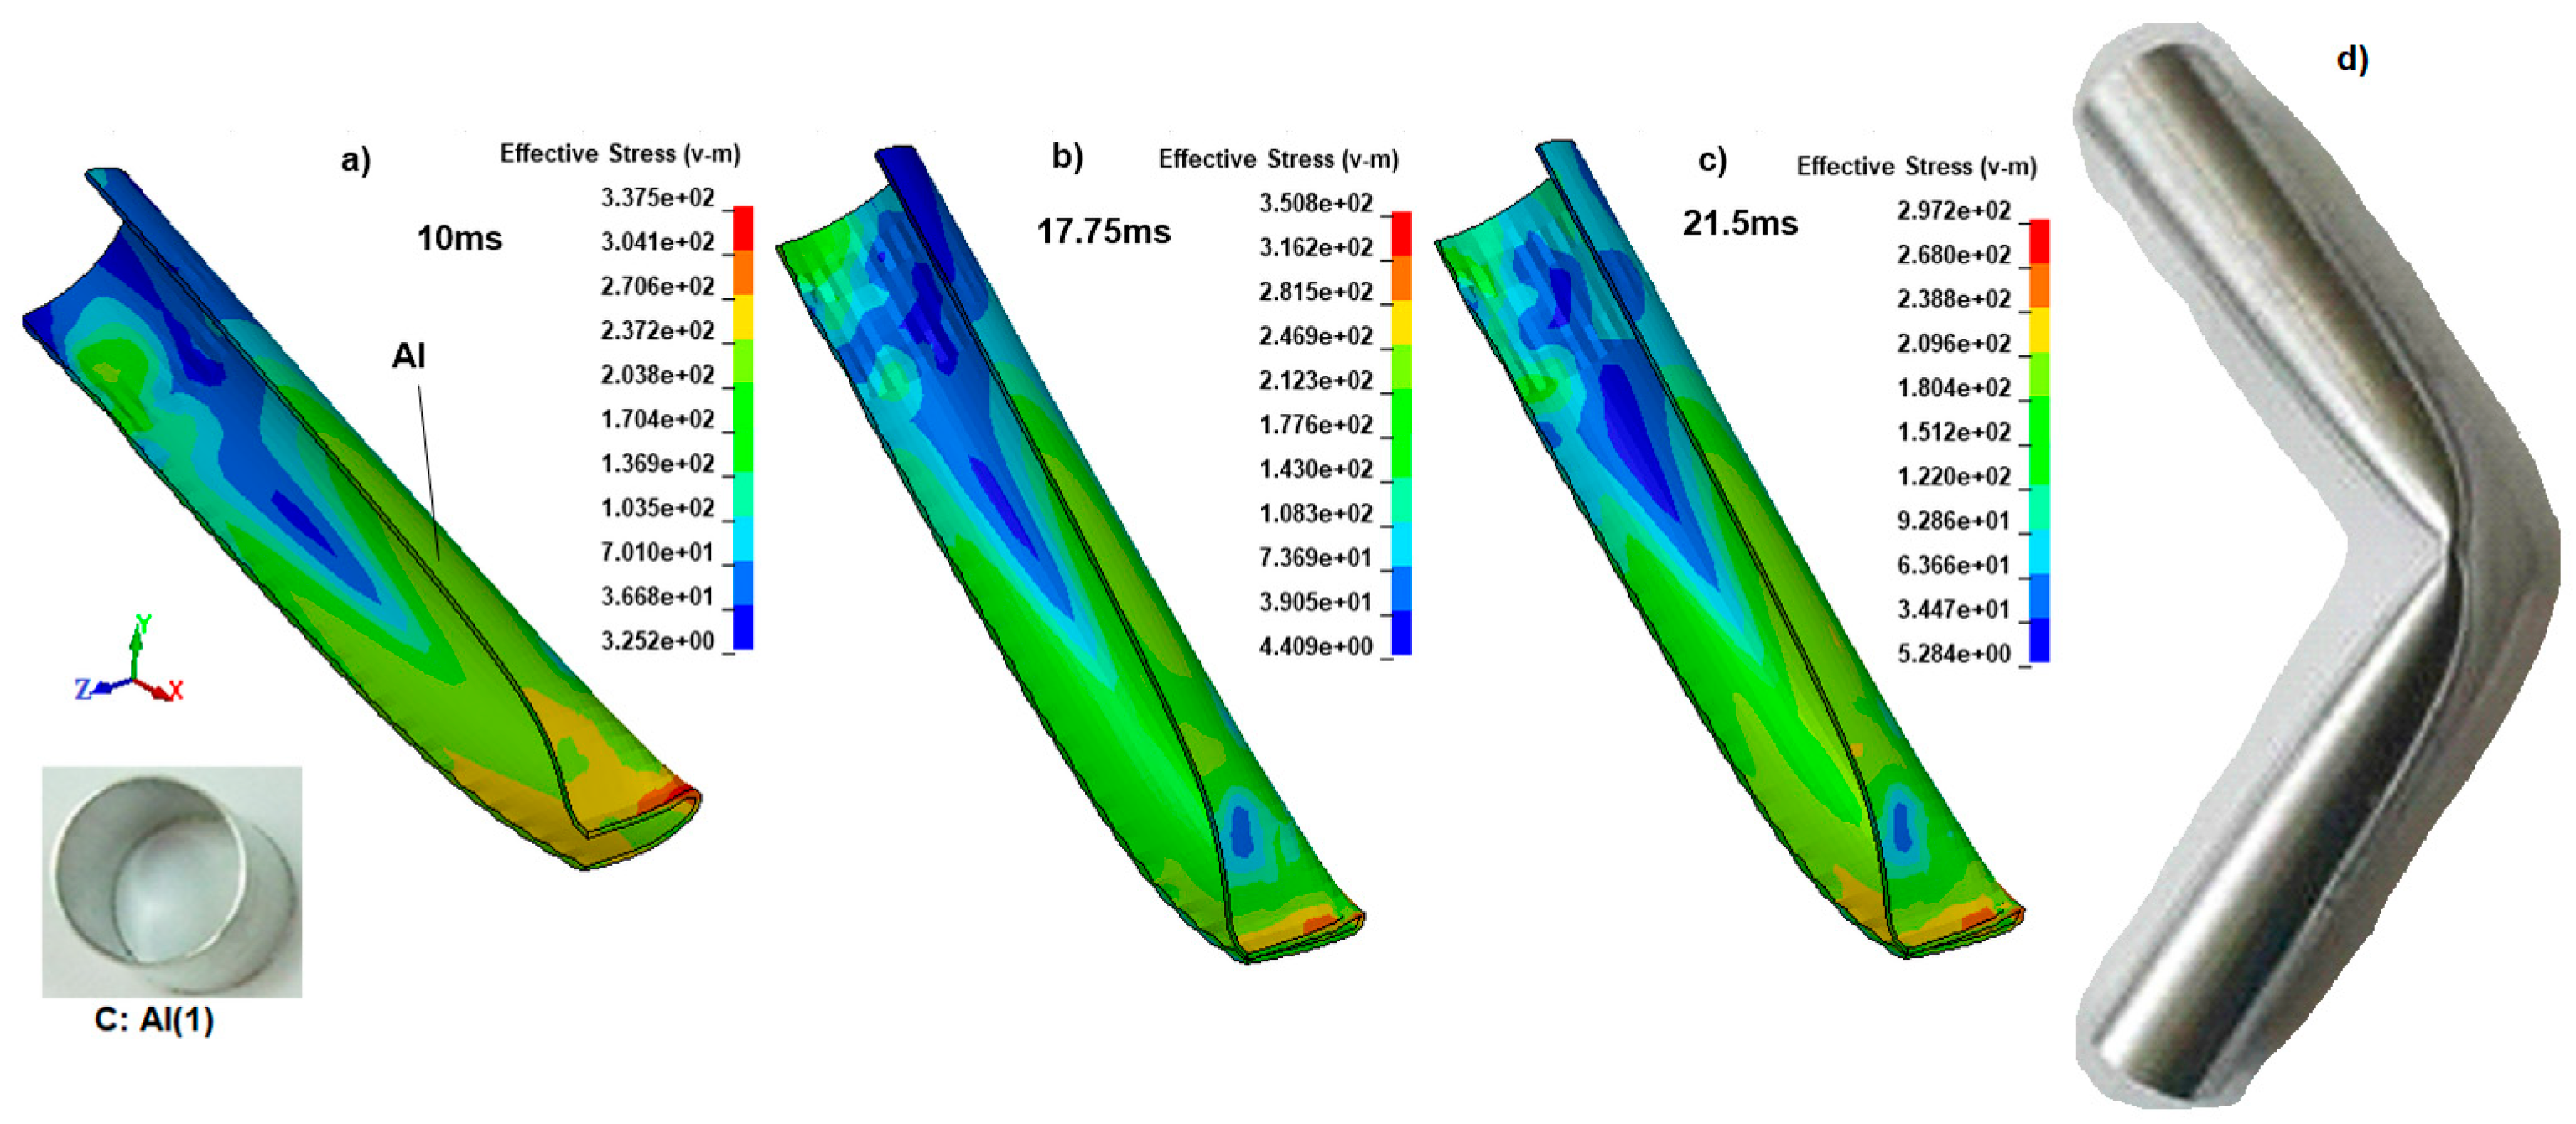
Figure 11 represents the bending impact simulation steps for the other specimen, C.
With increased support from the polymeric inner reinforcements, the bending deformation behavior begins to change. That is why we have selected the critical deformation steps to correctly determine each specimen’s behavior, unless we need to apply the same time steps.
Figure 11a–c indicates the general bending behavior of the hollow Al tube (C) for the 10 ms, 17.75 ms, and 21.5 ms. Local plastic deformation increased with increasing displacement of the V-shaped impactor at the corner of the tube section in the plastic hinge region at 10 ms, as shown in
Figure 11a. The second stage at 17.75 ms depicts the specimen just before the supports (
Figure 11b). Because the Al tube resisted entering between the supports, the reactions increased, and the Von Mises stress reached a maximum of 350.8 MPa. In the last stage, the tube is between the supports for a while after severe deformation in the middle part of the specimen, resulting in contact between the upper and lower portions of the tube, with one surface folding against the other (
Figure 11c). It is clear that this region is under the maximum stress (297 MPa) and is critical to failure. Between 17.75 ms and 21.5 ms, a hinge mechanism occurred without fracture because there is no reinforcement within the Al, and the tube can buckle easily in the plastic zone. The average absorbed impact energy calculated from the hollow Al tube experiments was approximately 85 J. The deformed experimental specimen of C is shown in
Figure 11d, while the simulation model captured the hinged deformation observed in the experiment.
Nevertheless, the general stress at other locations in the Al tube was about 150 MPa. Additionally, using the quarter model, which held the longitudinal center of the specimens, we were unable to detect wrinkling on the top surface of the Al tube as an insufficiency. However, approximately 98% validation was achieved using simulation results from specimen C1, which served as a prior validation model, and from specimen C (a hollow Al tube), which was compared with experimental results.
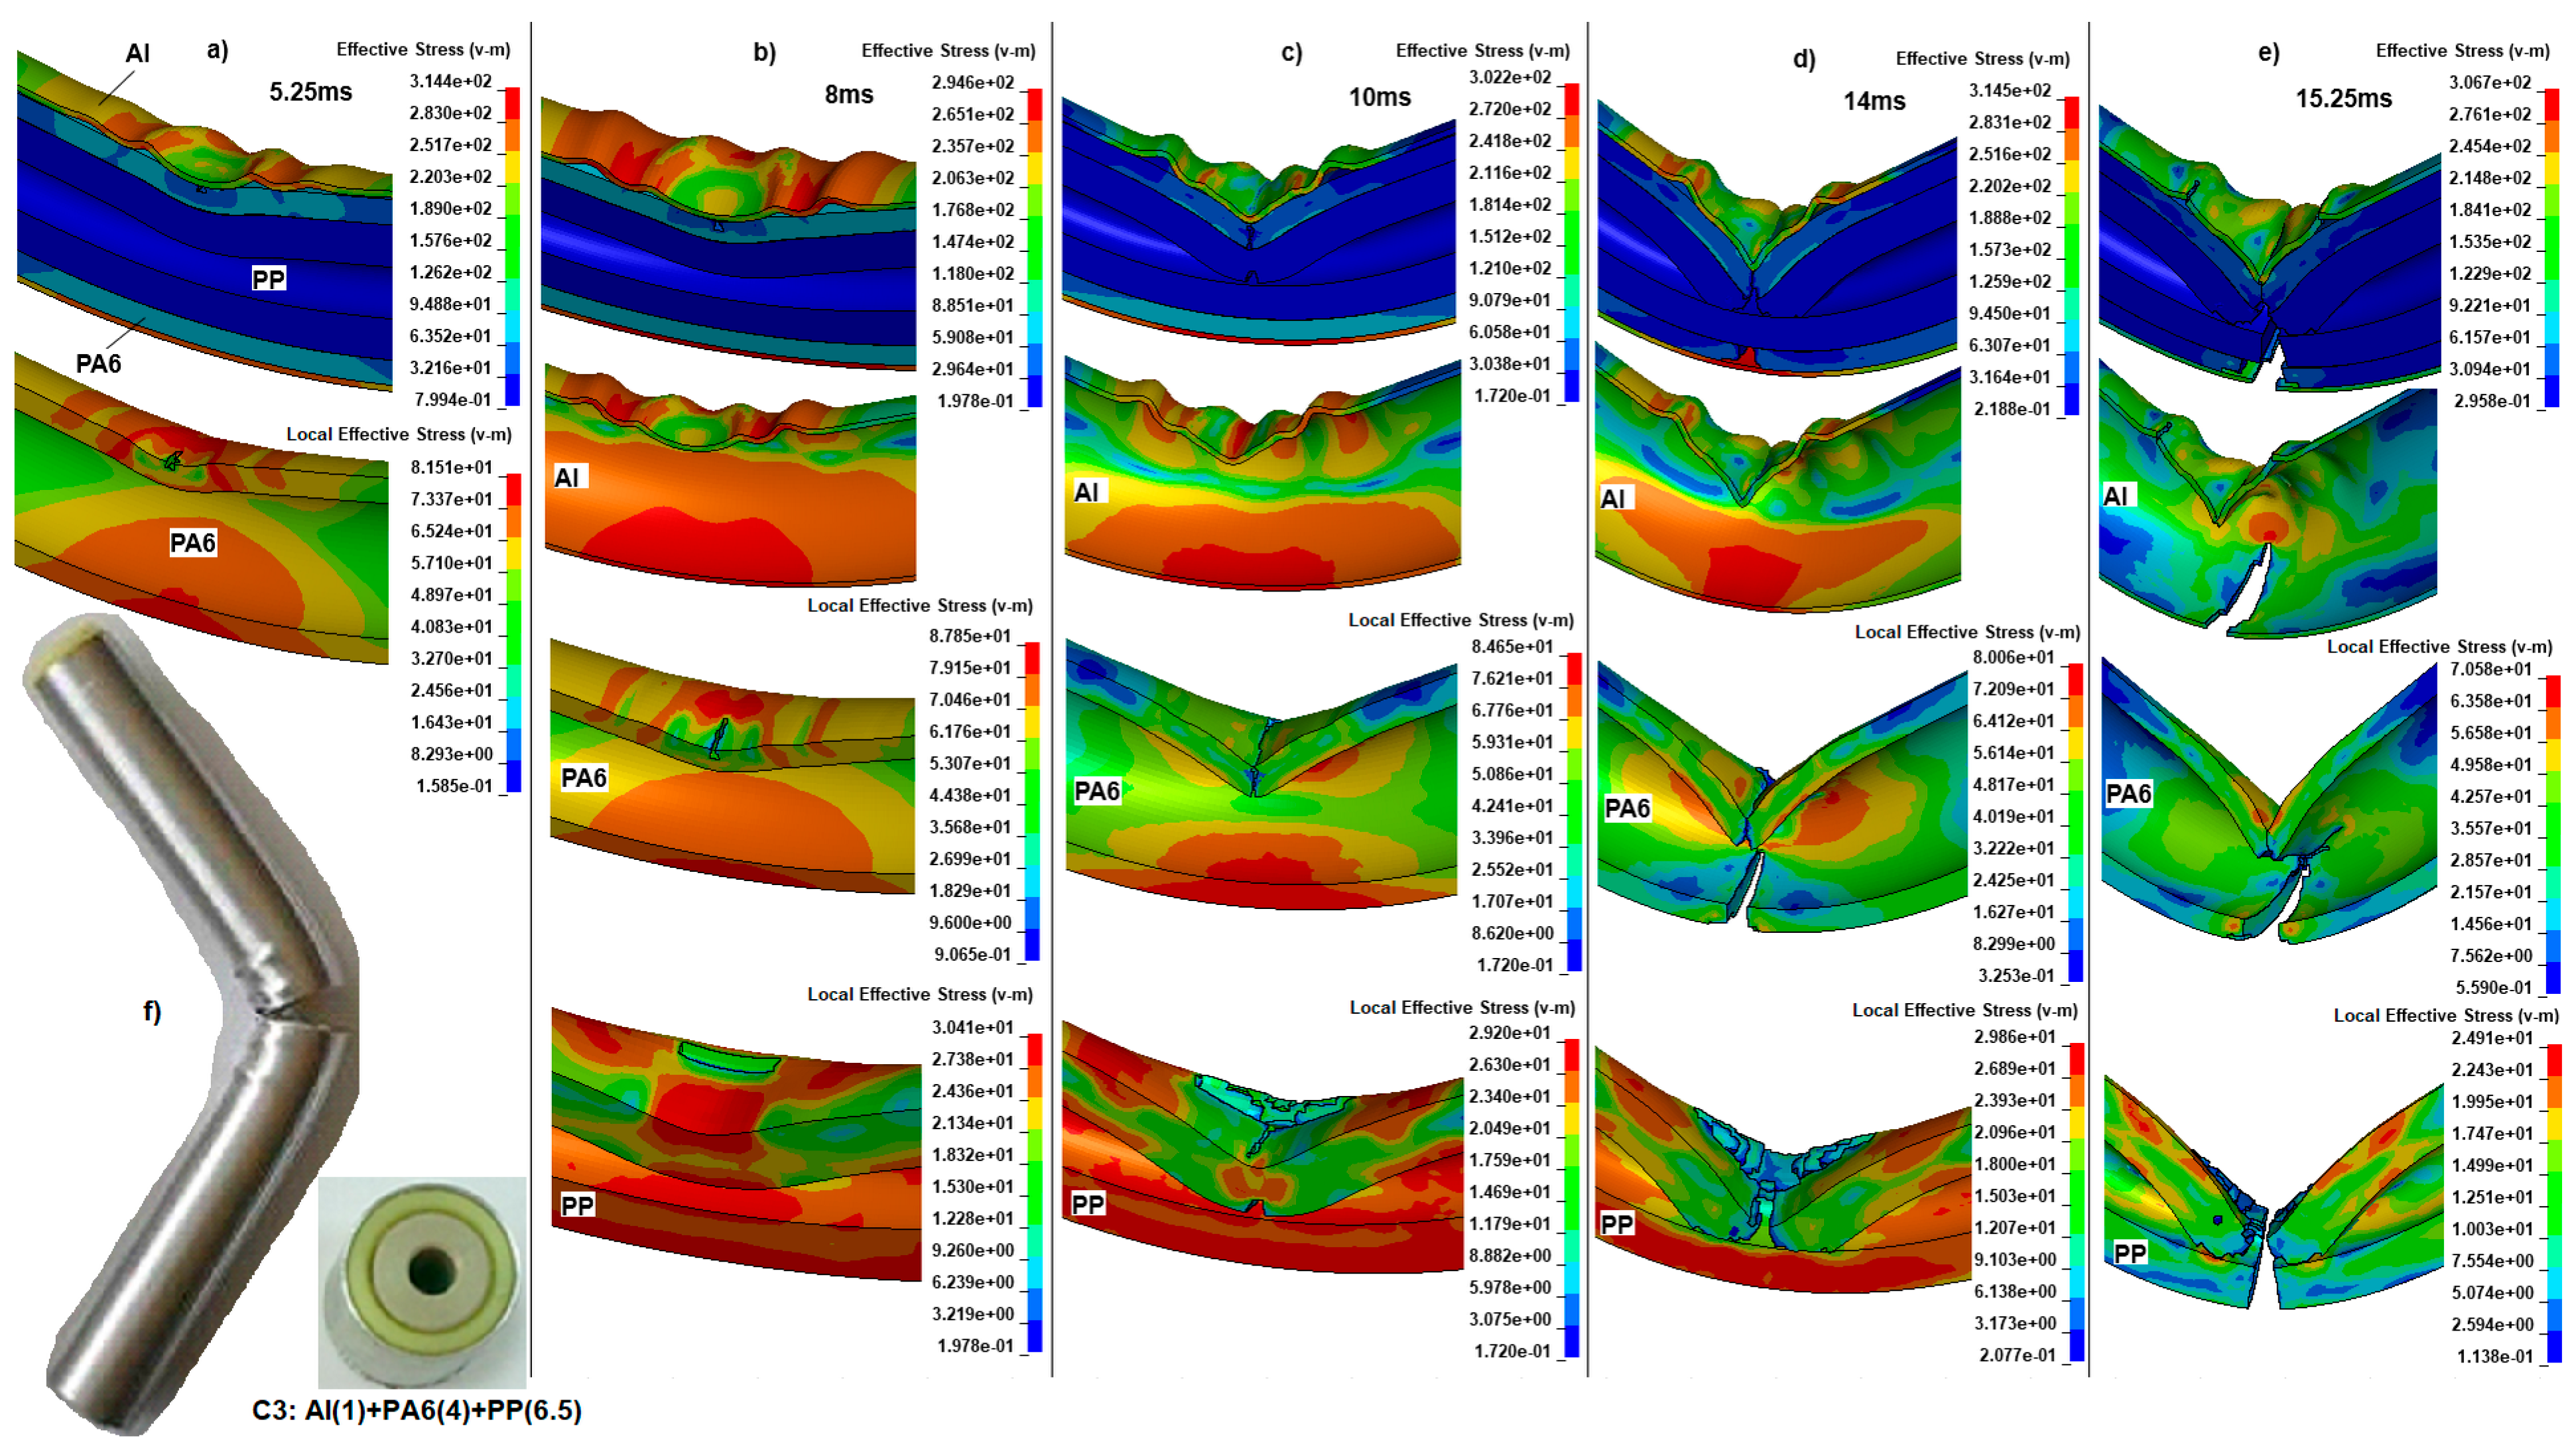
After the experimental validation of the specimens C and C1, which used not broken quarter finite element models, we created half-finite element models for the broken specimens C2 and C3. To ensure that the bending impact behavior and failure of the specimens C2 and C3 were similar, the deformation steps of the thicker PP-reinforced Al and PA6 specimen C3 will be described. Using the Von Mises stress definitions in the local (polymeric materials) and global (entire specimen) domains, we will be able to characterize crack initiation, growth, failure, and rupture for the specimen C3 in
Figure 12a–e.
Figure 12a–e shows the deformation behavior, crack initiation, and growth in each layer of specimen C3. The deformation steps differ from those of the others due to the changing thicknesses of the polymeric reinforcements, leading to different reactions. After the lower portion of the wall was stretched during the initial stage, wrinkling occurred at the upper portion of the wall, opposite the quarter model at 5.25 ms (
Figure 12a). However, we emphasize that the half model can detect wrinkling in the Al tube. Also, a crack initiated at the top center of the first inner filler PA6 as the displacement increased because the v-m stress exceeded the plastic failure stress, with a local stress of 81.51 MPa. In contrast, the entire composite structure’s maximum stress was 314.4 MPa at some locations. The PP material’s stress was so small that it did not affect the structure. Although the maximum stress was that high due to the inner fillers, the Al tube did not deform much.
While stress increased at 8 ms, the top surface of the Al tube wrinkled further, reducing stress due to redistribution to the stretched section to 294.6 MPa at the bottom surface (
Figure 12b). During this phase, the crack was growing under a v-m stress of 87.85 MPa from the top center of PA6 toward the back. At the same time, the PP was compressed (30.41 MPa) on the backside of the top surface.
At the 10 ms stage, the total stress began to increase again to 302.2 MPa as it tried to form a hinge. Still, the inner reinforcements prevented the Al tube from deforming, as shown in
Figure 12c. As a result, the PA6 top surface was completely fractured, and the stress decreased to 84.65 MPa after failure. The compressed top of the central back of PP was further crushed, and two cracks from the top part of the tube’s back, bottom, and top grew and reached the center with a v-m stress of 29.2 MPa, more than the rupture point of PP.
In the next phase at 14 ms, the top center of the Al tube buckled sharply and fractured from the center to the back under v-m stress of 314.5 MPa, depicted in
Figure 12d. Although the top surface had failed, the bottom portion of the Al tube continued to resist. We expected the Al tube to fail before the polymeric reinforcements, but at 10 ms, due to the stress concentration at the top (84.65 MPa), the PA6 at the bottom (80 MPa) broke, splitting into two pieces. In the meantime, the top center zone of PP was severely deformed, with the local v-m stress being 29.86 MPa above the plastic failure region.
The final failure step of the C3 specimen occurred at about 15.25 ms. Immediately after, the Al tube reached a maximum v-m stress concentration of 314.5 MPa at 14 ms (
Figure 12e). The bottom part suddenly fractured laterally, accounting for more than half of the tube at 15.25 ms. The step before, the PA6 was broken, and due to relaxation, the stress decreased to 70.58 MPa. The similar failure behavior of the Al tube was observed in PP, with a sudden breakage of the remaining, unbroken part, splitting it into two pieces. The experimental result of the specimen C3 is given in
Figure 12f. When we compare the experiment with the simulation, we found that increasing inner reinforcements causes the hinge mechanism to disappear and fractures due to the increasing bending radius. Based on the explained bending failure steps for C3, the mean absorbed impact energy was 367 J.
Considering the splitting failure deformation of the specimen C3, it was not applicable as a passive protection bar. However, the simulation results validate the experimental data with approximately 91% correctness.
When the specimen C2 is compared with C3, C2 shows similar deformation characteristics. While the thickness of PA6 for the specimen C2 was the same as that of C3, the thickness of PP was smaller, that is, about 3.5 mm. Because of its smaller thickness, the C2 will have a smaller cross-sectional moment of inertia, resulting in lower stiffness and bending resistance.
The lower thickness of PP led to earlier crack initiation at 5 ms, with PA6 at the same phase. At 8 ms, we first observed deformation of PP in specimen C3. In addition, the top center of the PA6 was fractured at 10 ms for C3, but for C2, a similar deformation was at 6 ms. Thus, we can determine that the analogous instant and total breakage failure of PA6 occurred during 14 ms, considering C3. However, this time, the lower thickness of the PP, because of a little more bending before the top and bottom parts of the PP came together and touched, delayed the breakage of the Al tube. The delay mechanism was extended, and total failure continued until the last splitting situation, specimen C2 at 20 ms, while C3 split at 15.25 ms. As we saw in C3, the specimen C2 also lacked a hinge due to the increased bending radius, despite a 3.5 mm thick PP layer. However, because of its lower cross-sectional area, the average absorbed impact energy of C2 is 183 J, almost half that of C3.
Furthermore, one of the most important factors is the Specific Energy Absorption (SEA), which represents the absorbed energy per mass of the specimens (see
Table 3). When the specimens C2 (SEA: 0.885 kJ.kg
−1) and C3 (SEA: 1.563 kJ.kg
−1) were already torn apart, we could not use them for any structural applications under extreme loading conditions. However, for the hollow Al tube (specimen C), SEA is 1.245 kJ.kg
−1, and for the Al tube internally reinforced with 4 mm thick PA6 (specimen C1), SEA is 2.331 kJ.kg
−1, which clarifies the increment of the developed composite combination.
To determine whether we can offer an unbroken polymer-reinforced composite tube combination, we have only simulated using the validated FE modeling method with two additional PP thicknesses, 8 mm and 9 mm, and an additional filled PP model inside a constant 4 mm thickness of PA6, as we have used from the beginning.
For the 8 mm thick PP inside the 4 mm thick PA6 is specimen C4, and the 9 mm thick PP used inside the PA6 is specimen C5, while the full PP used inside the PA6 is specimen C6. After the bending impact simulations, specimens C4 and C5 continued to fail by splitting.
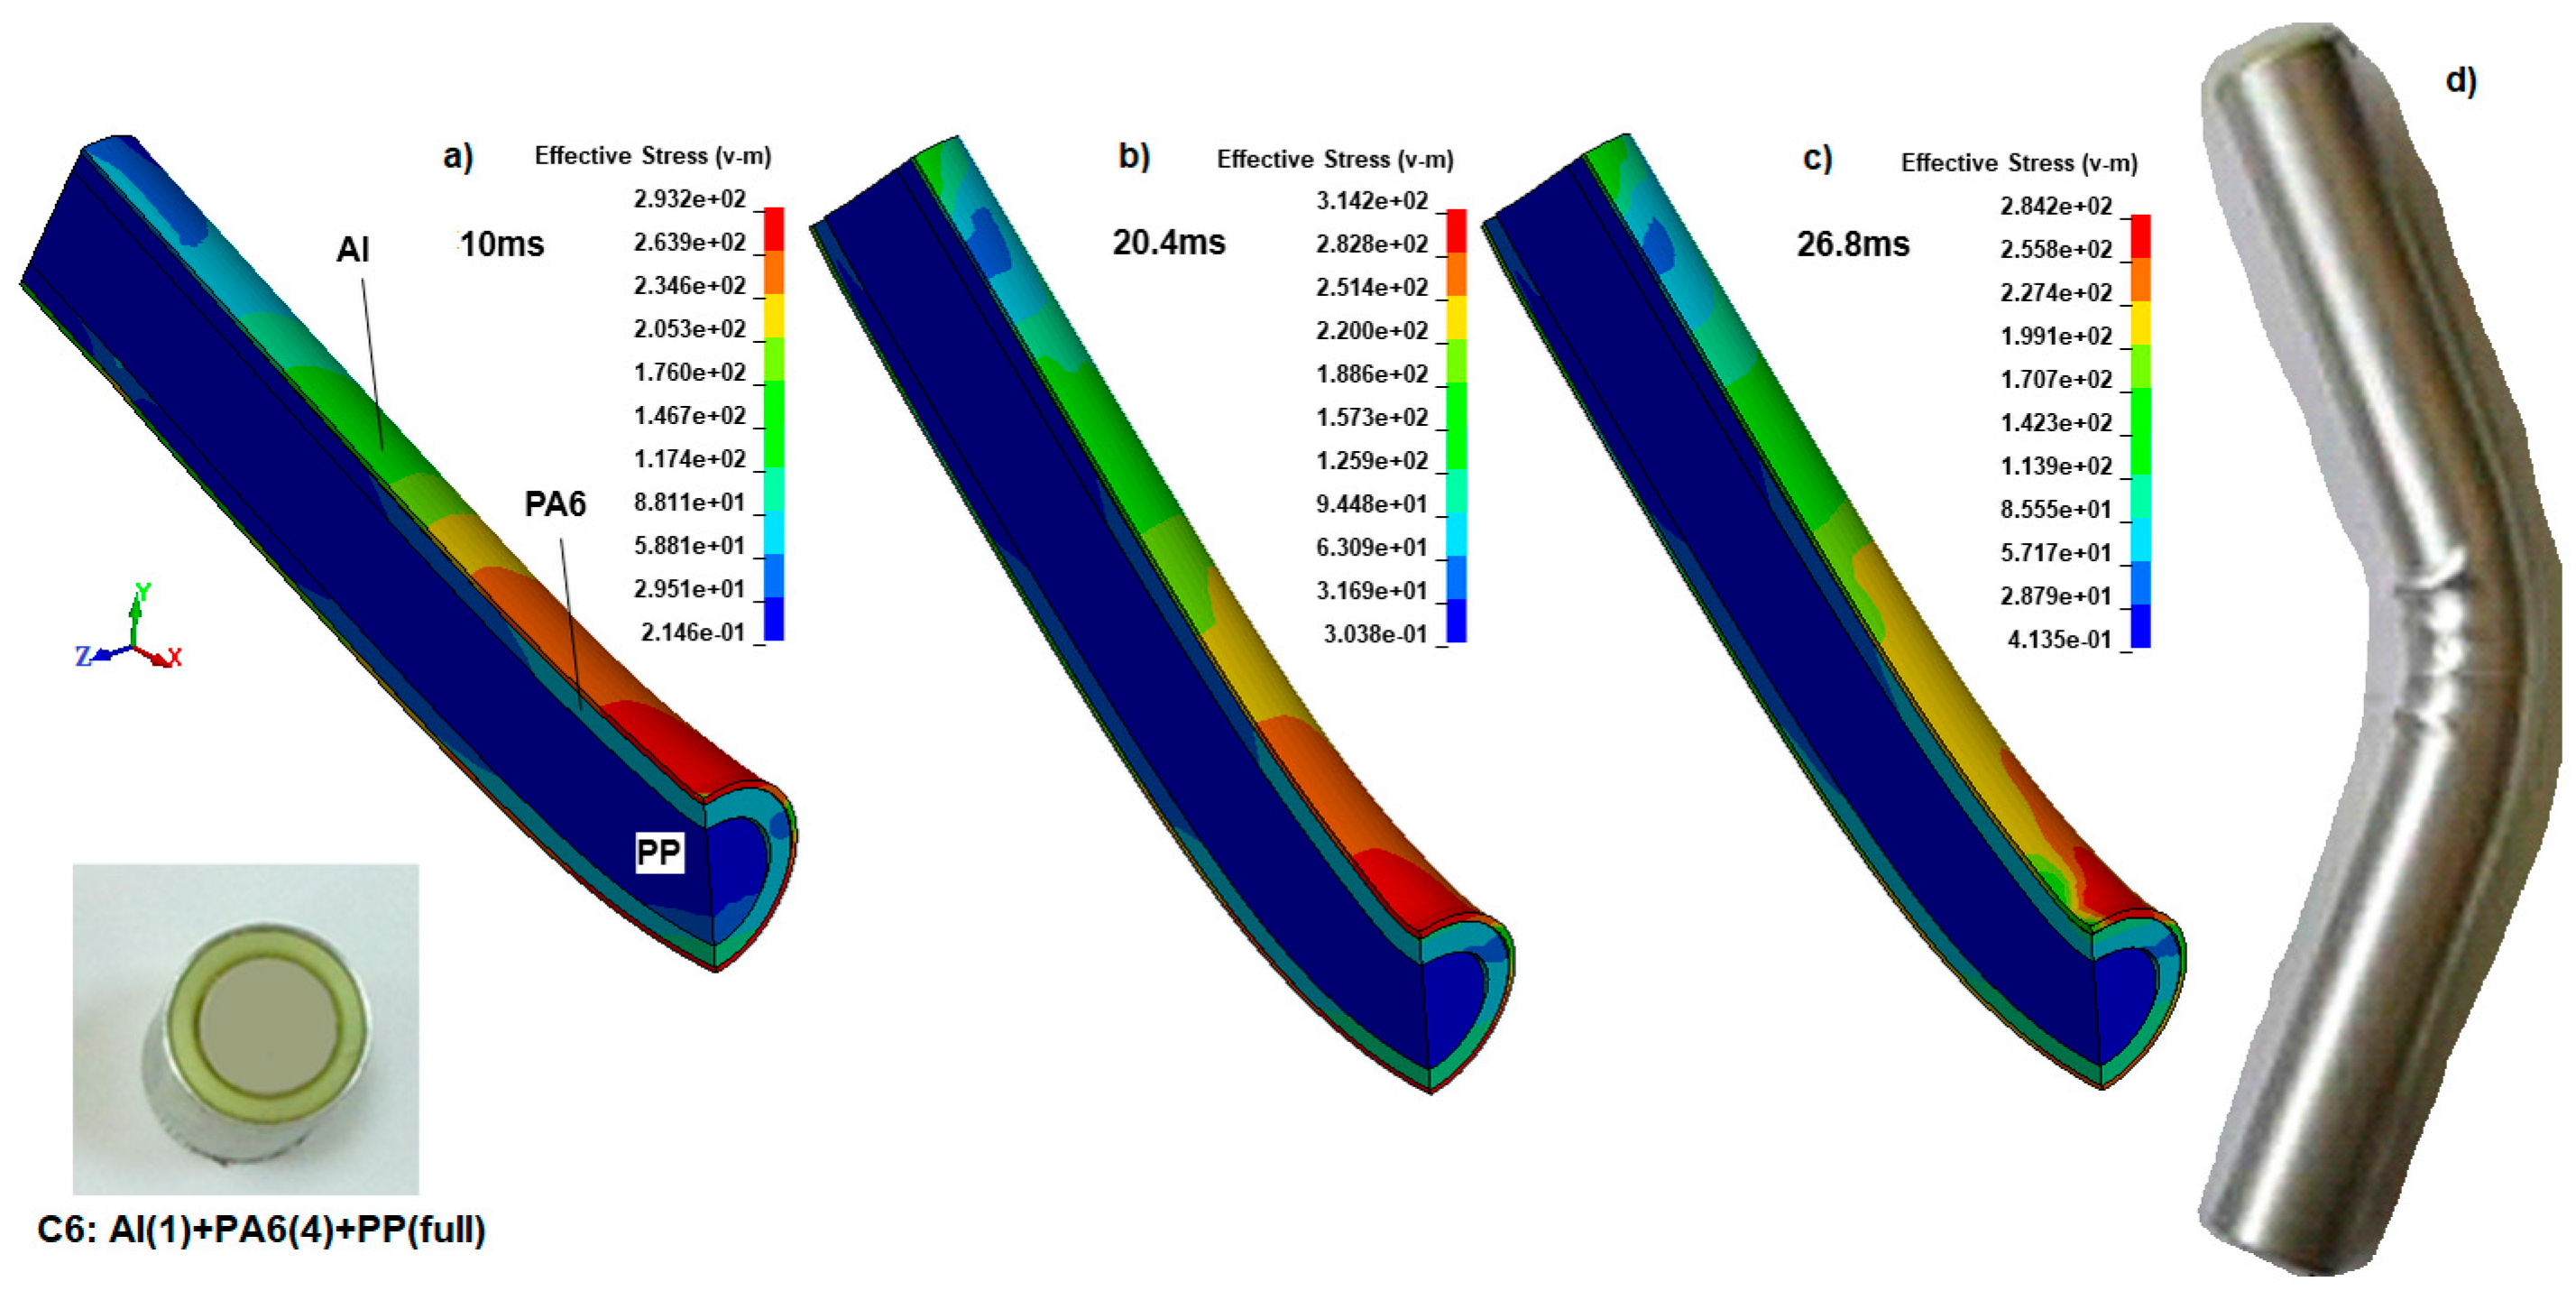
In the end, filled PP inside PA6 (specimen C6) was not broken (
Figure 13). From the simulation results, we found that when the PP inner reinforcement has a hole, it leads to bending failure. This means that for the 31 mm outer diameter Al tube with 1 mm thickness, it has not reached the critical cross-sectional moment of inertia to avoid bending failure. When the PP has no gap inside, the inner reinforcements support each other, forming a protective combination against the bending impact under extreme loading.
During the simulation of specimen C6 in
Figure 13a–c, the causes of the hourglass parameter adjustments and the shape of the FE model were revealed. Initially, the bending compression region’s Von Mises stress was about 293.2 MPa at 10 ms, slightly lower than that of sample C3 (302.2 MPa), in which the PP is 6.5 mm thick. When the pressure was increased, considering the inner reinforcement, there was no buckling in the radial space, unlike in hollow tubes. Instead of buckling or localizing similar to the hollow ones, the entire structure’s radius increased; that is why this effect reduces local stress values. The ends of the C6 polymer-reinforced composite tube reached 20.4 ms between supports, whereas the same behavior in the broken C3 was 14 ms, and the unbroken C1 was 20.25 and close to C6, as expected. Also, the distance between the supports was the same, and the volume of reinforcement material was greater than that of all other samples (C-C5). However, stress is higher than for specimen C2 and is close to that of C3, while this sample is close to the buckling stage but has not buckled.
To evaluate the final developments of the specimens after C3, the experimental results are compared with the explicit FE simulation results, and the convergence rate error is shown in
Table 4 along with the Specific Energy-Absorbing (SEA) capability.
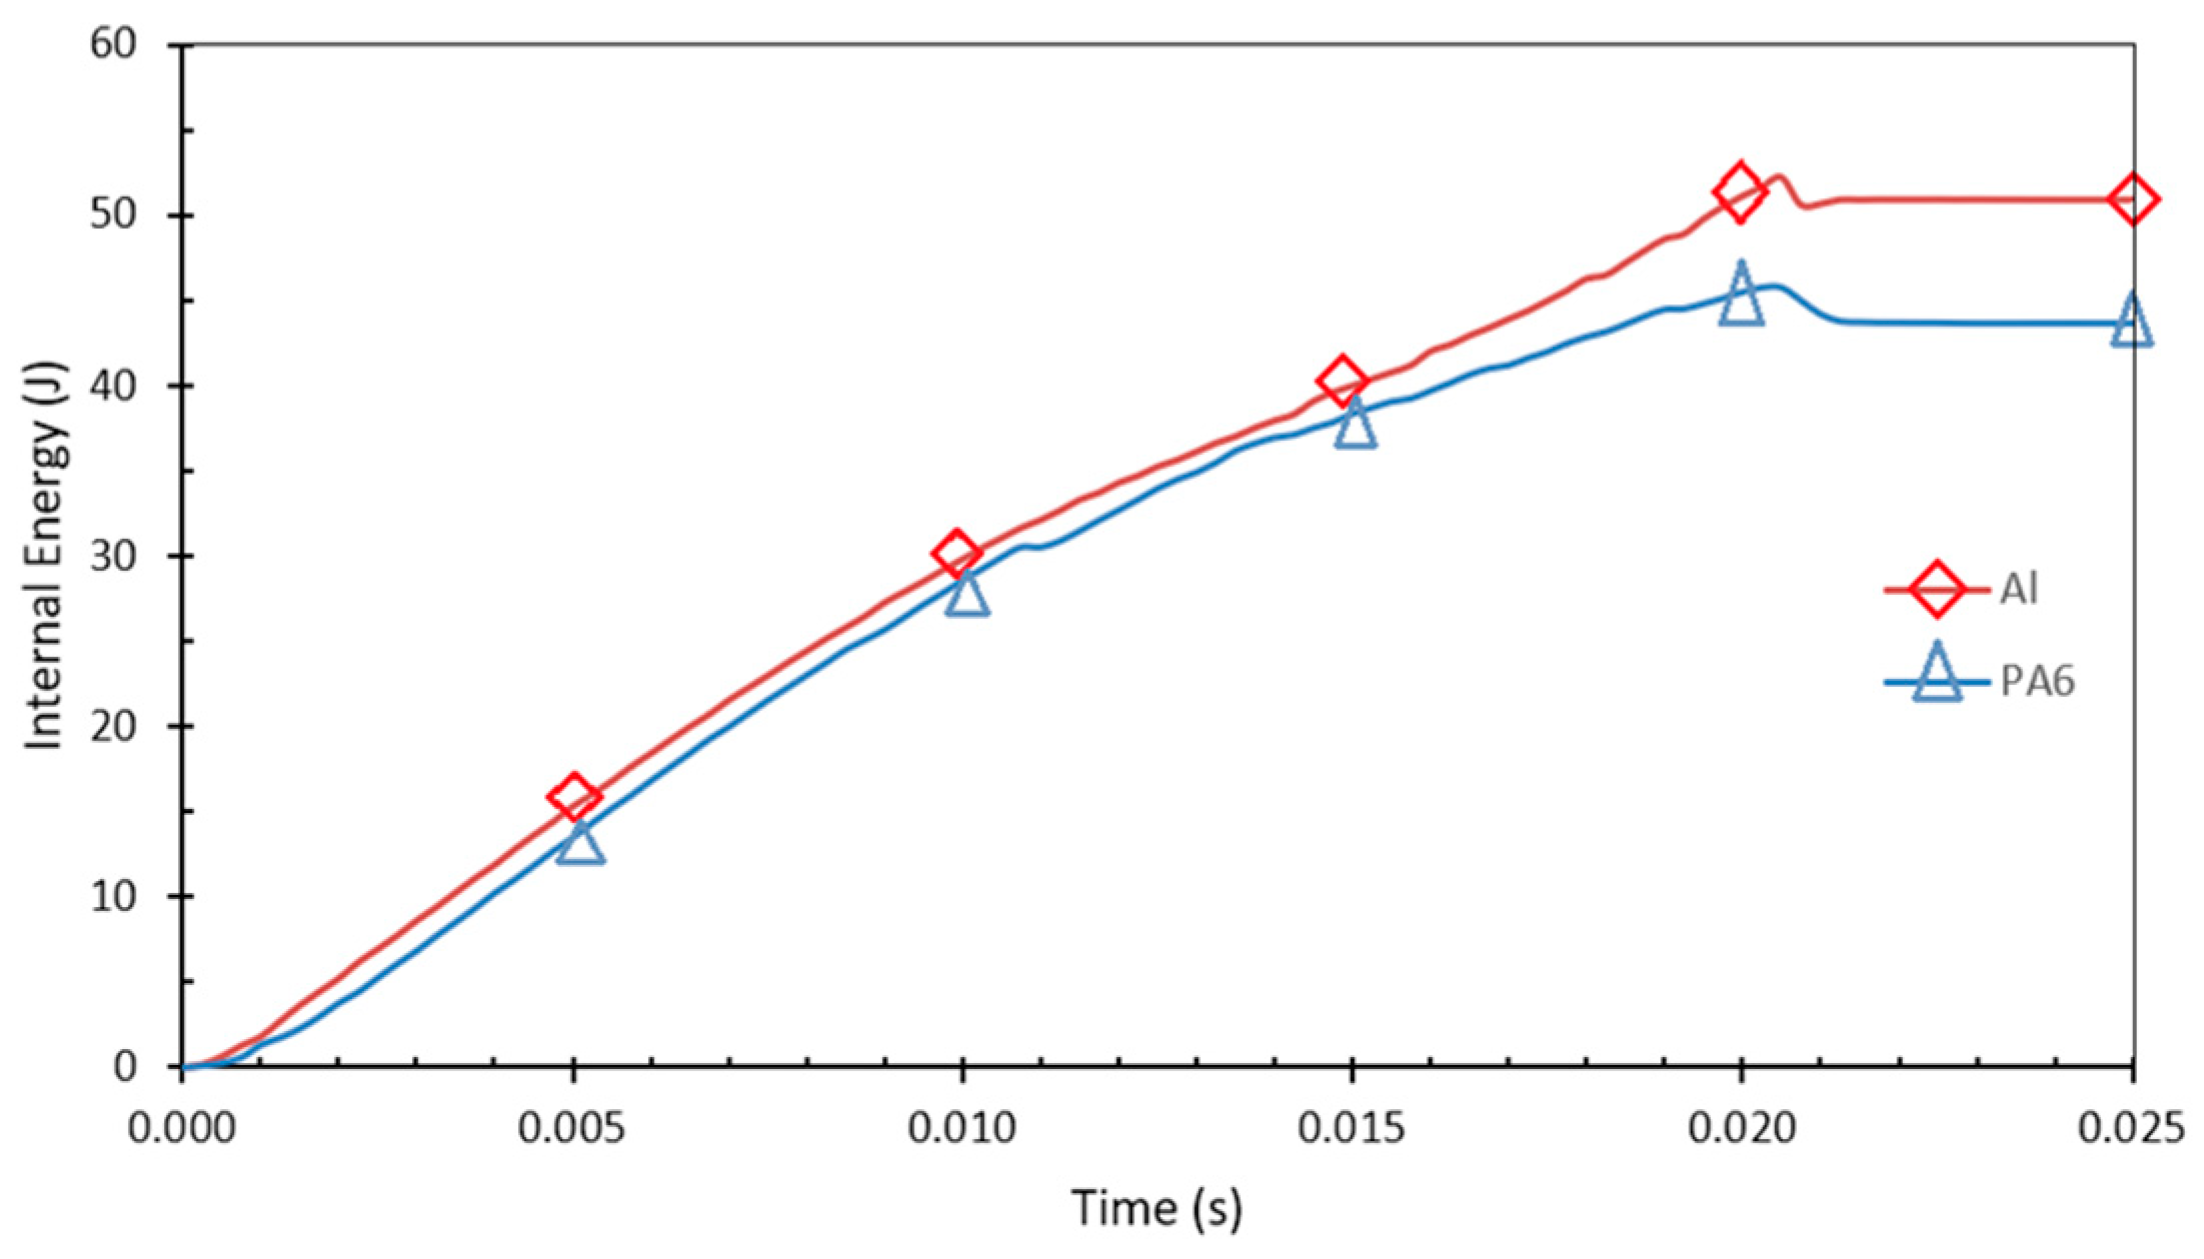
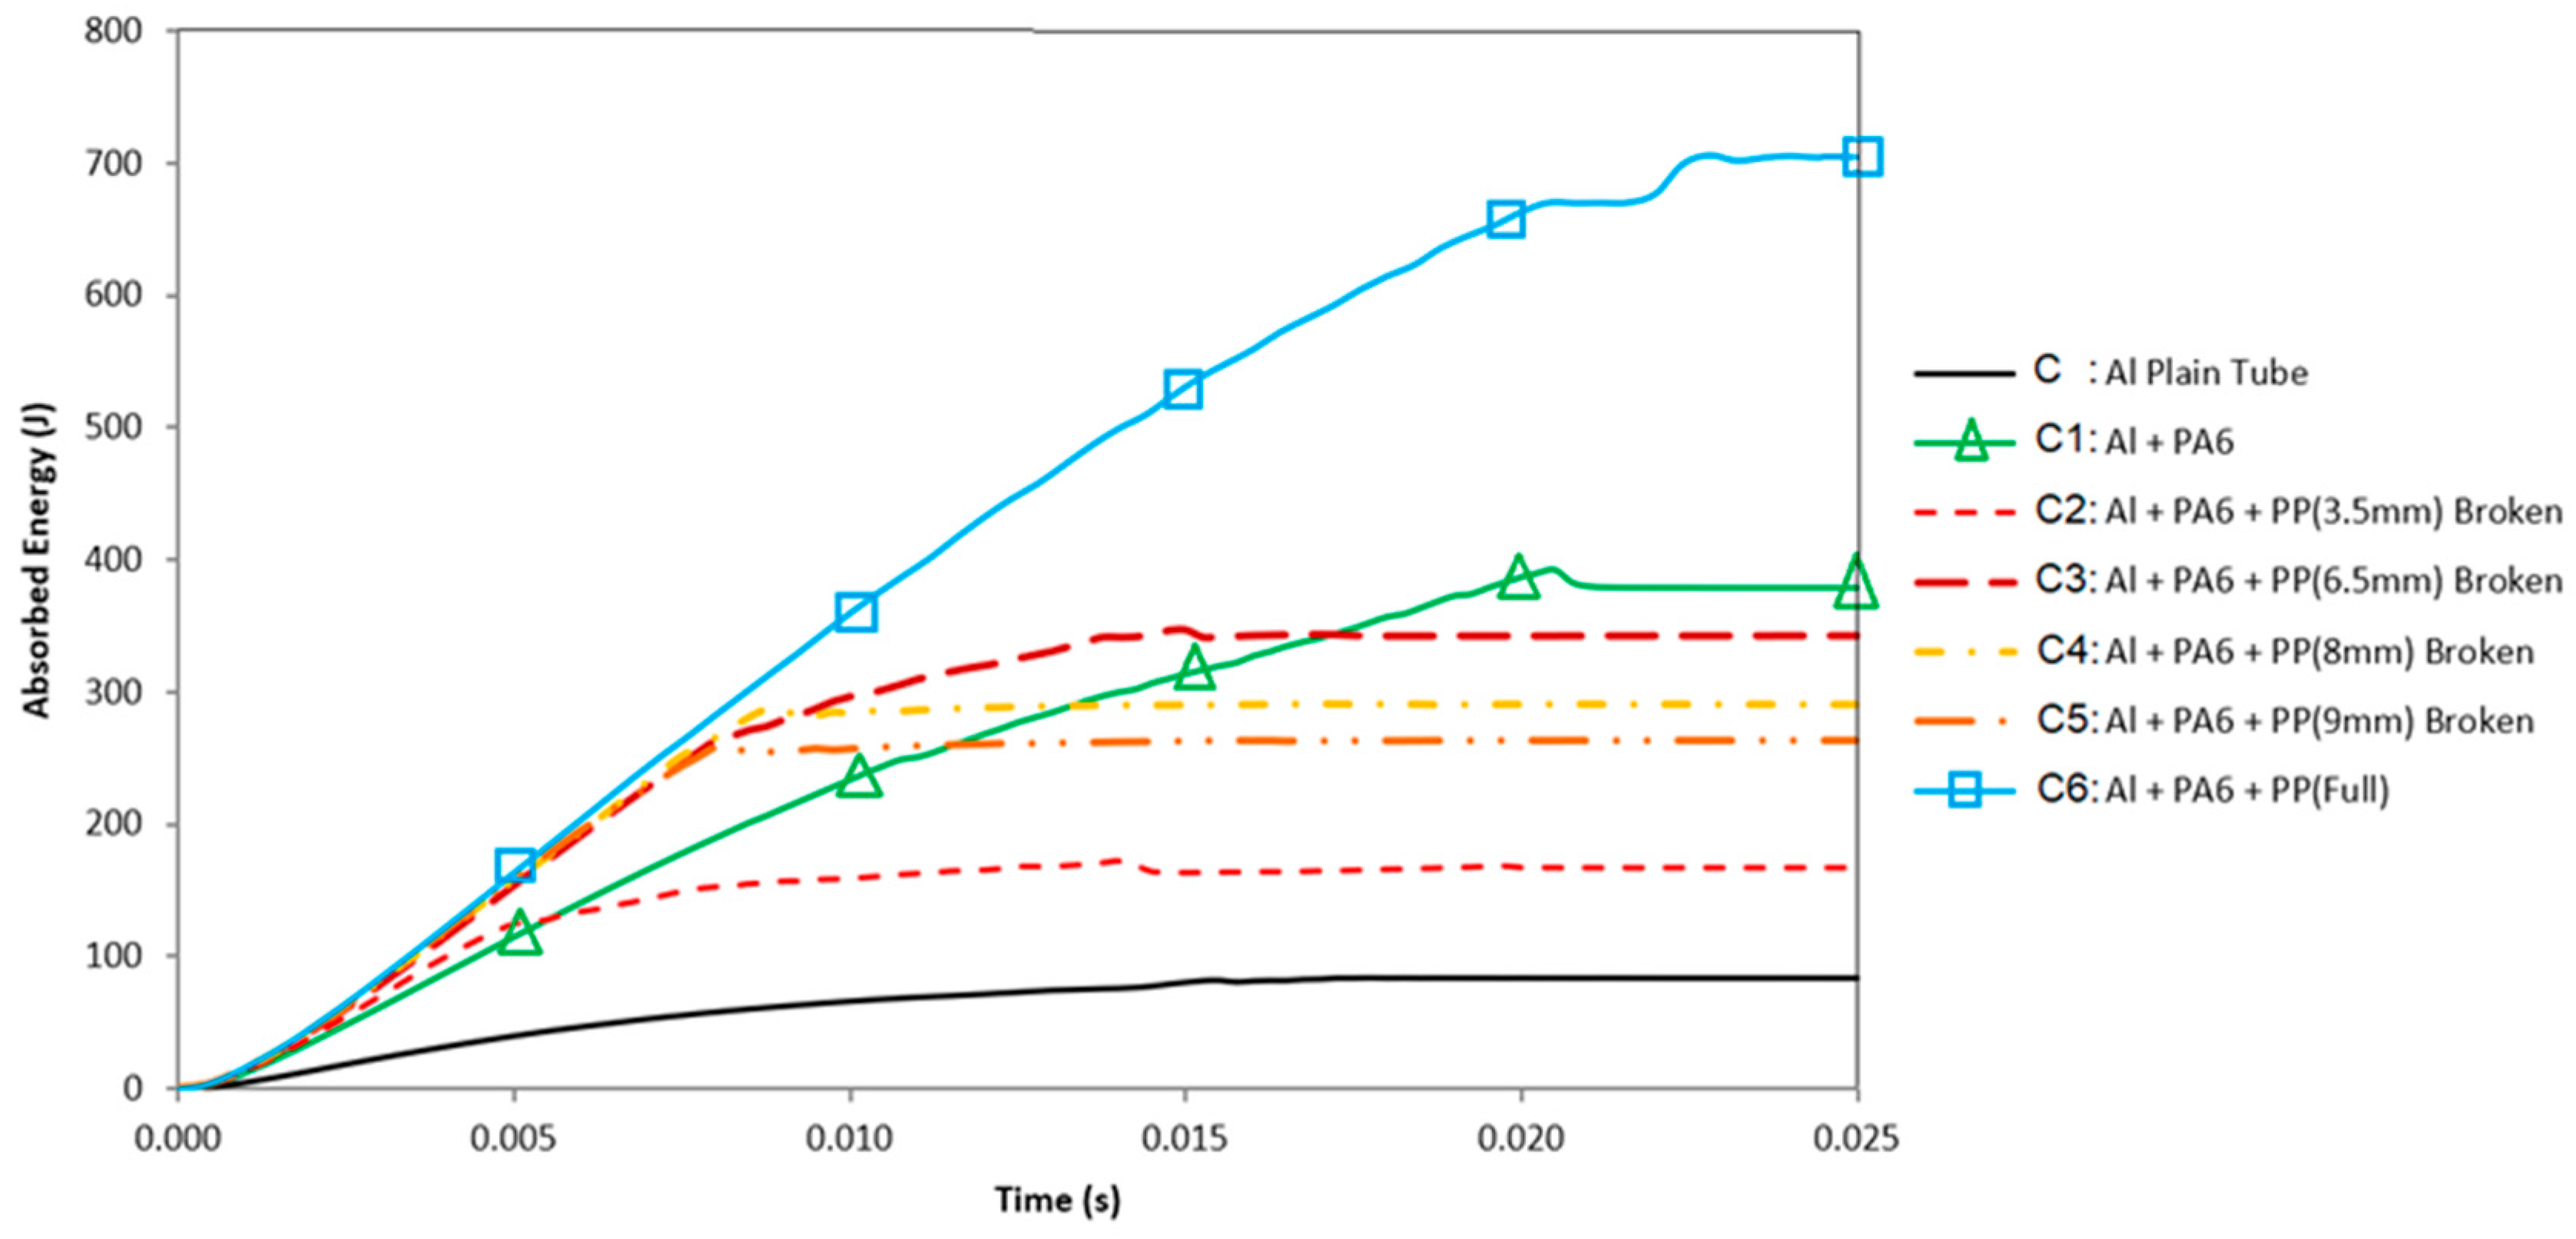
For effectiveness, we need to examine the bending impact-absorbing behavior in the study, from a hollow Al tube (specimen C) to a fully polymer-reinforced composite tube (specimen C6). The details of the bending impact energy-absorbing distribution for all specimens during explicit FE simulations, as explained so far, are shown in
Figure 14.
For the reinforced specimens (C1–C3), there are unavoidable sudden fluctuations in the curves of absorbed impact energy at some locations (
Figure 14). The oscillations arose from friction at the supports’ corners and the scraping effect of the contacting surfaces. These curve fluctuations increased with the addition of inner reinforcements due to the augmented reaction force. With the rise in the reaction forces, indentation occurs from the corners of the supports towards the tube’s surface. The indentation magnitude increased with the reinforcement effect, leading to fluctuations in the curve.
When the curve of specimen C1 in
Figure 14 is considered, there was a significant increment in the impact energy absorption, which was directly related to the existence of PA6. At 20.25 ms, the specimen entered the span (between the supports) at the cornered supports, and friction held the sample in place. When the tube passed between the corners, it relieved and evaded the scraping effect of the corners, resulting in a considerable zig-zag in the curves. Here, the absorbed energy level decreased slightly immediately. This energy level continued till the specimen exceeded the span. Because there is no failure for C1, after C6, C1 is the most convenient specimen to use.
For specimen C2, the application of a 3.5 mm thick PP reinforcement dramatically increased impact energy absorption compared to specimen C1 before 5 ms, where the crack initiation occurred in PA6 (
Figure 14). The specimen movement was more rapid, and the relief period arrived sooner. Thus, the starting point of the relief period was less than that of the previous model. When the relief period started, the absorbed energy level decreased. Unfortunately, after 5 ms, cracks formed and grew in all components of the specimen, eventually breaking it. A zig-zag form in the curve was also observed for this specimen.
The absorbed impact energy of specimen C3 increased initially because of the thick inner reinforcements. Until the total failure of the specimen, because the inner reinforcements’ top and bottom parts compressed and absorbed energy, which continued to rise. However, the amount of absorbed energy was greater than that for C2, as we expected. However, for C4 and C5, although we increased the thickness of PP to 8 mm and 9 mm, the energy absorption capacities were lower than those of C3 due to early-phase sudden cracks. When we checked the specimens C2, C3, C4, and C5, the cross-sectional moments of inertia were higher than those of C1, the unbroken and the only PA6-reinforced specimen. However, the increase in moments of inertia continued, and the bending radius grew as well due to the more resistant fillers. This formation caused early fractures in the specimens C4 and C5.
Considering the vertical diameter of the cross-section, it is deduced that deformation is limited in the critical region associated with the reinforcement effect of the polymeric materials. Hence, these reinforcement materials also restrict the formation of plastic hinges. Some studies emphasize that local deformation and hinge formation play significant roles in bending behavior [
8,
17,
18,
28]. Based on the knowledge we have gained so far, we conducted experiments on specimen C6 and validated the simulations against it, as we mentioned before. When we checked the simulations, the cross-sectional moment of inertia was just strong enough to prevent the composite tube from breaking. At the final stage, specimen C6 has a mean experimental bending impact energy absorption of 749.41 J, 8.8 times more than the hollow Al tube’s impact-absorbing energy, which was 85.18 J. In addition, from the simulation comparison, the specimen C6 is 8.43 times more than the specimen C. If we look back at
Table 3 and
Table 4, we can see the error % between the experiments and simulations. Overall, the convergence percentage is about 95%, which is absolutely remarkable for this type of failure-induced explicit FE simulations. In addition, the improvement in Specific Energy Absorption (SEA) is approximately 3 kJ.kg
−1, which is 2.4 times greater than the SEA of the hollow Al tube (1.245 kJ.kg
−1; see
Table 3).
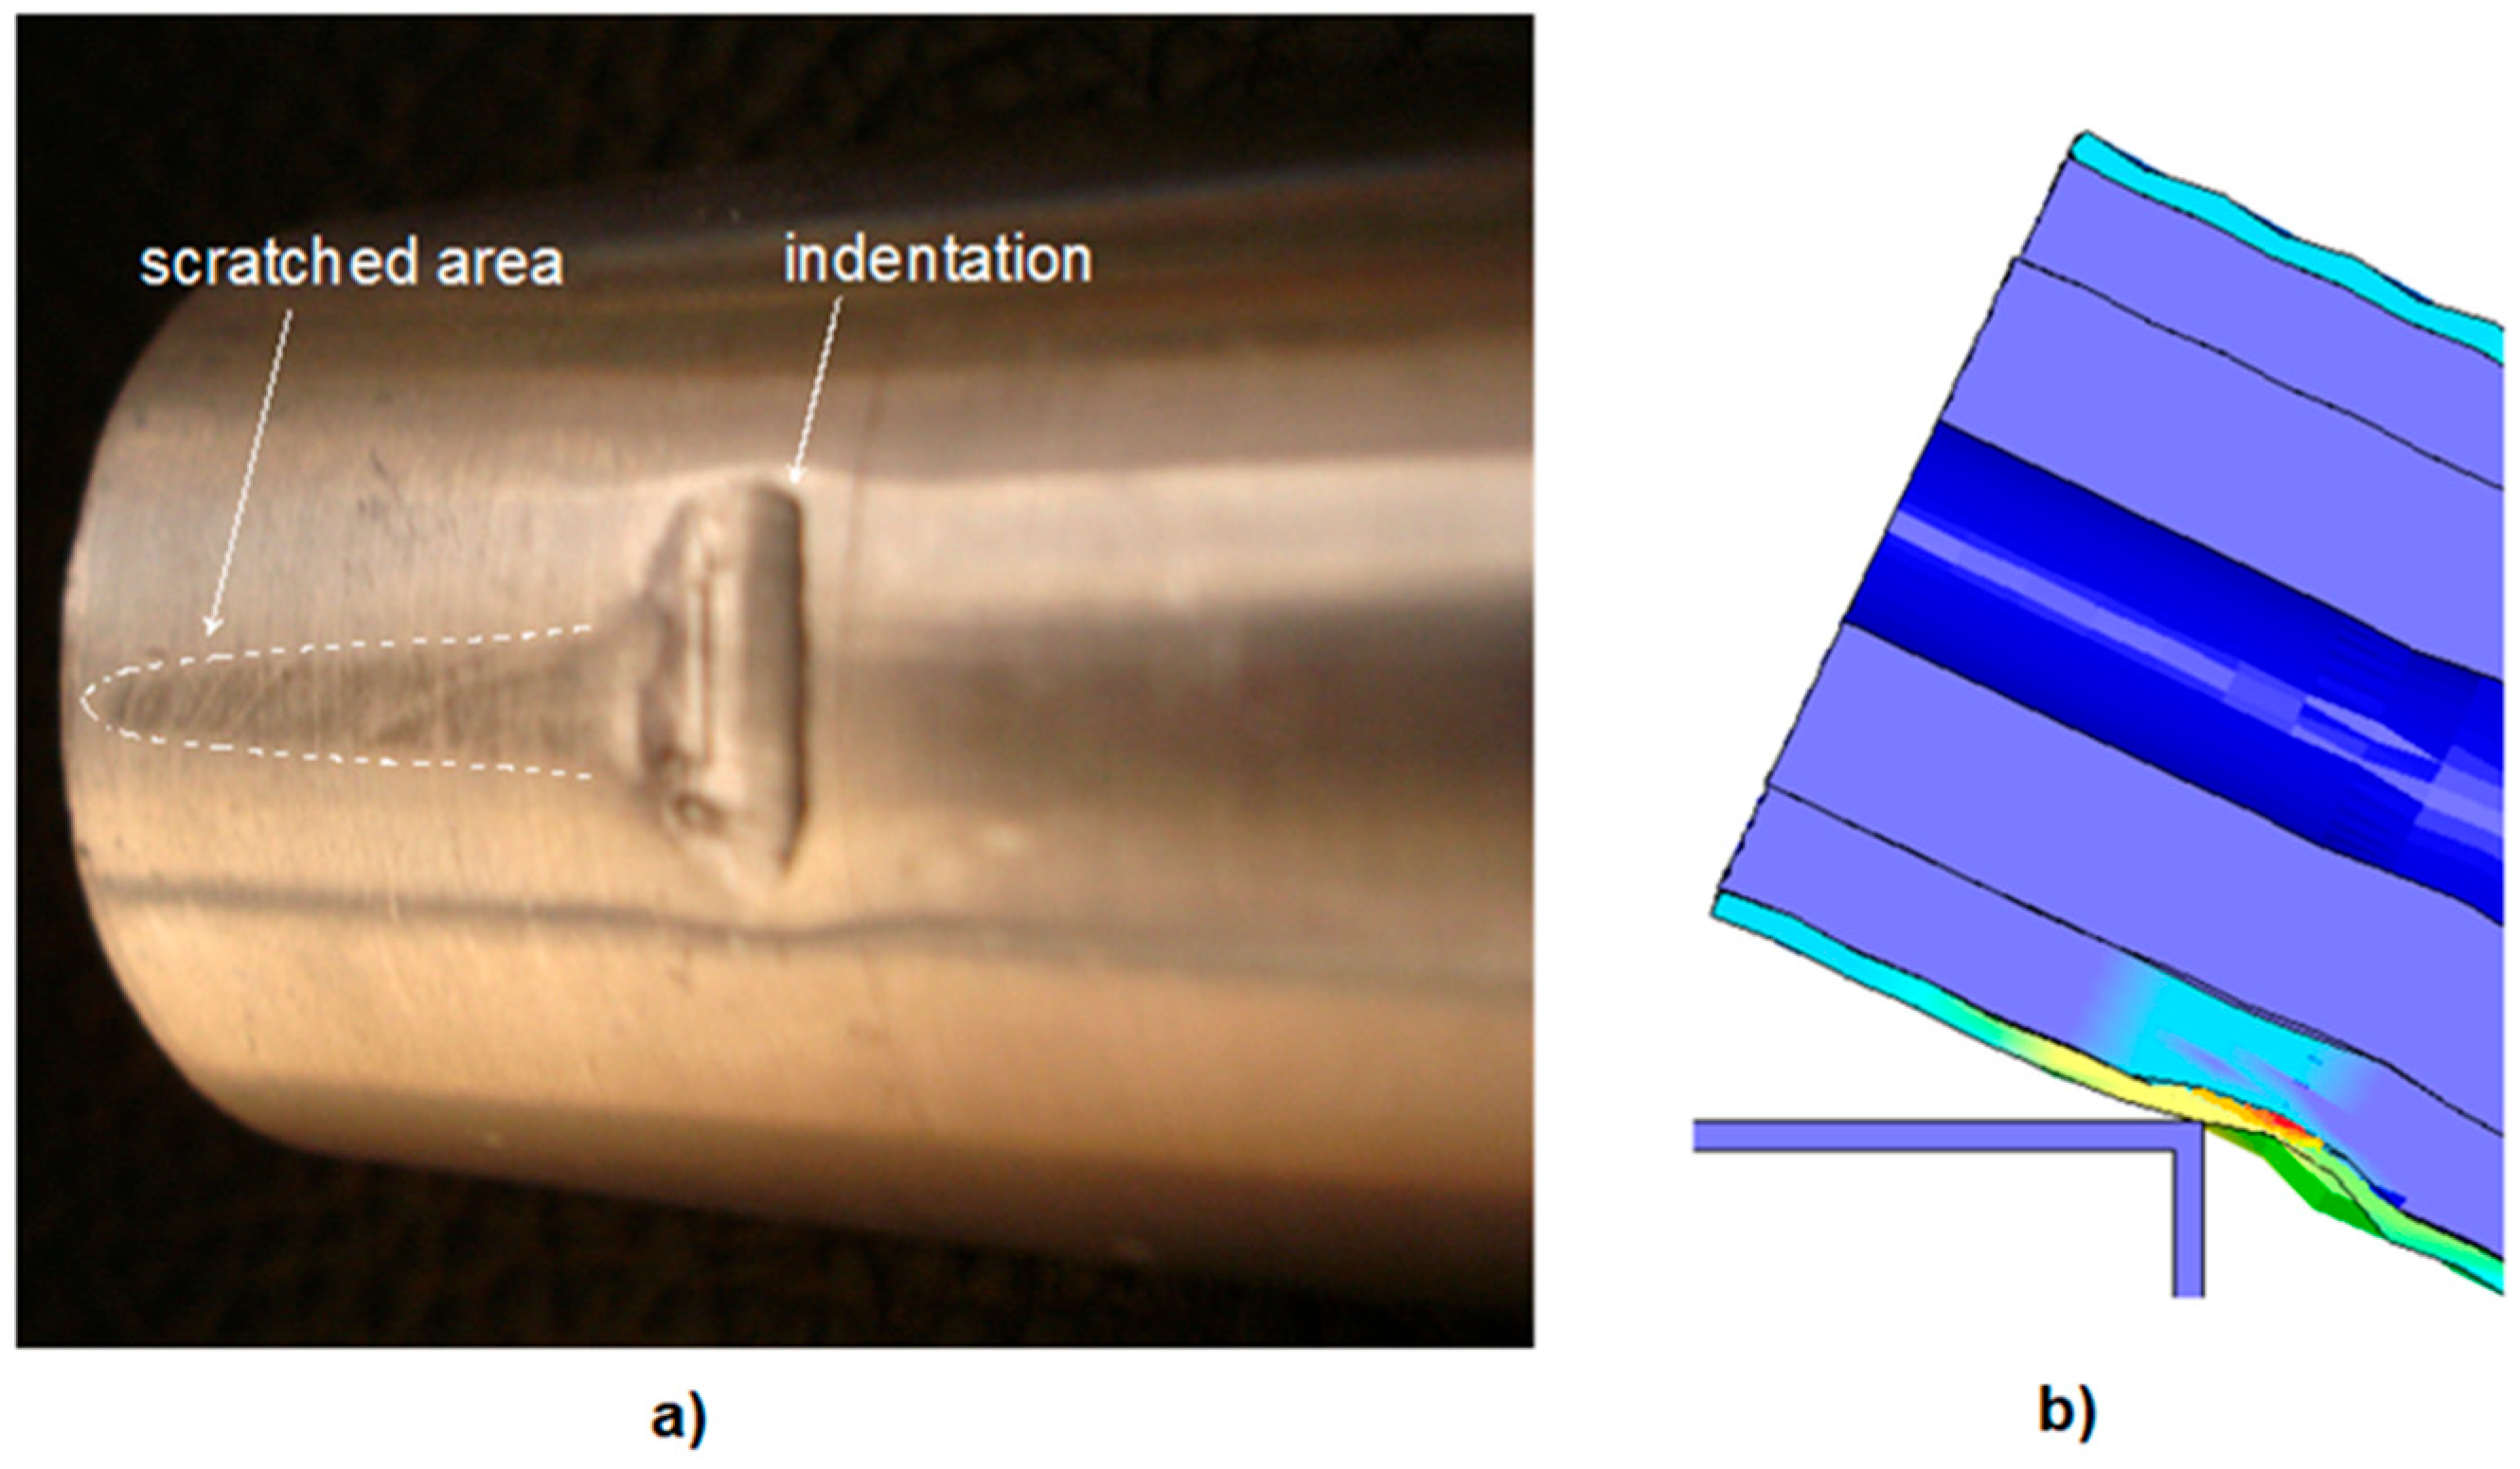
During the deformation phases of all the specimens, due to the sharp-edged supports, we also observed annular indentations that resulted in scrapes on the specimens, as shown in
Figure 15a,b. Focusing in detail on the contact region of the support’s edge and the specimen surface, the appearance of the specimen surface after the experiment shows a good agreement between the simulations and the test results.
Finally, the results of this study benefited from quasi-static deformation knowledge from earlier studies [
26,
30] and were used to validate experiments and simulations. Additionally, this research provides an opportunity to combine and enhance composite structural elements, which can be applied across various applications [
32,
33]. However, the enhanced polymer-reinforced tubular composite, C6, which we need for extreme bending impact loads, is made from the thinnest available materials on the market; accordingly, we are proposing this combination to the literature.