2.1. Geometry and Material Characterization
The specimens employed in this study were produced using low-force stereolithography (LFS), with a Raise3D DF2 resin 3D printer (Raise3D, Irvine, CA, USA) and Apricot V1 resin (Raise3D, Irvine, CA, USA). Apricot V1 is a methacrylate-based photopolymer of the durable class; it was selected because it reproduces the sub-millimetre strut geometry with high fidelity while offering greater toughness than standard rigid resins, and because its behaviour under the present low-force stereolithography process had been characterised in previous work [
3]. The printing parameters—such as layer thickness, fixed at 0.05 mm, build orientation, and support structures—were carefully selected to ensure dimensional accuracy and adequate mechanical performance. The specimens were sliced with ideaMaker v5.2.4.8581 (Raise3D, Irvine, CA, USA) using the manufacturer’s qualified high-detail template for the Apricot V1 resin, which is optimised for fine-feature fidelity; the 0.05 mm layer thickness balances resolution and build time. The complete set of printing and post-processing parameters is reported in
Table 1, and the general characterisation framework for stereolithography materials follows [
24]. All specimens were printed flat on the build platform, with the layer-deposition planes horizontal and coincident with the plane of the loaded faces, so that in both the compression and the three-point bending tests the load was applied perpendicular to the printing layers; this orientation was kept identical for all specimens, so that any process-induced anisotropy affects every configuration consistently. Because the homogenized beam models adopted here assume an isotropic effective medium, any residual anisotropy is one of the idealisations underlying the analytical predictions. After fabrication, all specimens were washed for 10 min and post-cured using a DF-Cure system, with each side exposed for 15 min and a heat-cure temperature of 60 °C under ambient conditions.
Dimensional accuracy was controlled during slicing through a calibrated in-plane scale compensation of 100.69% (in X and Y) and a contour offset of mm for the Apricot V1 resin, which compensate for cure-induced shrinkage and edge light-bleed. The outer dimensions and the strut diameter of the as-fabricated specimens were verified after post-curing and agreed with the nominal values within the resolution of the measuring instrument, with no appreciable systematic deviation; the nominal strut-to-cell ratio is therefore representative of the fabricated specimens.
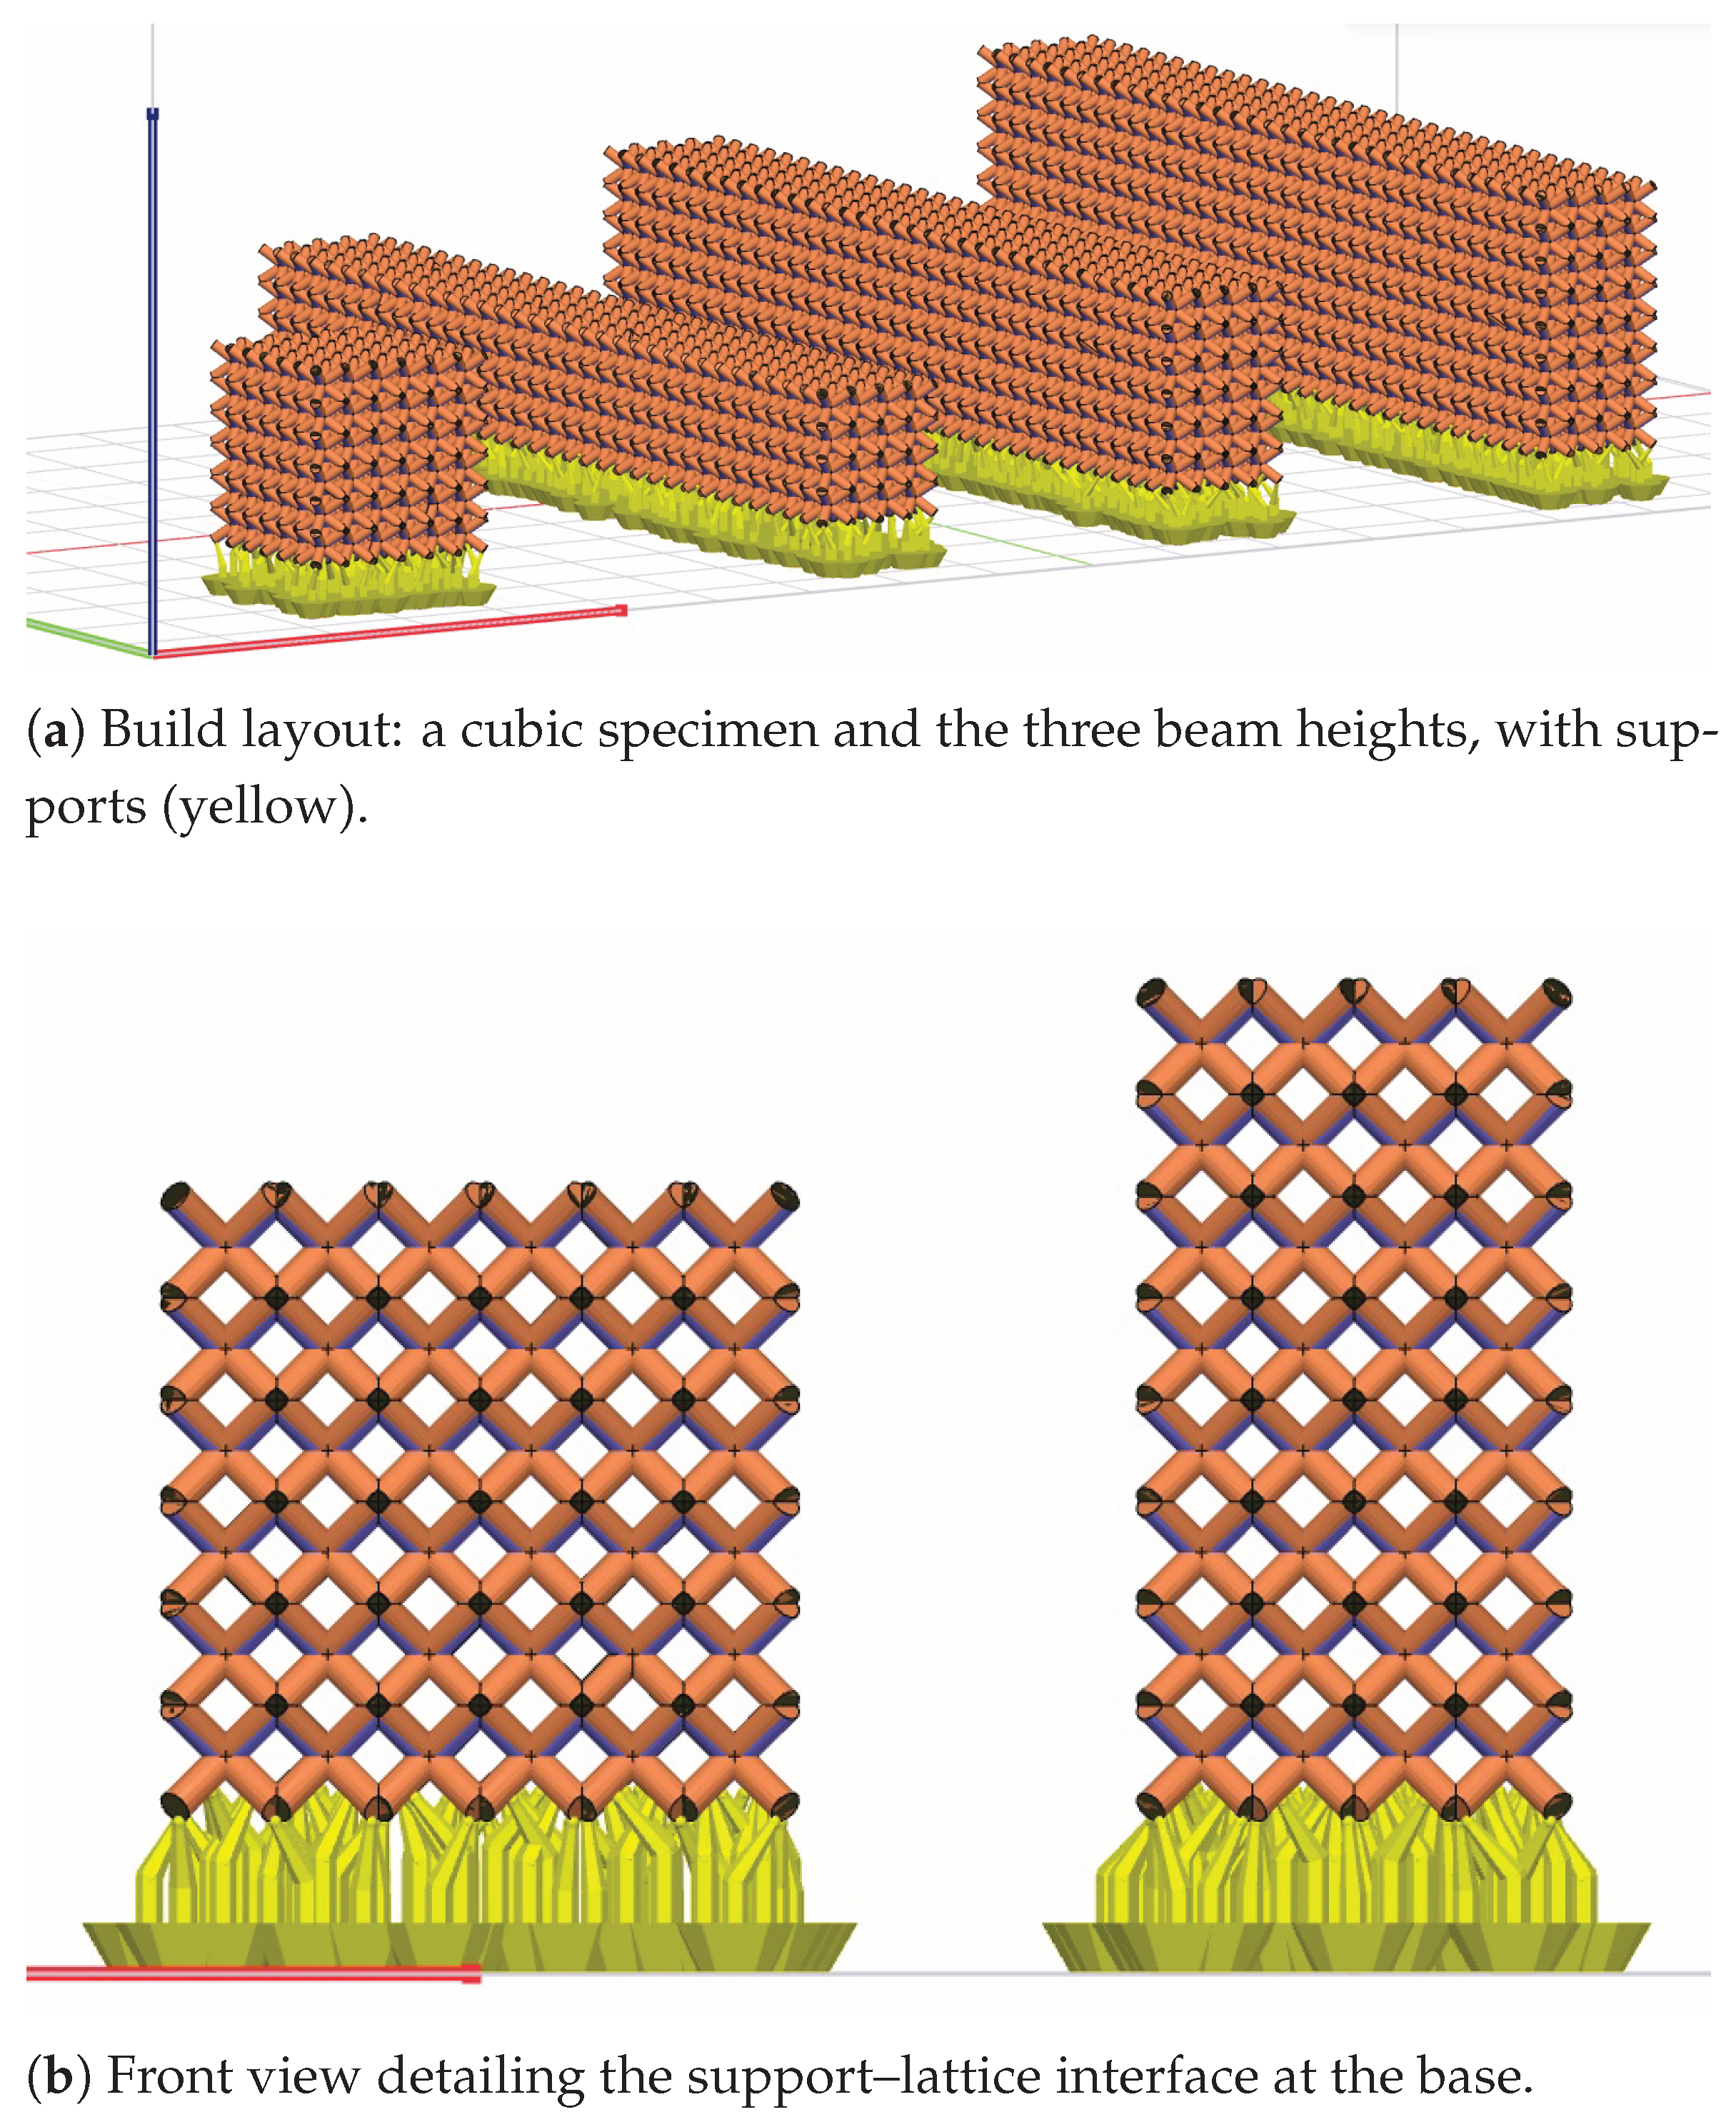
Support structures were generated automatically in the touch-platform-only mode, so that supports were created only on the down-facing side of the specimens during printing, with a
overhang threshold, a support-point spacing of 2.5 mm (1.5 mm at edges) and a support-point contact offset of 0.35 mm. The supports were removed manually before post-curing. In the mechanical tests, the support-contact face was placed as the upper (compression) face of the beam, so that the lower tensile face—where three-point bending fracture was consistently observed to initiate at mid-span—remained free of support marks. The build layout and support strategy are shown in
Figure 1.
In order to characterize the mechanical properties of the base material, uniaxial compression tests were performed on solid cylindrical specimens with a height of 30 mm and a diameter of 10 mm. The tests were conducted using a servo-hydraulic universal testing machine (Instron 8801, Instron, Norwood, MA, USA) with a 150 kN frame, at a constant displacement rate of 1 mm/min, controlled with Bluehill Universal v4.55 (Instron, Norwood, MA, USA). The load was applied to the specimens via 150 kN rated compression plates, thus minimizing the effect of machine compliance on the results. Load and displacement data were extracted from the 100 kN load cell and the LVDT equipped with the machine (Instron, Norwood, MA, USA). Both the specimen geometry and testing conditions were defined in accordance with ASTM D695.
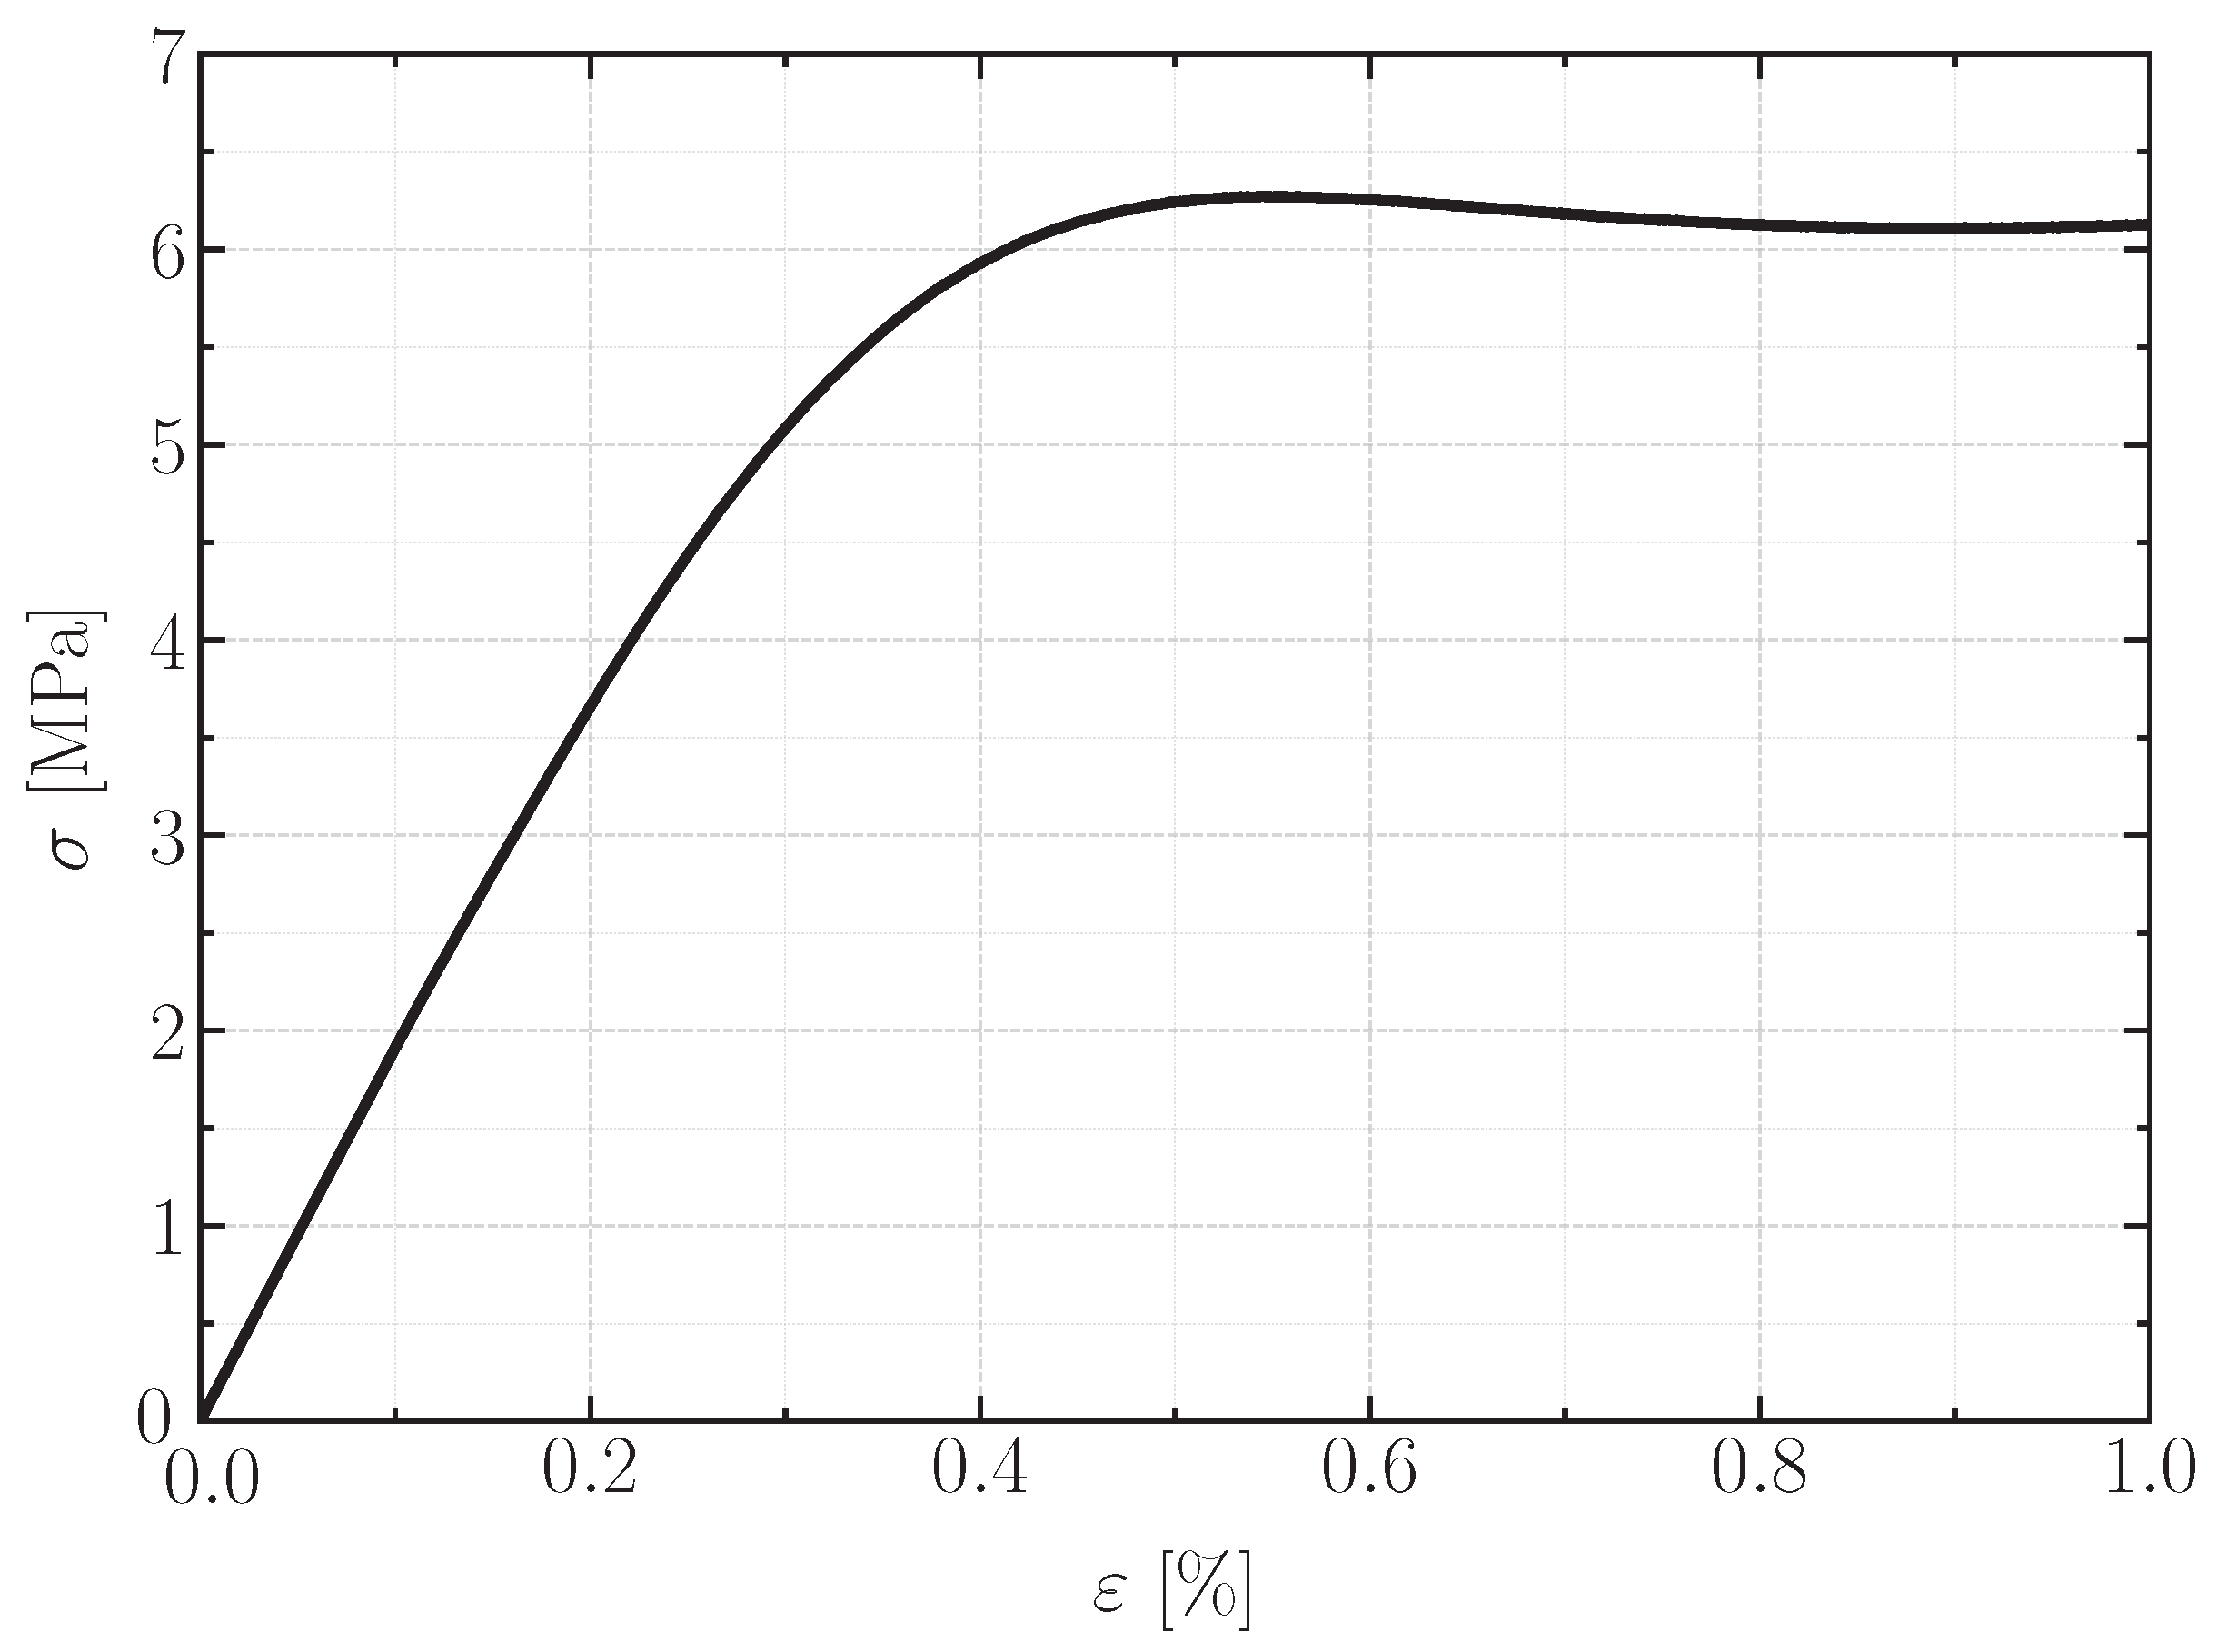
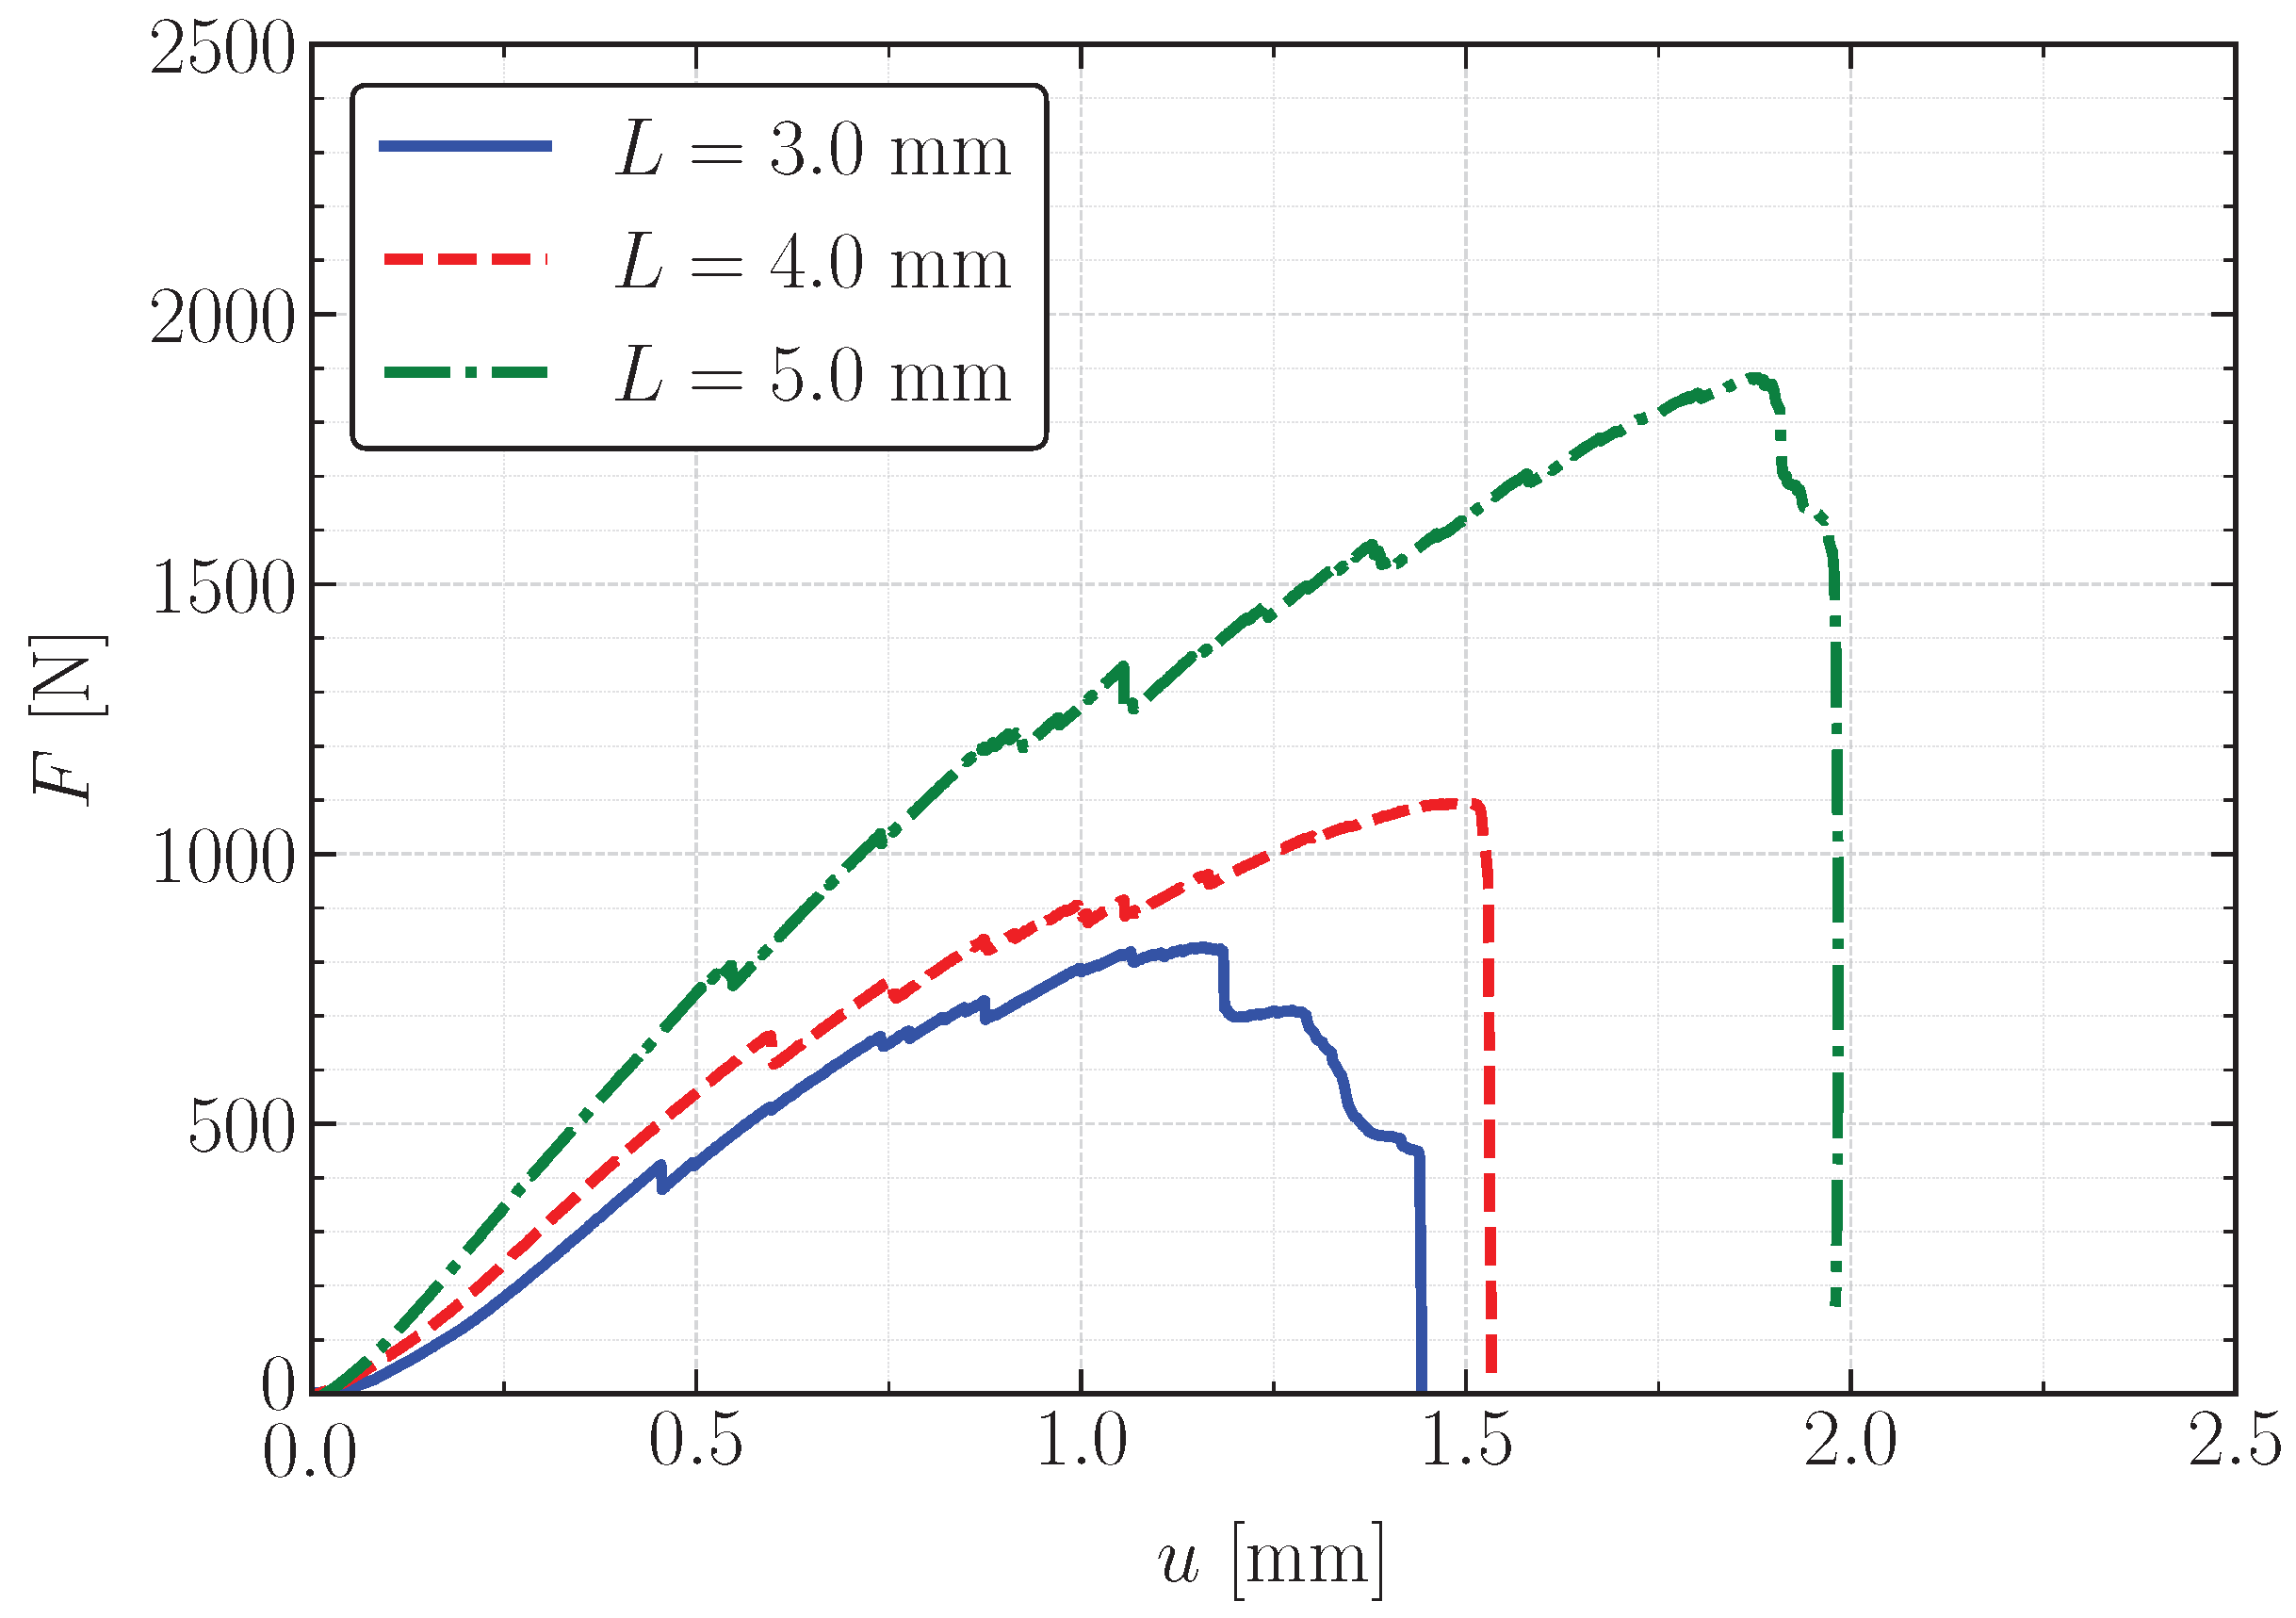
A total of three tests were carried out for the characterization of the resin’s elastic properties, and a representative stress–strain curve is presented in
Figure 2. Based on these experiments, the Young’s modulus
of the material was determined as
(mean ± standard deviation;
MPa at 95% confidence, Student’s
t,
). The measured density of the resin was
, in agreement with the manufacturer’s specifications. A Poisson’s ratio
, representative of methacrylate-based photopolymers, was adopted where required.
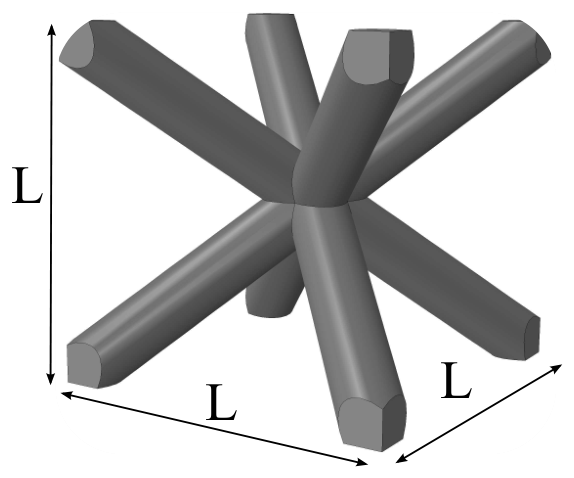
The geometry and notation of the BCC unit cell are shown in
Figure 3.
For specimens made of a single material with uniform circular struts of radius
R, it is necessary to distinguish between the cubic unit-cell edge length, denoted here as
L, and the center-to-vertex strut length, denoted as
ℓ. For a BCC unit cell,
Following the geometrical convention used by Tancogne-Dejean and Mohr [
25], the relative density of a BCC lattice made of uniform circular struts is expressed in terms of
as
This expression accounts for the volume of the struts and the nodal intersections. The beam intersections are referred to as nodes, whose volume fraction becomes increasingly important as the relative density increases. For example, Tancogne-Dejean and Mohr report that approximately 5% of the solid phase is contained in the nodes at , whereas the nodal contribution increases to approximately 40% at . Therefore, the present relative density, , places the specimens in a regime where the nodal regions and the non-slender character of the struts cannot be regarded as small perturbations. This point is retained throughout the discussion: the analytical strut-based expressions are used as compact homogenized estimates, but the observed bending response may also be affected by nodal morphology, finite-cell cross-sections, and boundary-cell effects.
Three cubic unit-cell edge lengths were considered,
, 4, and 5 mm. Rather than fixing the strut radius, the ratio between the strut radius and the unit-cell edge length was kept constant at
This resulted in nominal strut radii of
, 0.667, and 0.833 mm for
, 4, and 5 mm, respectively. Using Equation (
1), these values correspond to
Substituting into Equation (
2) gives an approximately constant relative density of
for all configurations.
2.3. Bending Tests
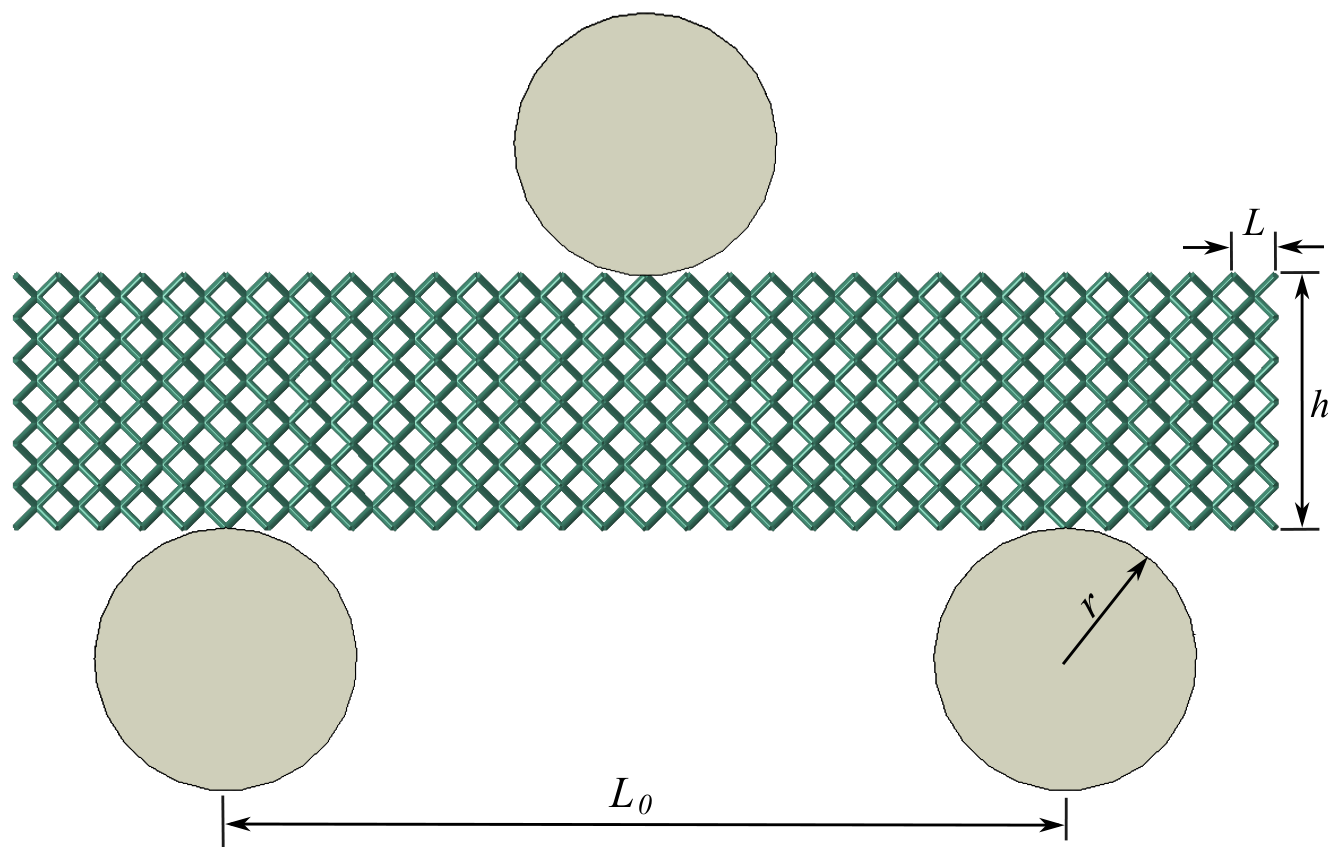
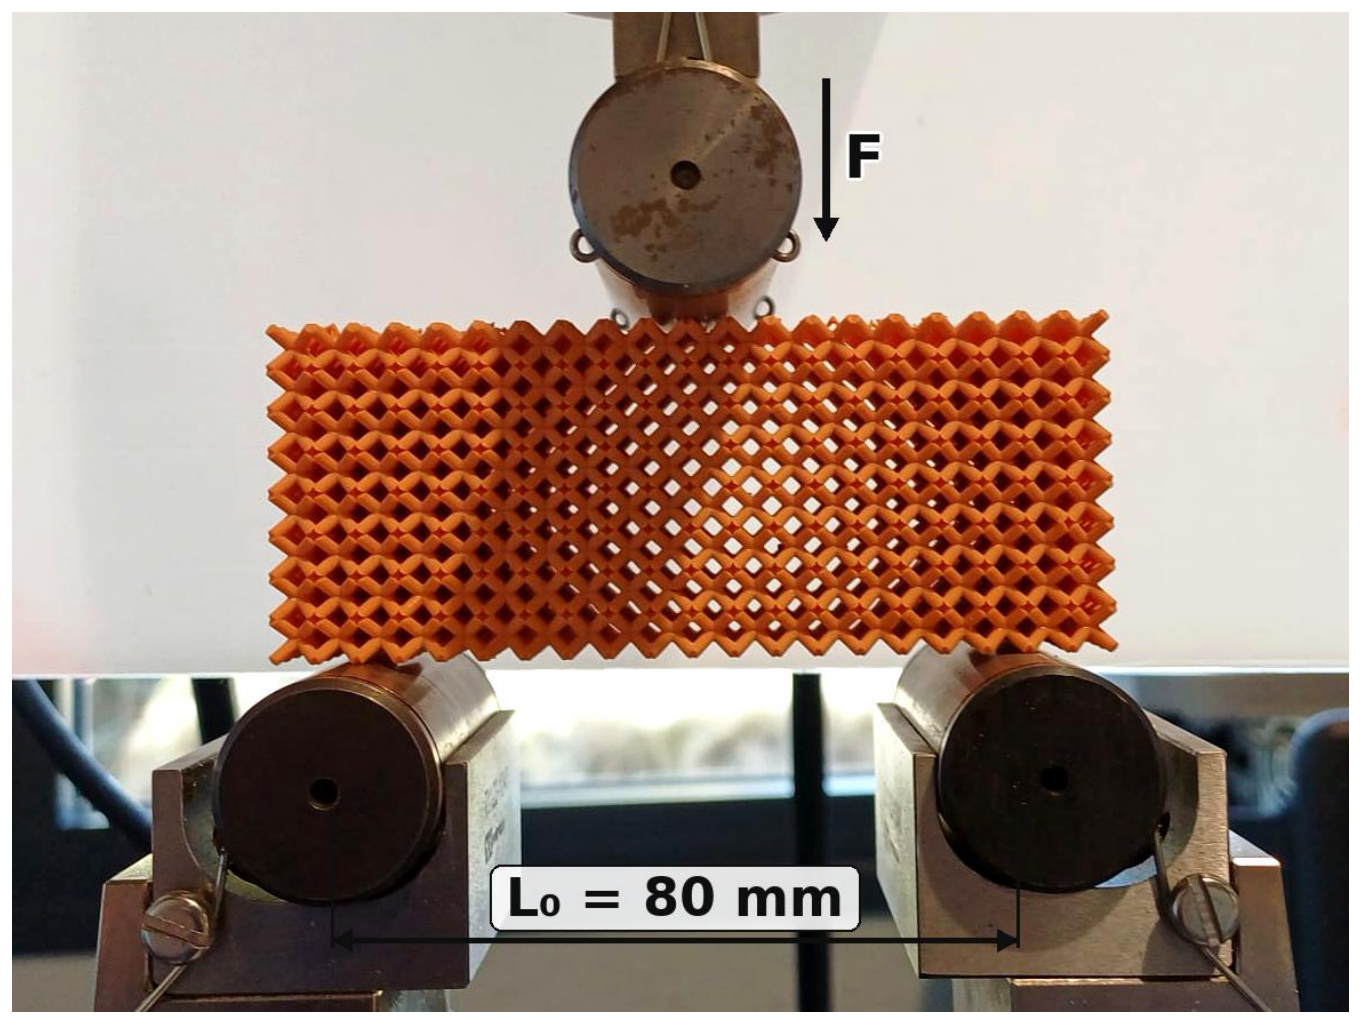
The beams were subjected to three-point bending tests with a support span of
mm throughout the experiments, as shown in
Figure 6 and
Figure 7. The overall beam length was kept constant at 100 mm in all cases. The radius of the loading and support rollers was
mm.
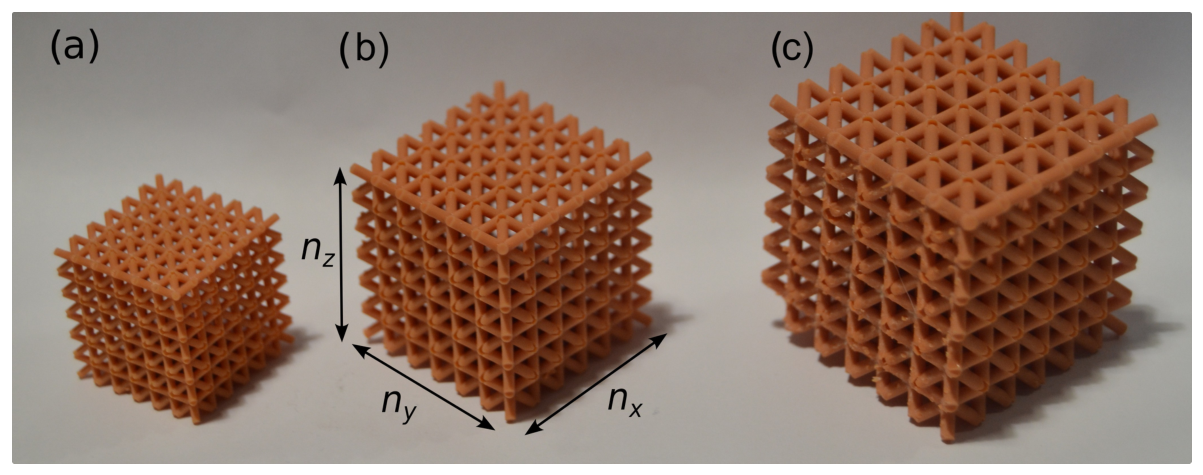
The lattice architecture was defined by limiting the number of unit cells across the beam width to four unit cells. The beam height was varied considering 4, 6, and 8 unit cells in the vertical direction, allowing the influence of the structural height h to be investigated while maintaining a constant beam length. The experiments were carried out with the same test machine previously described, although the load cell was swapped by a 5 kN cell to increase the precision of the results. Each specimen was tested a minimum of three times at a speed of 1 mm/min under ambient laboratory conditions of 20–25 °C.
The vertical displacement u at the loading point was recorded directly from the crosshead of the testing machine. Two factors support the use of this measurement as an estimate of the mid-span deflection of the specimens. First, the bending loads involved were modest (of the order of tens to a few hundred newtons) and were applied through a stiff servo-hydraulic frame equipped with a 5 kN load cell, so that the elastic compliance of the machine is expected to be small compared with the deflection of the beams. Second, despite their cellular nature, the specimens are comparatively stiff owing to their high relative density (), and the loading and support rollers, of radius mm, distribute the contact force over several surface struts. Nevertheless, local contact compliance at the roller–lattice interface cannot be ruled out from the present measurements and is therefore considered as one of the possible contributors to the apparent additional compliance discussed below.
To quantify these systematic contributions, a Hertzian line-contact estimate was made for the steel roller (
mm,
GPa,
) in contact with a solid-resin half-space (
MPa,
), giving a plane-strain effective modulus
MPa. For the present load range this yields a sub-millimetre contact width (
–
mm), peak pressures of 16–26 MPa and a local indentation of only a few micrometres, i.e., two to three orders of magnitude below the measured deflections. Similarly, accounting for the additional compliance of the deepest beams (at most ≈
mm/N, see
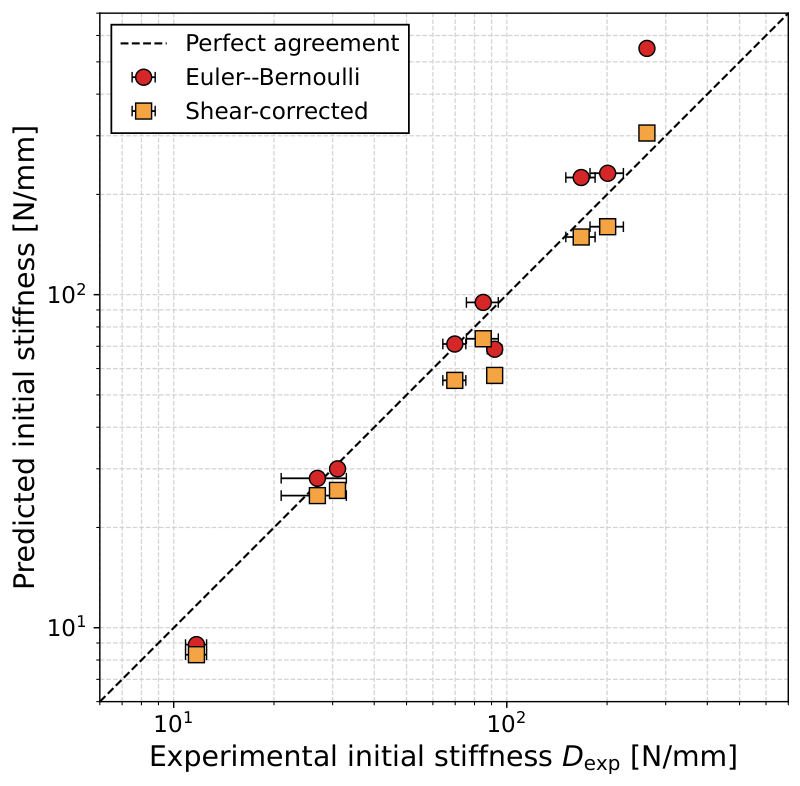
Section 4.2.1) by machine compliance alone would require a load-train stiffness of only ∼500 N/mm, far below that of the servo-hydraulic frame used here. Machine and solid-material contact compliance are therefore small contributors; because they were not measured independently, however, local roller–lattice compliance is retained as one of the possible mechanisms contributing to the apparent additional compliance discussed below, rather than being ruled out entirely.
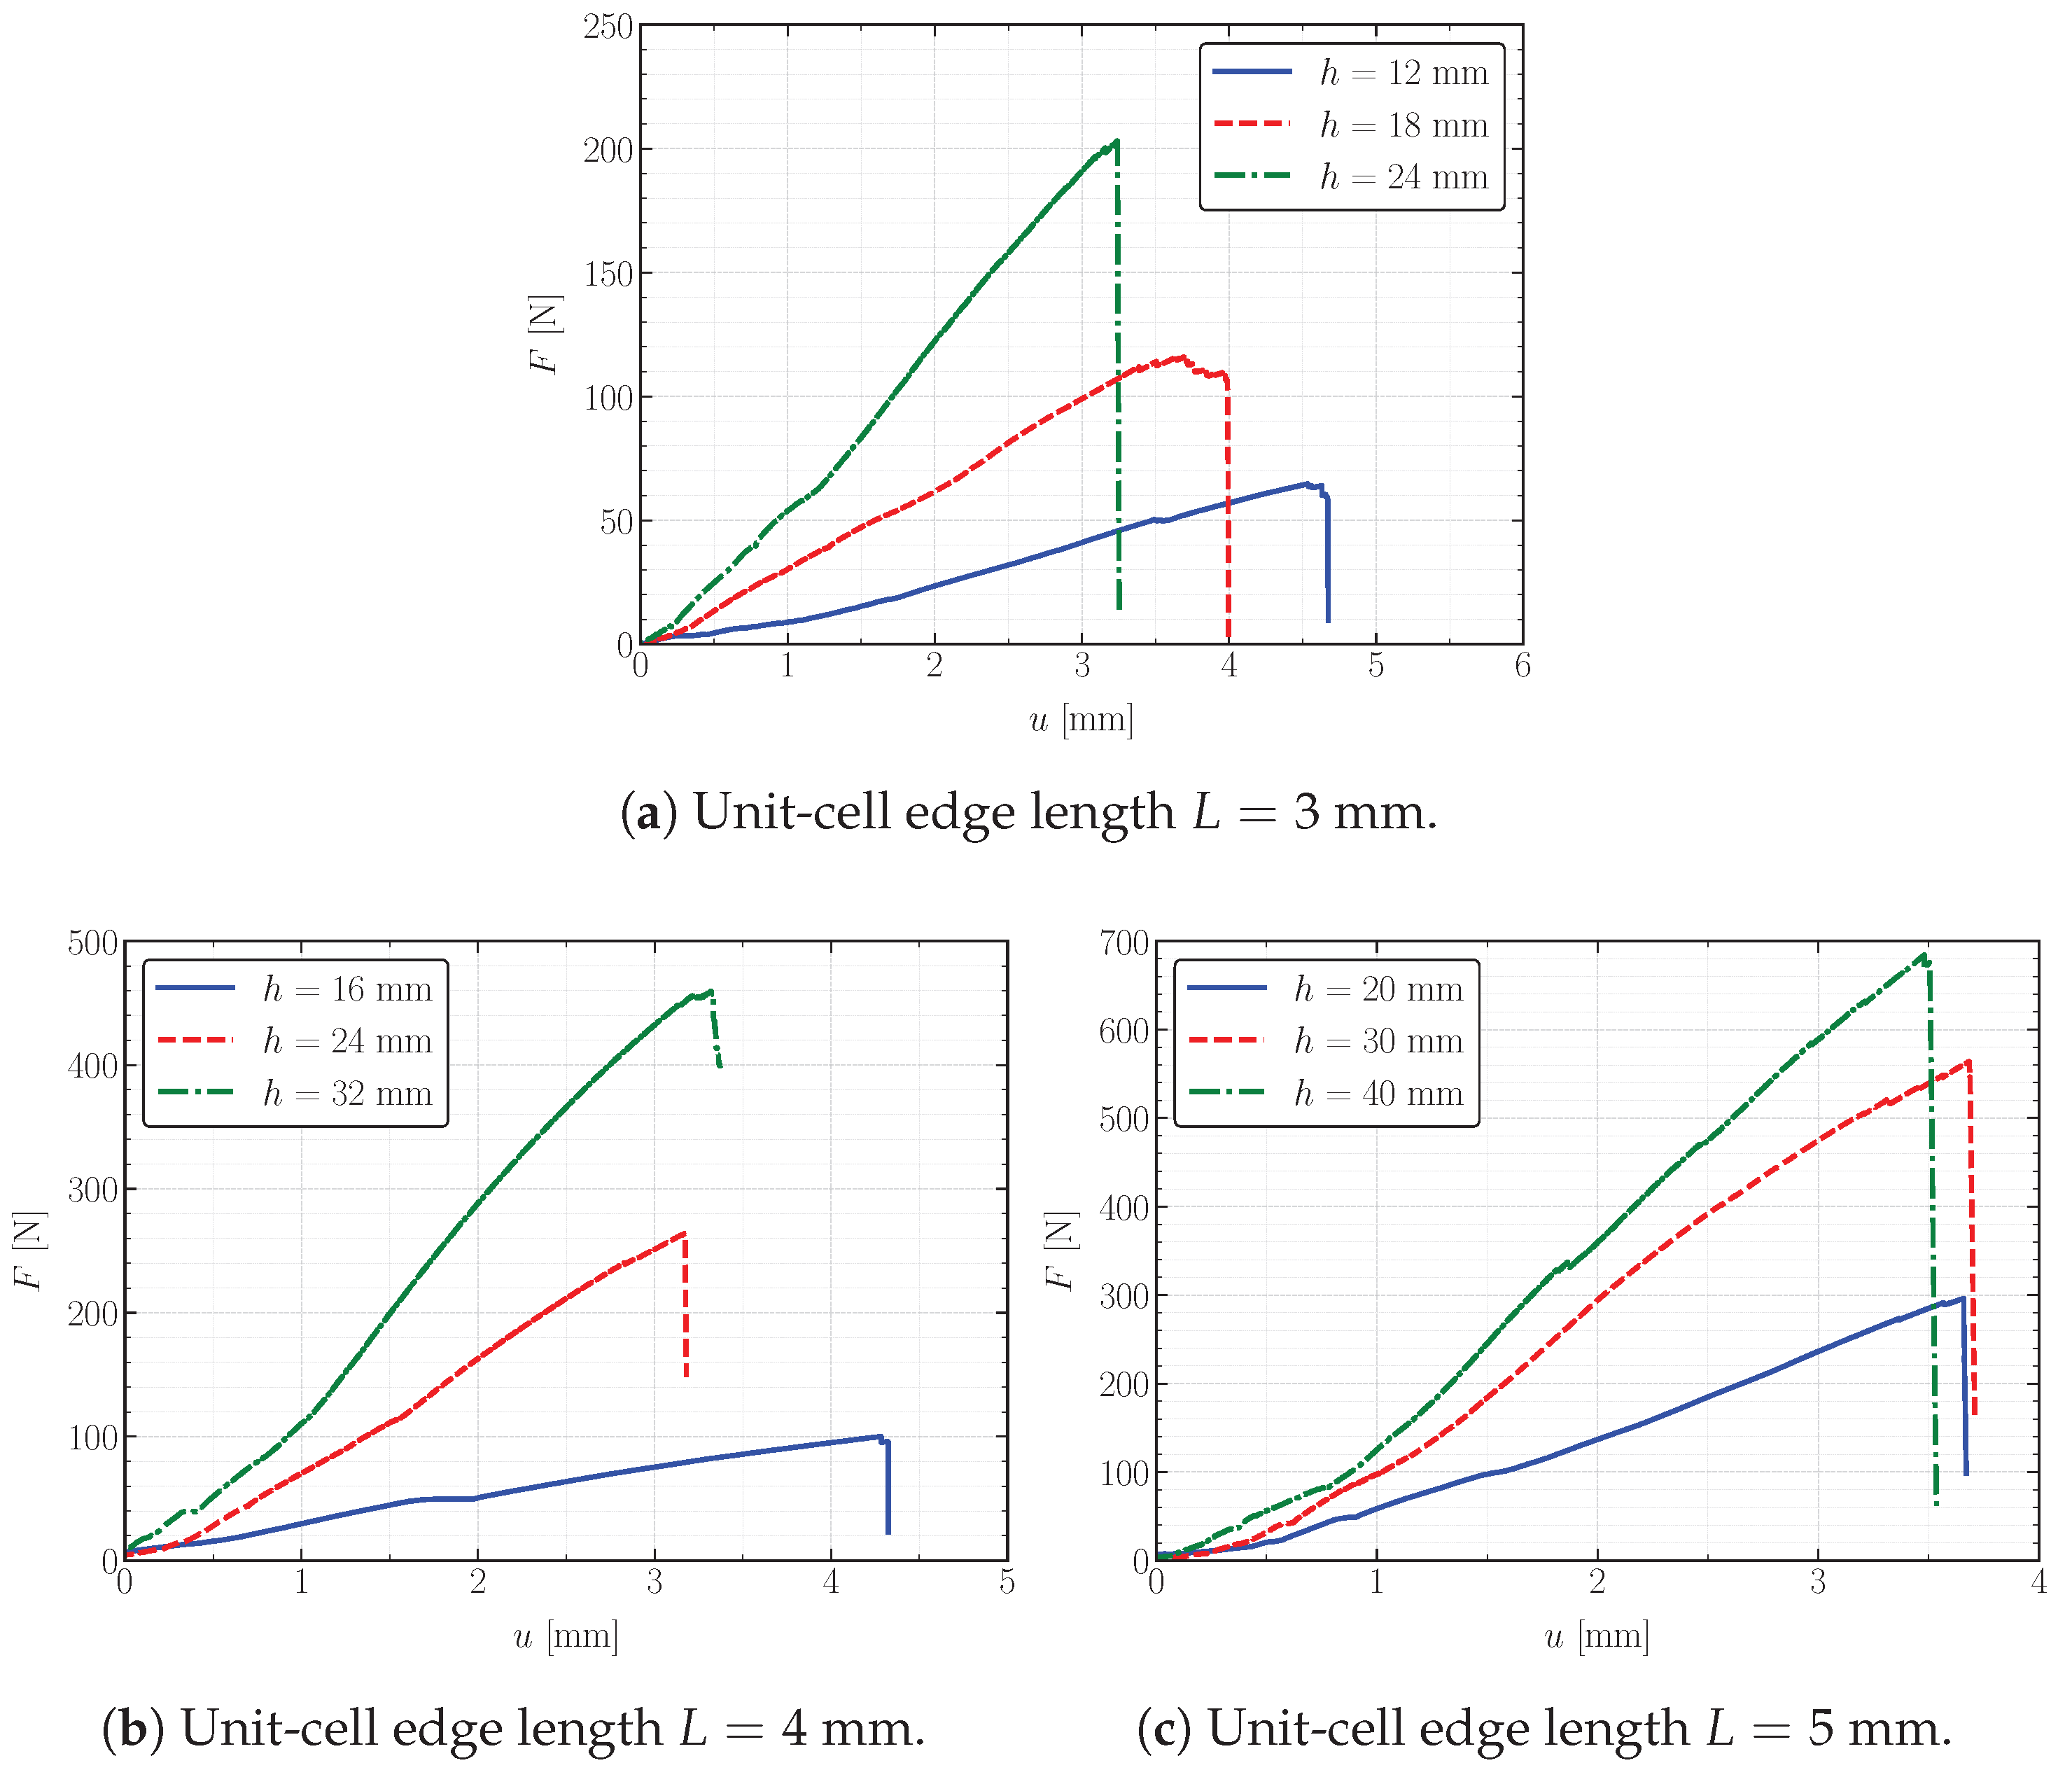
Representative force–displacement curves obtained from the three-point bending tests are presented in
Figure 8 for unit-cell edge lengths
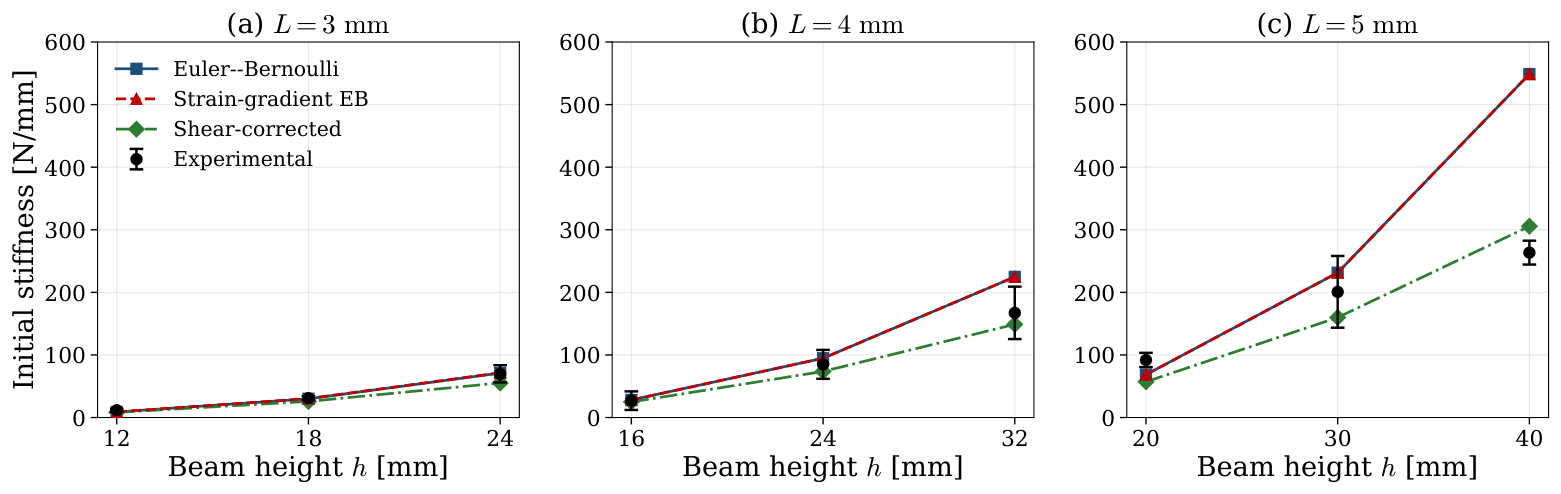
, 4, and 5 mm. In each case, results are shown for beam heights corresponding to 4, 6, and 8 unit cells in the vertical direction. As expected, an increase in beam height
h leads to a notable increase in both the initial stiffness and the failure load. Conversely, the displacement at failure decreases with increasing
h, which is consistent with the higher stress concentrations induced in stiffer configurations. Failure occurred in a brittle manner in all tested configurations: upon reaching the maximum load, a sudden and abrupt drop in the recorded force was observed, with no evidence of a progressive or ductile post-peak response. In every specimen, fracture initiated at mid-span on the lower (tensile) face of the beam and propagated upwards through the lattice. This consistent failure location indicates that tensile stresses on the bottom fibers govern the ultimate response, which is also in line with the brittle nature of the photopolymer resin and justifies the abrupt load drop observed across all unit-cell sizes and beam heights considered in this study. The initiation on the tension side, together with the single-event load drop and the absence of any progressive roll-off, is characteristic of tensile fracture of the outer struts and nodal junctions on the bottom fibre, rather than of elastic buckling of compressive struts, which would be expected to produce a more gradual post-peak response. This is consistent with the non-slender, node-dominated character of the present struts (
,
).