3.1. Effect of Functionalization on Interfacial Energy
To systematically investigate the influence of functional group types and concentrations on the interfacial shear properties between PI and CNTs, the interfacial strength of the CNT/PI system is first evaluated, as it fundamentally governs the interfacial shear behavior. As shown in
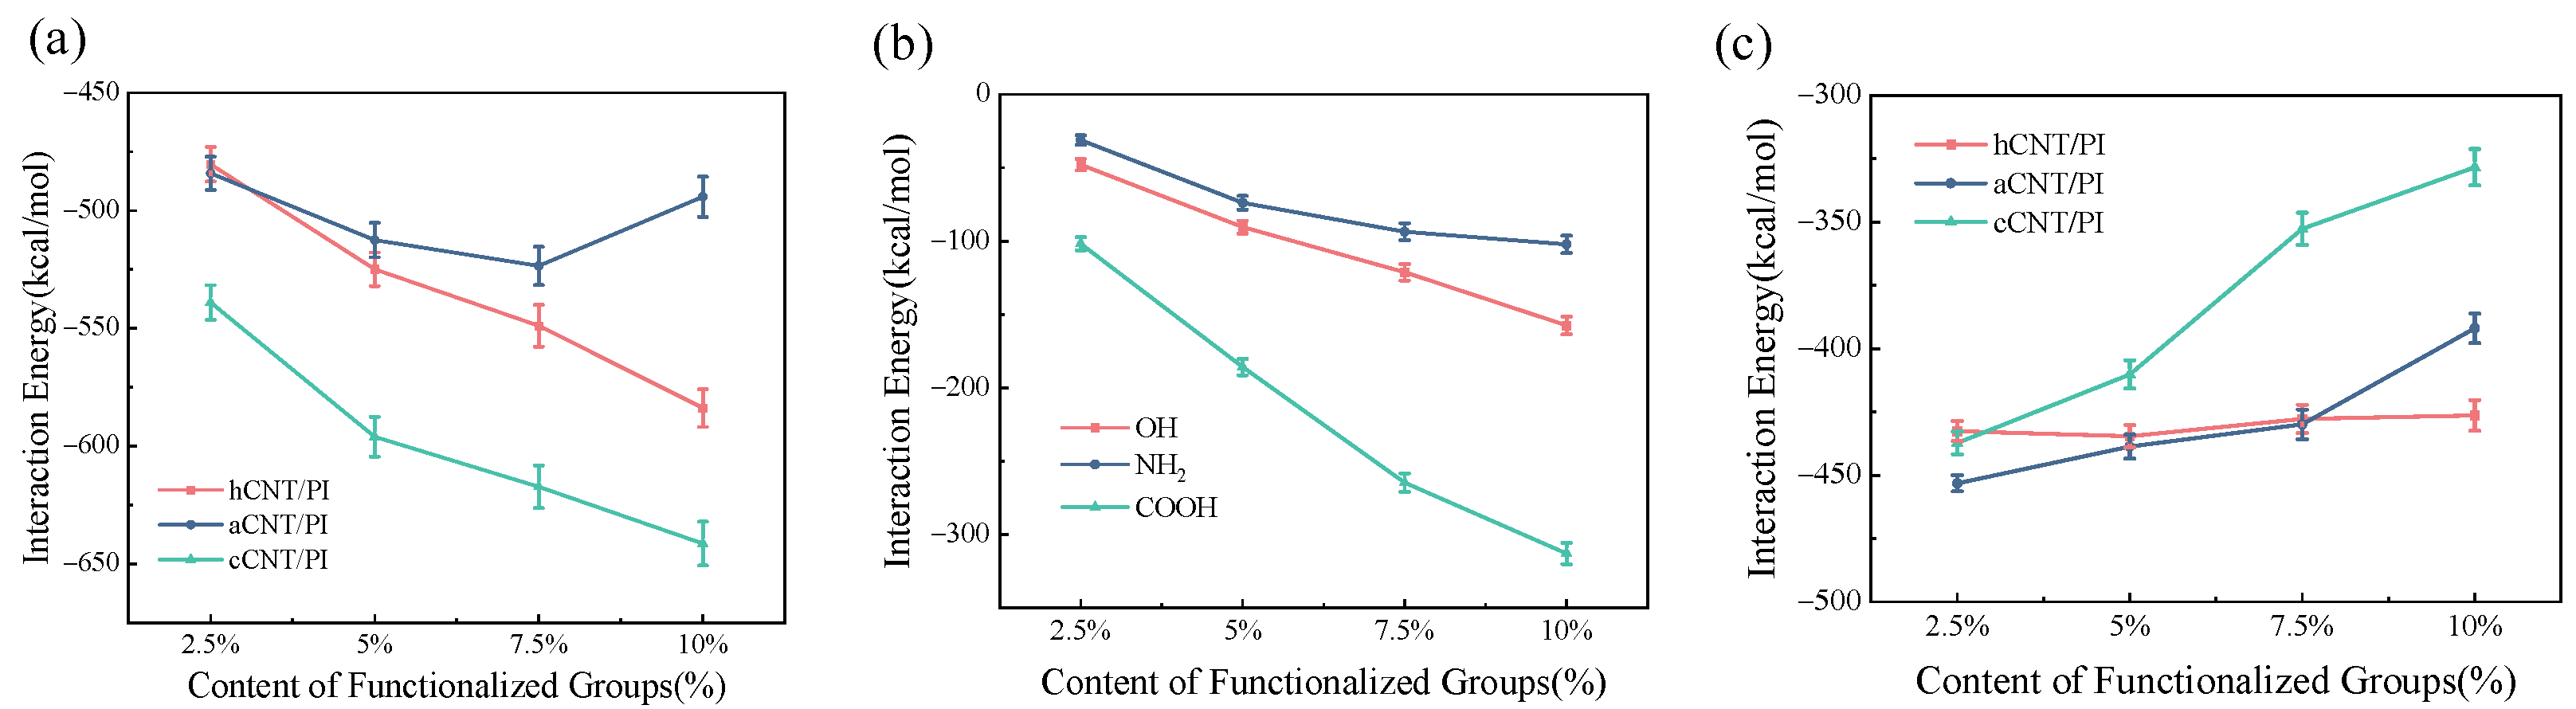
Figure 2a, we calculate the interaction energy of PI matrices modified with different functional groups (-OH, -
, and -COOH) at CNT surface modification densities ranging from 2.5% to 10%. The total interaction energy between Carbon nanotubes and the polyimide matrix is denoted as
.
represents the interaction energy between PI and the functional groups, while
signifies the interaction energy between PI and pristine CNTs. The relationship among these energies can be expressed by the following equation:
For clear identification of the samples, functionalized CNT are systematically labeled using a nomenclature system in which “nCNT” denotes a CNT modified with a specific functional group, where “n” represents the first letter of the group name. Specifically, hCNT, aCNT, and cCNT correspond to CNTs functionalized with -OH, -, and -COOH groups, respectively.
As shown in
Figure 2a, regardless of the functional group content, the ranking of the interfacial interaction energy among the three CNT/PI systems—cCNT/PI, hCNT/PI, and aCNT/PI—remained consistently
. The observed order of cohesive energy for the functional groups aligns with that reported by Trolier-McKinstry et al. [
34], exhibiting a decreasing trend as follows: -
> -
> -‘
’. These results indicate that CNTs functionalized with higher-polarity groups (such as -COOH or -OH) exhibit stronger interfacial binding energy compared to those functionalized with lower-polarity groups (such as -
).
Moreover, as the functional group content increased from 2.5% to 10.0%, the interaction energies became more negative, indicating stronger CNT–PI interactions; the magnitudes of the interaction energies increased by 19.0% for cCNT/PI and 21.5% for hCNT/PI (relative to the 2.5% case). Conversely, the change in the interfacial energy of the aCNT/PI system is negligible. Notably, during the calculation of the interaction energy between PI and the CNT functionalized with the -
group, the interfacial interaction energy does not show a positive correlation with the number of interfacial interacting atoms, failing to reflect the actual contribution of the functional group to the interfacial binding energy. Consequently, the interaction energies between PI and each functional group are calculated and compared, as illustrated in
Figure 2b. As anticipated, the magnitudes of the interaction energies between the PI matrix and the functional groups increase as the functional group content rose from 2.5% to 10%. Specifically, the increases are 229.3% for the PI-OH group model, 229.2% for the PI-
group model, and 207.5% for the PI-COOH group model. This outcome is attributed to the increased number of functional group atoms, which enhances the likelihood of interactions between the functional groups and the PI matrix. This preliminarily suggests that increasing the number of functional groups on the CNT surface can significantly boost the interaction energy of the CNT/PI system. Furthermore, given that the order of the interaction energies between the PI matrix and the functional groups are consistent with that between the PI matrix and the CNT at a given content, we further postulate that the interaction energy between the two components may be influenced by both the polarity and size of the functional groups.
However, it is observed that the slope of the curve representing the change in interaction energy decreases as the functional group content increases. For instance, in the case of the PI/-OH group system, as the content of -OH functional groups on the CNT increases from 2.5% to 10%, the slopes of the curve are 0.8898, 0.3405, and 0.2997, respectively. This suggests that the interfacial interaction between the -OH groups and the PI matrix approaches a saturation state with increasing functional group content. A similar conclusion can be drawn by comparing the other two functional groups. Additionally, when comparing the interaction energies
between PI and the CNT surface (excluding the functional groups), the interaction energies of the three functionalized samples gradually decreased with the increase in the number of functional groups, as shown in
Figure 2c. Among these, the sample with -COOH exhibited the largest decrease. This phenomenon can be attributed to the inhibition of PI matrix adsorption on the CNT surface, resulting from the excluded-volume effect. This effect arises from non-bonded interactions between the functional groups on the CNT surface and the PI matrix, which are influenced by the content and size of the functional groups. This indicates that over-functionalization introduces a competing negative effect: while the covalently attached functional groups enhance hydrogen bonding with the PI matrix, the steric exclusion effect simultaneously reduces the van der Waals interaction between the PI chains and the CNT carbon backbone, partially offsetting the gains in interfacial strength.
Through statistical analysis of the interfacial interaction energies in CNT/PI nanocomposite systems as a function of functionalization type and content, the results show that the interfacial bonding between PI and CNTs is primarily governed by the polarity of the functional groups. However, the interfacial interaction energies consist of the sum of vdw interactions and Coulomb interactions, which also include the vdw potential energy between PI and CNT. The influence of the polarity of functional groups on the interfacial bonding properties cannot be evaluated solely through interfacial interaction energy. Therefore, in this study, the interaction energy is numerically calculated by combining the vdw energy and electrostatic energy between the CNT and the PI matrix.
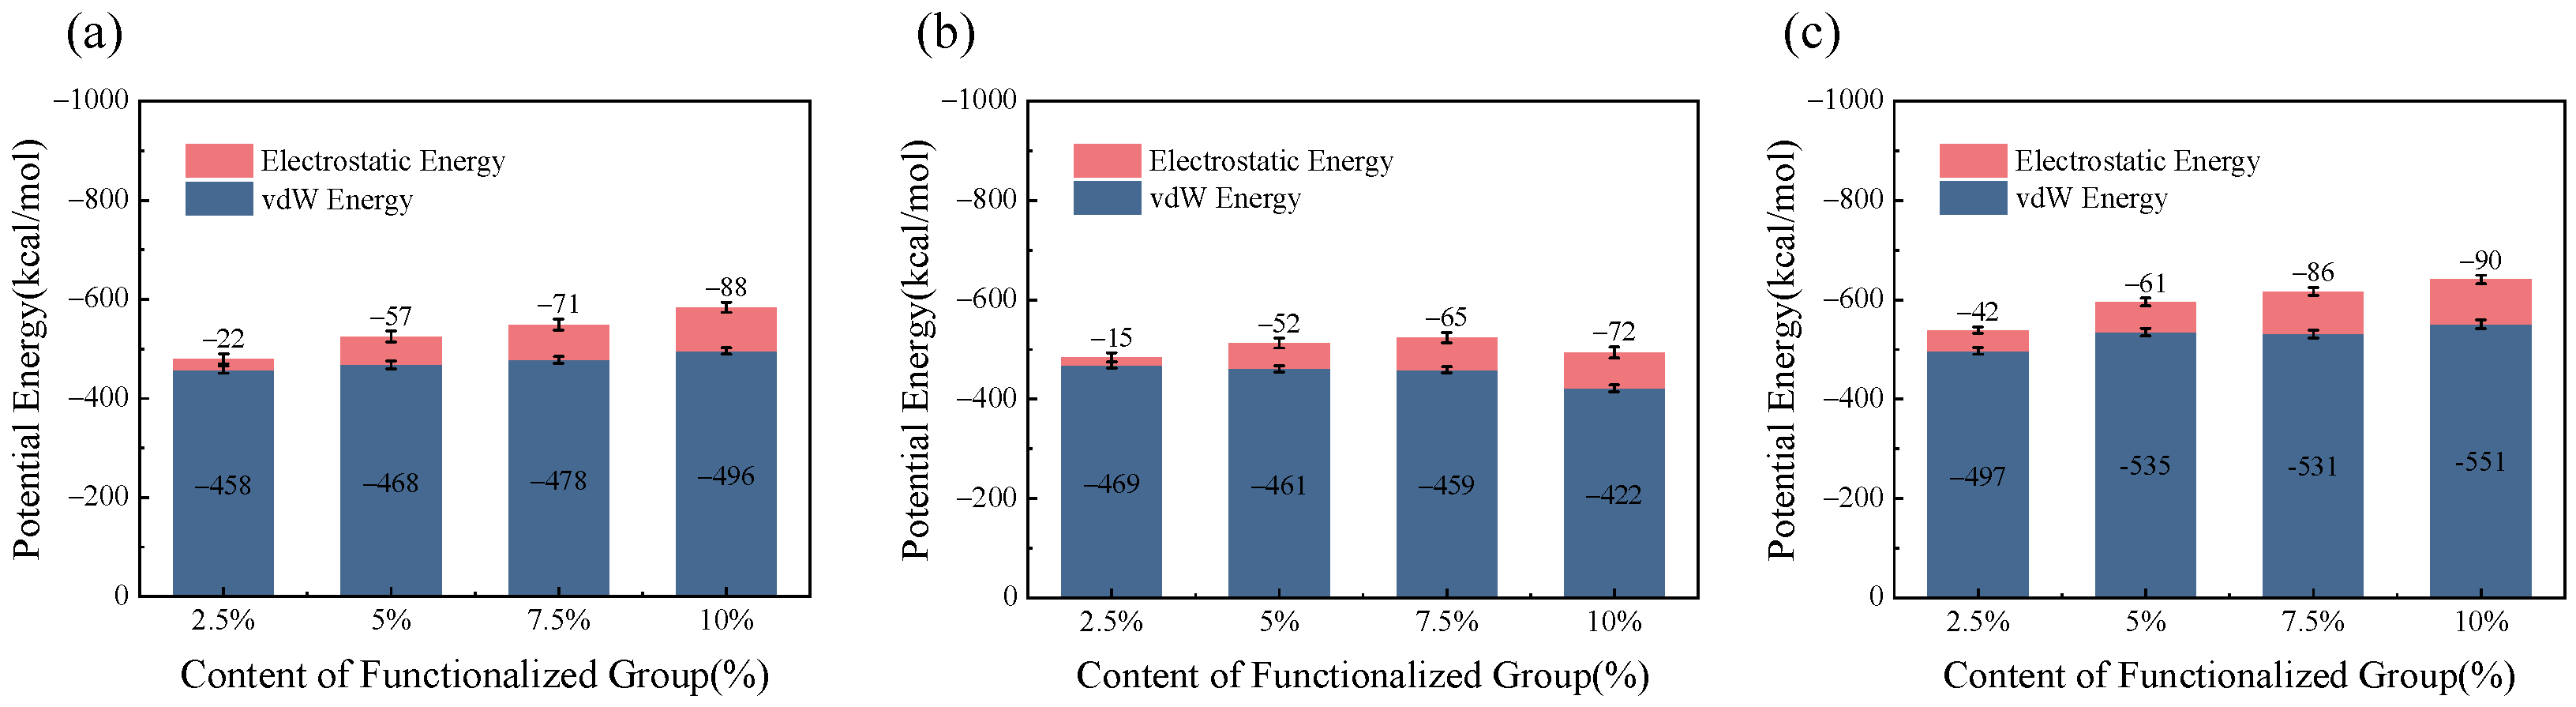
Figure 3 shows the contributions of vdw potential energy and electrostatic potential energy to the interfacial interaction energy, revealing that vdw potential energy makes a greater contribution to the interaction between PI and CNT. This primarily originates from the interaction between PI and the electrically neutral surface of CNT. However, by analyzing
Figure 3b,c, it can be observed that when the content of functional groups increases from 5% to 7.5%, the vdw interaction potential between PI and CNT decreases. This indicates that the modification with polar functional groups contributes little to the vdw interaction between CNT and PI; instead, it causes a reduction in the vdw interaction due to the excluded volume effect. Additionally, under the condition of the same number of functional groups, the electrostatic interaction potential in systems with higher-polarity functional groups is greater than in those with lower-polarity groups. For example, at 7.5% content, the electrostatic interaction potentials of the cCNT/PI and hCNT/PI systems are 85.9 kcal/mol and 70.51 kcal/mol, respectively, while that of the aCNT/PI system is 64.5 kcal/mol. Through comparison, it is found that the proportion of the electrostatic interaction potential in the total interfacial interaction energy is higher in the cCNT/PI and hCNT/PI systems, which contain functional groups with higher polarity, than in the aCNT/PI system. This indicates that the differences in the polarity of functional groups are reflected in the electrostatic interaction potential. The electrostatic potential of functional groups is primarily influenced by the electronegativity of polar atoms and the distribution of force-field charges. The strong electronegativity of polar atoms also increases the likelihood of hydrogen bonds (H-bonds) formation, which is one of the main reasons for the increase in interfacial energy.
As shown in
Figure 3a–c, the interfacial interaction in the cCNT/PI system is stronger than that in the hCNT/PI system at the same functional group content; however, the difference in electrostatic potential between the two is not significant. For example, at a 10% content, the electrostatic potential values between hCNT and PI, and between cCNT and PI are 87.52 kcal/mol and 90.03 kcal/mol, respectively. This is because the -COOH functional group contains two polar groups (-OH and -C=O), both capable of forming H-bonds. However, due to the close proximity of these groups, they cannot provide sufficient contact sites to form H-bonds with PI, thereby reducing the probability of hydrogen bond formation between PI and the -COOH functional group. To validate these hypotheses, it is essential to investigate the effects of functional group type and content on H-bonds formation to understand the underlying mechanism.
3.2. Effect of Functionalization on Hydrogen Bonds
While prior literature has indicated that the interfacial binding strength between CNT and PI can be influenced by the polarity of functional groups through H-bonds interactions, few studies have explicitly reported the donor–acceptor relationships of H-bonds between the PI matrix and CNT. Additionally, although some reports have noted that increasing the functional group content can enhance interfacial strength, the underlying mechanisms and the impact of content level on interfacial strength remain unclear. Therefore, to qualitatively investigate the effect of the type and content of functional groups on the formation of H-bonds between CNT and PI, as well as to clarify the nature of H-bonds between PI and CNT, the radial distribution function (RDF) and the number density of H-bonds are introduced. In the following discussion,
denotes the oxygen atom of the carbonyl (-C=O) group,
represents the oxygen atom of the ether (-O-) group, and
indicates the fluorine atom in the PI backbone. The formula for calculating the RDF is
where
is the system density (quantity density),
N is the total number of atoms,
T is the computation time (steps), and
r is the radius from the reference atom. According to previous literature, H-bonds are identified based on the criteria that the donor–hydrogen-acceptor angle exceeds 150° and the distance between the donor and acceptor is less than 3.5 Å. However, the types and polarities of hydrogen atoms as donors or acceptors can affect the geometric configuration of H-bonds, thereby influencing their bond strength. This indicates that clarifying the types of formed H-bonds is crucial when analyzing the effect of hydrogen bonding on interfacial binding properties. Therefore, it is necessary to conduct research on the formation of H-bonds between CNT modified with different functional groups and PI. In calculating the RDF, the oxygen atoms in the C=O, -O-, and -F groups of the polymer are designated as H-bond acceptors, while the -OH and -NH
2 groups on the CNT surface serve as H-bond donors (through their O-H and N-H bonds, respectively), while the oxygen and fluorine atoms in the C=O, -O-, and -F groups of PI serve as acceptors. Taking the -OH group as an example, the RDF of the functional groups C=O, -O-, and -F with -OH are denoted as g(
-
), g(
-
), and g(
-
), respectively.
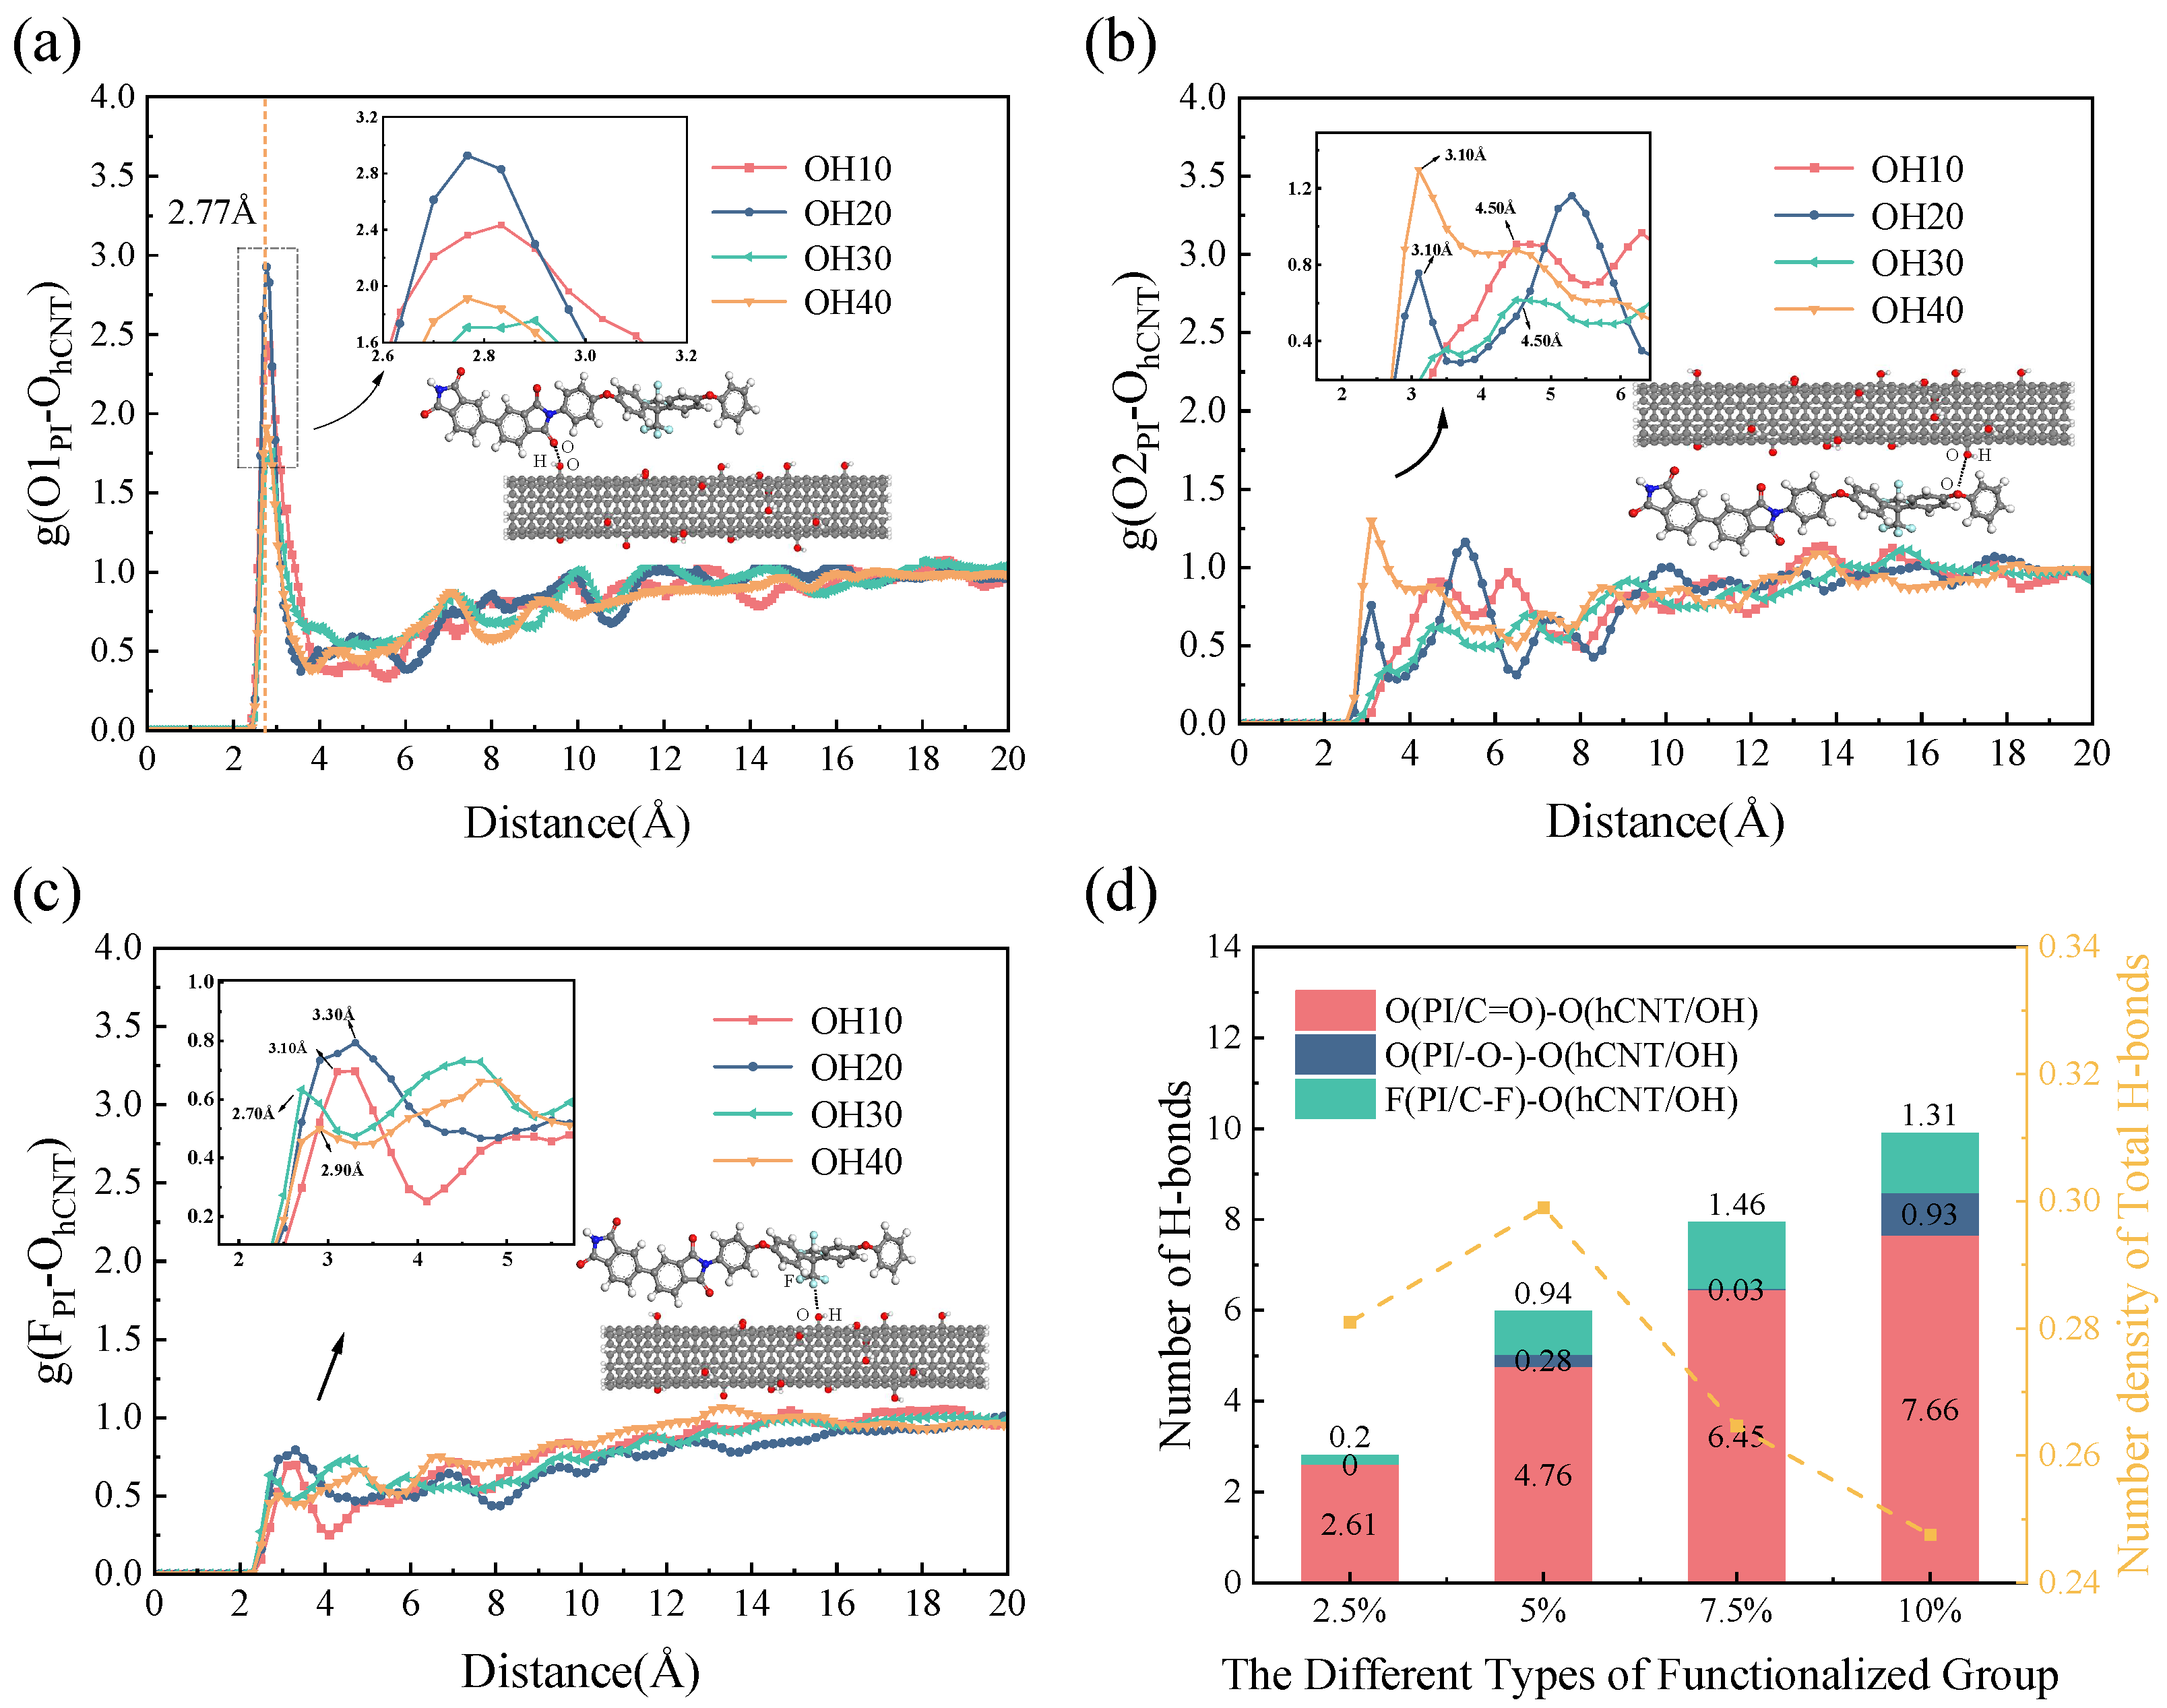
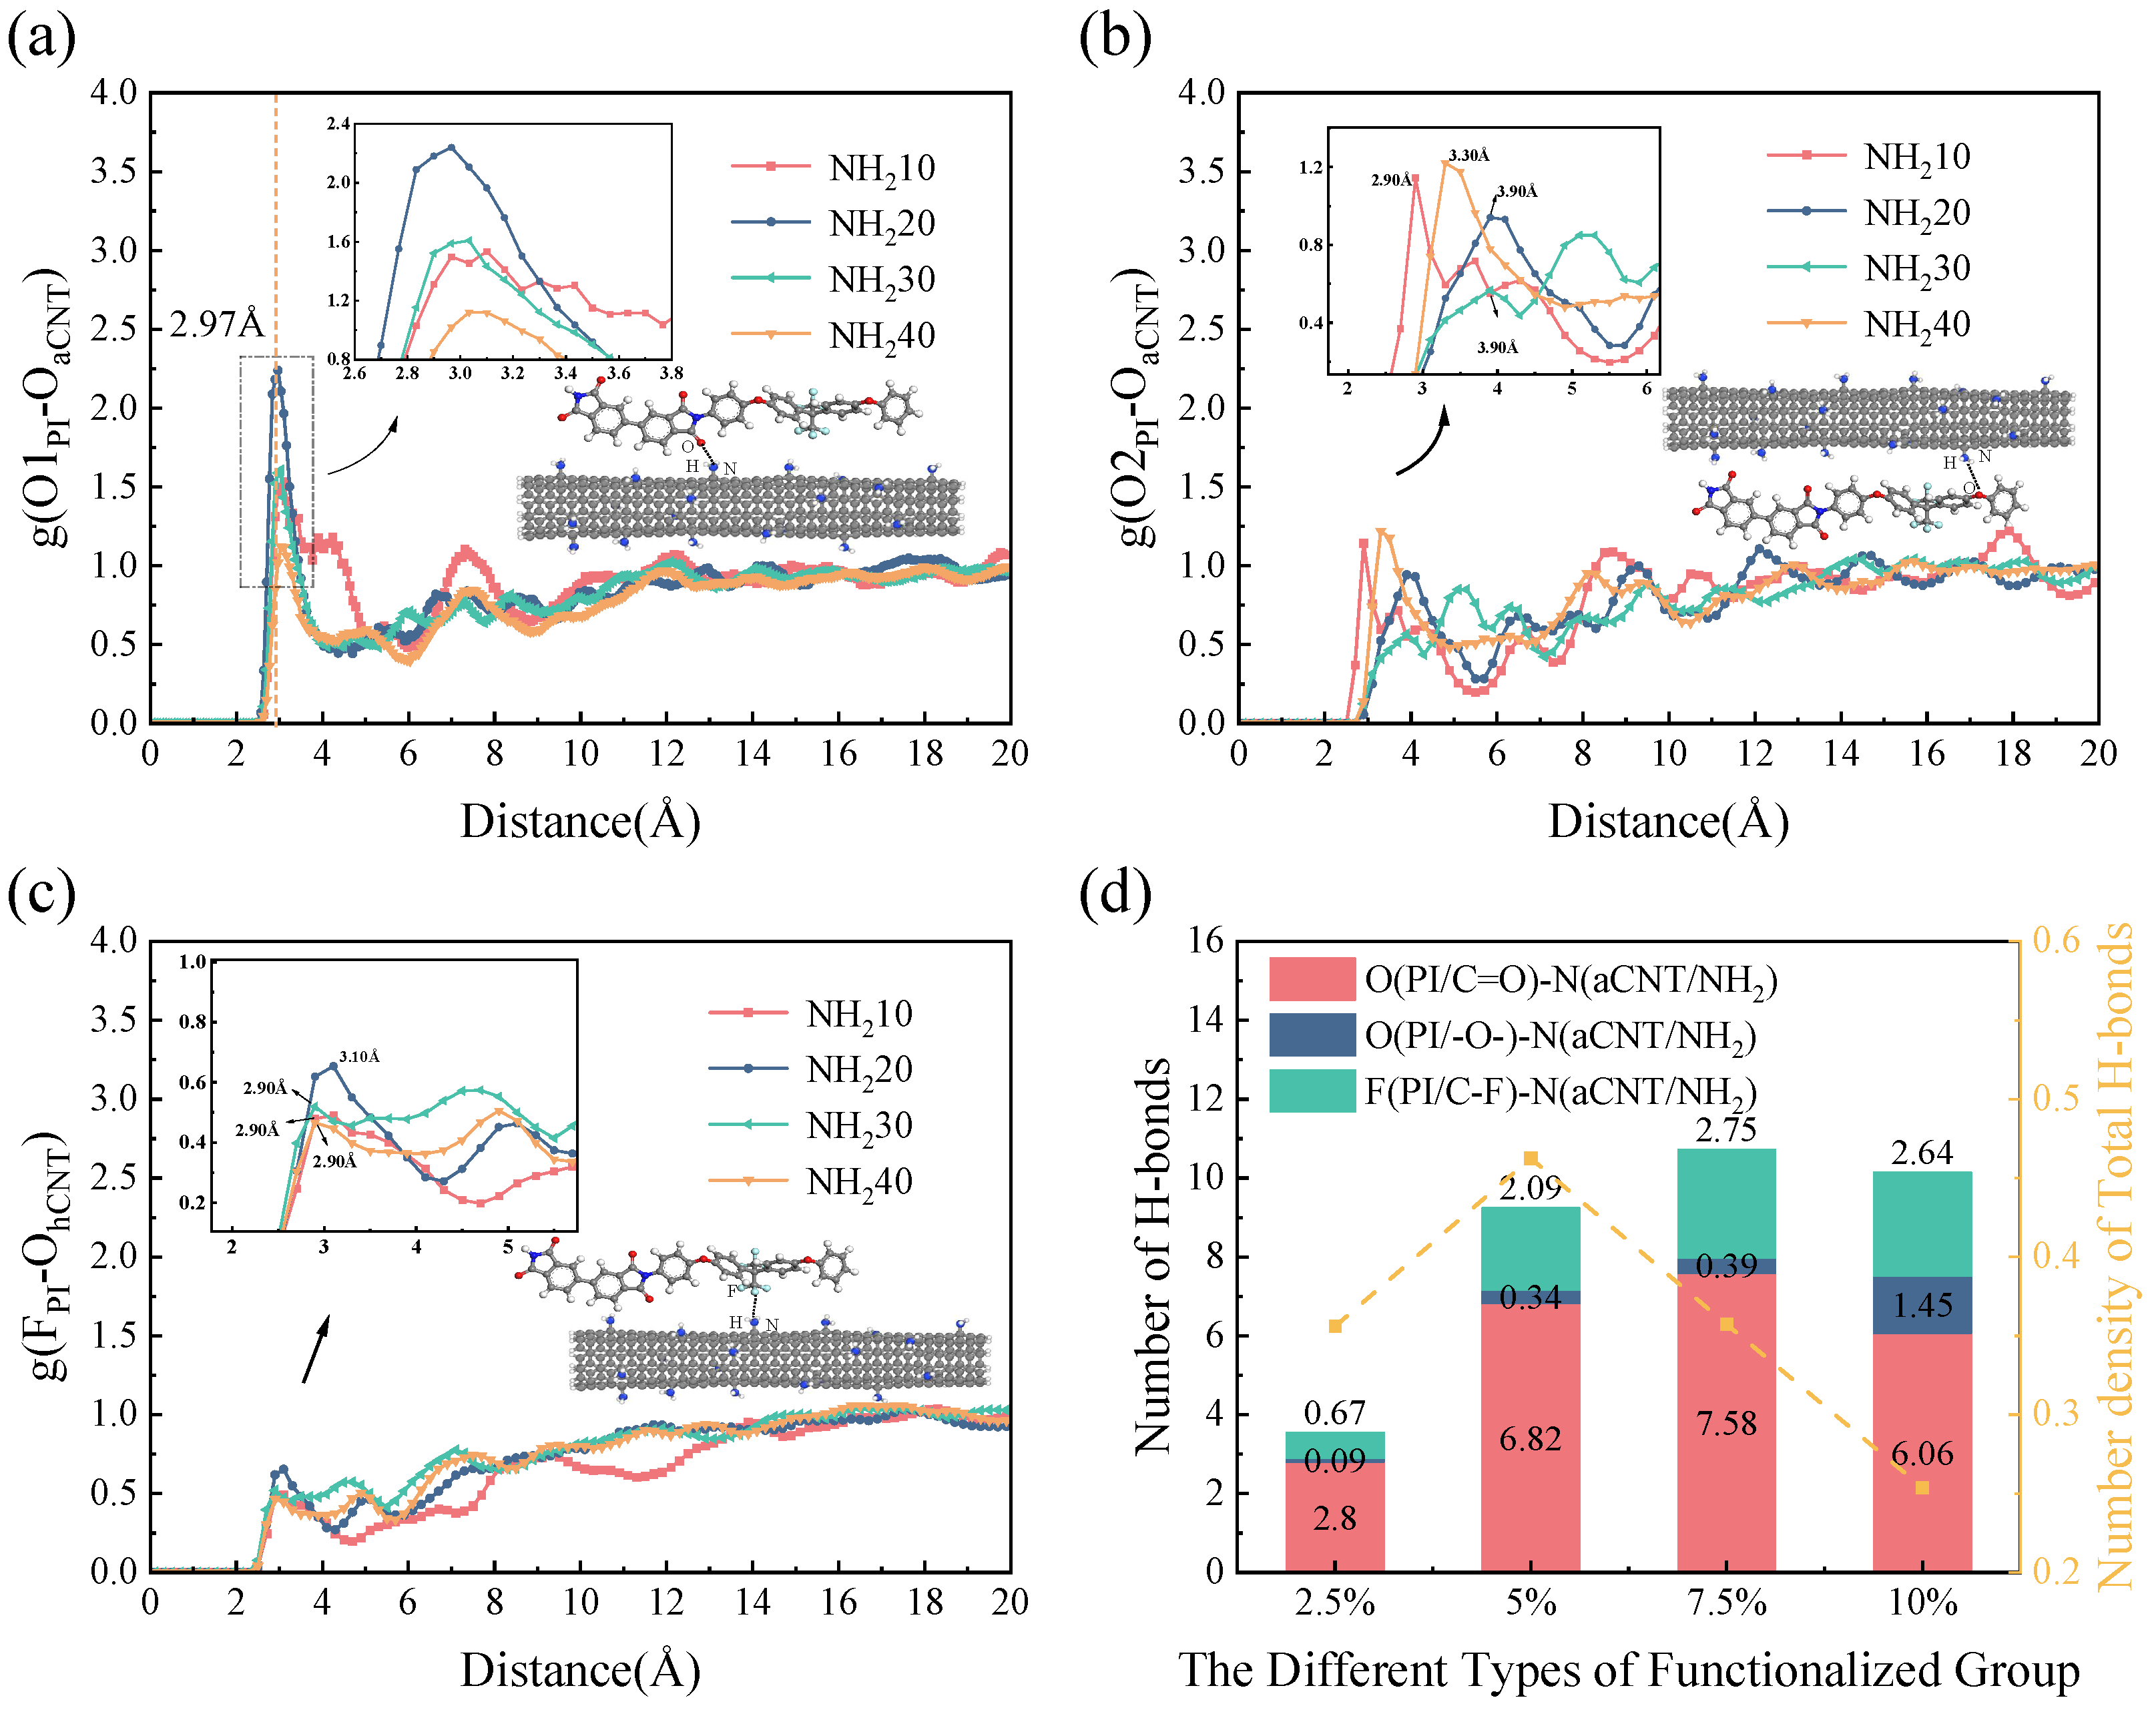
Figure 4,
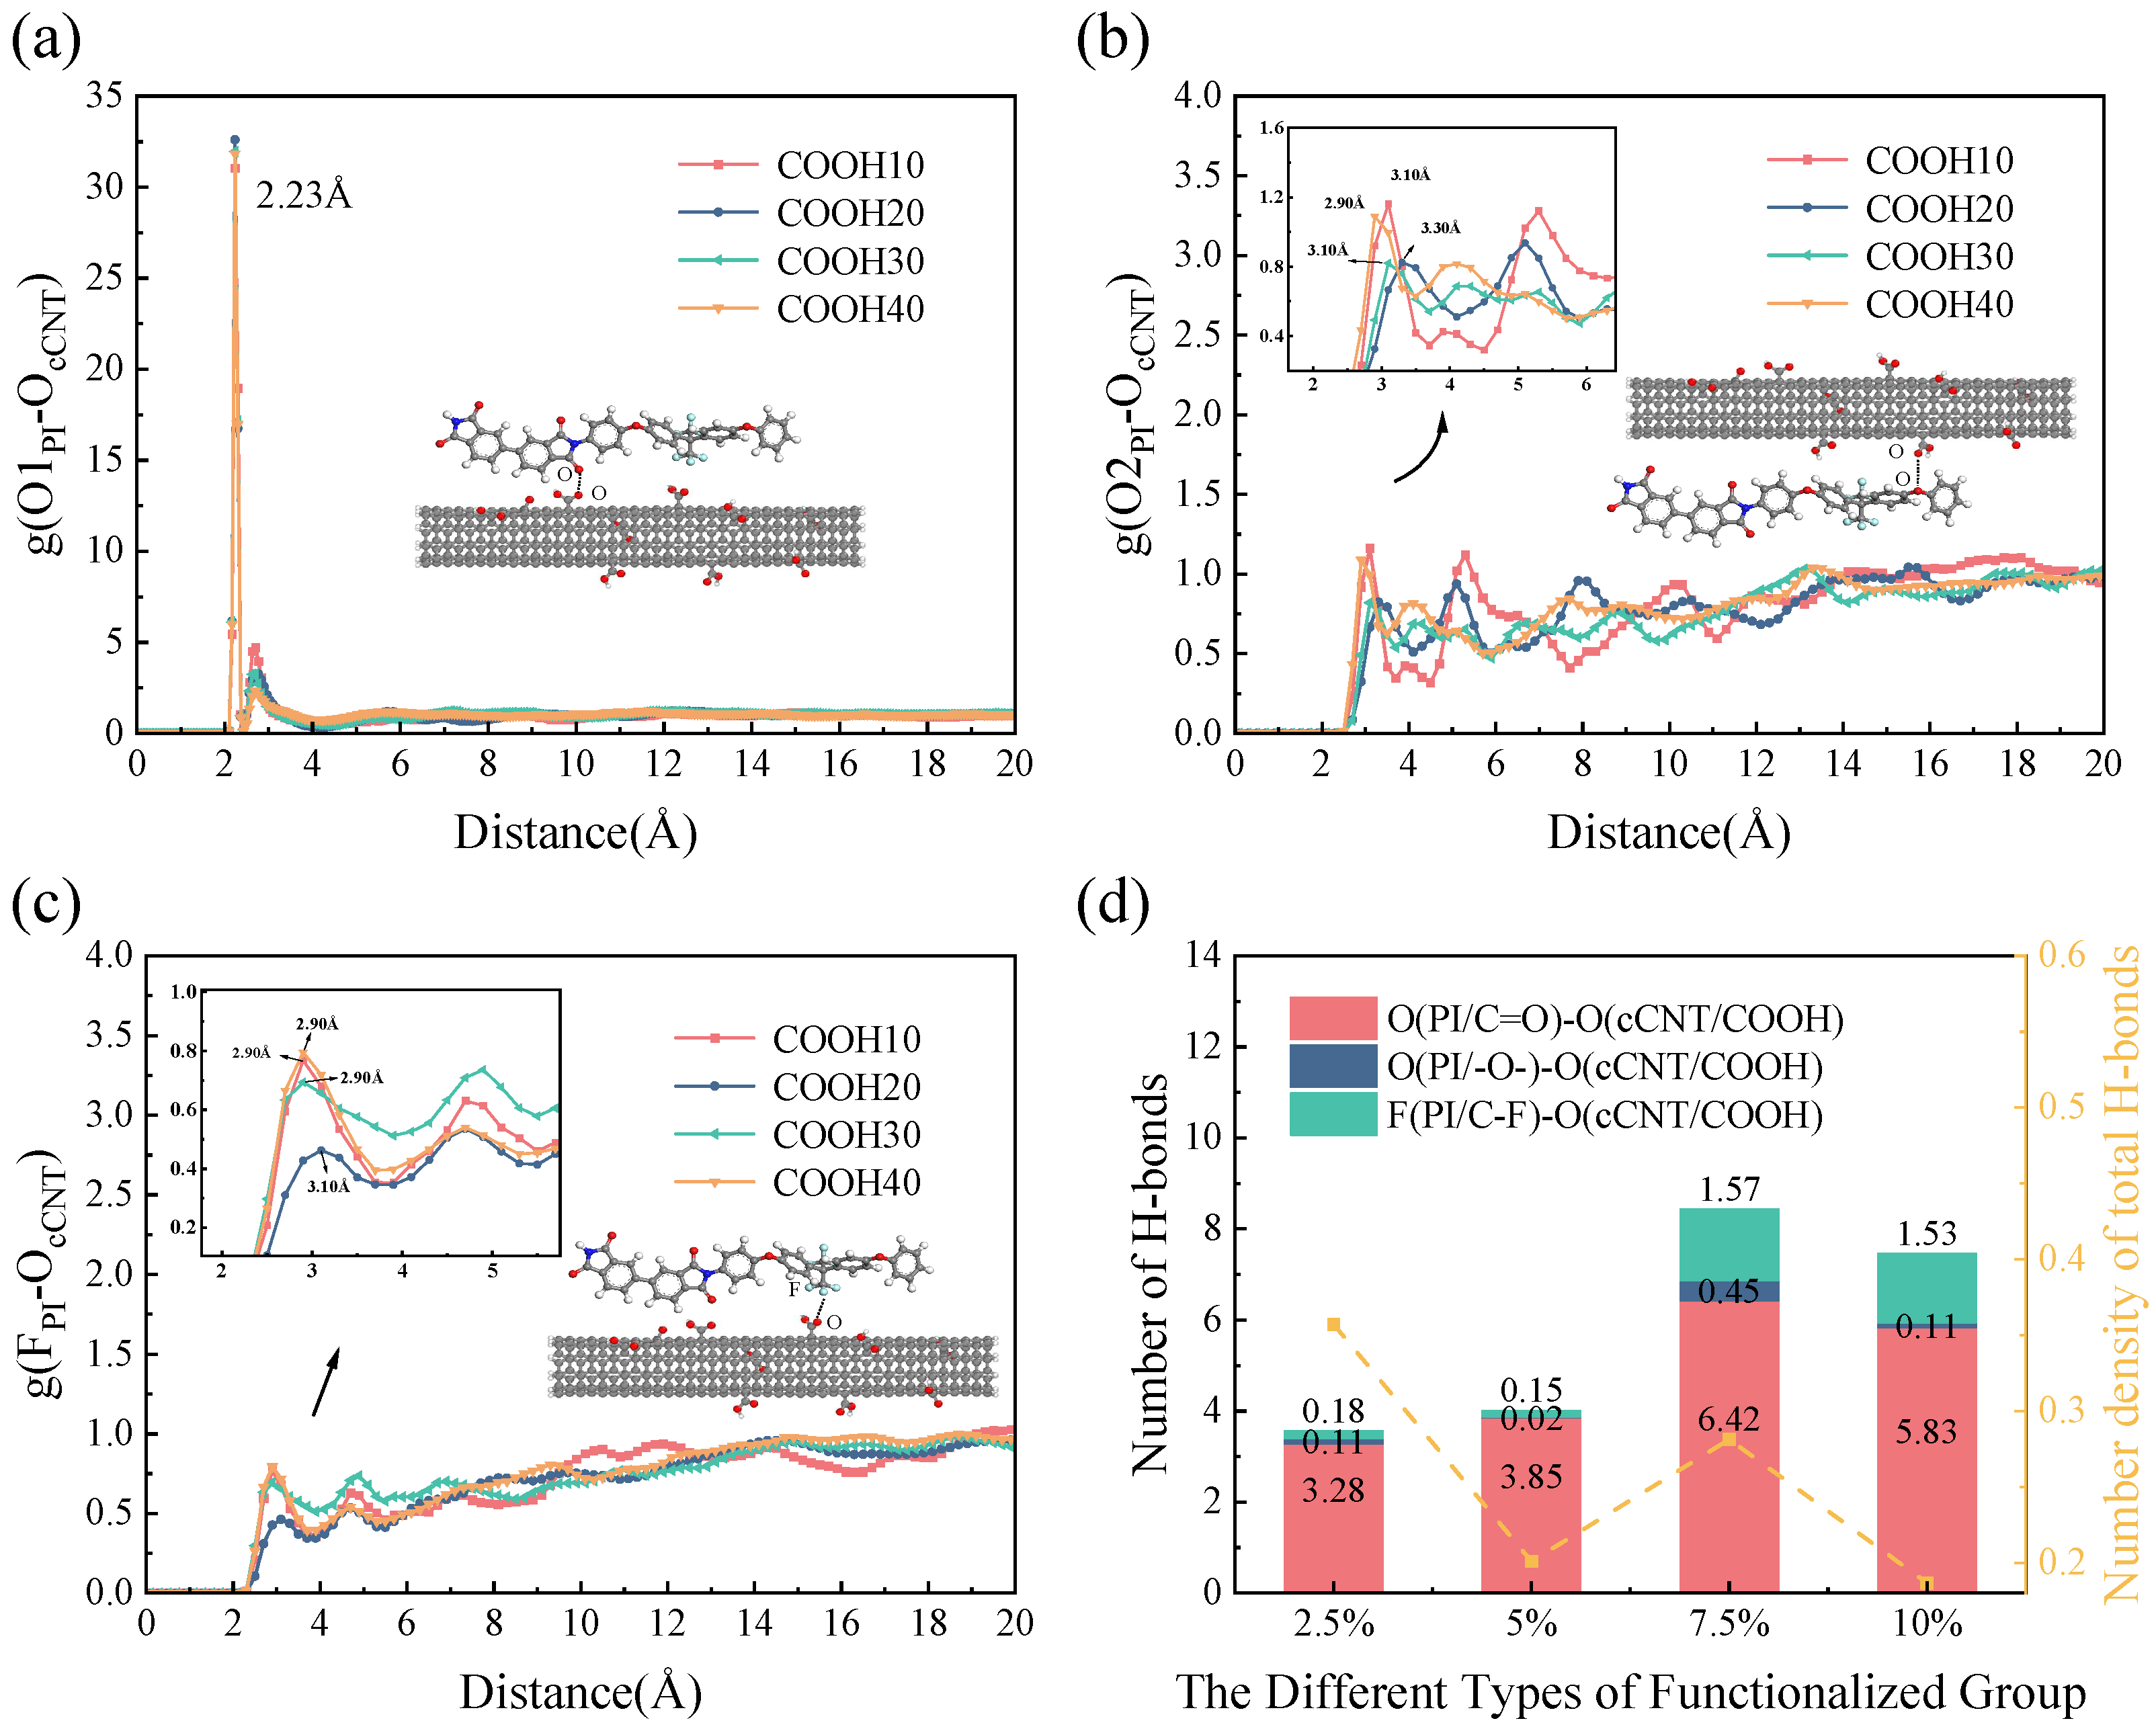
Figure 5 and
Figure 6 illustrates the RDF of H-bonds donors and acceptors potentially forming H-bonds between PI and CNTs functionalized with -OH, -
, and -COOH groups, respectively. In
Figure 4,
Figure 5 and
Figure 6, the first peak of each curve represents the average distance between the selected polar atoms in the equilibrium structure, while the curve height indicates the degree of atomic aggregation. To effectively compare the H-bonds formed by different functional group contents, the H-bonds generated by varying numbers of functional groups are normalized and defined as the H-bond density. The H-bond density, denoted as
, is defined as the ratio of the number of H-bonds formed (i.e.,
) to the total number of functional groups (i.e.,
) at a given functional group content, as expressed by Equation (
4):
As shown in
Figure 4, the first peak in the RDF of (
/
,
/
and
/
in hCNT/PI nanocomposites appears at 2.77 Å, 3.1 Å and 2.7 Å, respectively. Peaks within 3.5 Å in the RDF indicate the presence of covalent or hydrogen bonds between two atoms, while peaks beyond 3.5 Å suggest vdw interactions and Coulomb forces. It is believed that
/
,
/
, and
/
can all form H-bonds. Additionally, compared to the RDF of
/
and
/
, a sharper peak at the initial position is observed in the RDF of
/
. These results indicate that the donor-acceptor distance between
and
is smaller than the distances between
/
,
/
and
. This suggests that the probability of H-bond formation is highest between
of the -OH groups on the surface of CNT and
of the C=O groups on the PI chains. This finding is also reflected in the difference in the number of these two types of hydrogen bonds, as shown in
Figure 4d. As shown in
Figure 4d, the number of hydrogen bonds formed between OhCNT and
is greater than that between
,
, and
, indicating that the first type of hydrogen bond plays a major role in the binding energy. As observed in
Figure 4a, with the increase in the content of -OH functional groups, the peak value of the first peak of the g(r) curve does not exhibit a monotonically increasing trend with the increase in functional groups. Instead, a maximum value appeared at 5%, indicating that at this concentration, the attractive force between the oxygen atoms of the -OH groups on hCNT and the C=O groups on PI at the interface of the hCNT/PI system reaches its maximum, making it impossible to adsorb more functional groups. This also suggests that the O–H···O type H-bonds formed between the -OH donor on hCNT and the C=O acceptor of PI.
To further analyze the influence of functional group content on interfacial H-bond formation and to verify the accuracy of RDF results, the number of interfacial H-bonds is statistically analyzed based on established H-bonds identification criteria, as shown in
Figure 4d. The figure reveals that as the content of functional groups modified on the CNT surface increases, the number of H-bonds formed at the hCNT/PI interface gradually rises. However, the H-bond density reaches a maximum when the functional group content is 5%. This plateau is attributed to the randomness of functional group modification on the CNT surface and the volume exclusion effect induced by the functional groups. These findings indicate the existence of a content threshold in the process of interfacial H-bonds formation. Beyond this threshold, no additional H-bonds can form at the CNT/PI interface, thereby limiting further enhancement of the interfacial bonding strength.
For the aCNT/PI model (i.e.,
Figure 5), the first peak of the RDF between
in the C=O group and
in the -
group appears at 2.97 Å. Meanwhile, the peaks of the RDF between
in the -O- group,
in the -F- group and
all emerge at 2.90 Å. This indicates that N-H⋯O type H-bonds can form between
and
,
, and
. However, the peak value of the g(
-
) curve is higher than those of the g(
-
) and g(
-
) curves. Thus,
of the C=O group has the highest probability of forming H-bonds. As observed in
Figure 5a, as the content of the -
functional groups increases, the peak value of the first peak of the g(r) curve reaches a maximum when the functional group content is 5%, suggesting that this type of H-bond has reached saturation at this point. In contrast, as the functional group content increases, the position of the single peak of
in the -O- group shifts to 3.9 Å, which exceeds the previously established cutoff distance for H-bonds. This implies that at the functional group contents of 5% and 7.5%, the polar atom pair
-
between the PI molecules and the aCNT system cannot form H-bonds (as shown in
Figure 5b). The peak value of the RDF between
of the -F- group and
of the -
group reaches a maximum at the 2.5%, however, the overall g(r) value does not exceed 0.75. In general, by comparing the position of g(r) and the first peak, it can be concluded that the strength of the H-bond between
and
is greater than that between
,
, and
. This result is also reflected in the difference in the number of H-bonds, as shown in
Figure 5d. The number of H-bonds formed by
-
is significantly greater than those formed by
-
and
-
, with the H-bond density reaching a maximum at 5% content.
For the cCNT/PI model (i.e.,
Figure 6), the peak values of the RDF curves for
-
and
-
are significantly lower than that for the
-
pair. This indicates a much weaker interfacial interaction. As shown in
Figure 6d, even at a functional group content of 10%, the number of H-bonds formed in the
-
and
-
pairs does not exceed 1 and 2, respectively, suggesting a negligible probability of H-bond formation. In contrast, the RDF curve for
-
in
Figure 6a exhibits a sharp, distinct peak at 2.23 Å. This peak corresponds to the formation of an O–H···O type H-bond, where the -OH group of the -COOH functional group on the cCNT acts as the H-bond donor, and the C=O group of the PI molecule acts as the acceptor. The hydrogen donation ability of the -OH group is significantly enhanced by the adjacent electron-withdrawing carbonyl (C=O) group within the -COOH functionality. In addition, the carbonyl group in the -COOH functionality acts as a H-bond acceptor, forming weak interactions with the C=O groups of PI and thereby increasing the number of available binding sites. This combination of donor and acceptor groups creates a synergistic effect, which collectively contributes to a significant enhancement of the PI-cCNT interfacial interaction.
Furthermore, a comparison of
Figure 4d and
Figure 6d reveals that the hCNT/PI system, which relies on O–H···O hydrogen bonding, requires a higher functional group content to reach interfacial saturation than the cCNT system. This difference is attributed to the molecular structure of the -COOH group. In addition to the -OH donor, the carboxyl group possesses a carbonyl (C=O) moiety, which introduces greater steric hindrance. This heightened steric exclusion in the cCNT/PI system reduces the number of accessible contact sites between the carbonyl groups of PI and the -OH donors on the CNT, thereby lowering the probability of forming O–H···O H-bonds and leading to an earlier saturation.
This H-bond saturation, combined with the monotonic decrease in
driven by the excluded-volume effect described in
Section 3.1, collectively demonstrates that over-functionalization introduces competing negative effects on the CNT/PI interfacial interaction. To further validate the hydrogen bond analysis presented above, the interfacial potential energy decomposition results in
Section 3.1 (
Figure 3) are revisited. Since hydrogen bonds are composed of both electrostatic and van der Waals interactions, with electrostatic interactions being the dominant component, systems with a higher hydrogen bond density are expected to exhibit larger electrostatic interaction energies. As shown in
Figure 3, the electrostatic interaction energies follow the order cCNT/PI > hCNT/PI > aCNT/PI, which is consistent with the hydrogen bond density results obtained from the RDF analysis and hydrogen bond counting in this section. This agreement between the energy decomposition and the geometric hydrogen bond characterization provides mutual validation of the two analyses.
3.3. Effect of Functionalization on Shear Properties
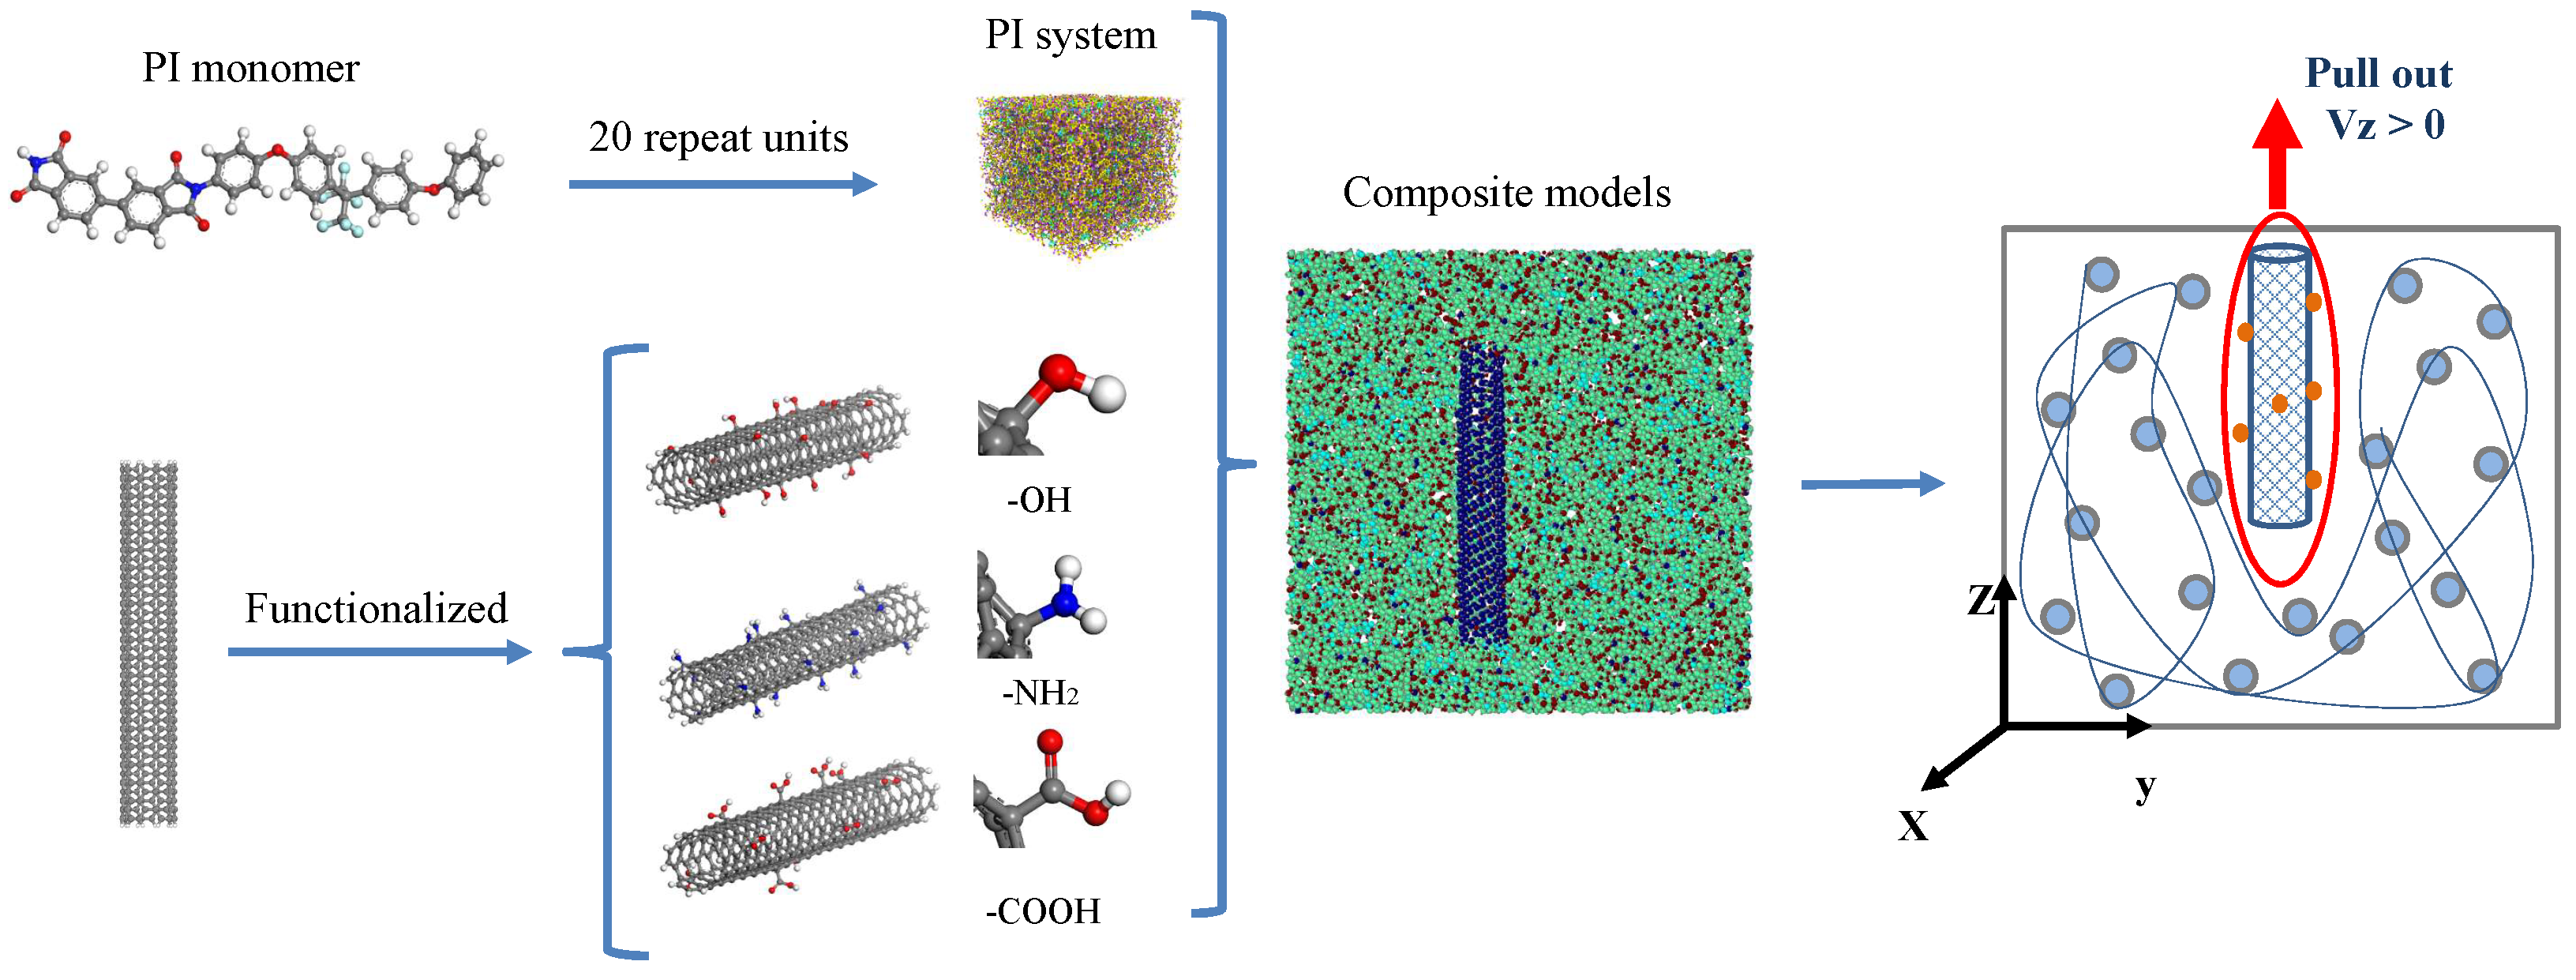
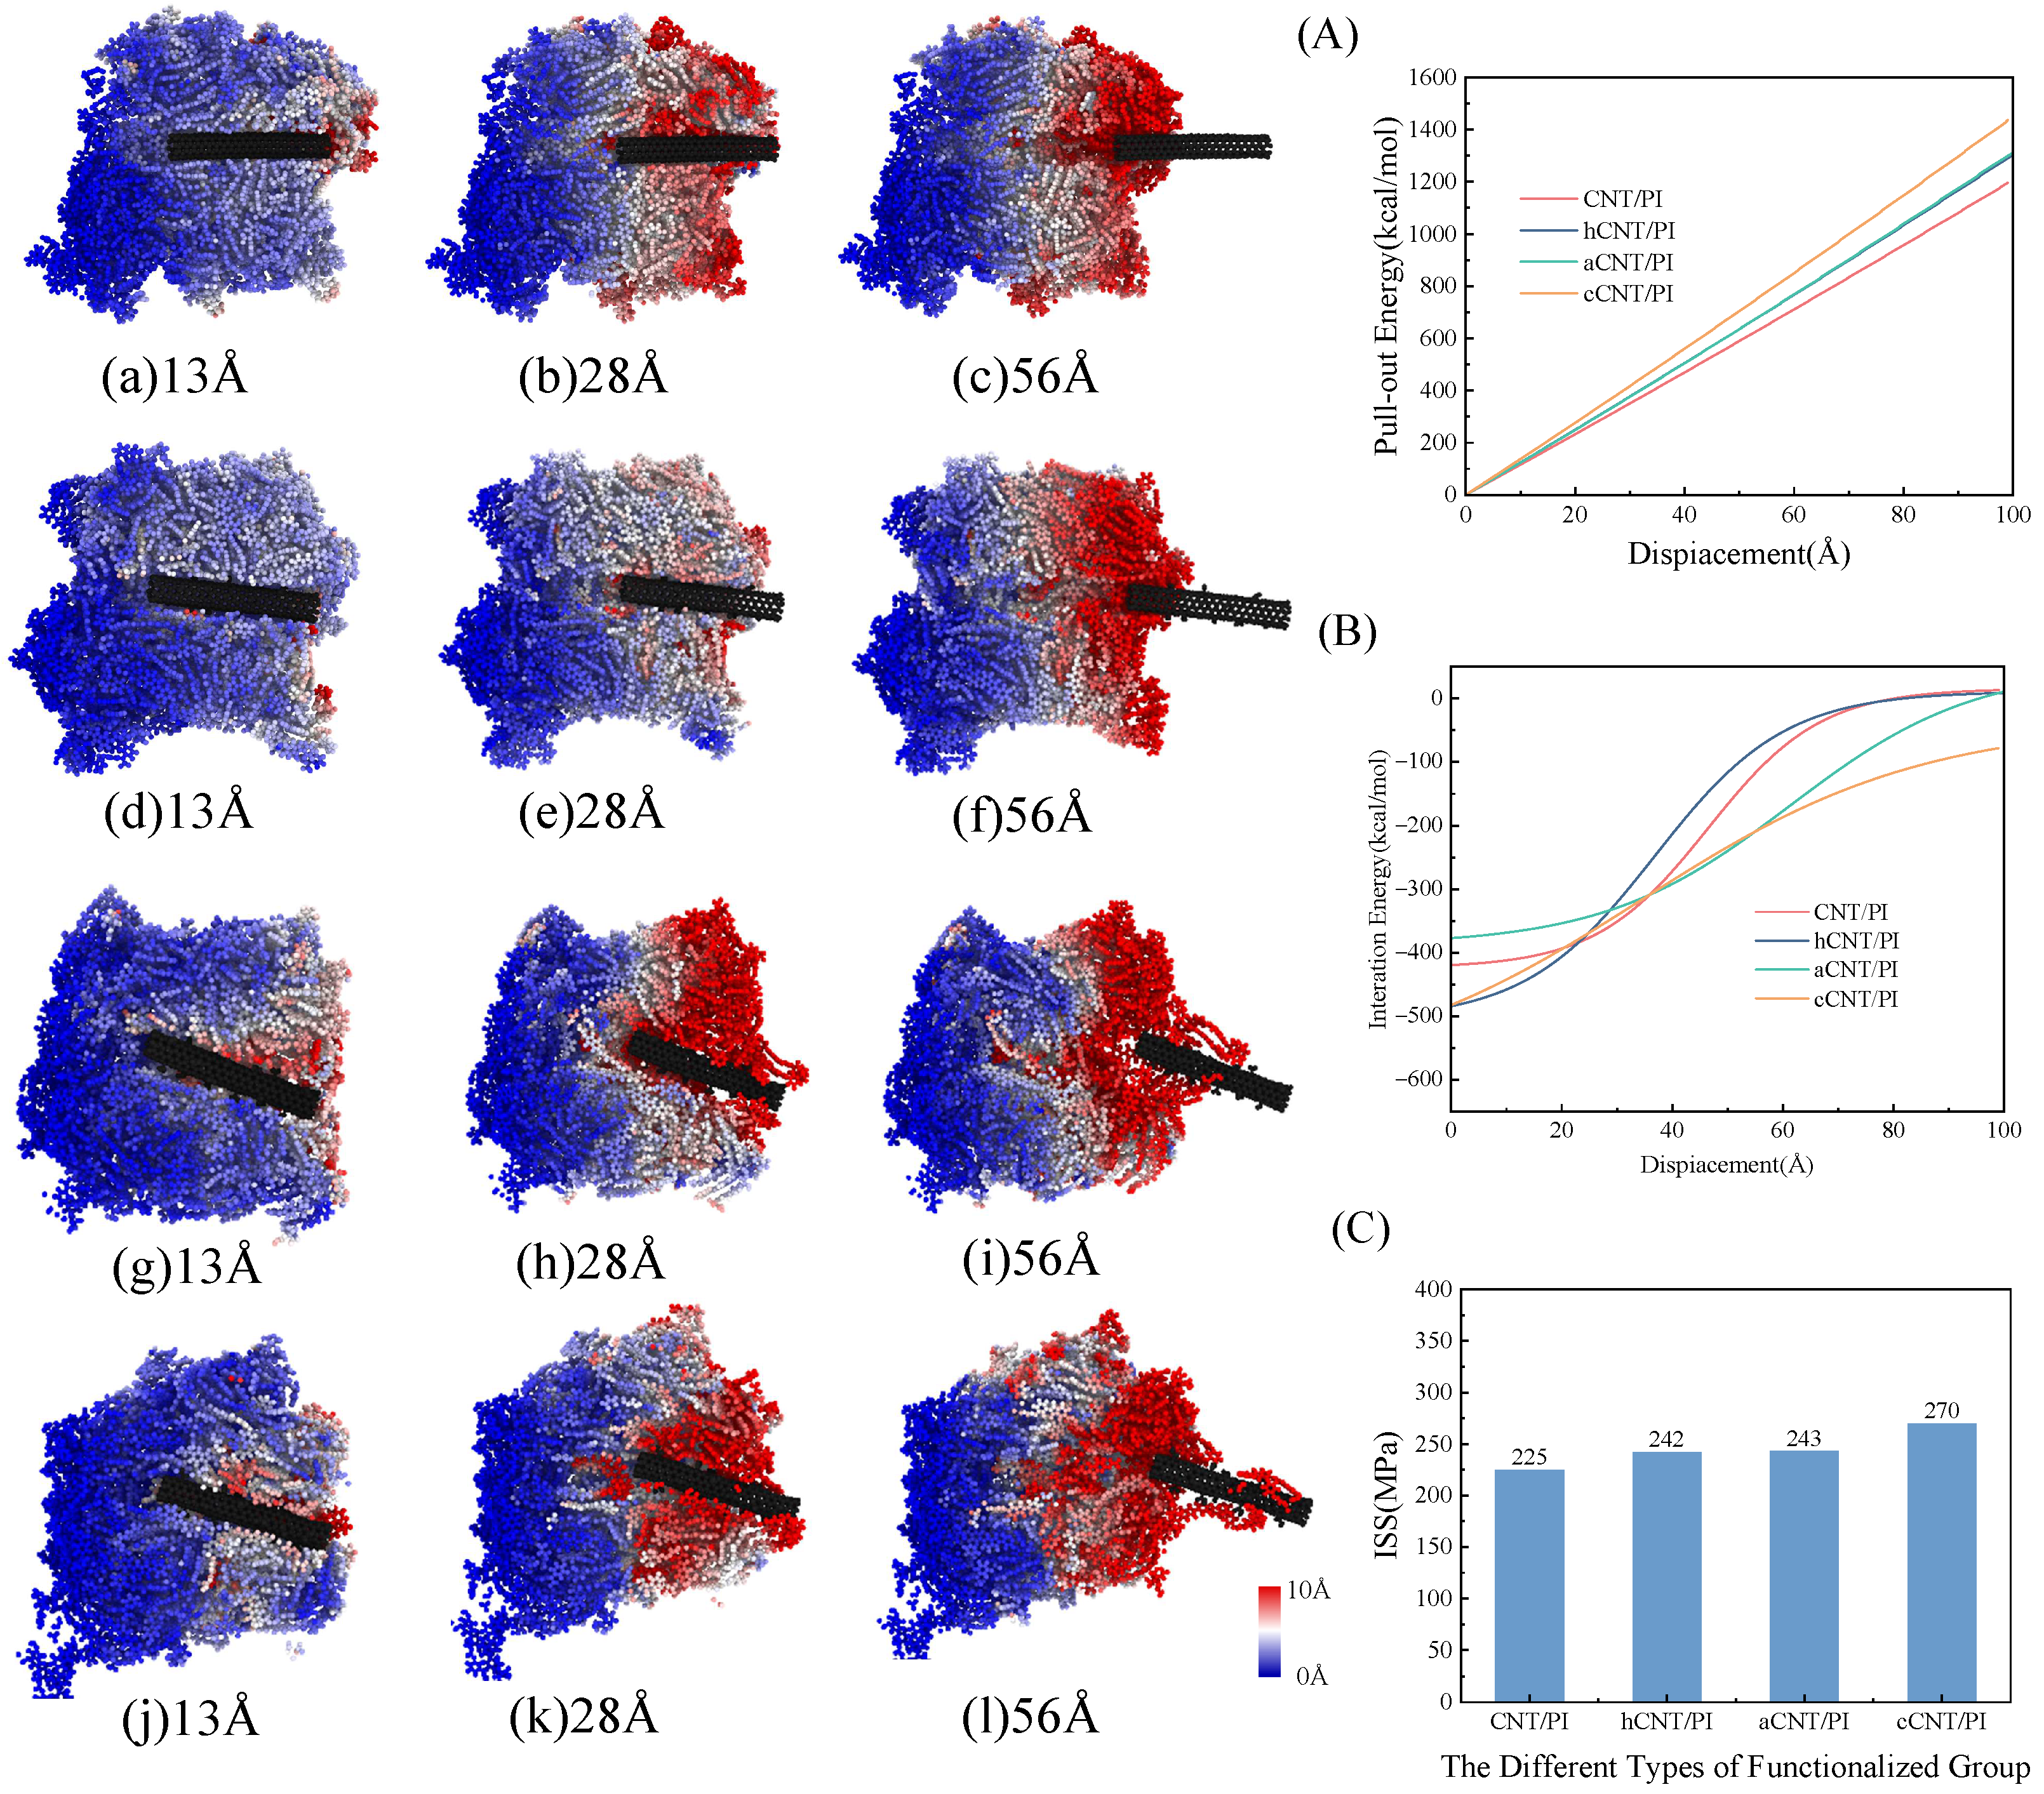
To investigate the interfacial properties and load transfer capability between the CNT and the PI matrix, we perform pull-out simulations on both pristine and functionalized CNT/PI nanocomposites. The interactions between the CNT wall and the polymer matrix are governed by non-bonded interactions, primarily van der Waals forces and hydrogen bonding. The PMF obtained from SMD simulations is plotted against displacement in
Figure 7A. The results indicate that the pull-out work increases approximately linearly with displacement, with a higher value for the functionalized CNT than for the pristine CNT. Furthermore, the CNT-PI interaction energy, plotted in
Figure 7B, exhibits a negative value, confirming an attractive interaction between the CNT and the PI matrix. The simulation results confirm that functionalization significantly enhances the interfacial interaction between the CNT and the PI matrix. This improvement is quantitatively reflected in the ISS, which was calculated from the pull-out energies using Equation (
1). The ISS of the pristine CNT–PI interface is calculated as 225 MPa. By comparison, the interfaces between polymer matrix and functionalized CNTs presented higher ISS values, varying from 242 MPa to 269 MPa. The obtained results are of the same order of magnitude as previously reported MD simulation values in the literature, including ISS values of 100–300 MPa for carbon fiber/polyimide composites [
35] and 400–500 MPa for amino-functionalized CNT/epoxy composites [
36], demonstrating the reasonableness of the present model. The maximum observed improvement of approximately 20%, achieved in the cCNT/PI system, demonstrates that appropriate functional group selection effectively promotes stronger interfacial adhesion. Since ISS directly governs the efficiency of stress transfer from the matrix to the CNT, this enhancement is expected to translate into measurable improvements in the macroscopic mechanical performance of the composite, including tensile strength and fracture toughness.
To further explore the load transfer mechanism in the nanocomposites, the relative atomic displacements are estimated between the adjacent atomic configurations. The interactions between the CNT and PI matrix cause the local deformation of nearby polymer chains during the pull-out process. In the beginning for the pristine CNT case, only the PI chains at the adjacent region around the interface show large displacements as shown in
Figure 7a. In the case of functionalized CNT, the PI chains surrounding the CNTs are affected by the movement of the functional groups, as shown in
Figure 7d,g,j. The pull-out of CNT in the nanocomposites releases the preoccupied space inside the PI matrix, which allows the relaxation of PI chains at the free end of CNT. The PI chains start to move towards the vacancy surrounding the tail of CNT, and such movement is captured in both nanocomposite systems in
Figure 7b,e,h,k. The atoms of PI matrix are more active in the functionalized CNT case, suggesting more PI chains are affected by the functional groups. Before the complete pull-out, the regions with larger displacements are mostly located in the pull-out direction of the CNT, and the amount of these atoms is greater in the functionalized CNT case than that in the pristine CNT case as compared in
Figure 7c,f,i,l. The functionalized CNT interacts with more PI chains, leading to more severe local deformation during the pull-out process and higher ISS in CNT-PI nanocomposite. The results suggest that the introduction of the functional groups can cause better mechanical interlocking in nanocomposites, which effectively strengthens the interface between CNT and PI matrix.