1. Introduction
Semicrystalline polymers such as poly-
-caprolactone (PCL) are extensively employed in the fabrication of bioresorbable films for medical applications. These films are effective as surgical aids, including resorbable hernia meshes designed to provide a bioactive environment for cell development and barrier membranes used in laparoscopy to prevent tissue adhesion [
1,
2,
3,
4]. In tissue engineering, PCL films function as specialised patches for cartilage, skin, and bone–tendon interface repair, as well as protective coatings for dental implants to enhance cell–material interactions. Their clinical success is underpinned by FDA approval and the ability to undergo slow, controlled degradation via hydrolysis or enzymolysis into non-toxic byproducts such as 6-hydroxycaproic acid [
3]. The rubbery state of PCL at body temperature, combined with the tunable transparency, permeability, and mechanical flexibility afforded by PCL, makes these films ideal for sustained structural support and long-term drug delivery. Such characteristics have further enabled “smart” film-based systems, including shape-memory foams for aneurysm treatment and enzyme-responsive therapeutic platforms [
5,
6]. A diverse range of enzymes mediate the enzymatic degradation of bioresorbable polymers [
7]. Upon implantation, these materials typically elicit a wound healing response, initiating the recruitment of inflammatory cells and activation of the immune system [
8]. These cellular interactions promote the secretion of degradative enzymes, particularly by macrophages and multinucleated giant cells [
4]. In vivo evidence of enzymatic degradation has been found in animal studies; for example, Yang et al. [
9] reported substantial subcutaneous erosion of poly(trimethylene carbonate) (PTMC) rods in rats due to lipase activity, in contrast to negligible degradation under purely hydrolytic conditions. Furthermore, this enzymatic process is actively leveraged in the development of enzyme-responsive polymeric systems capable of releasing therapeutic agents selectively in pathological environments, such as cancerous tumours with elevated enzyme concentrations [
5,
6].
PCL exhibits more complex enzymatic degradation than amorphous polymers because crystalline lamellae and amorphous domains differ fundamentally in accessibility and reactivity. Accordingly, extensive studies of PCL consistently show that degradation is governed by interacting factors, including enzyme type and origin, initial crystallinity and morphology, and surface accessibility. A recurring observation is that crystallinity evolves during degradation, which may be due to preferential or non-preferential enzymolysis of the polymer states. In systems where the amorphous regions are degraded more rapidly than the crystalline regions, the crystalline fraction of the specimen may increase because the loss of amorphous material leaves a residue which is mainly crystalline [
10,
11,
12,
13,
14]. This behaviour has been observed across a range of bacterial lipases and cutinases, both in surface-erosion systems and in polymer specimens with enzyme embedded in the polymer matrix [
9,
10,
15]. Conversely, other studies report a net decrease in crystallinity, arguing that enzymolysis is not confined to amorphous domains and that crystalline regions are also substantially attacked [
16,
17,
18]. This has been linked in particular to certain fungal lipases, where random chain scission is thought to disrupt lamellar order [
16,
19], and further supported by evidence that accessibility of enzyme to the surface and the role of porosity in accessibility to the bulk of the polymeric device can be more significant factors in the degradation rate than the percentage crystallinity of the device [
9]. Degradation kinetics reflect enzyme-specific behaviour: cutinases and lipases have been shown to produce markedly different mass-loss profiles and surface morphologies on identical PCL substrates [
16,
20], with cutinases often producing more linear, surface-controlled kinetics and lipases producing multi-stage profiles associated with pore formation and progressive deeper penetration [
17,
20].
Several kinetic frameworks have been proposed for enzymolysis. Mukai et al. [
21] introduced a surface-erosion model for enzymatic degradation of poly[(R)-3-hydroxybutyrate] (P[(R)-3HB]) films, in which the overall rate is governed primarily by enzyme adsorption to the polymer surface. Despite the semicrystalline nature of P[(R)-3HB], however, the formulation treated the reactive surface as homogeneous, without distinguishing amorphous and crystalline regions or accounting for morphology evolution during degradation. Duguay et al. [
22] developed a detailed mechanistic framework for in vitro cholesterol-esterase degradation of a poly(ester-urea-urethane), integrating surface dynamics, enzyme adsorption, solvolysis, enzymatic bond cleavage, and soluble-product degradation. While comprehensive, the resulting 31-equation system is difficult to calibrate from typical degradation datasets, which generally provide only a limited number of observable endpoints such as mass loss. Timmins and Lenz [
23] further demonstrated that experimentally observed rate laws for PHB and PHBV degradation can deviate from classical Michaelis–Menten behaviour, and derived a surface-based model fitted by least-squares analysis, again without resolving the crystalline and amorphous contributions separately. Sridhar and Vernerey [
24] presented a one-dimensional centro-symmetric reaction–diffusion model for localised enzymatic degradation of polymers, formulated in terms of enzyme diffusion and reduction in polymer cross-link density. Their main contribution was to characterise the propagation of a fuzzy degradation interface and derive scaling laws for its speed and width from competing transport and degradation timescales. While this provides important physical insight into reaction–transport coupling, the model treats the polymer as a homogeneous network and does not resolve semicrystalline microstructure, state-selective enzymolysis, crystallinity evolution, or simultaneous fitting to crystallinity and mass-loss data. More recently, Nansak et al. [
25] proposed a mechanistic model for PLA enzymolysis incorporating product inhibition, where the accumulation of acidic degradation products slows or even stops further enzymatic degradation; however, this work considered amorphous PLA and did not extend to semicrystalline systems where crystallinity evolves concurrently with degradation.
For semicrystalline substrates, mass loss alone cannot distinguish preferential amorphous attack from amorphisation-driven crystallinity decrease. The same weight-loss trajectory can arise from preferential attack of amorphous domains (which would increase crystallinity) or from non-preferential enzymatic attack (which would decrease it). Crystallinity measured concurrently with mass loss therefore provides independent information on the relative decay of the two states, improving the identifiability of state-specific kinetic parameters. Beyond identifiability, crystallinity carries direct design relevance: mechanical integrity, drug-release kinetics, and resorption timescale are all sensitive functions of the crystalline fraction, so predictive design requires a model that captures microstructural evolution, not just mass loss.
While existing enzymatic degradation models can reproduce mass-loss trends, they typically treat semicrystalline polymers as homogeneous substrates, thereby collapsing crystalline and amorphous domains into a single reactive state [
21,
23,
25]. Consequently, they do not explicitly capture state-selective enzymolysis, the dynamic evolution of crystallinity, or the coupled feedback between porosity development and transport-limited enzyme diffusion. A mechanistic framework that links these interacting processes remains largely absent from the literature.
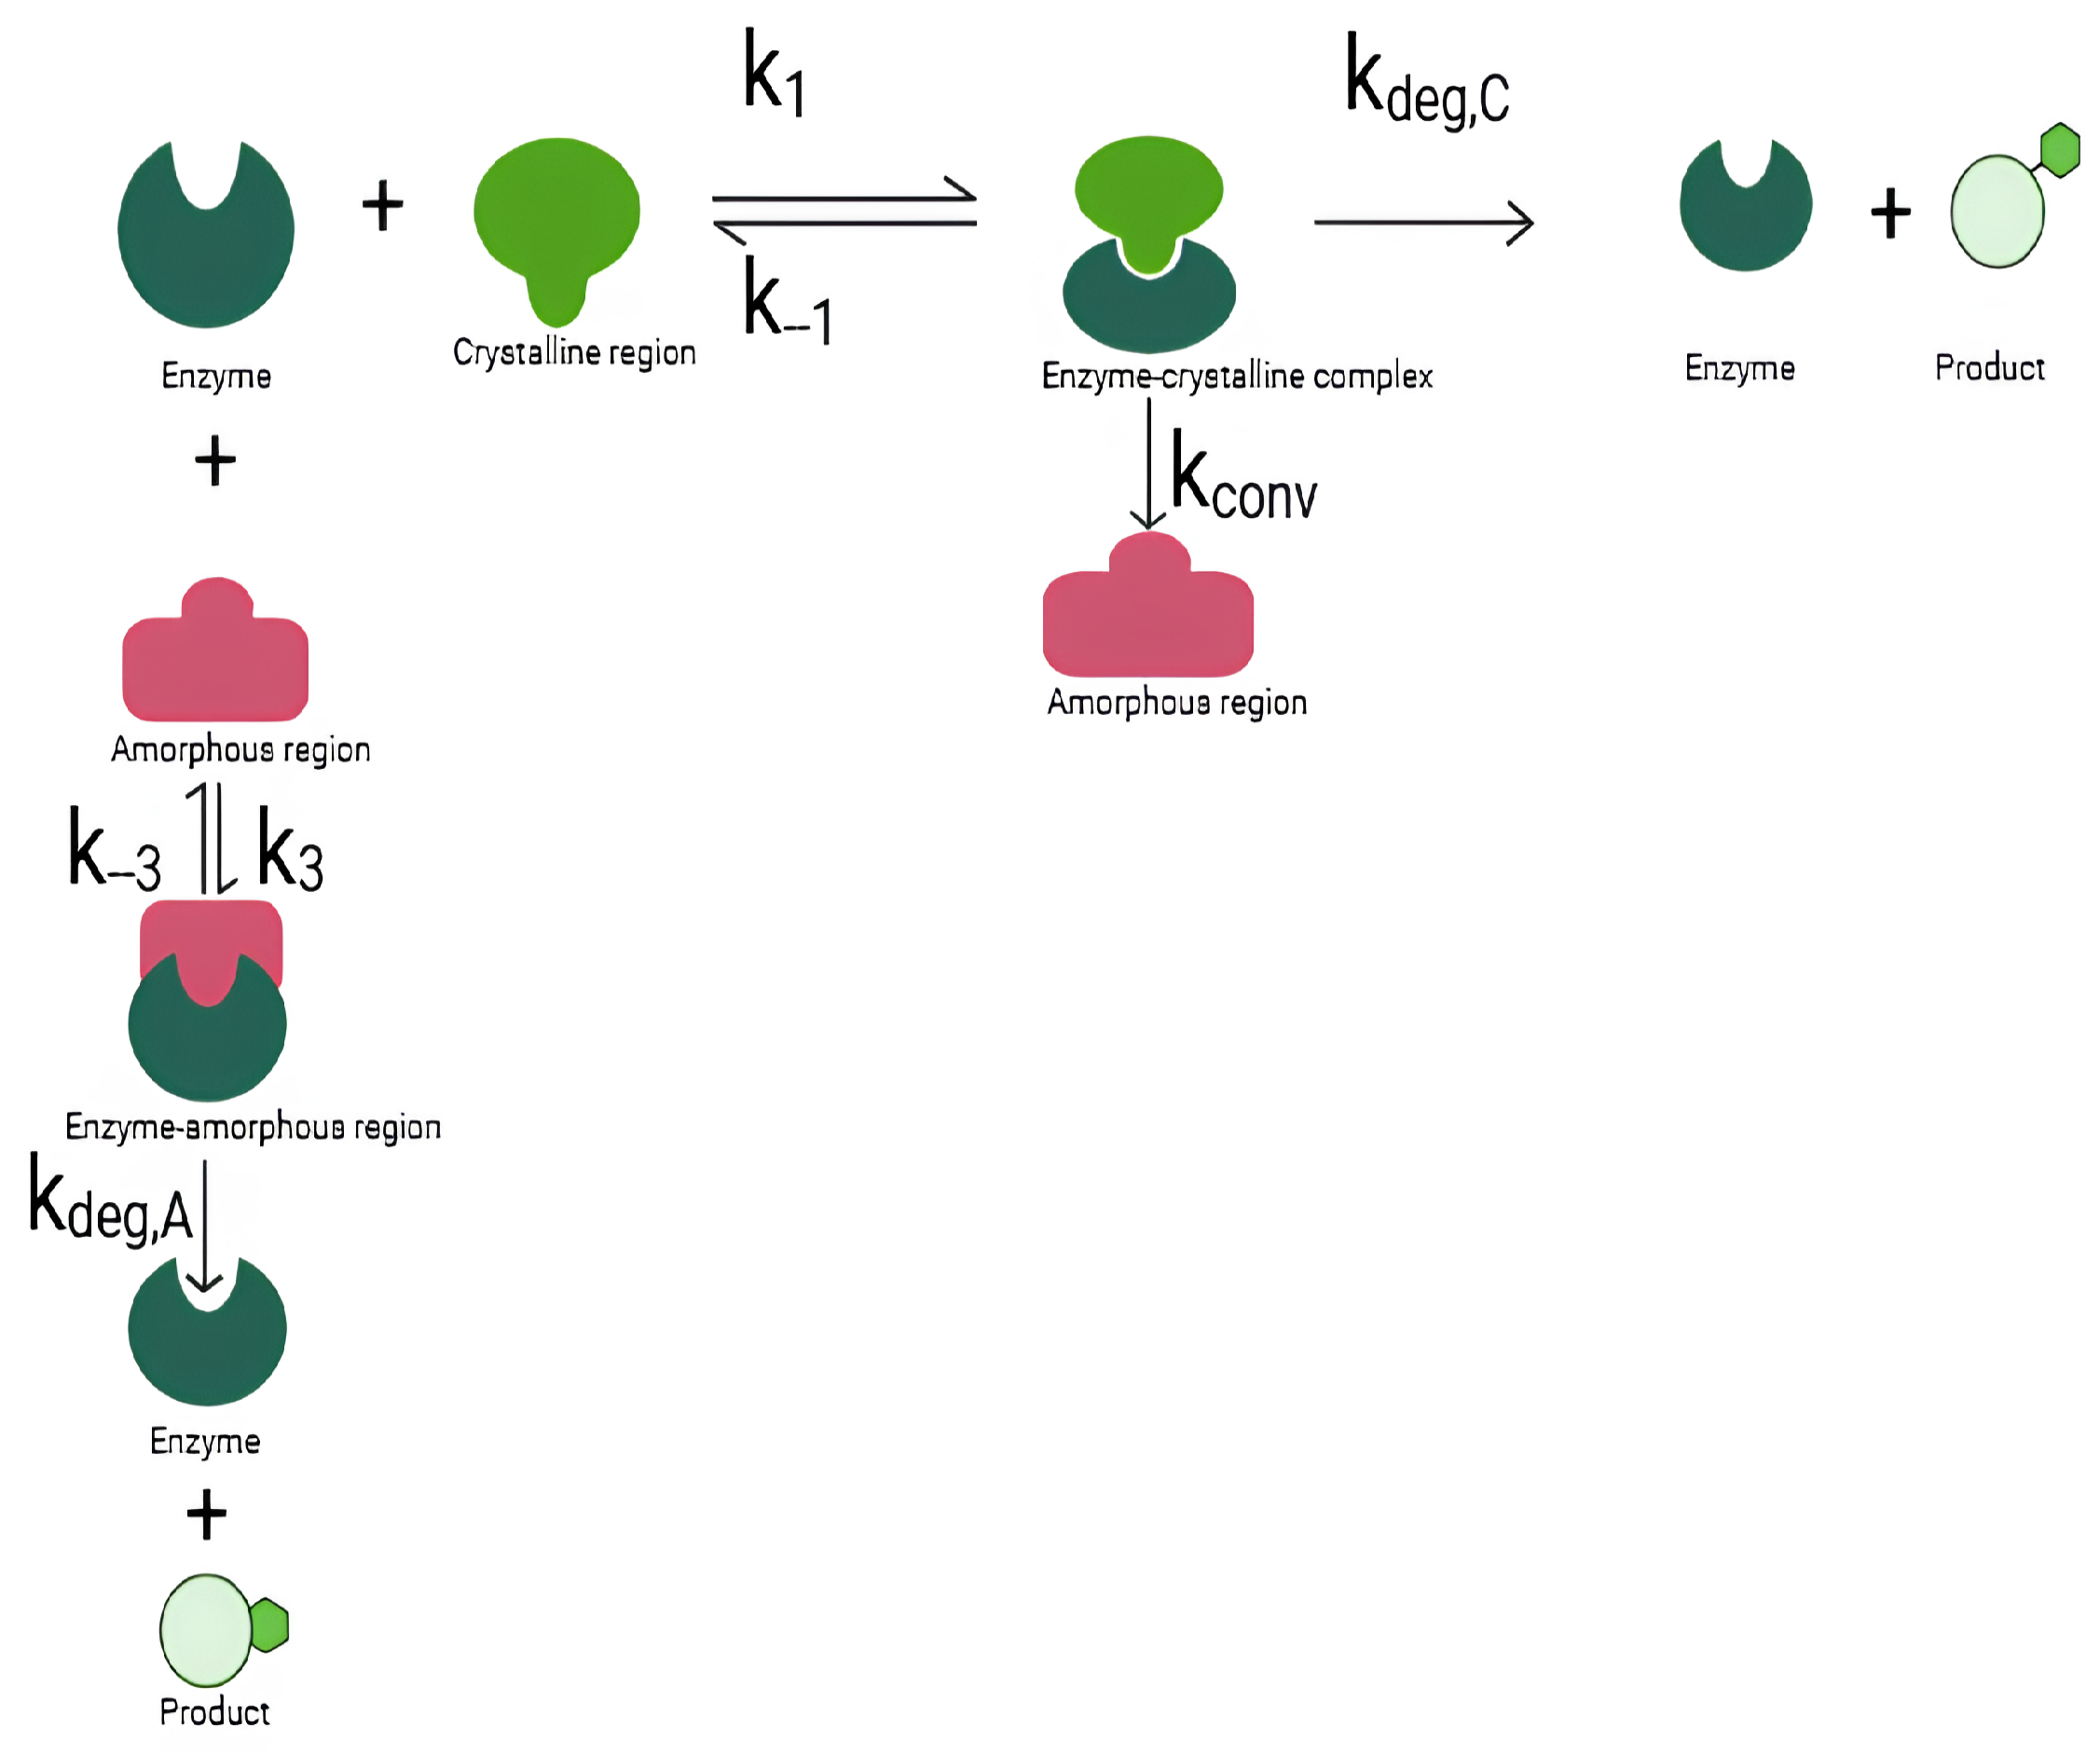
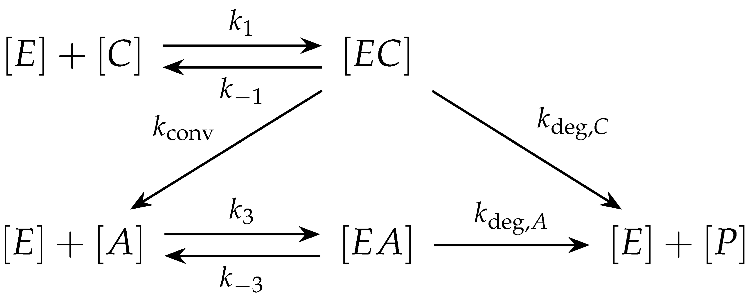
The present work develops a reaction–diffusion model in which crystalline and amorphous regions undergo distinct enzyme-binding and enzymolysis reactions, enzyme mobility is governed by porosity-dependent diffusivity, and crystallinity is not treated as a constant but evolves dynamically as a model variable. This formulation enables simultaneous prediction of mass loss and crystallinity trajectories.
Our main contributions are:
A two-state reaction–diffusion PDE model suitable for modelling thin films of bioresorbable semicrystalline polymers. The model captures the different rates of enzyme attack on crystalline and amorphous regions which have been observed in vitro.
An explicit amorphisation pathway that captures the effect observed in certain polymer–enzyme systems, where the enzyme disrupts the order of crystalline regions prior to degradation.
A porosity-dependent effective diffusivity function coupling microstructural evolution to enzyme transport.
Simultaneous calibration to weight-loss and crystallinity data, improving identification of state-specific kinetic parameters.
Global, time-dependent parameter sensitivity analysis quantifying which kinetic steps govern the model dynamics and when.
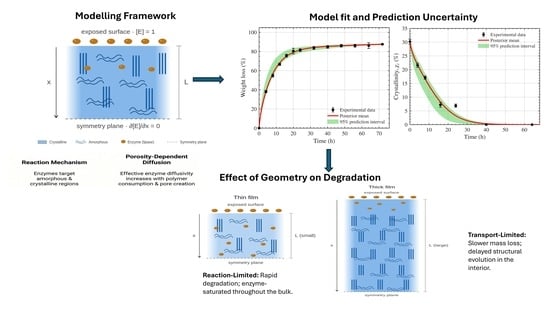
The model is exploited to allow for the prediction of mass and crystallinity loss in varying thicknesses of films, based on the parameters identified from a single experiment. Although the effective diffusion constant is uncertain, the model clearly captures the transition from thin films, which are dominated by the enzymatic degradation reaction (and show no difference in mass or crystallinity loss rates below a certain threshold thickness), and thicker films where transport of the enzyme into the bulk plays a greater role, resulting in slower mass and crystallinity loss.
The remainder of the manuscript is organised as follows:
Section 2 presents the model development, while
Section 3 reports a case study of the fitting of the enzymatic degradation model to an in vitro study of PCL degraded by lipase.
Section 4 outlines the model sensitivity analysis,
Section 5 discusses the findings, and
Section 6 concludes the paper.
3. Case Study of Enzymatic Degradation Model Fitting
The enzymatic degradation model developed in this study (Equations (
2)–(
7)) was parameterised using experimental data reported by Shi et al. [
16], which characterises the degradation kinetics of poly(
-caprolactone) (PCL) films under lipase-driven conditions. In their protocol, PCL films (
mm) were incubated with
Candida antarctica lipase (45 U/mL) in potassium phosphate buffer (0.1 M, pH 7.2) at 45 °C, and both weight loss and crystallinity were monitored at successive time points over 72 h. This dataset is selected for its rich data on mass loss and crystallinity evolution over the degradation timescale and serves as a model for enzymes which act to disrupt the order of crystalline lamellae, inducing amorphisation. The degradation timescale is accelerated relative to in vivo conditions, which is a common approach for initial studies into anticipated in vivo behaviour [
32].
Candida antarctica lipase is a well-characterised fungal lipase widely employed in biodegradation studies of aliphatic polyesters [
16,
17]. It acts via random chain scission of ester bonds and has been shown to degrade both the amorphous and crystalline domains of PCL, making it a suitable model enzyme for studying coupled mass loss and crystallinity evolution [
16,
19]. Both pH and temperature are held constant throughout the degradation period by the buffered, temperature-controlled setup, so they act as experimental controls rather than dynamic variables in the model. In the dataset of Shi et al. [
16], differential scanning calorimetry (DSC) measurements revealed a decrease in crystallinity throughout the degradation period, indicating that enzymatic attack was not confined to the amorphous domains but extended to the crystalline lamellae. Both the weight-loss profile and the crystallinity data were used simultaneously to calibrate the model.
3.1. Parameter Estimation
The goal of the optimisation was to estimate the parameter vector
such that the model output simultaneously best fits both the experimental weight-loss measurements
and the differential scanning calorimetry (DSC) crystallinity measurements
, where
n and
m denote the number of observations in the weight-loss and crystallinity datasets, respectively. The problem was then formulated as a weighted, bound-constrained nonlinear least-squares minimisation:
where
n and
m are the number of weight-loss and crystallinity measurements, respectively, and
and
are the model-predicted weight loss and crystallinity at times
and
, obtained by numerical solution of Equations (
2)–(
7). The quantities
and
denote the corresponding measurement standard deviations, taken from the experimental uncertainties reported by Shi et al. [
16]. Dividing each residual by its standard deviation places both datasets on a common dimensionless scale, ensuring that the weight-loss and crystallinity data contribute comparably to the objective. The feasible domain is defined as
, with individual parameter bounds given by (
15), which was obtained by trial and error.
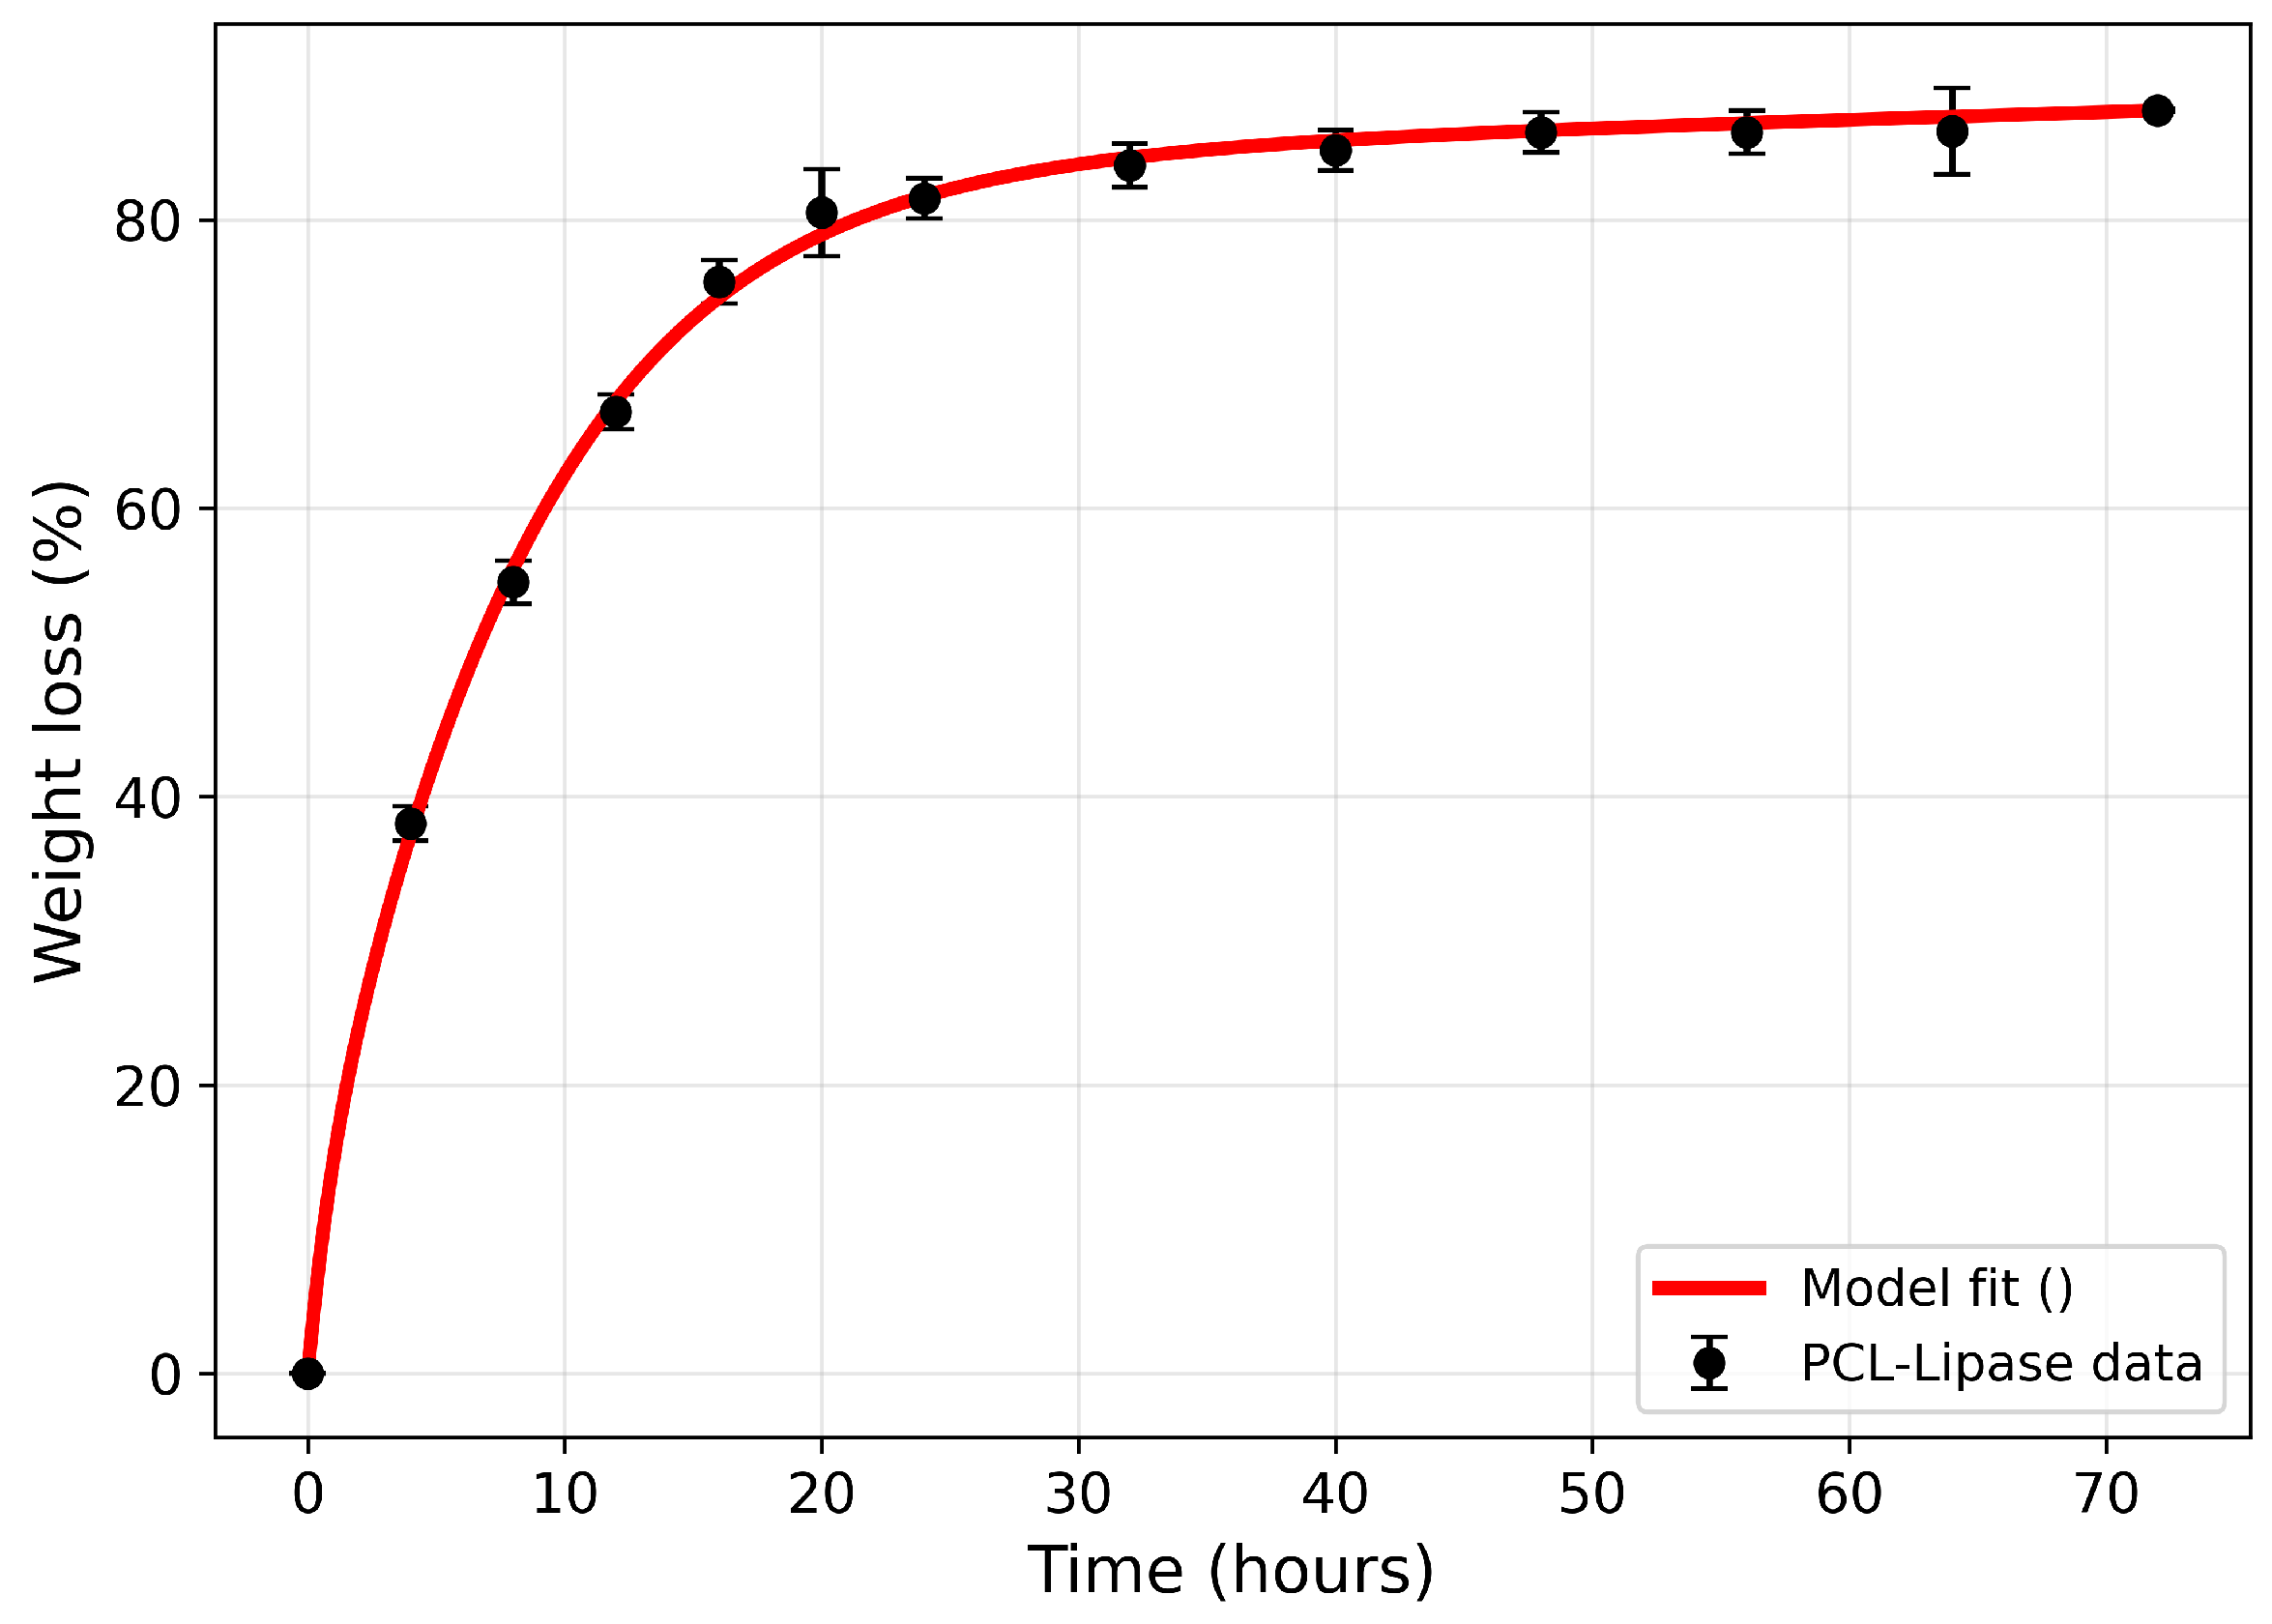
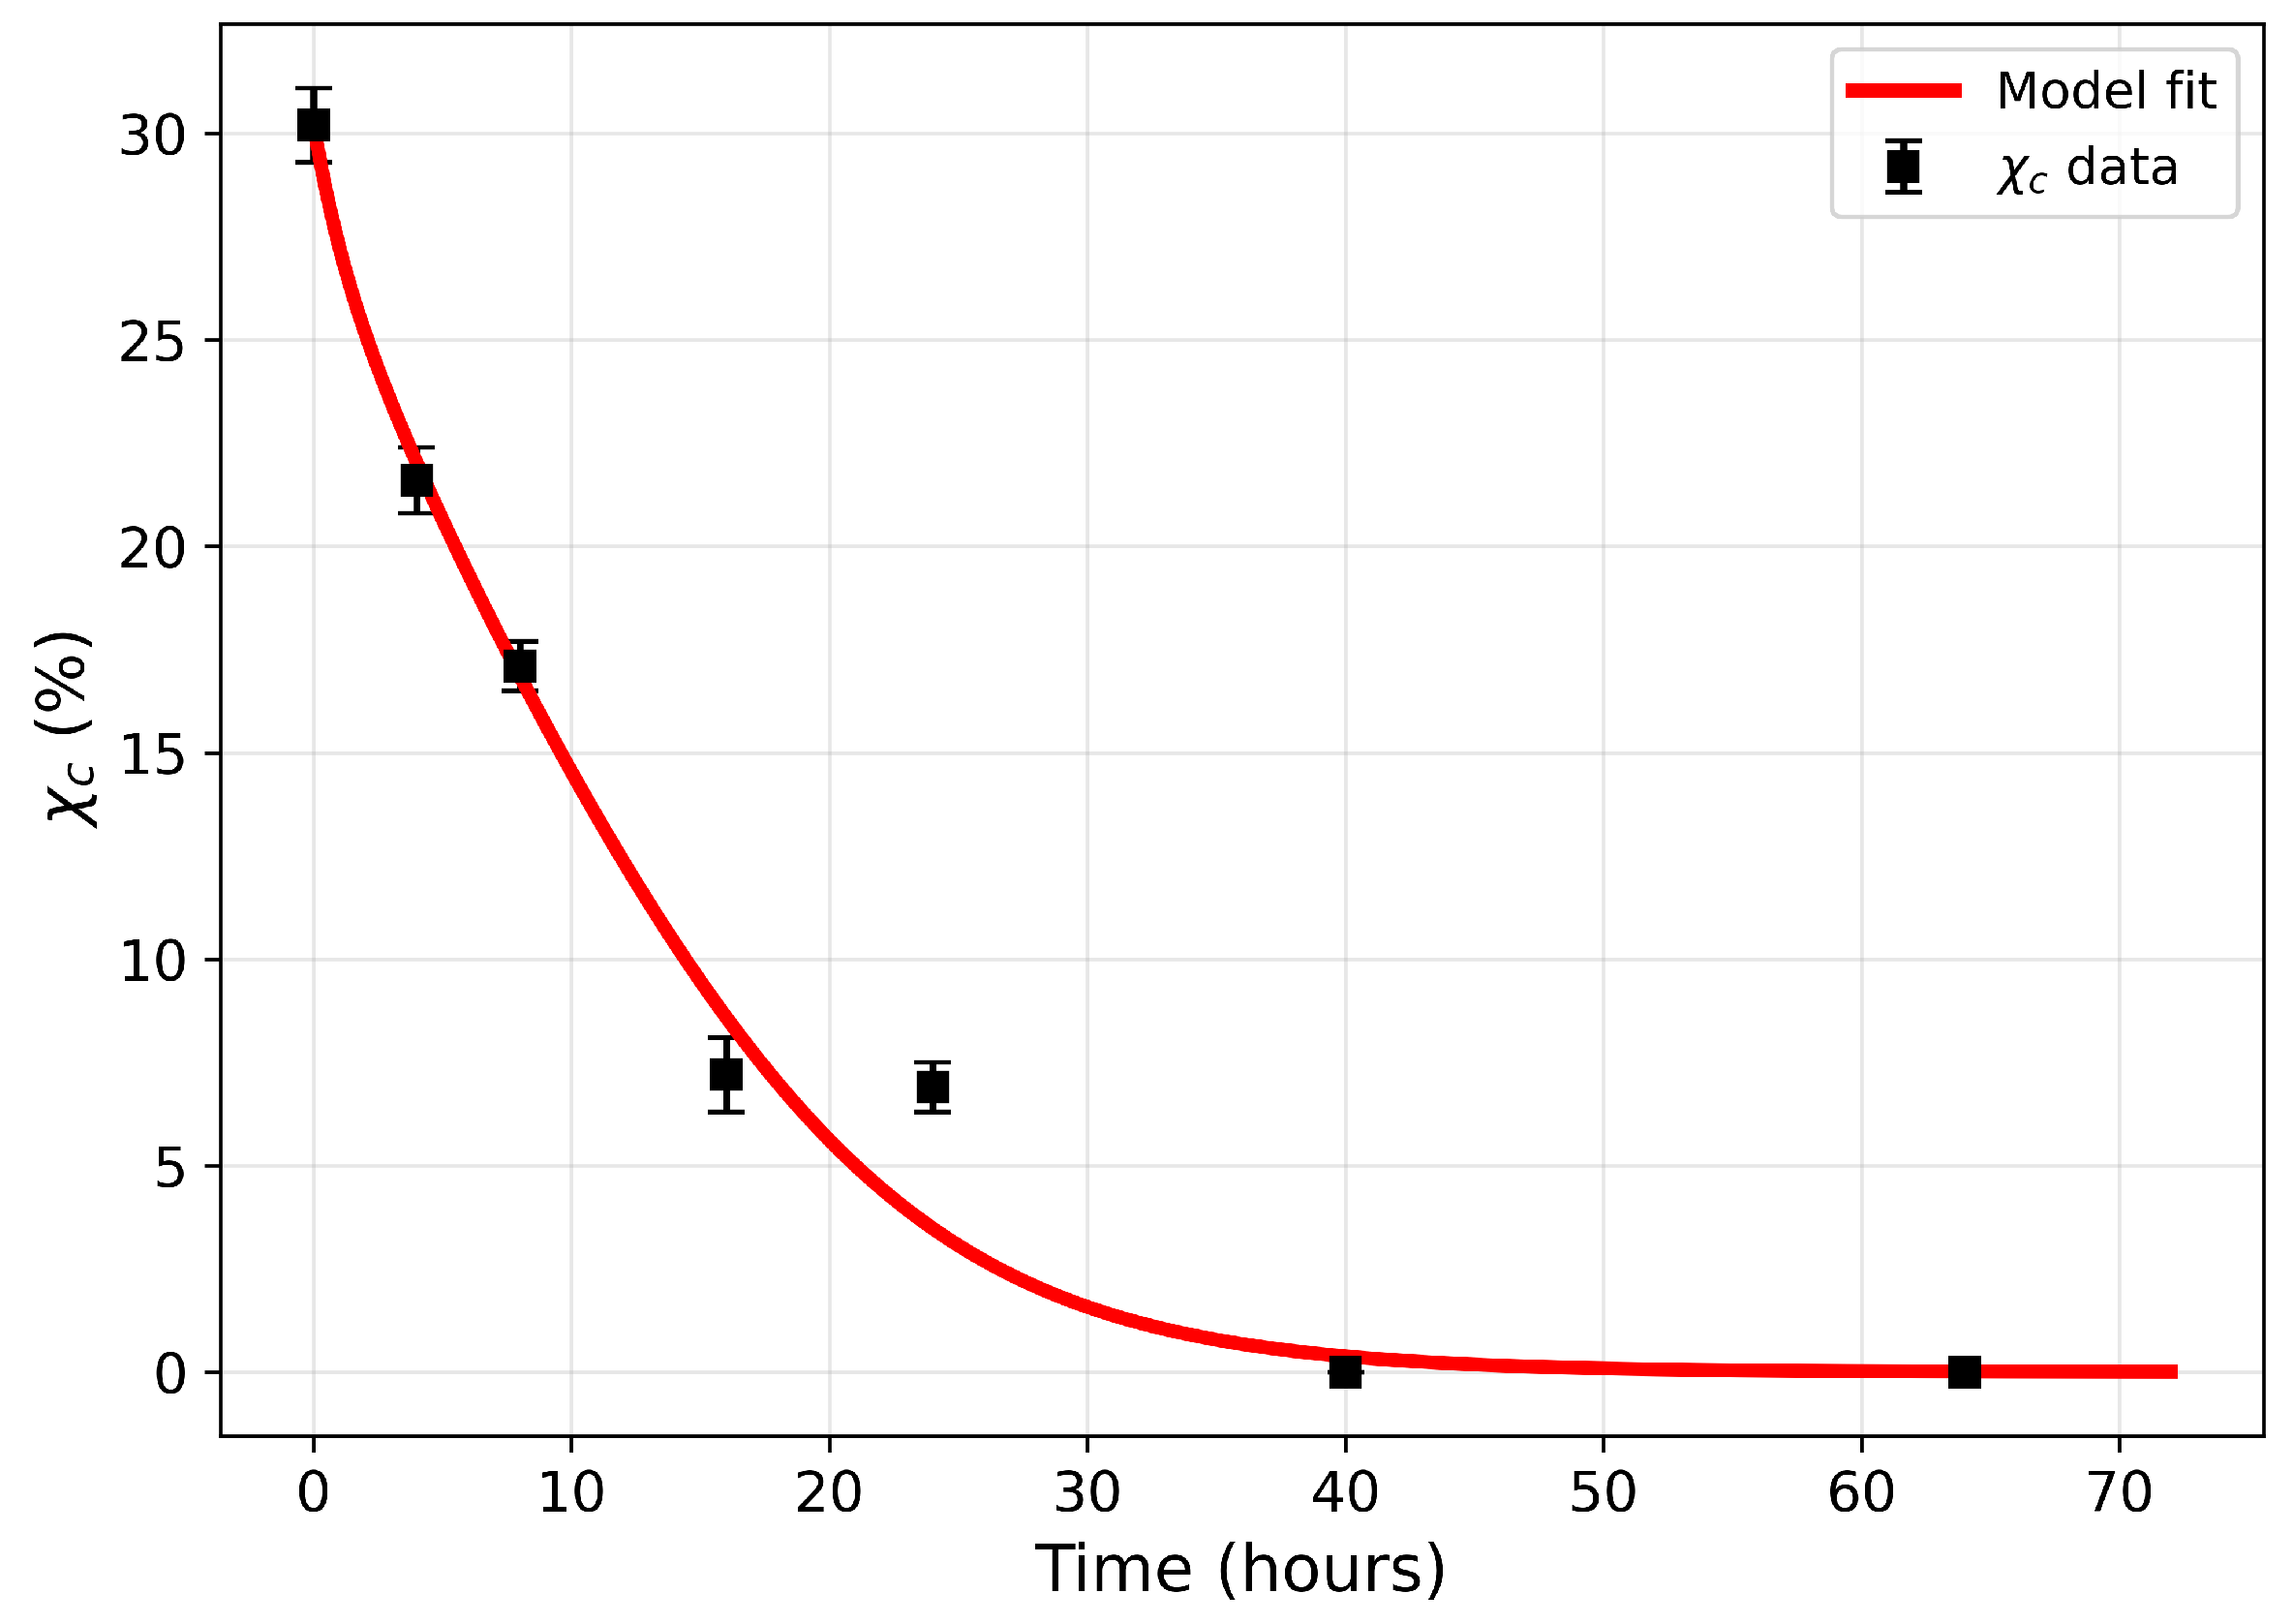
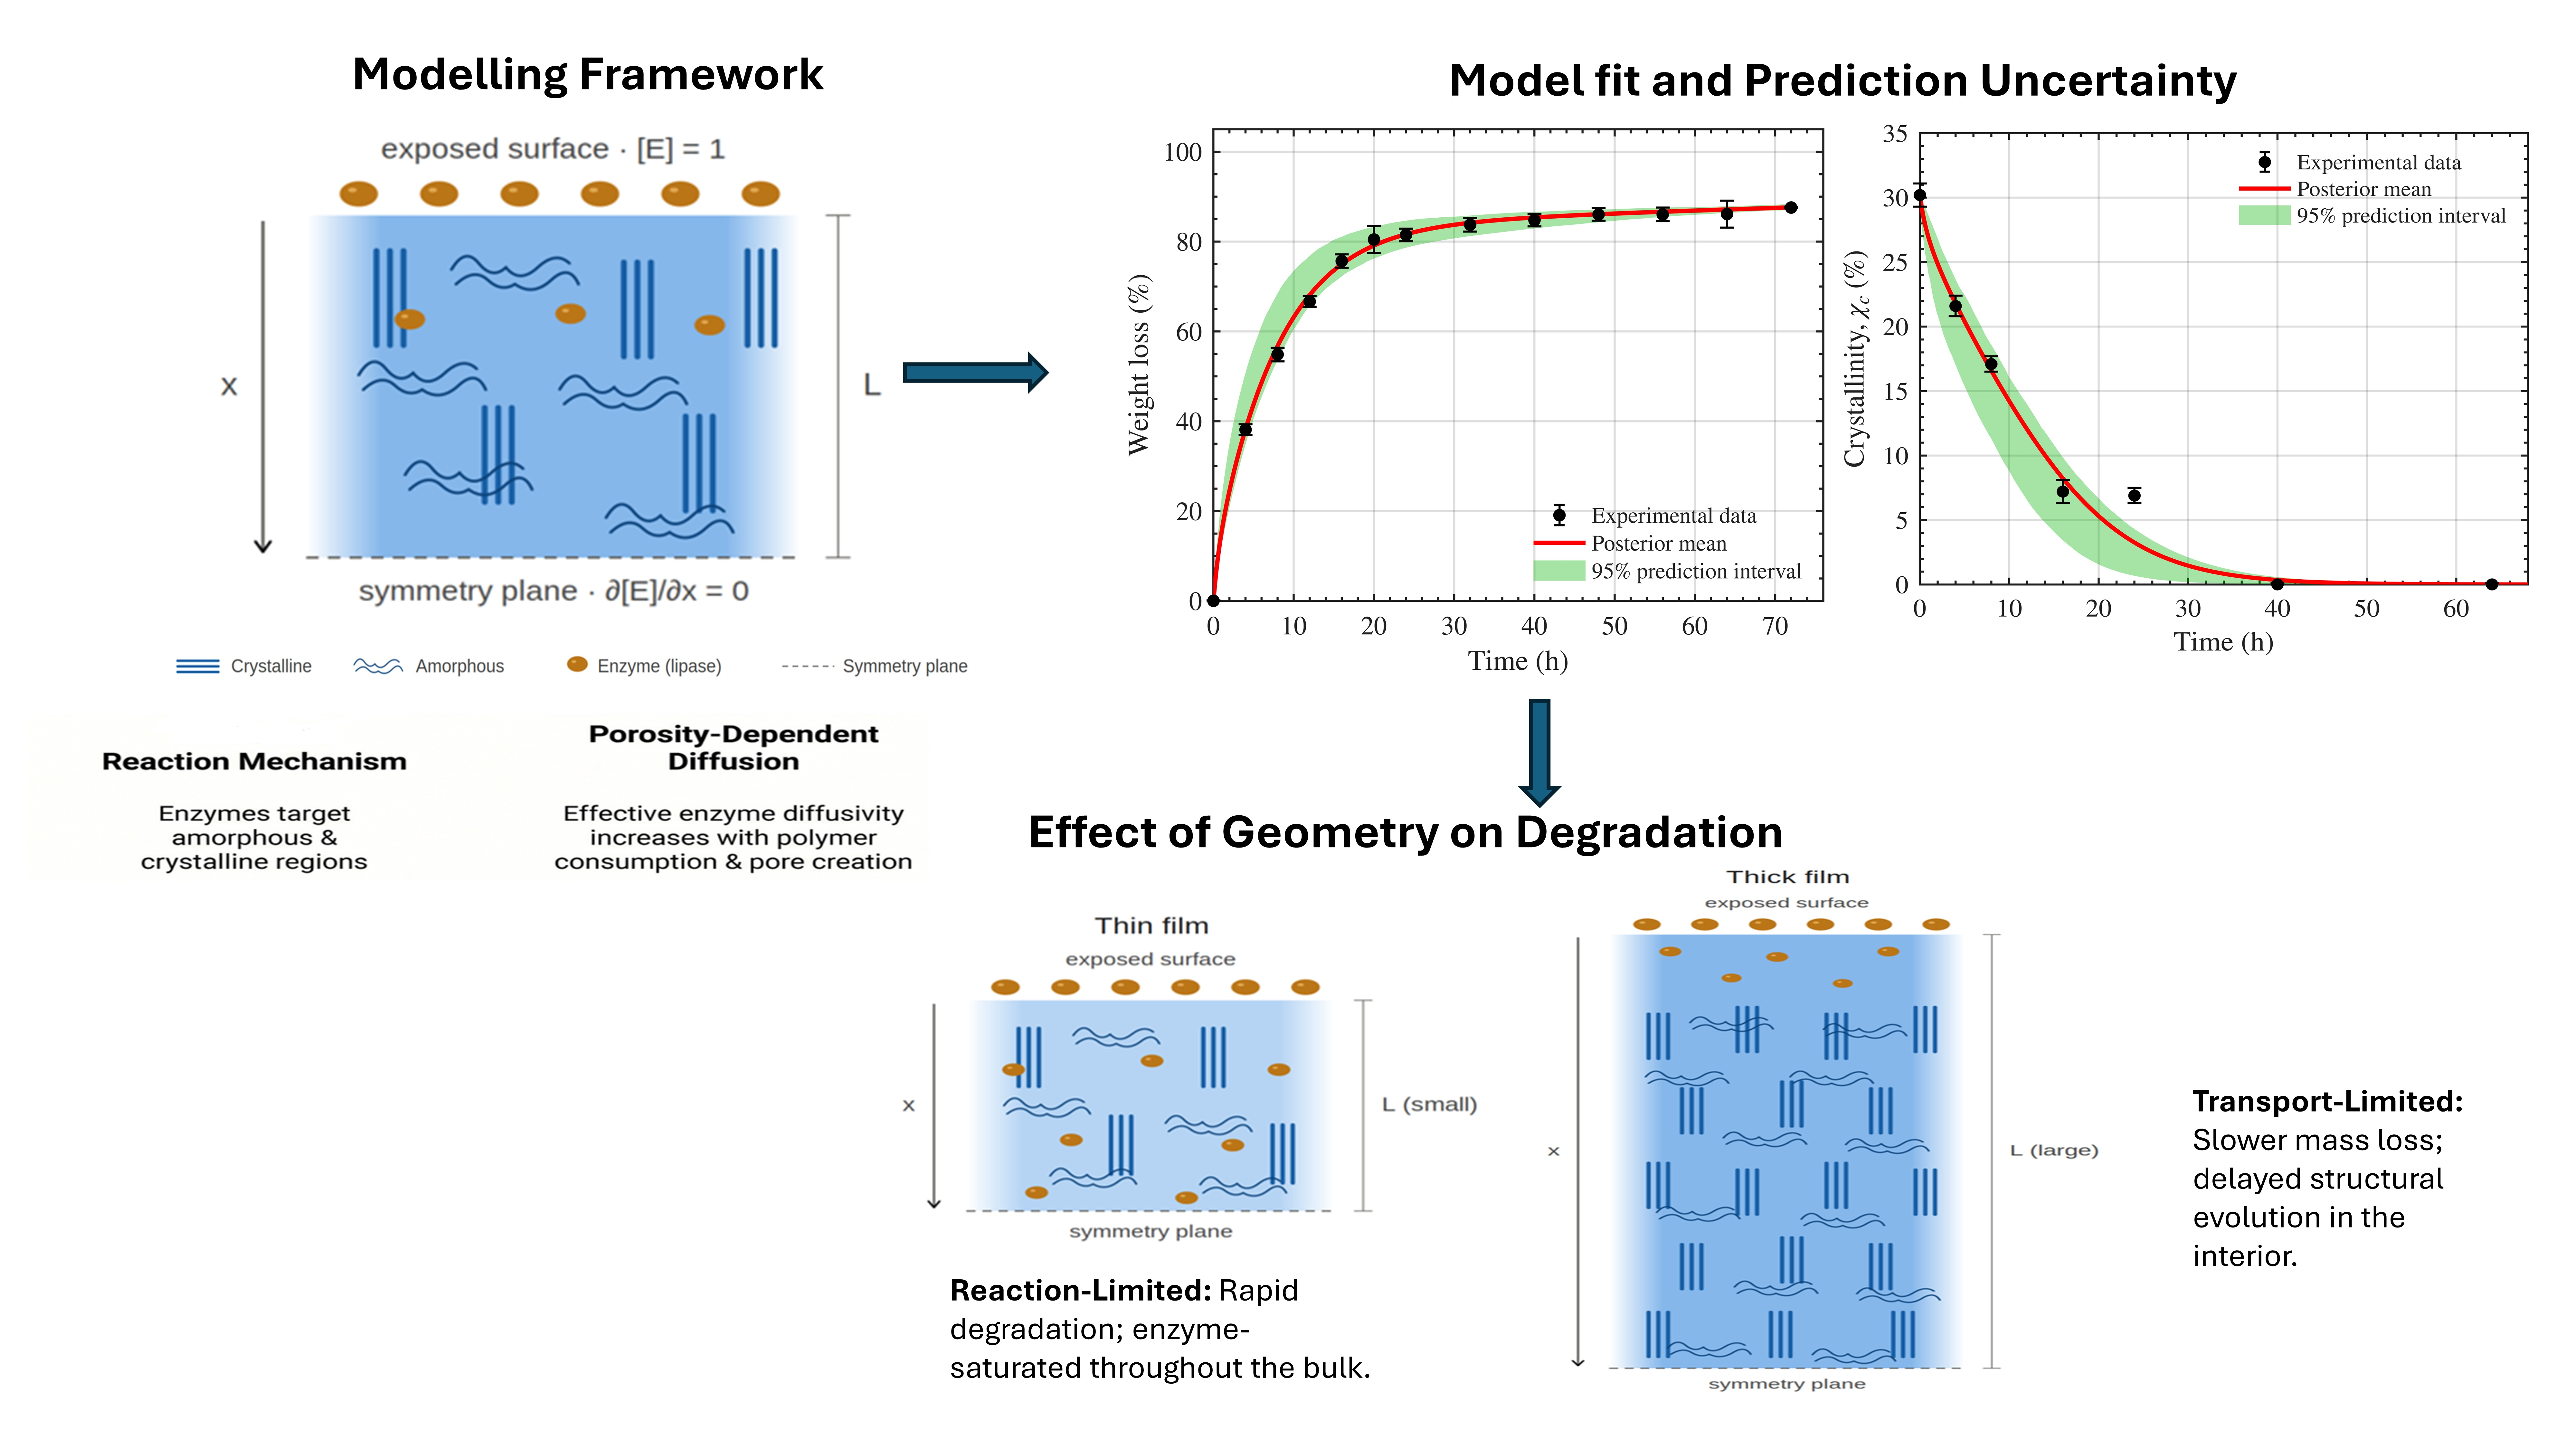
The joint fit to the weight-loss and crystallinity datasets is shown in
Figure 3 and
Figure 4, and the corresponding parameter estimates are reported in
Table 1. The model fits the weight-loss data with
and the crystallinity data (
) with
.
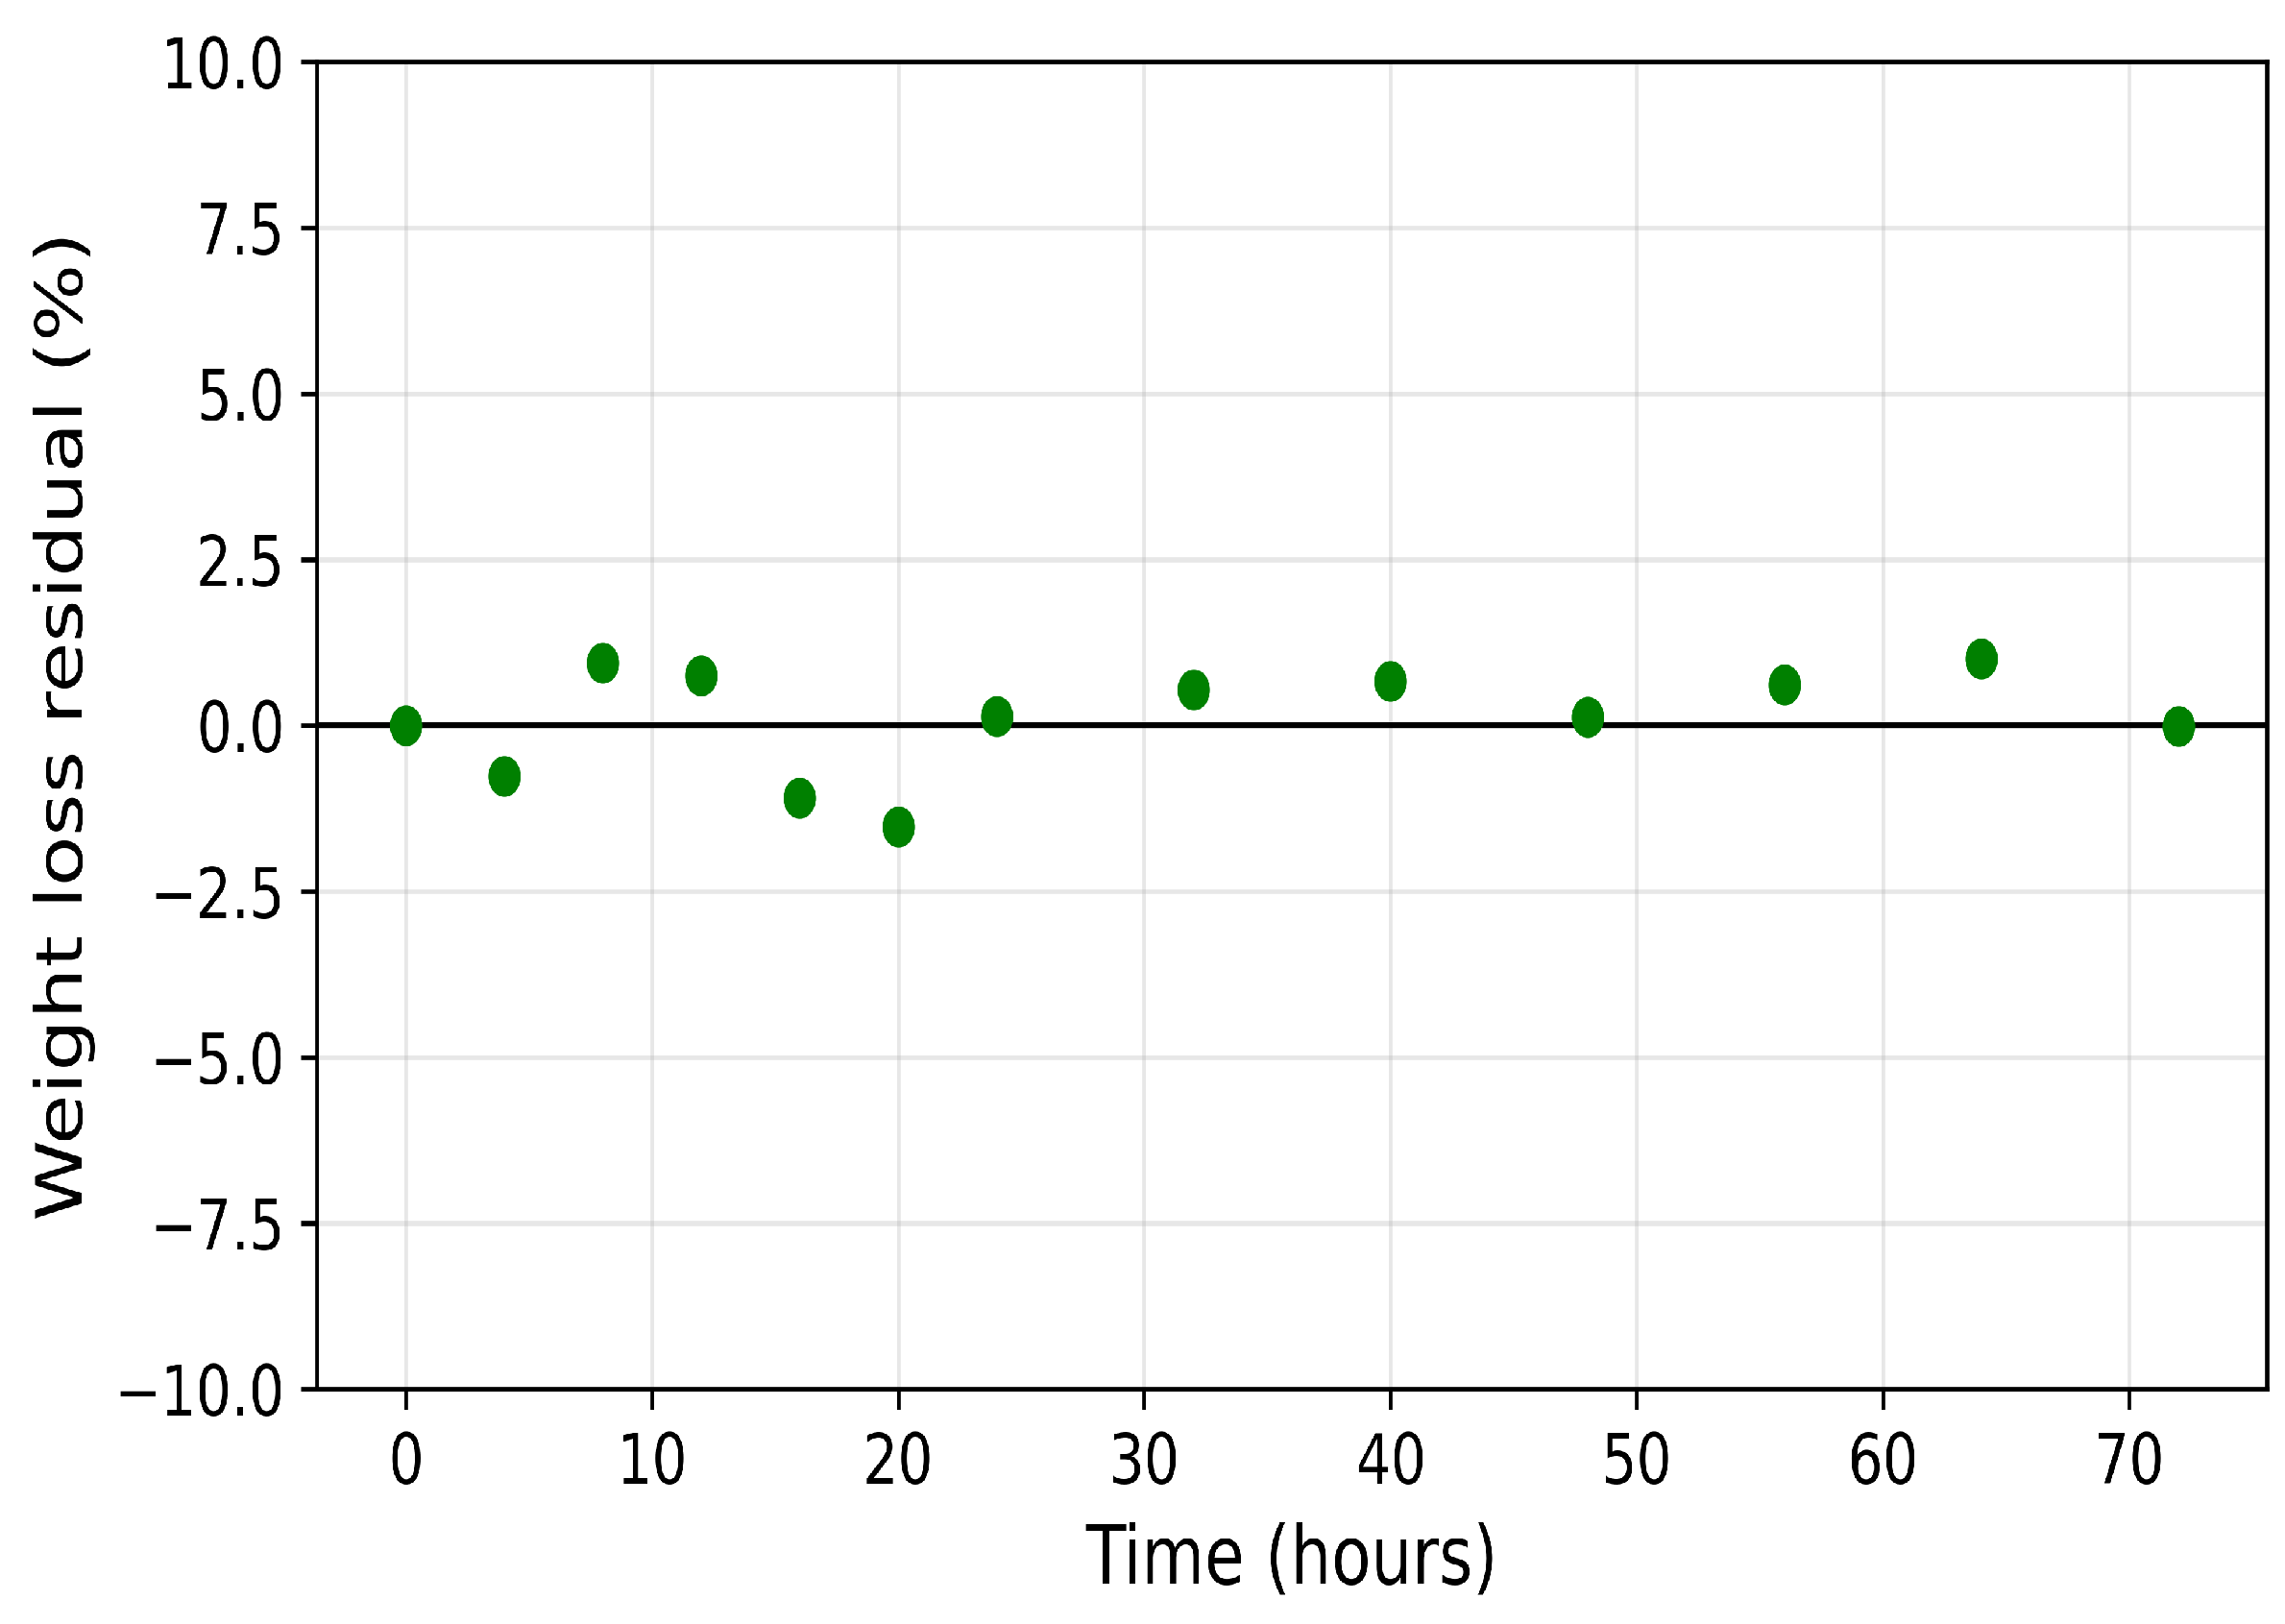
Figure 5 and
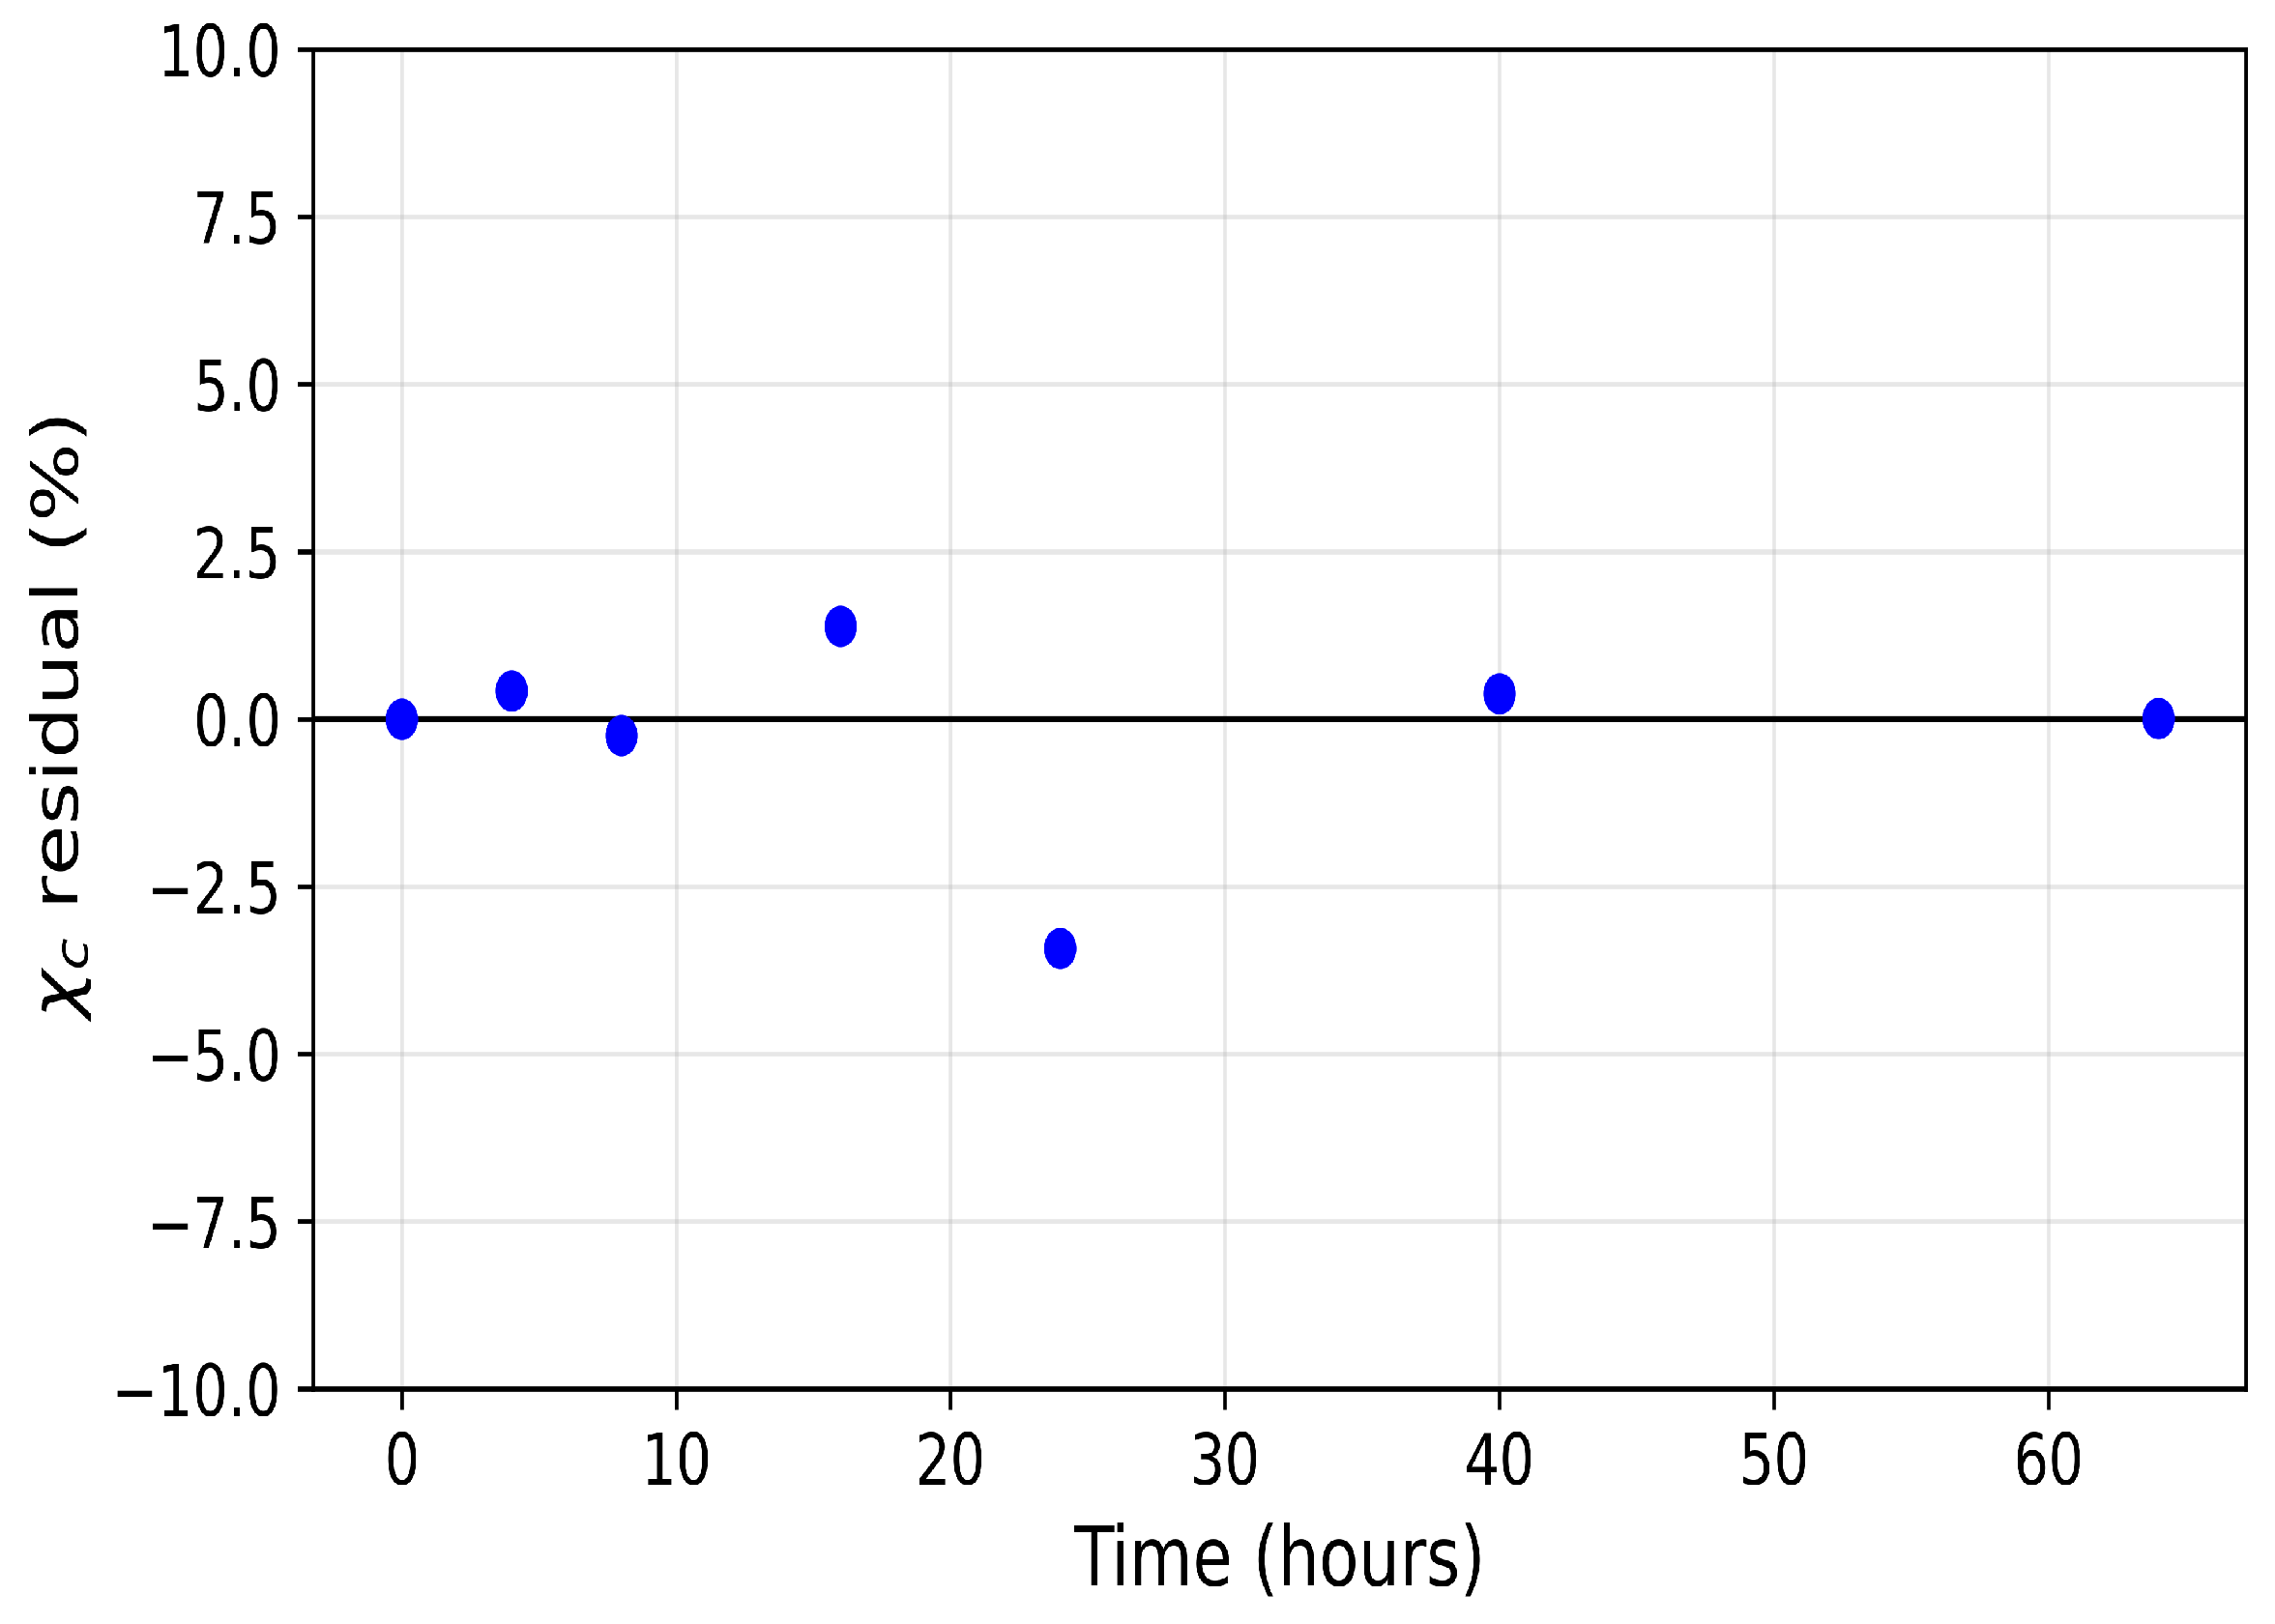
Figure 6 show the model residuals, defined at each observation time
as
, where
denotes the model prediction and
the corresponding experimental measurement. For the weight-loss data (
Figure 5), residuals are small and broadly centred near zero, with most falling within
. The largest deviation is approximately
at
. For the crystallinity data (
Figure 6), the residual pattern is more informative. Residuals are near zero at early times (
,
), increase to approximately
at
, and exhibit a maximum magnitude of approximately
at
. It is unclear why the observed crystalline content shows no statistically significant change between the 16 and 24 h time points before further crystallinity loss resumes at later stages. One possible explanation is that the remaining crystalline regions are more ordered and less accessible than those attacked initially, temporarily slowing the amorphisation process. Alternatively, degradation-induced recrystallisation of chain segments may partially offset ongoing crystallinity loss, as recrystallisation of short chains formed during polymer degradation is well documented in the literature [
31,
33,
34].
Further studies are required to determine whether this behaviour is reproducible and to identify the underlying mechanisms. Regardless of the cause, the effect appears temporary, and the model yields small residuals across the full time domain. The smaller residuals at later times ( and ) reflect the approach to a plateau and slower system dynamics, rather than a restriction of model applicability.
3.2. Parameter Uncertainty Analysis
Bayesian parameter inference was used to quantify uncertainty in the estimated parameter vector
. The prior distribution
was specified independently for each parameter as a log-uniform distribution over the feasible parameter domain
, using the same bounds (
15) as in the least-squares fitting described in
Section 3.1. This prior was combined with the likelihood function
to define the posterior distribution
according to Bayes’ theorem, as given in Equation (
16). Standard deviations for the Gaussian measurement errors were taken from the experimental error bars reported by Shi et al. [
16], and both weight-loss and crystallinity datasets were incorporated jointly in the likelihood, as described in Equation (
17). MCMC sampling was applied using the Differential Evolution Markov Chain with snooker update (DE-MCz) algorithm [
35], which employs 40 parallel chains initialised from the least-squares estimate. A total of 500 iterations were run with a thinning factor of 5, yielding 4000 posterior draws from which 95% credible intervals for each parameter were derived. Following the framework of [
25,
35], the posterior distribution is
where
denotes the likelihood of the observed data given parameters
, and
is the marginal likelihood that normalises the posterior. The joint likelihood over both observables is
where
and
are the model-predicted weight loss and crystallinity at times
and
respectively, obtained by numerical solution of Equations (
2)–(
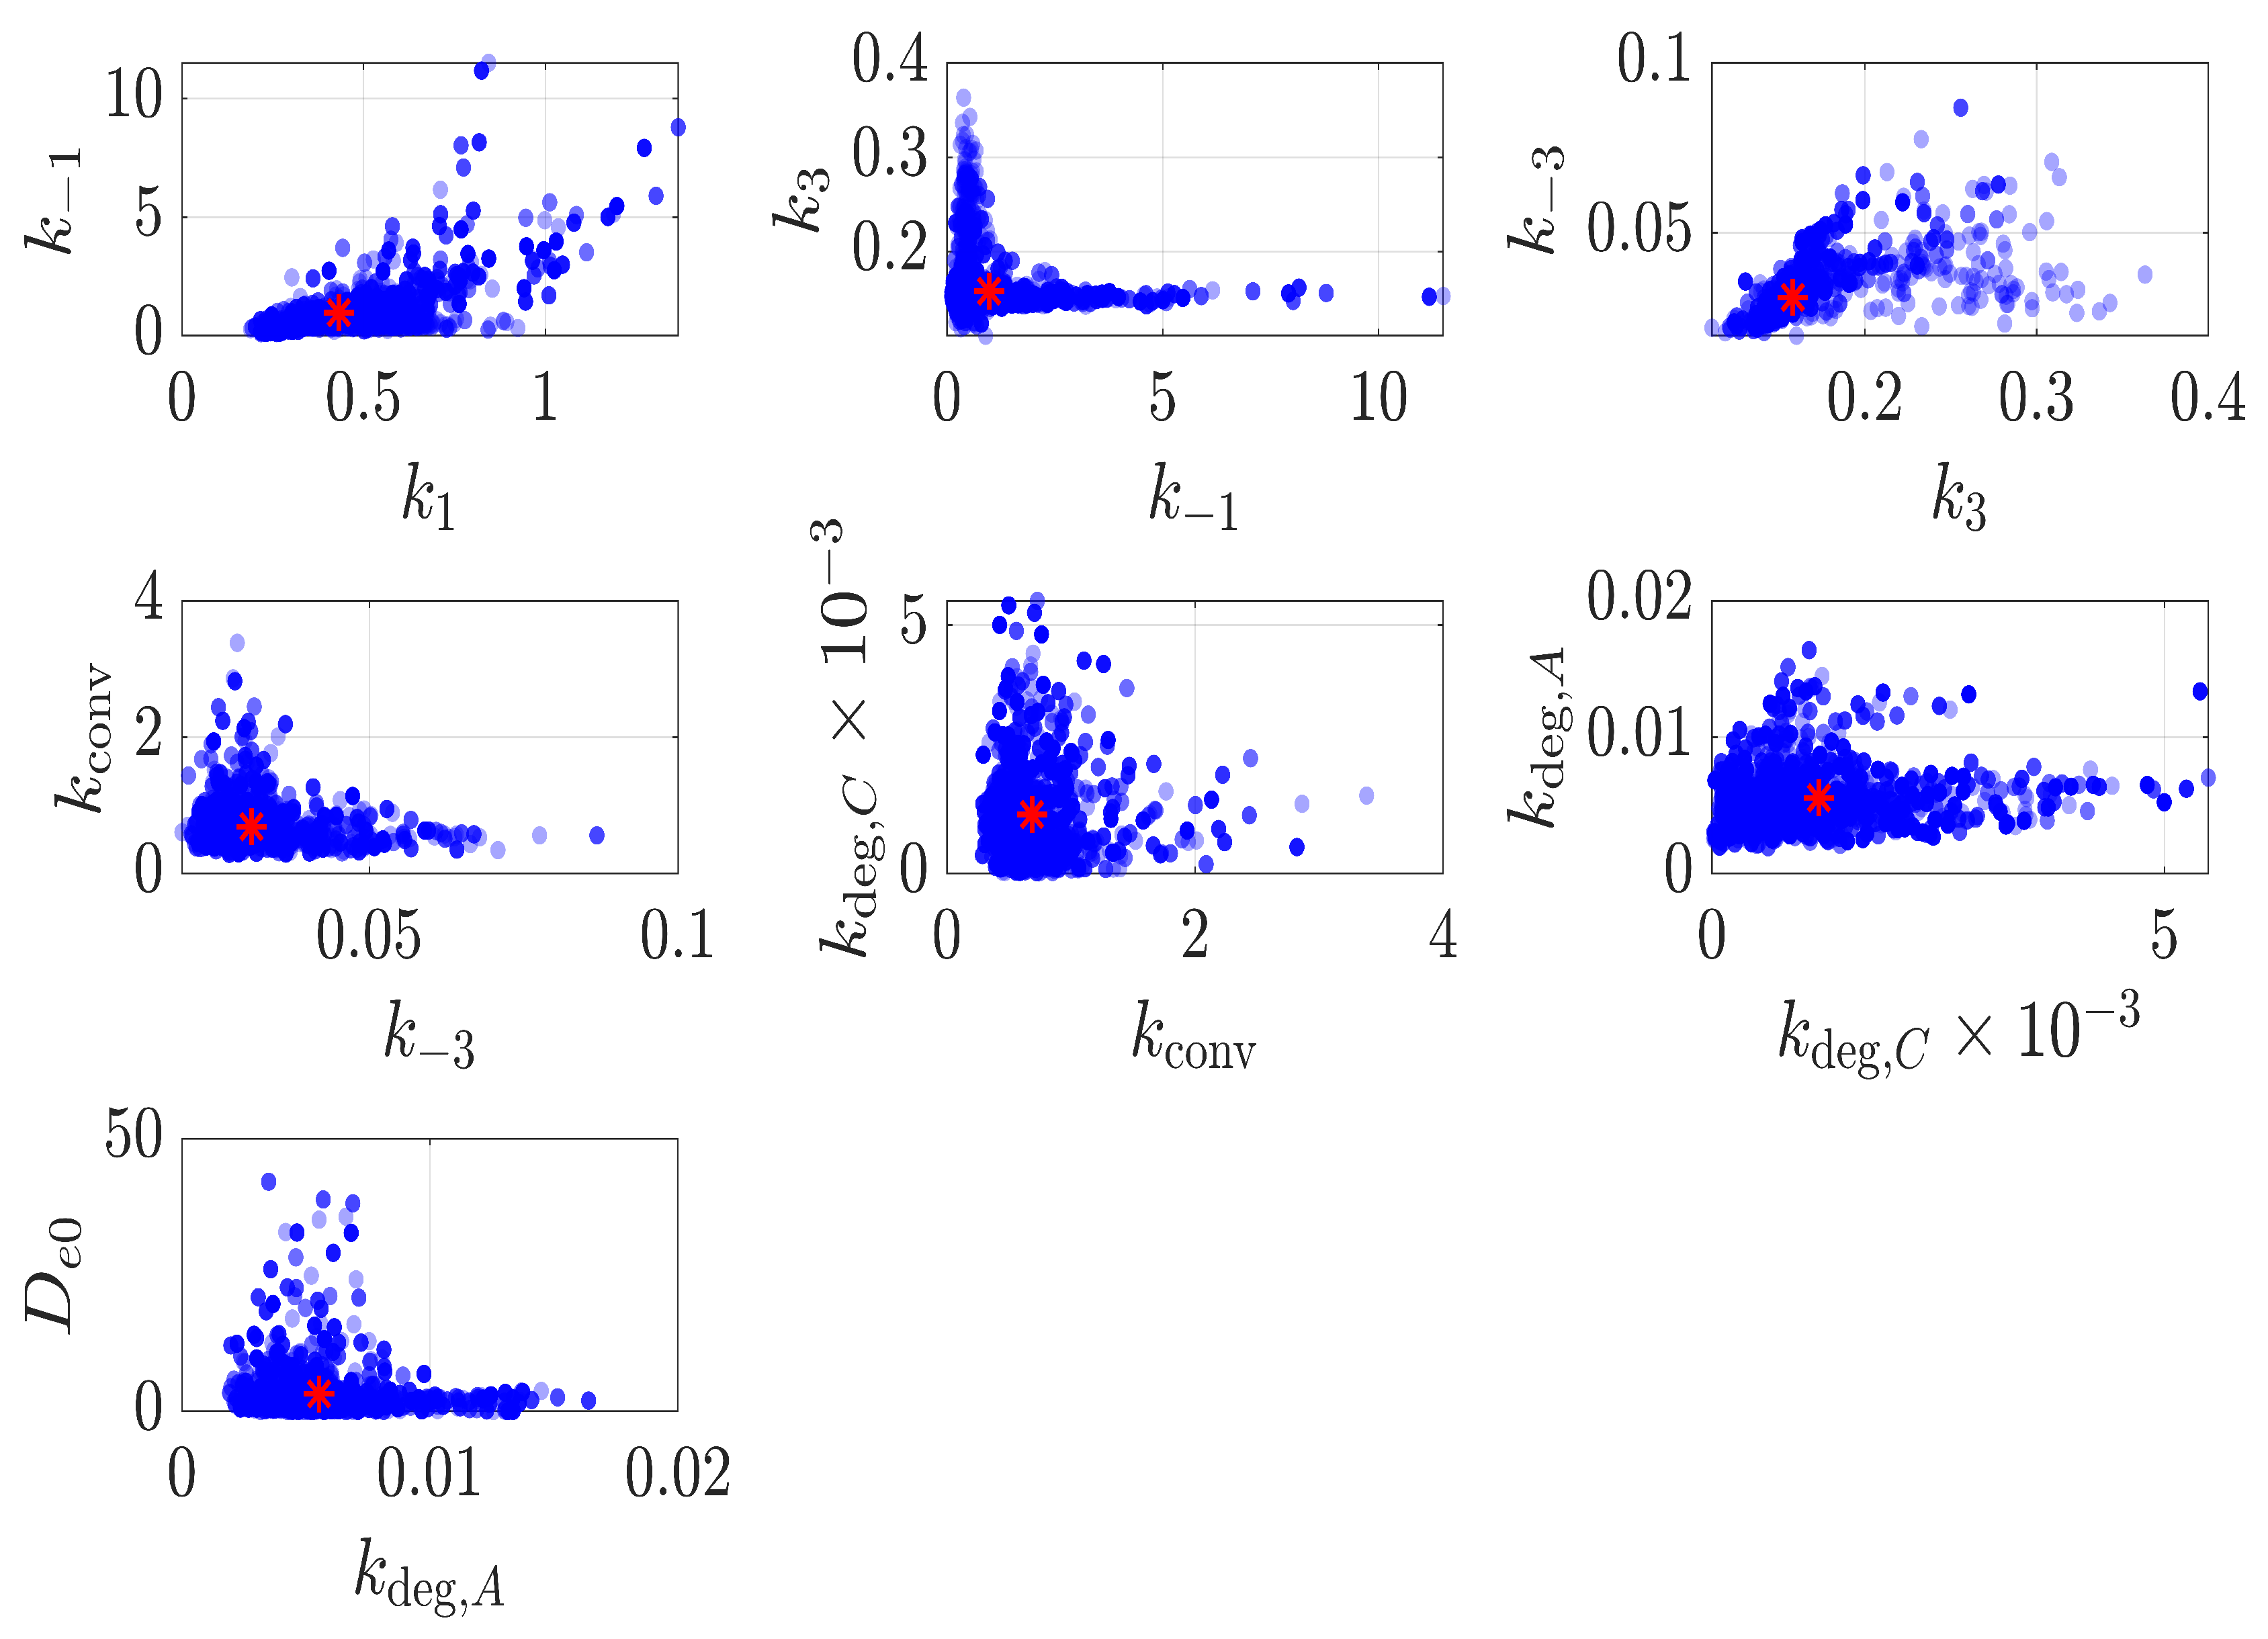
7). The posterior parameter regions are shown in
Figure 7 as pairwise plots (
vs.
), with red asterisks marking the posterior means. These pairwise clouds reveal clear differences in how tightly each parameter is constrained by the Shi et al. [
16] data.
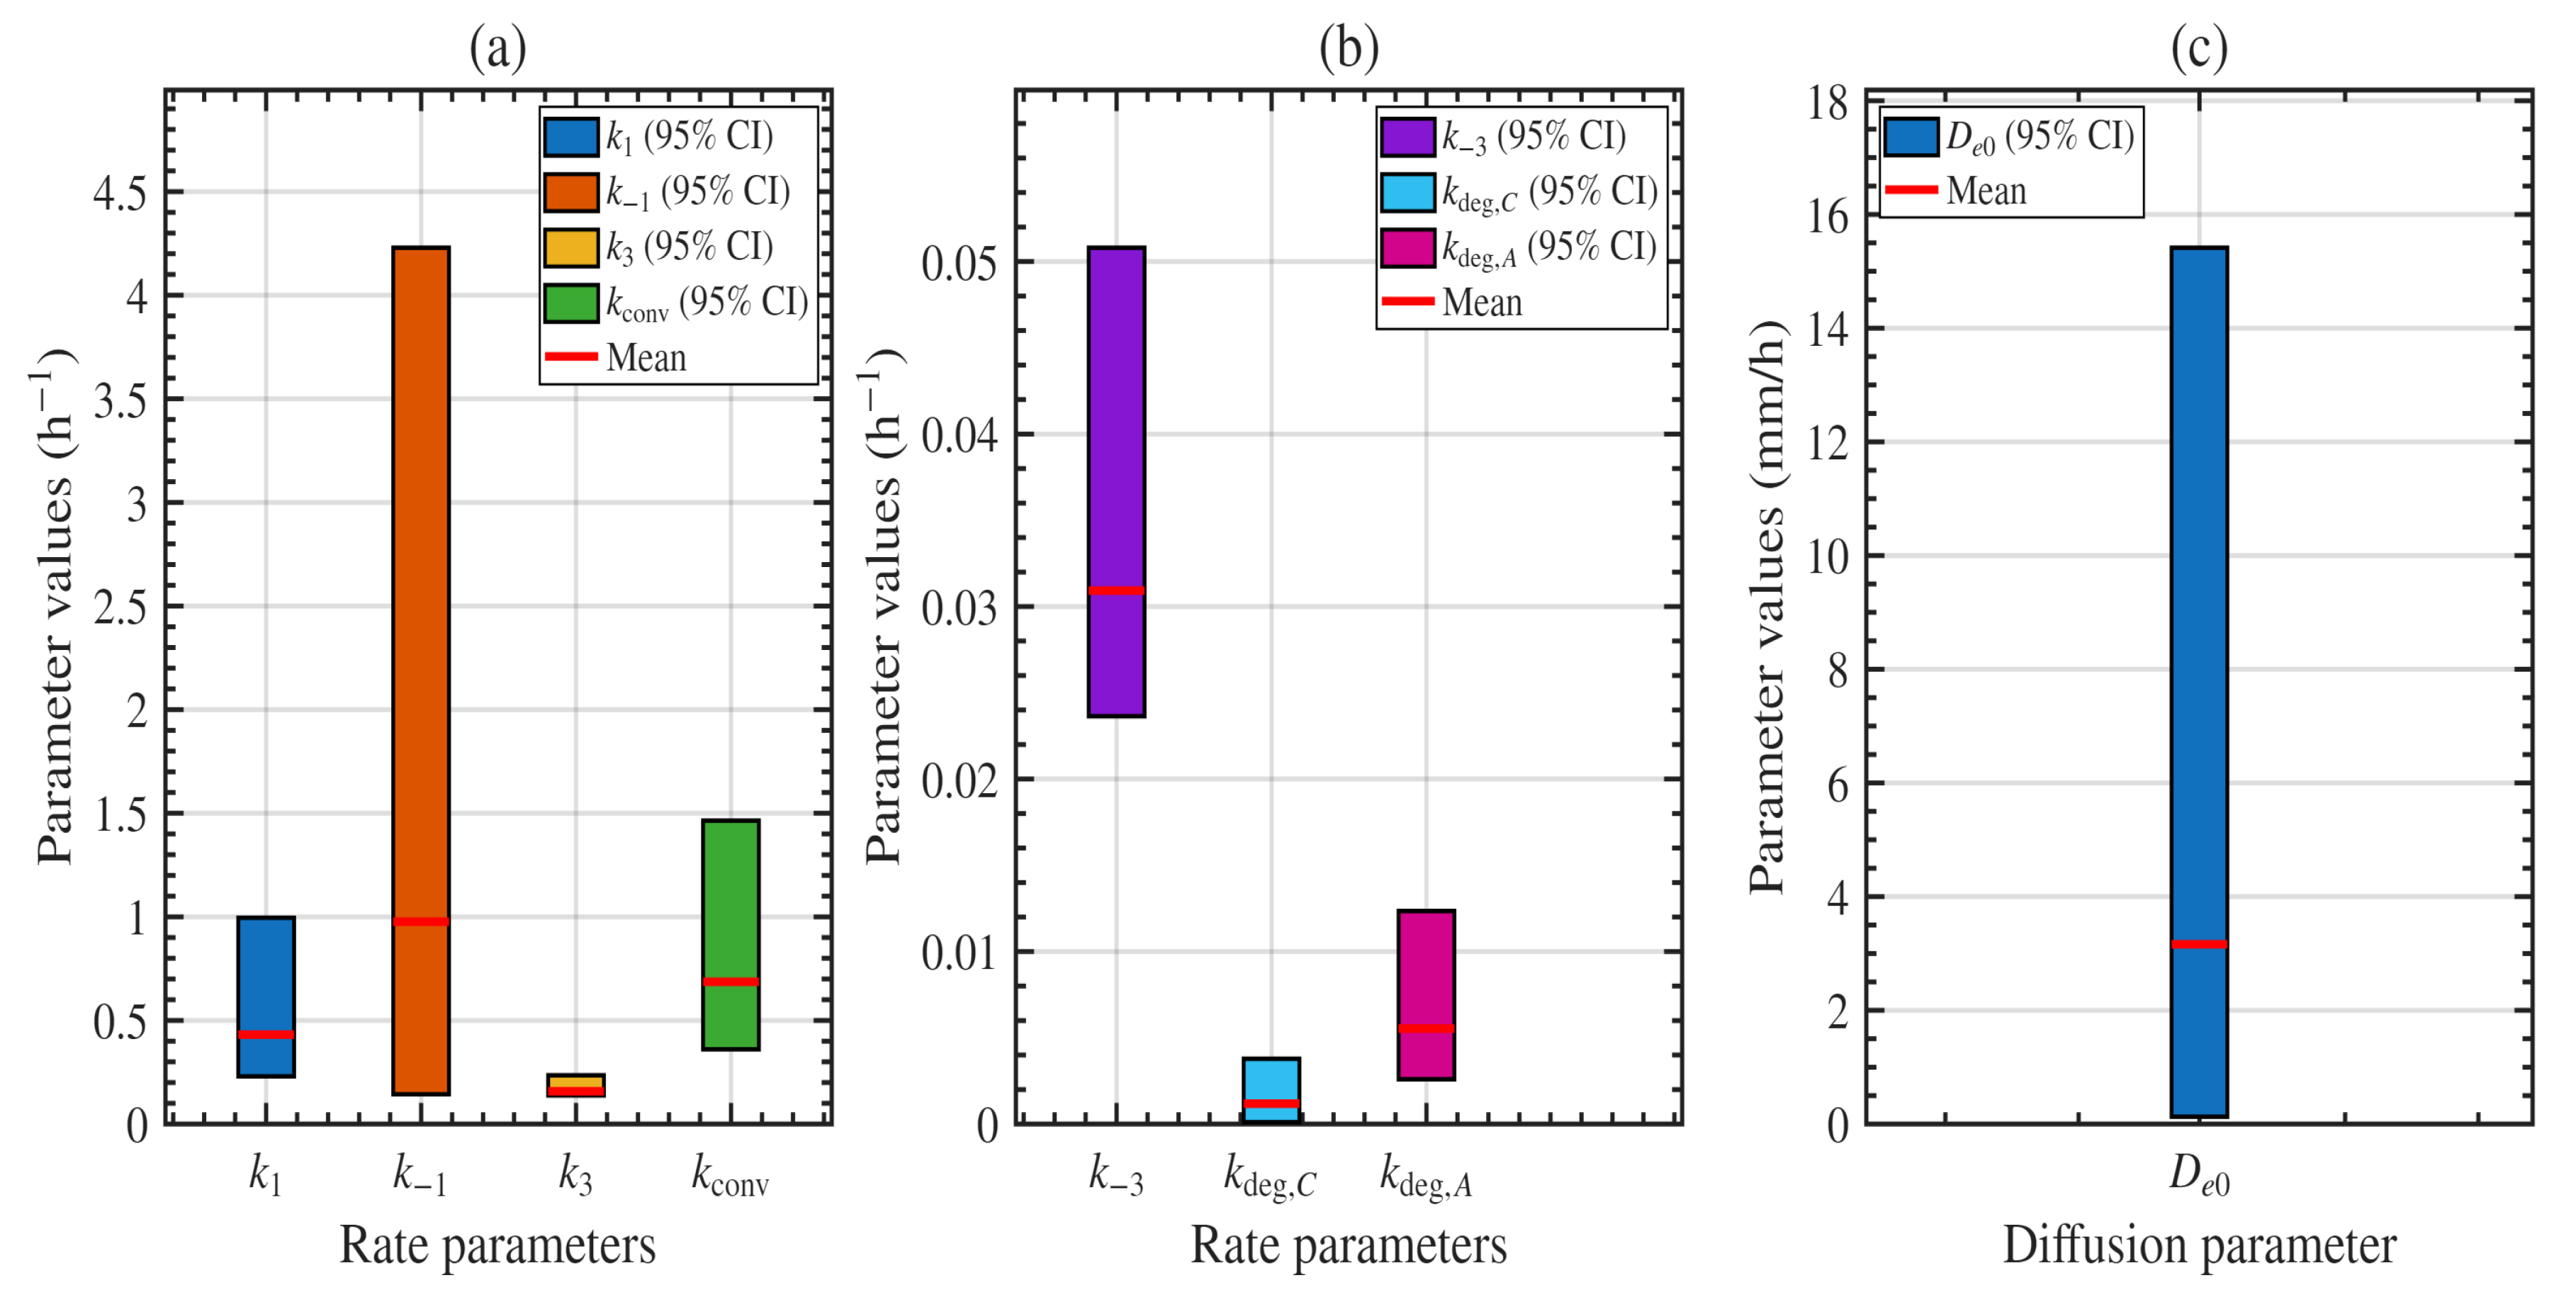
The marginal posterior uncertainty is summarised in
Figure 8 through 95% credible intervals (CIs), while the posterior means are reported in
Table 2. Among the rate parameters, the amorphous binding rate
, the crystalline degradation rate
, the amorphous degradation rate
, and the crystalline dissociation rate
exhibit the narrowest credible intervals and are therefore the most tightly constrained by the data. By contrast, the crystalline binding and dissociation rates,
and
, show substantially wider credible intervals, indicating greater uncertainty and no clear separation between them. For the amorphous pathway, however, the binding rate
is more tightly constrained and larger than the reverse dissociation rate
, suggesting more stable complex formation in the amorphous region. The posterior means also indicate that the amorphous degradation rate
exceeds the crystalline degradation rate
, consistent with previous experimental studies showing faster degradation in amorphous domains [
11,
36]. In contrast, the diffusion coefficient
exhibits markedly greater uncertainty than any of the kinetic rate parameters. Overall, the credible interval analysis demonstrates that the dominant kinetic parameters are constrained to within approximately a single order of magnitude. The joint weight-loss and crystallinity dataset of Shi et al. [
16] therefore provides sufficient information to constrain the main degradation processes and yield reliable model predictions. The broader uncertainty in
reflects the reaction-limited regime of the thin-film geometry used by Shi et al. [
16]; this uncertainty might be reduced by conducting experiments at greater film thickness, where transport timescales become significant relative to reaction timescales.
3.3. Prediction Uncertainty
The impact of parameter uncertainty on predictive uncertainty was quantified using the framework of van Mourik et al. [
35]. Posterior samples drawn as described in
Section 3.2 were propagated through the model to generate an ensemble of trajectories, from which pointwise 95% credible bands were computed for the observables.
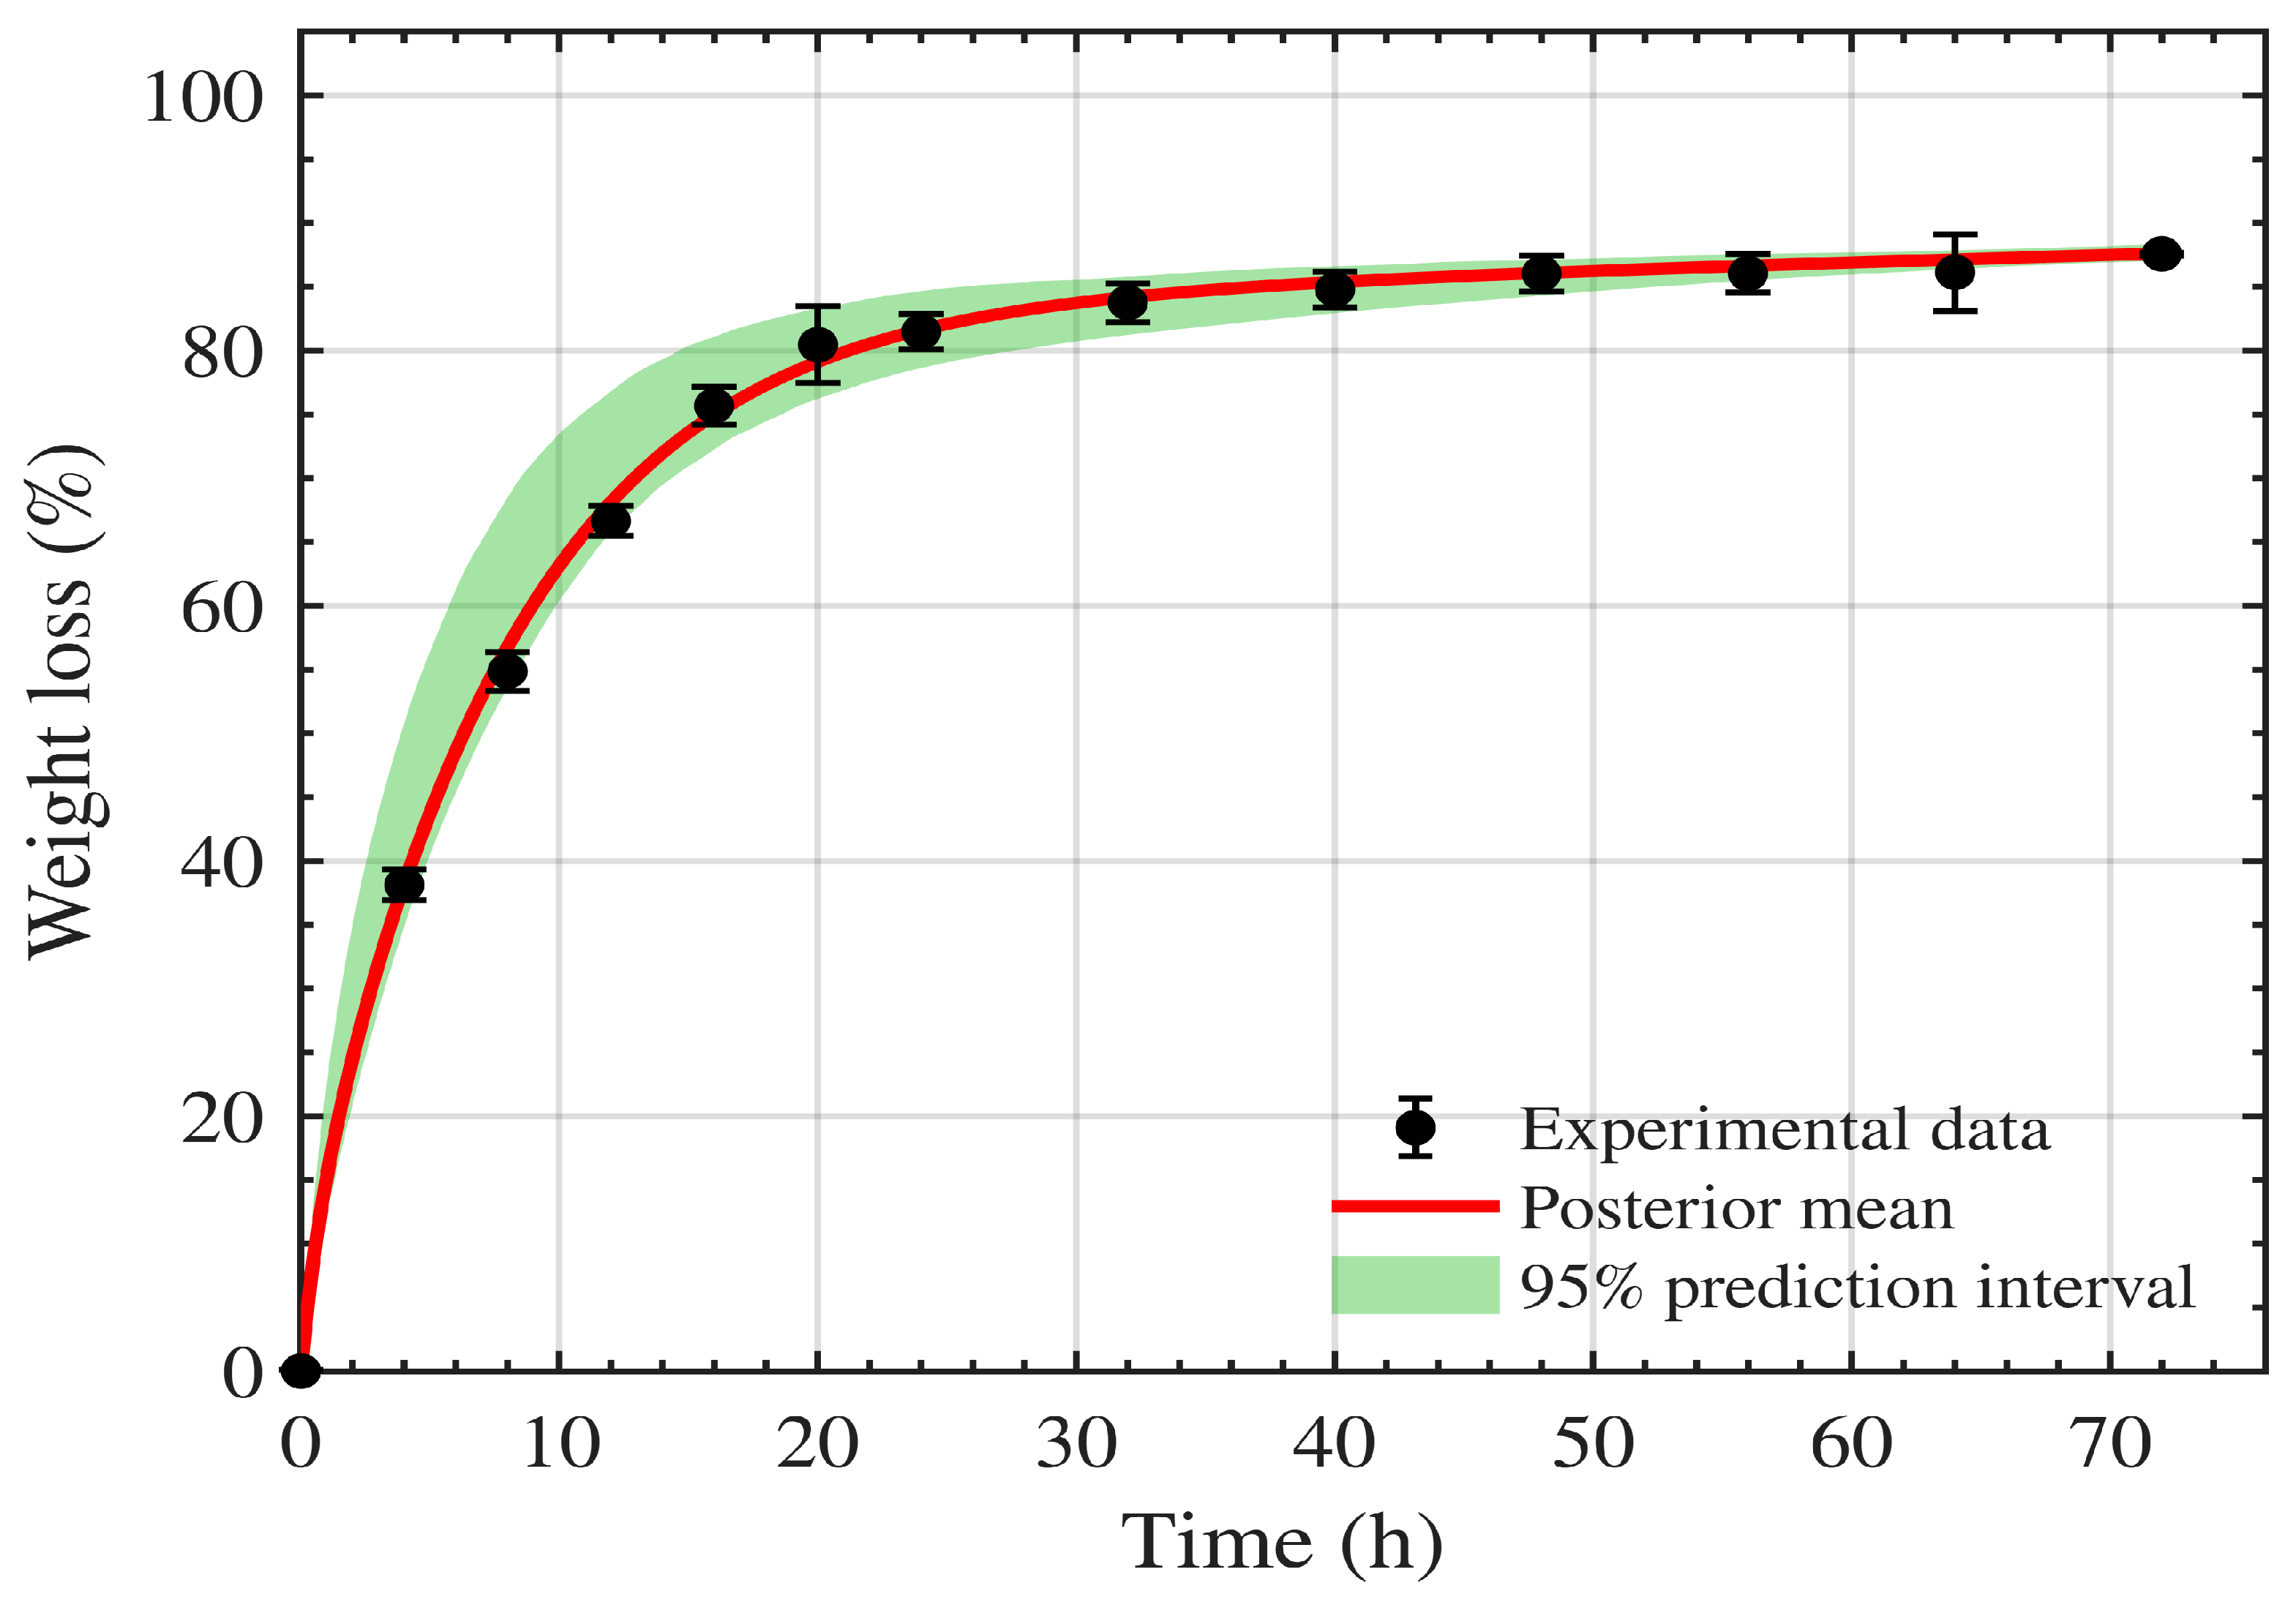
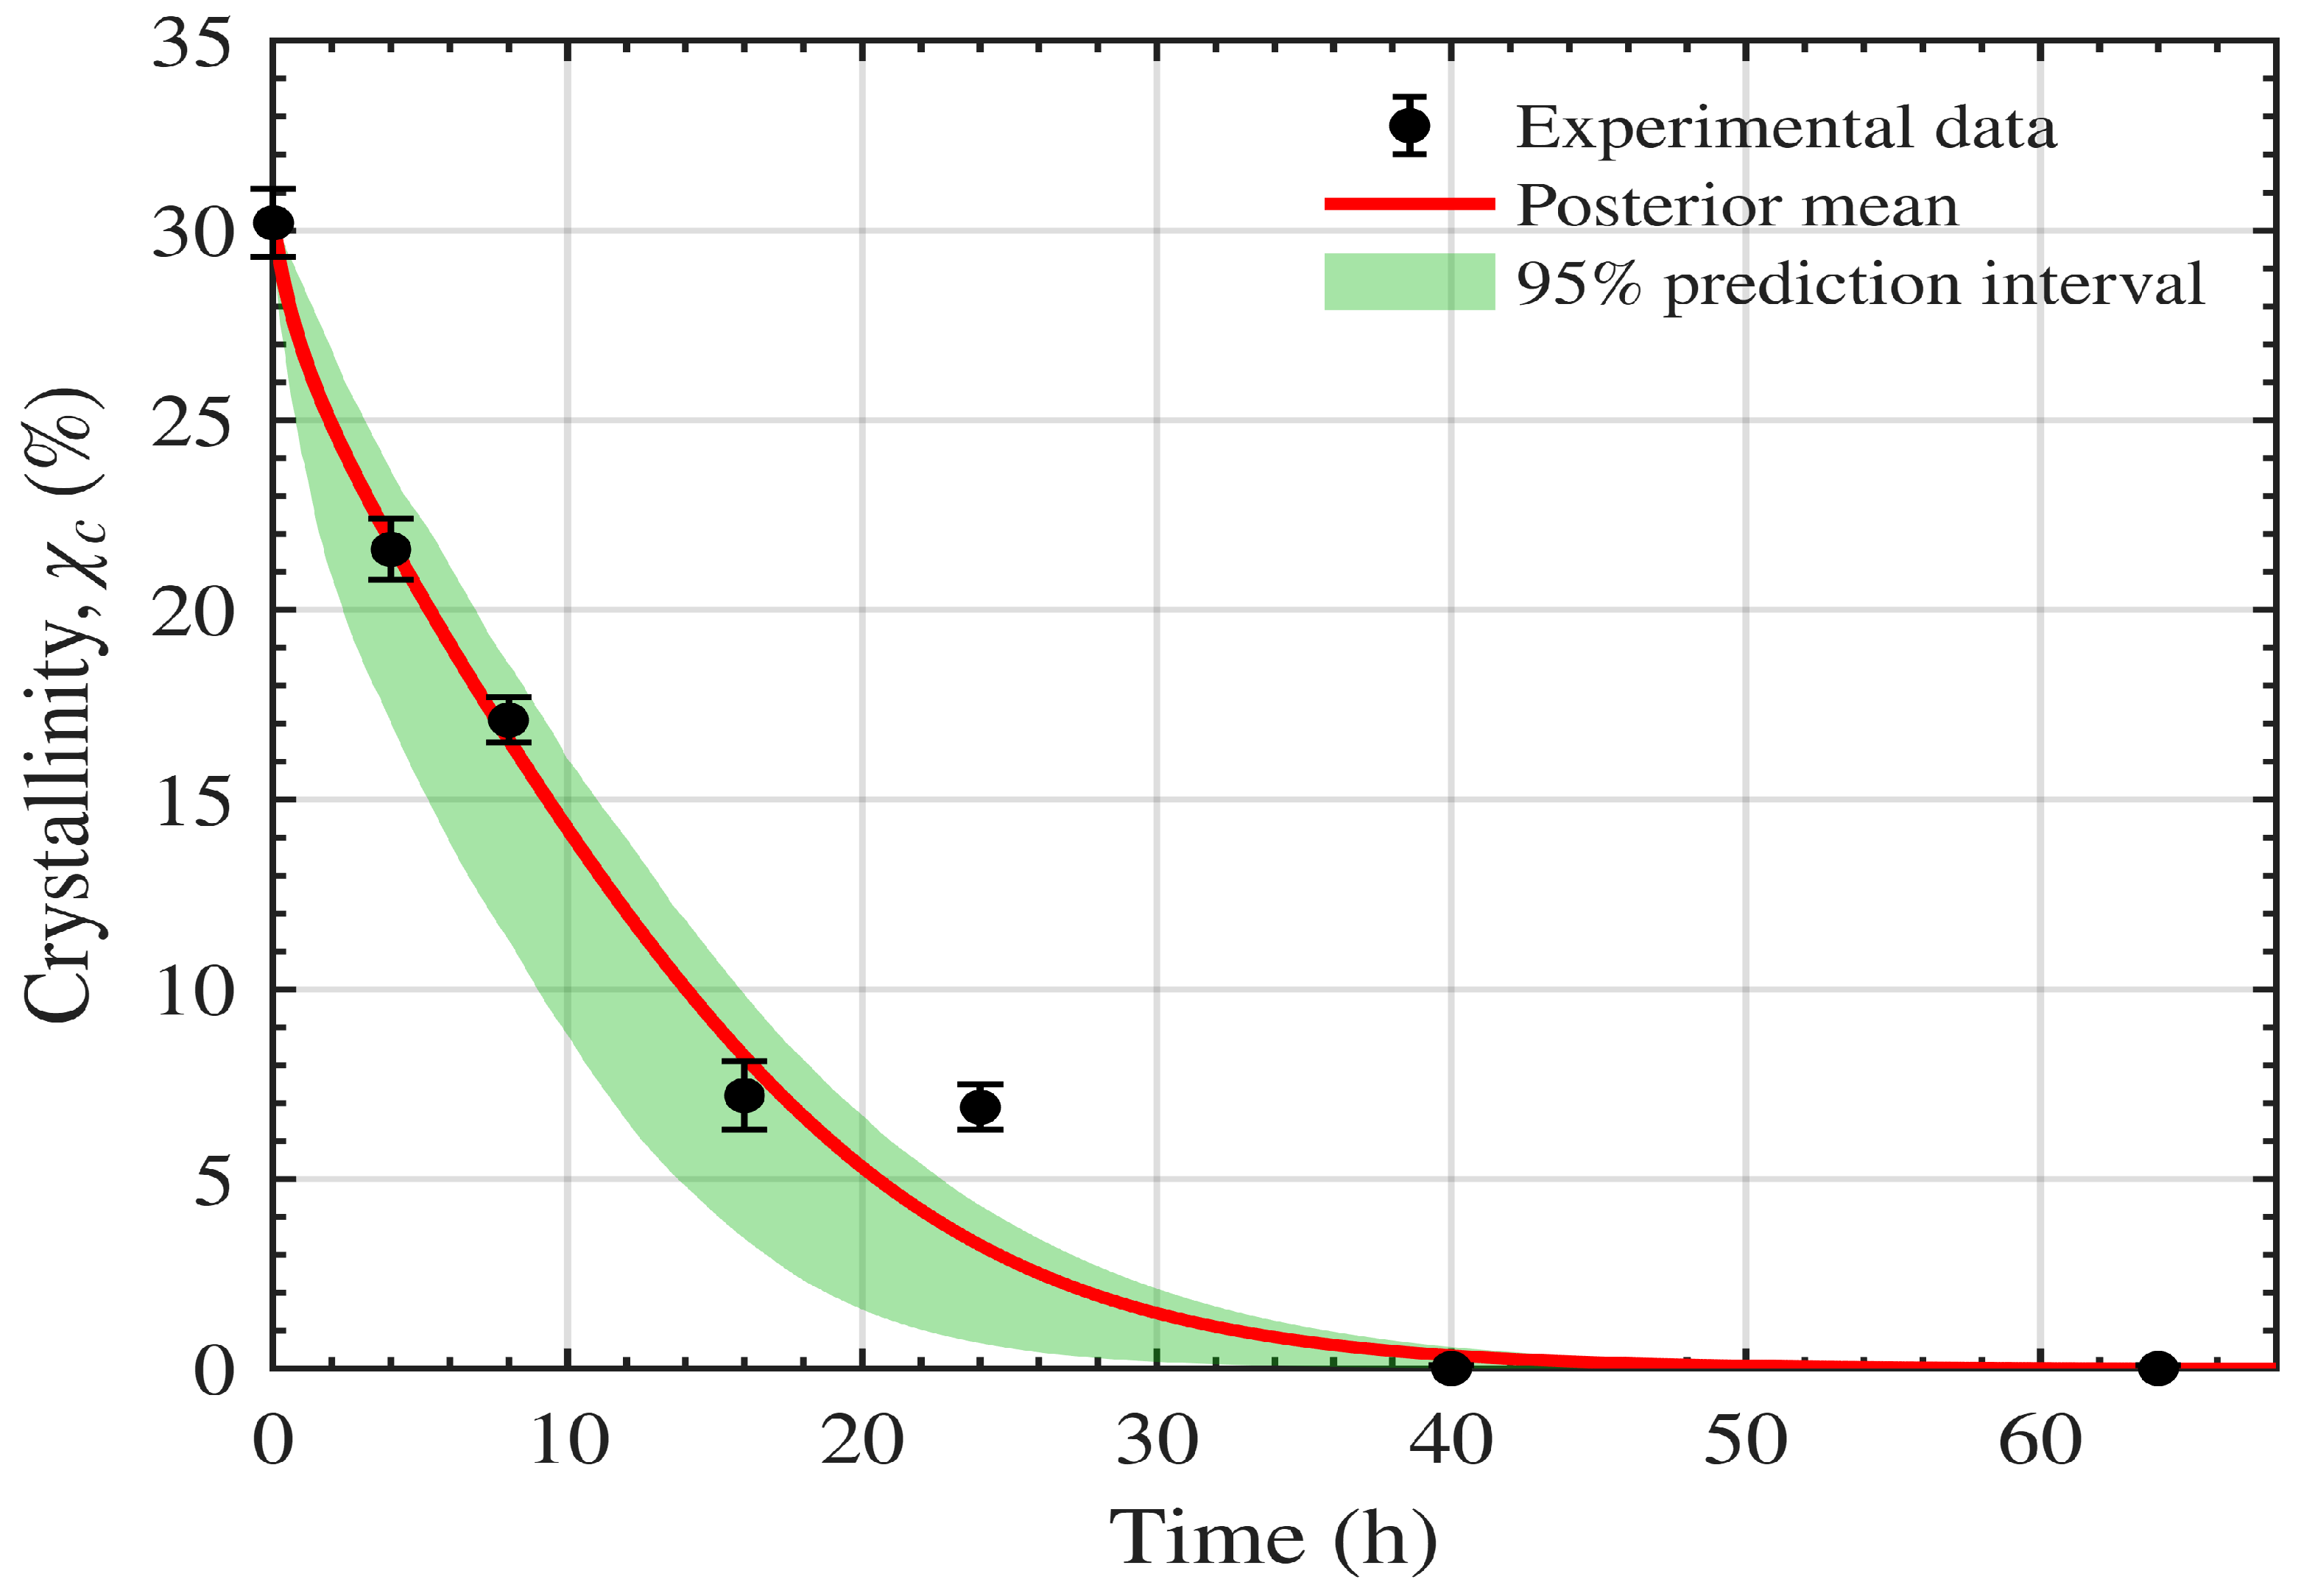
Figure 9 and
Figure 10 show the resulting prediction uncertainty for weight loss and crystallinity
respectively, for the data of Shi et al. [
16]. The red curves correspond to the posterior mean parameter vector, while the green shaded regions represent the 95% credible intervals of the predicted trajectories induced by posterior parameter uncertainty.
For weight loss (
Figure 9), the credible band remains narrow over most of the time course and closely tracks the measurements, indicating that the parameter uncertainty produces only limited variability in the predicted macroscopic mass loss. For crystallinity (
Figure 10), the model captures the overall decline, with modest uncertainty inflation at early times where the dynamics are steepest. However, the crystallinity loss at 24 h lies outside the uncertainty region, indicating that, as discussed in
Section 5, the crystallinity dynamics are not fully captured by the current model formulation.
4. Global Sensitivity
To quantify the influence of model parameters on the predicted degradation responses, we performed a global sensitivity analysis using Sobol’s method. Sobol analysis is a variance-based technique that decomposes output variance into contributions from individual parameters and their interactions [
37]. It therefore distinguishes first-order effects, which measure the independent contribution of each parameter, from total-order effects, which include both independent and interaction effects. Let
denote the model input parameters, each independently and uniformly distributed over
. The model output
has mean
and variance
D, given by
Sobol’s method expresses
as
which induces the variance decomposition
Here,
is the partial variance associated with the parameter subset
, and the corresponding Sobol sensitivity index is
In particular, the first-order index
measures the independent contribution of parameter
, while the total-order index
measures its overall contribution, including interactions. The sensitivity indices satisfy
Sobol analysis was implemented in MATLAB using the calibrated model in Equations (
2)–(
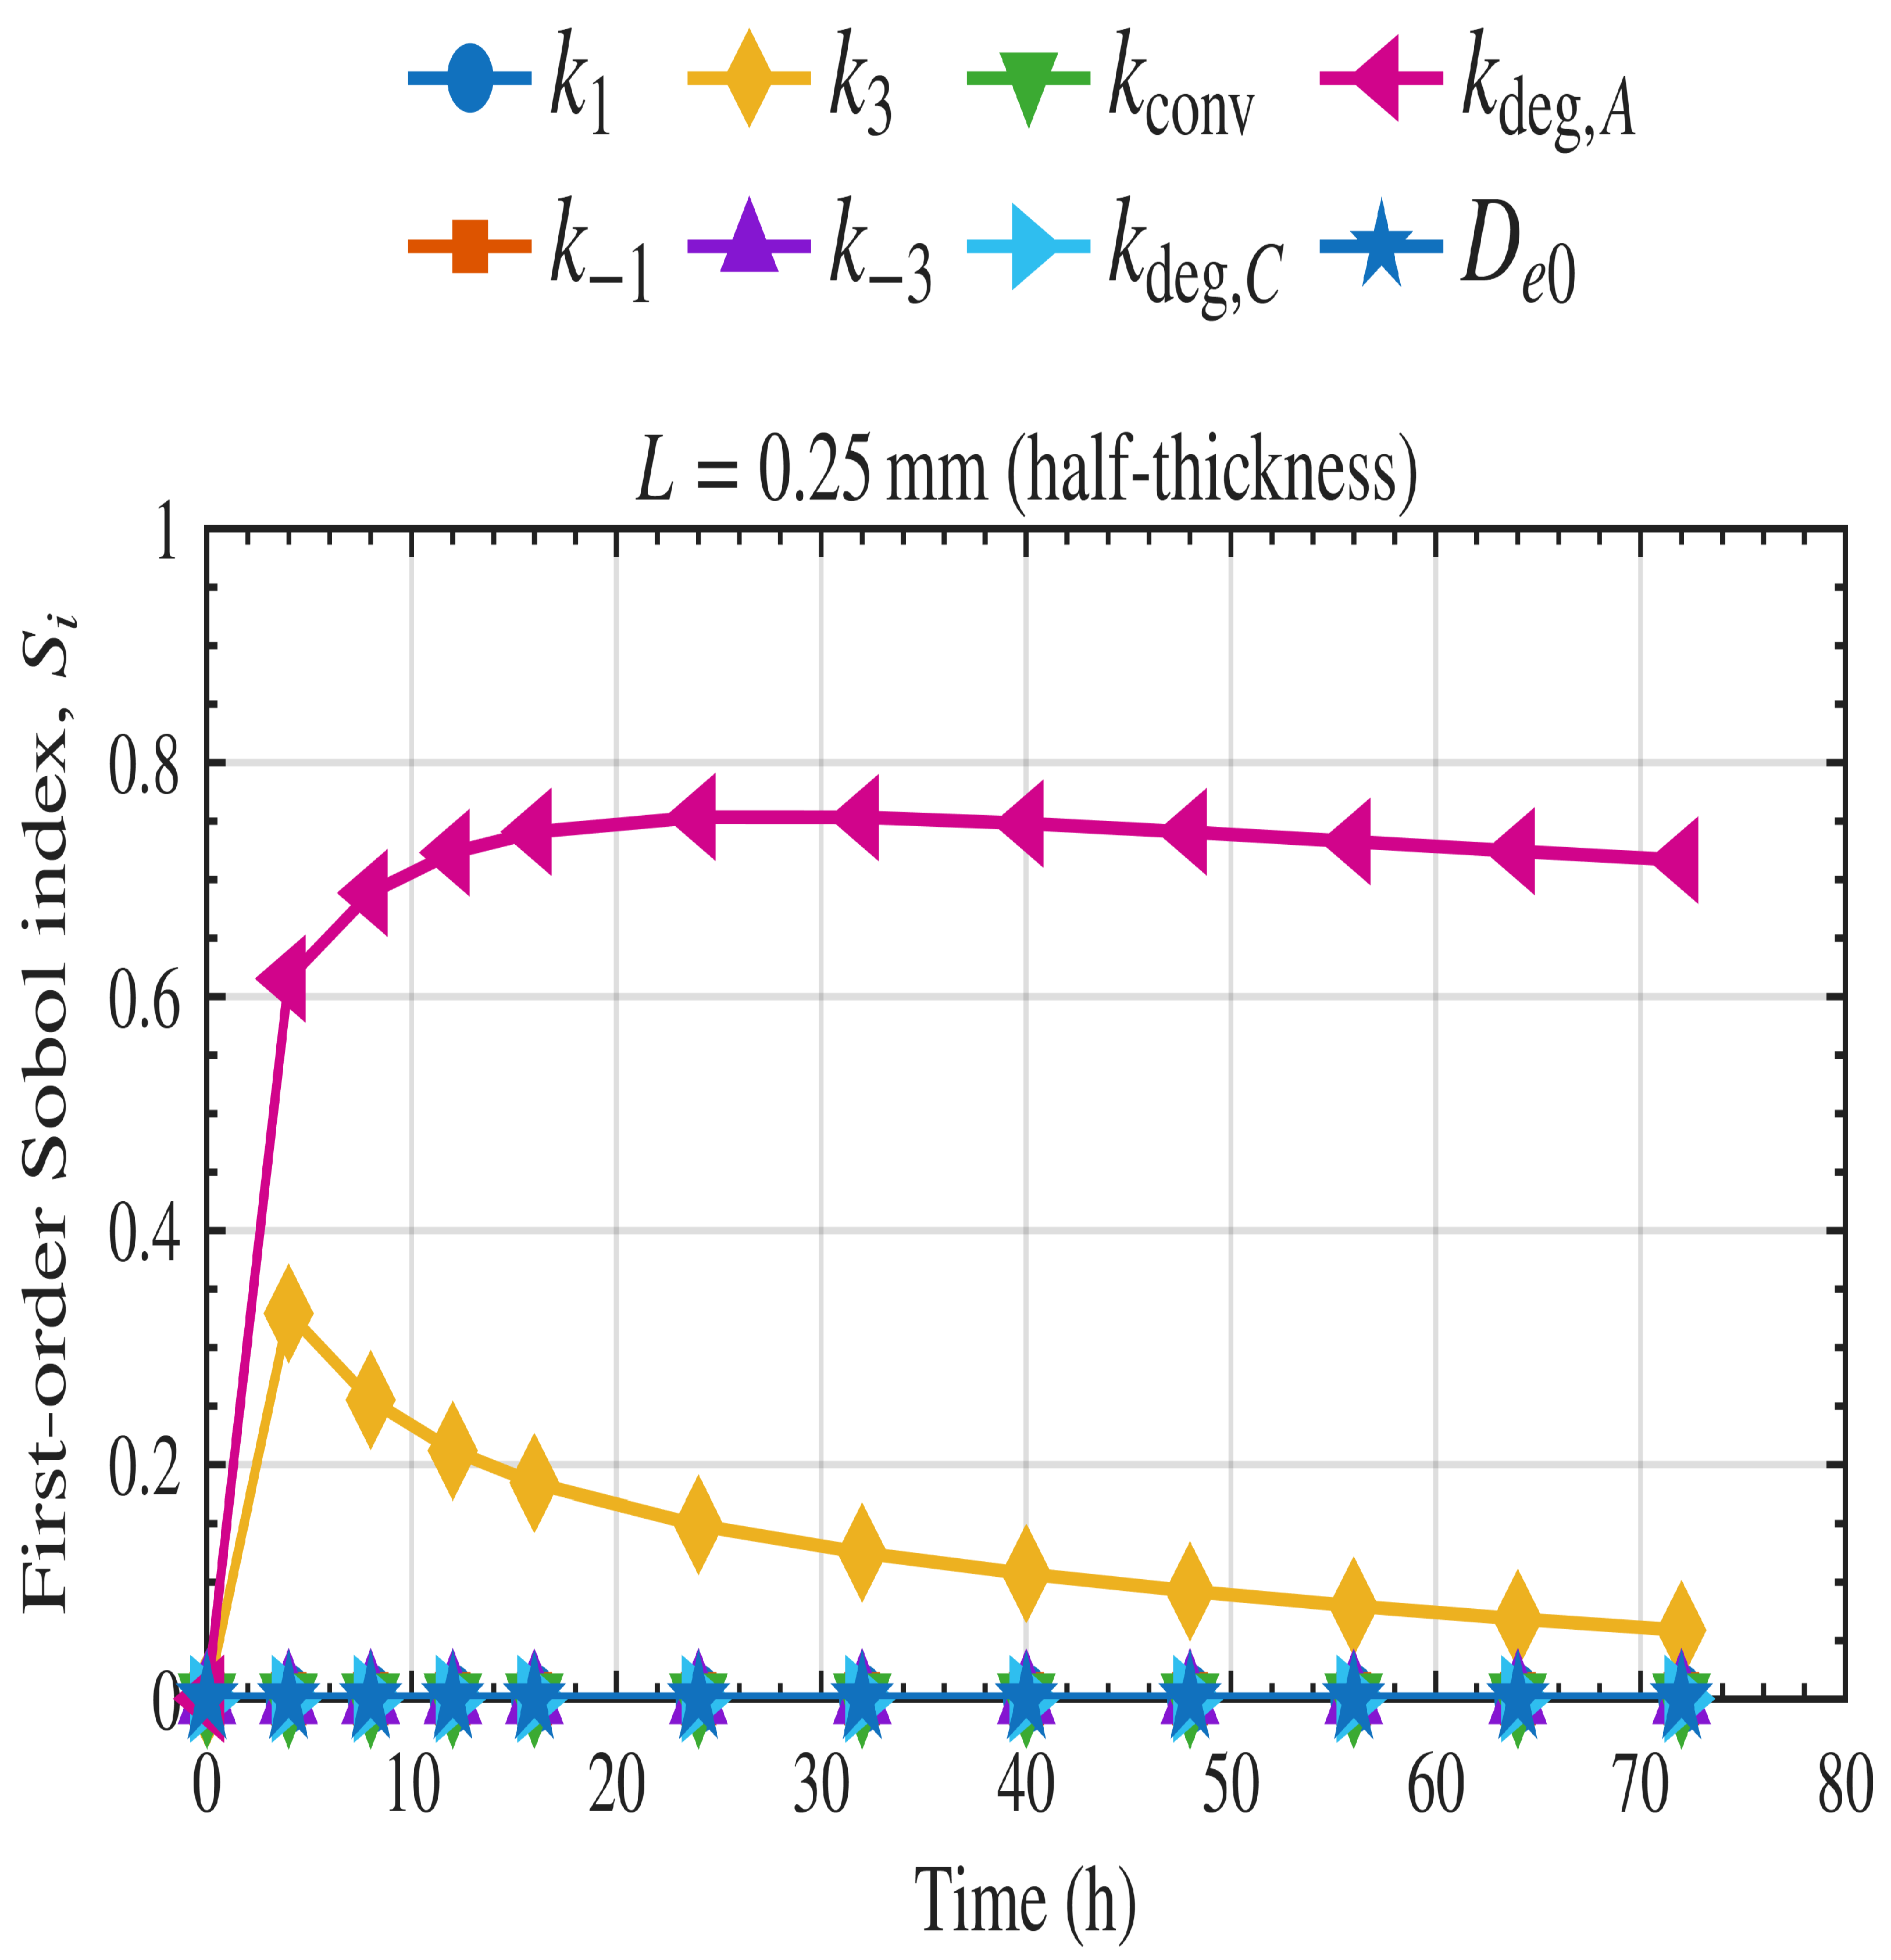
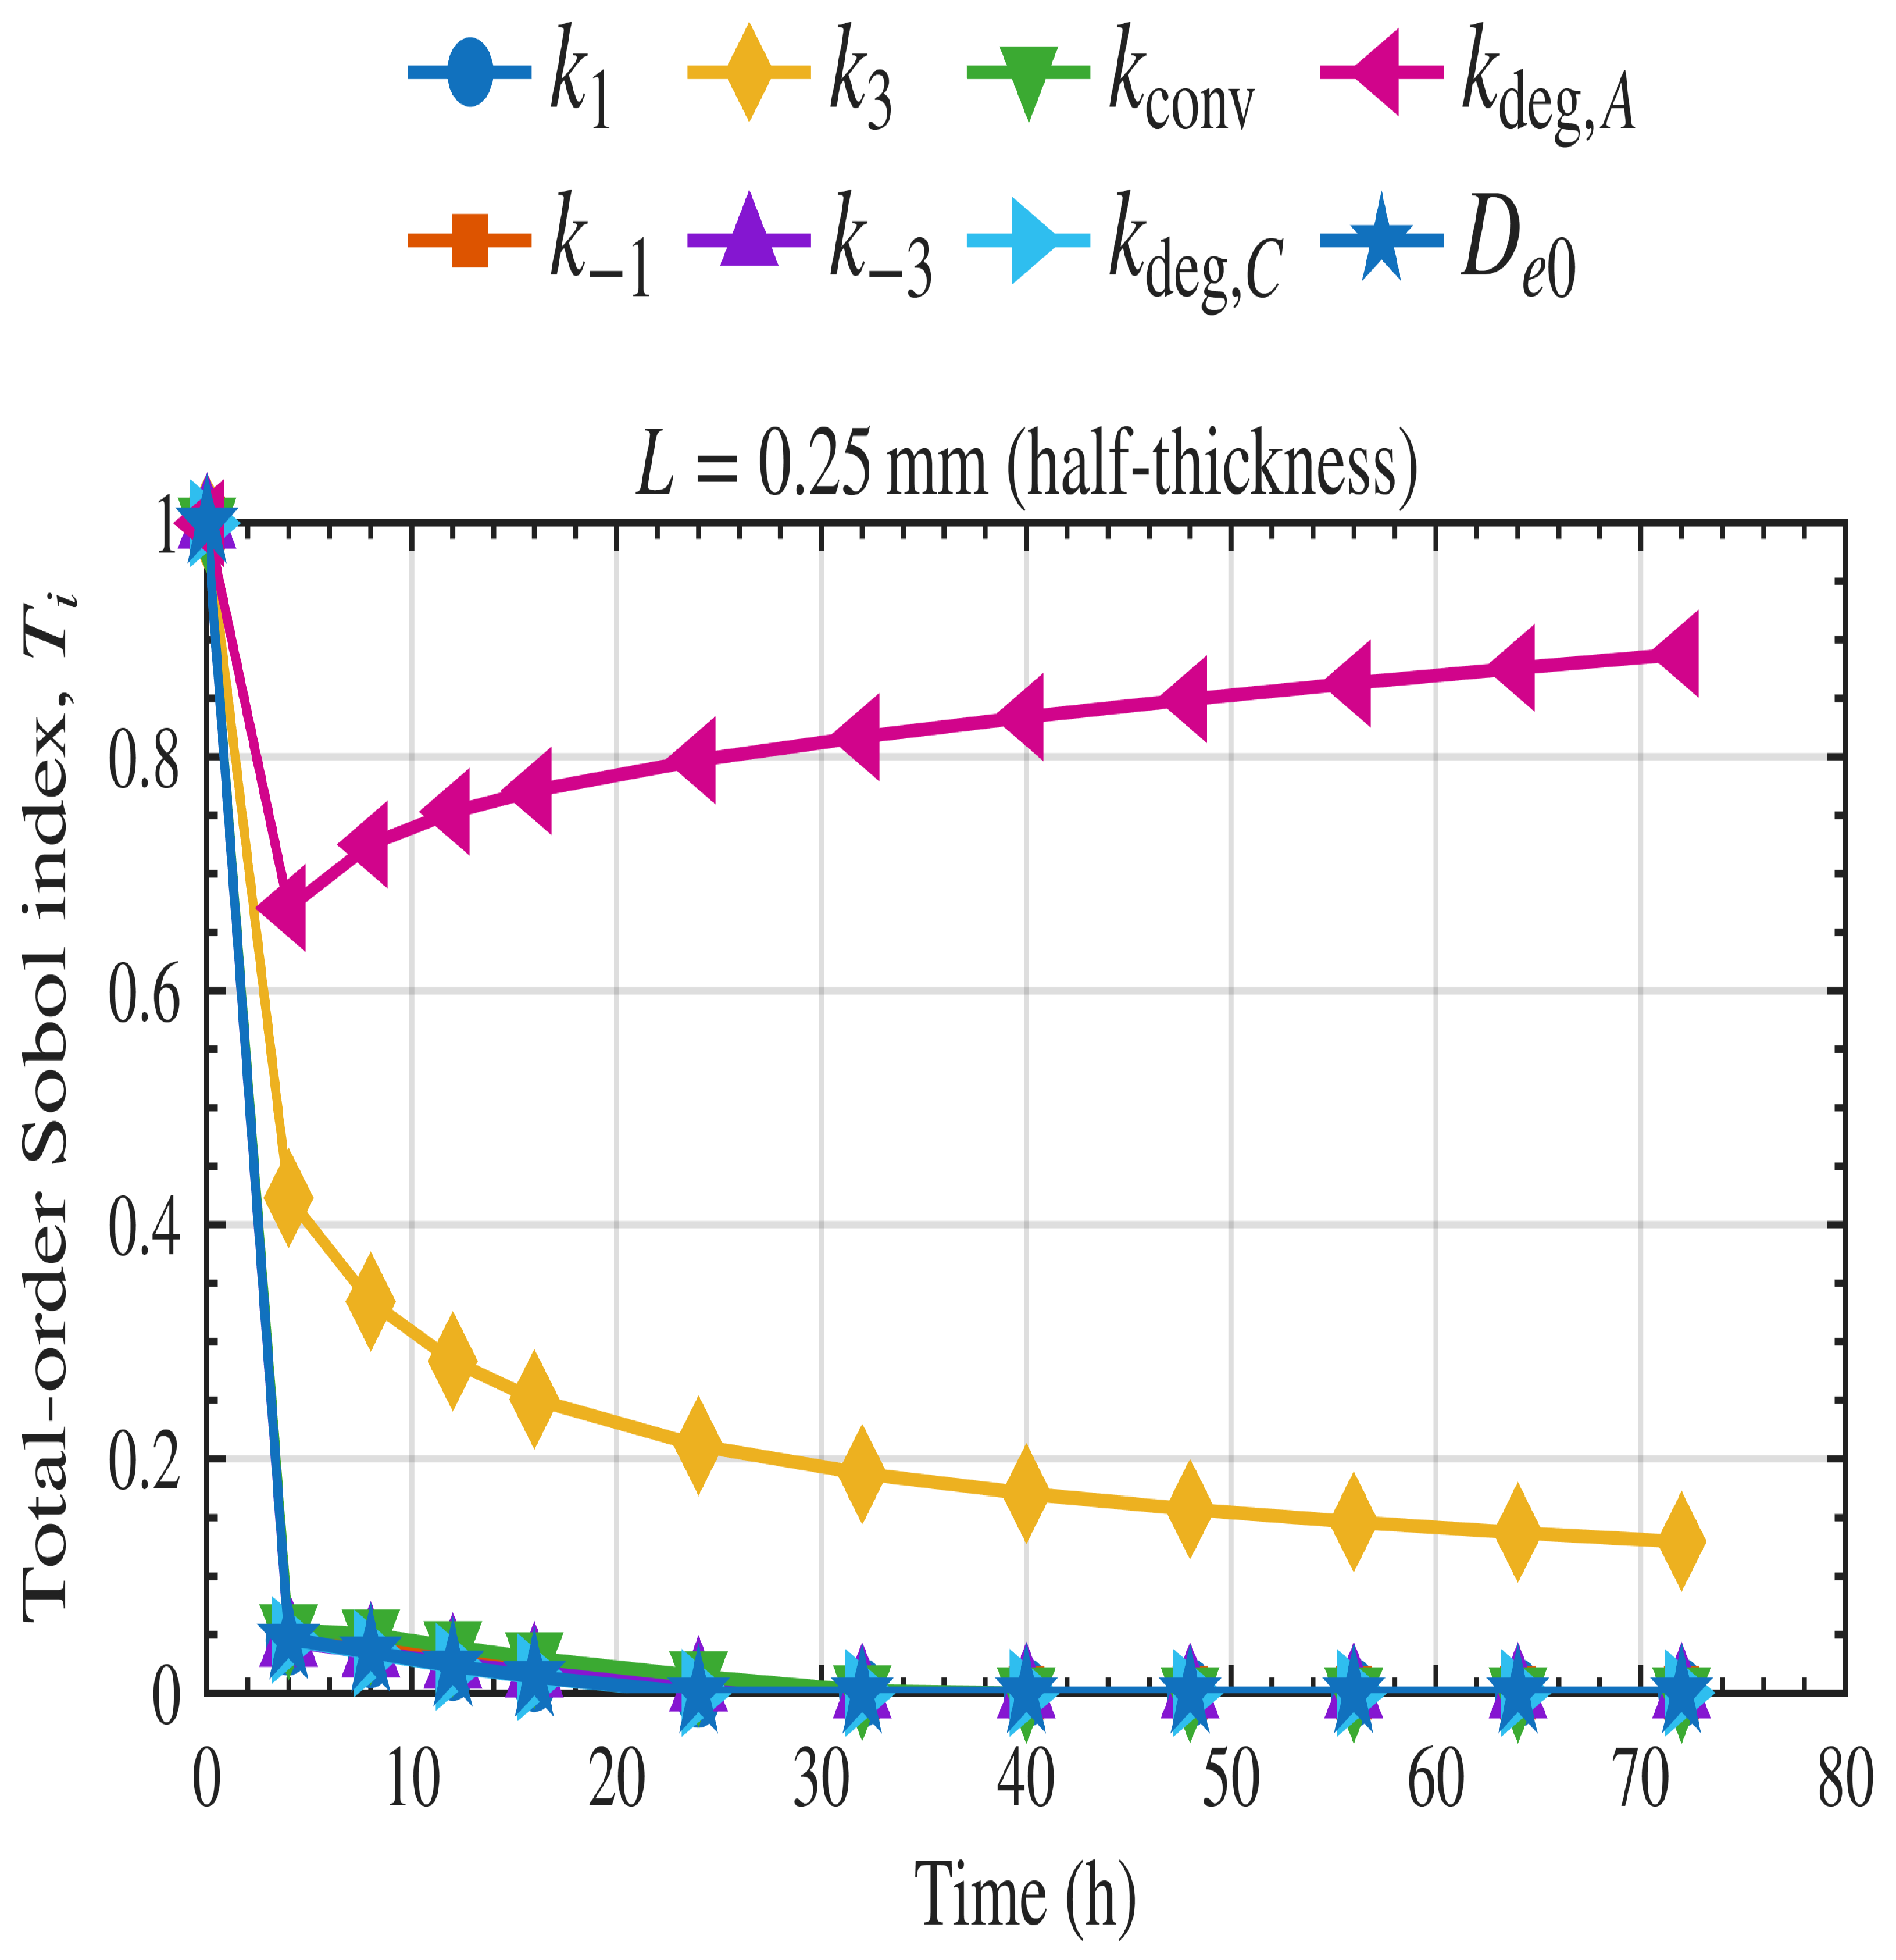
7) for the mass loss. Time-dependent first-order and total-order indices were computed for each kinetic parameter at the thickness of 0.5 mm used in the experimental study and are shown in
Figure 11 and
Figure 12, respectively.
In the first-order indices (
Figure 11),
is the dominant parameter throughout the simulation, indicating that when considering each parameter independently, the mass-loss rate is most sensitive to the rate of degradation of the amorphous region. The rate of enzyme binding to the amorphous region
has a smaller but significant first-order contribution, particularly at earlier time points, before its influence gradually declines. By contrast, the remaining parameters, including
,
,
,
,
, and
, show negligible first-order effects across the simulation window. A similar pattern is observed in the total-order indices (
Figure 12). The parameter
remains the dominant source of sensitivity even when interaction effects are included, while
also retains a clear total-order contribution. The difference between the first-order and total-order roles of
indicates that its influence is not purely independent, but also arises through interactions with other parameters. The other parameters contribute only minimally to total order, primarily at early time points, and become negligible as degradation progresses. Overall, these results indicate that the system is primarily controlled by the degradation of the amorphous regions.
4.1. Effect of Thickness on Parameter Sensitivity
The Sobol sensitivity analysis described above was repeated for different values of film thickness, both above and below the 0.5 mm thickness used in the experiment. The first-order Sobol sensitivity indices were found to be essentially independent of film thickness and follow the same pattern as shown in
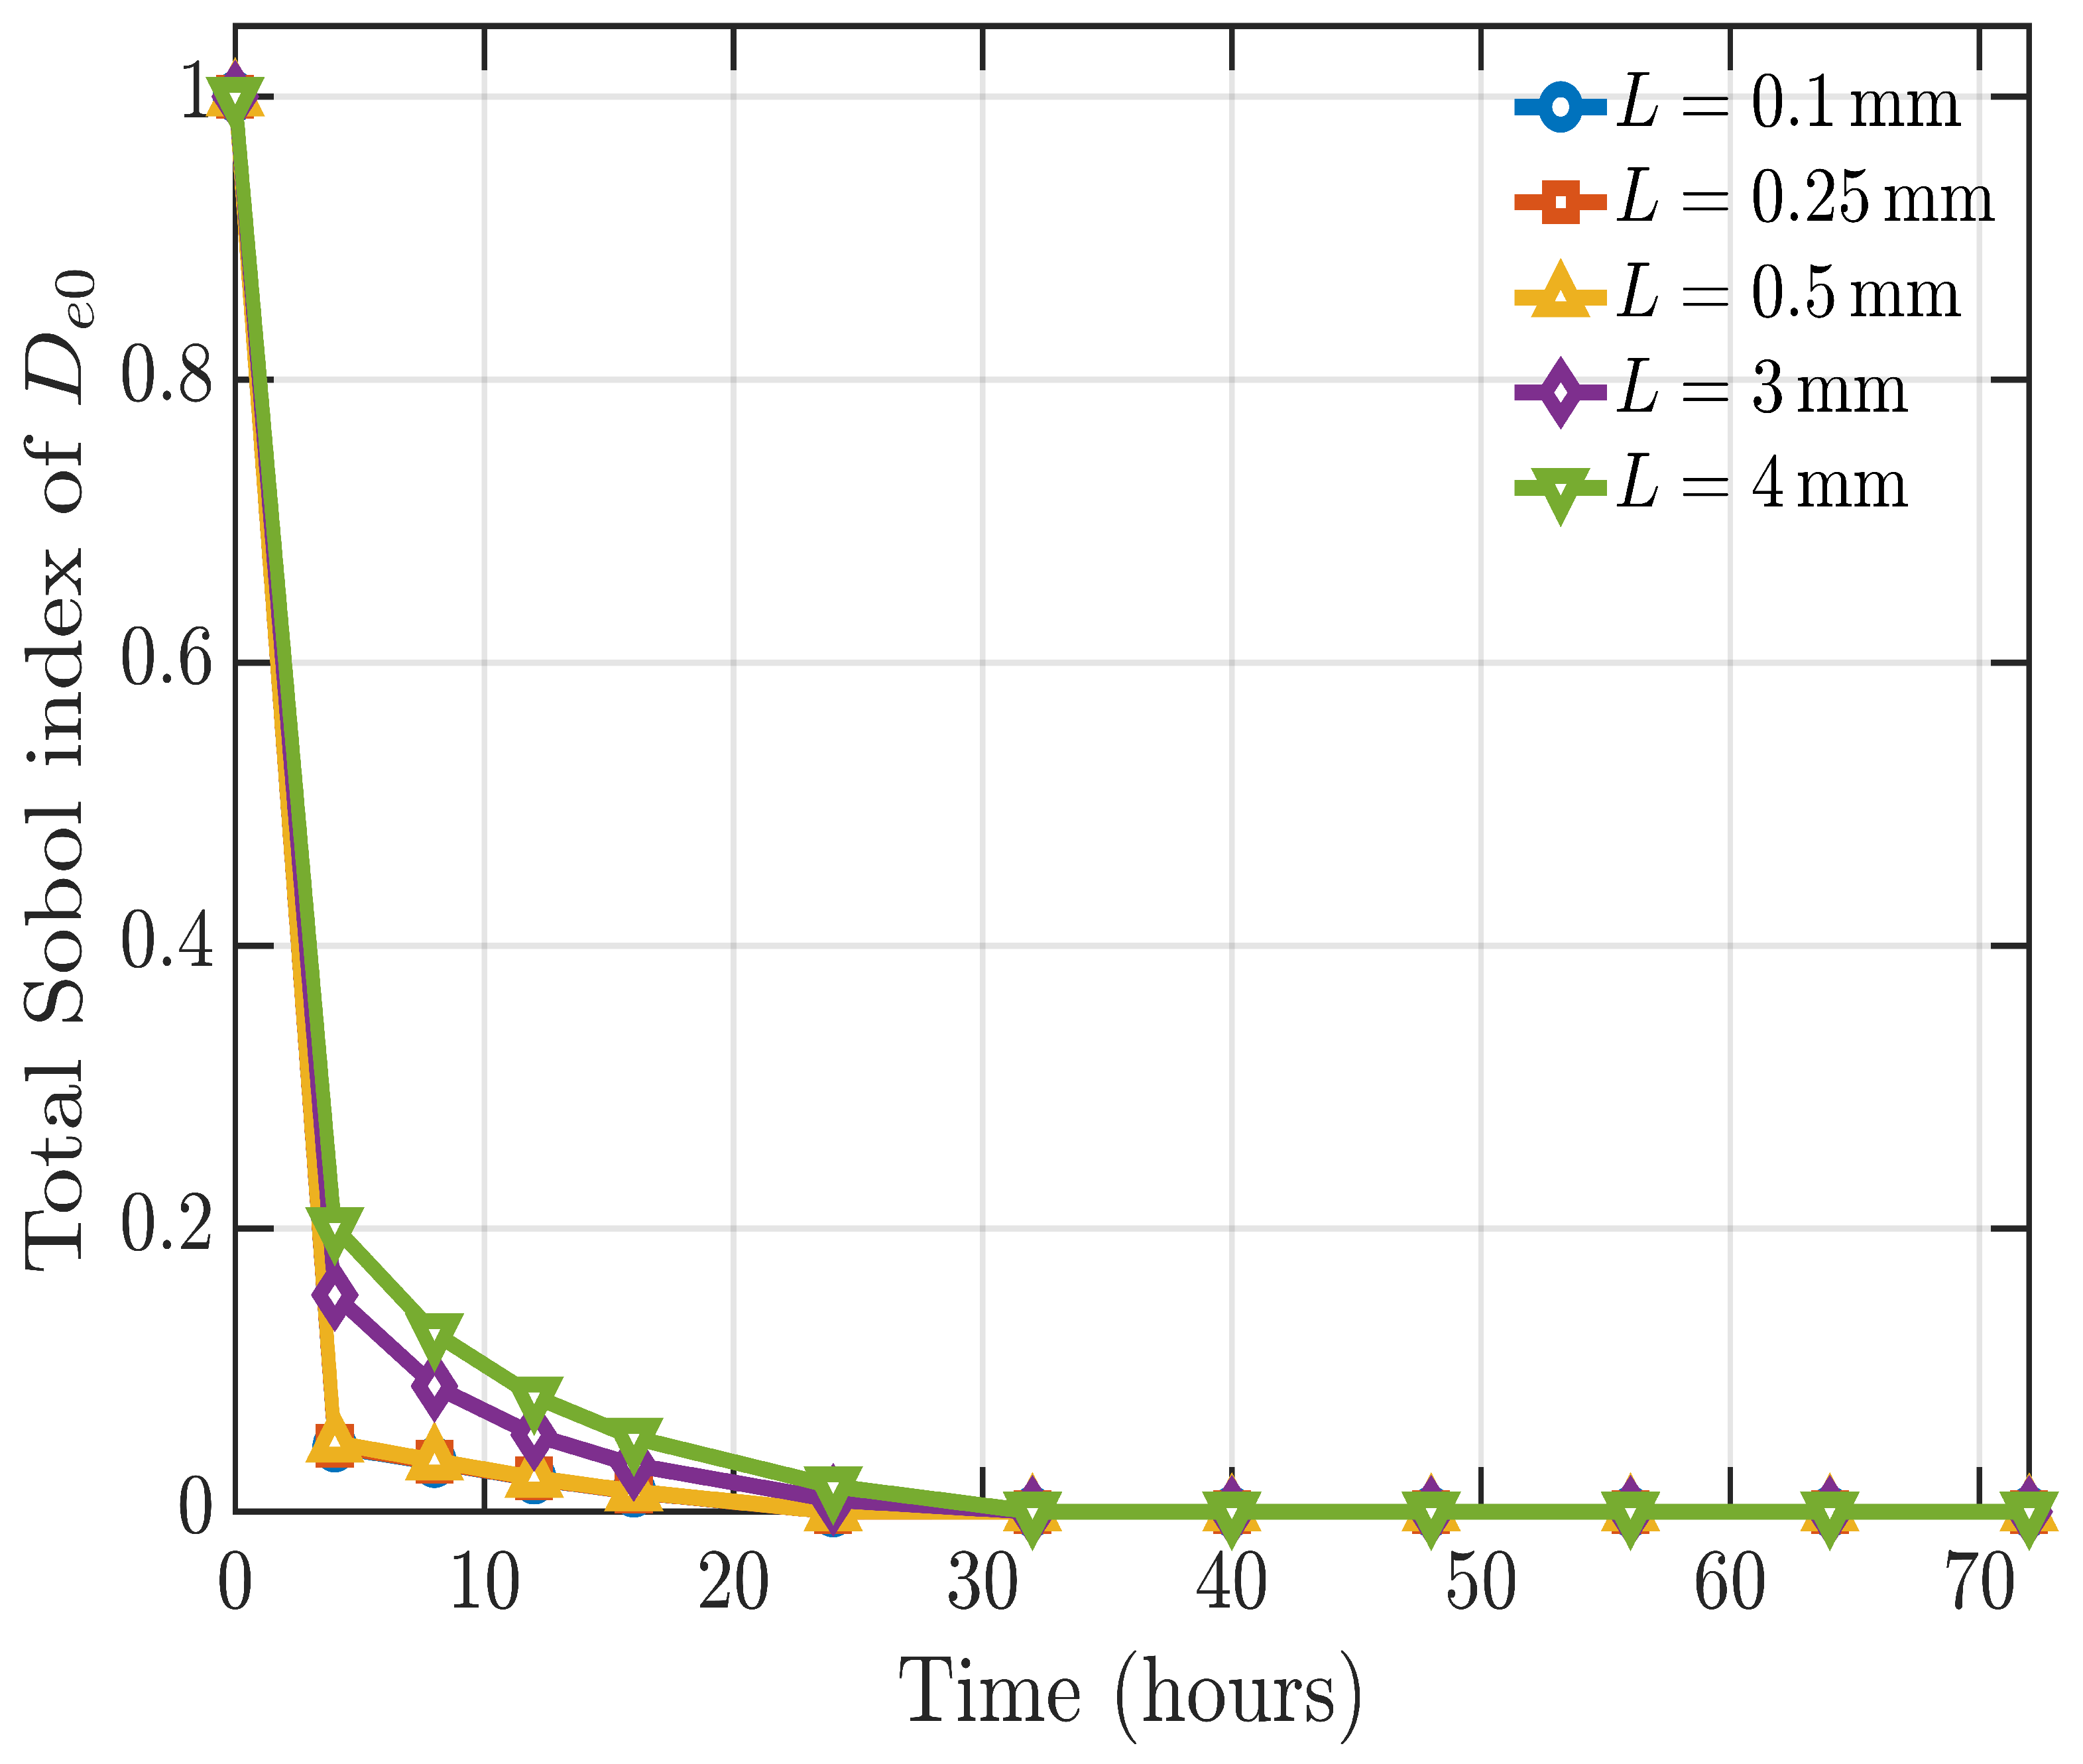
Figure 11. In contrast, the total-order sensitivity index of the diffusion parameter,
, does vary with thickness (
Figure 13). For the thinner films of
and below, the total order sensitivity index curves for the diffusion parameter overlap, indicating a similarly weak role of diffusion in this regime. For thicker films, the total-order sensitivity of
increases with thickness, showing that transport-related interaction effects become more important with increasing thickness. The total-order sensitivities of the other parameters are unaffected by thickness.
4.2. Effect of Film Thickness on Enzymatic Degradation
We use the identified model to explore the effect of film thickness on the rates of mass and crystallinity loss. All calibrated parameters in
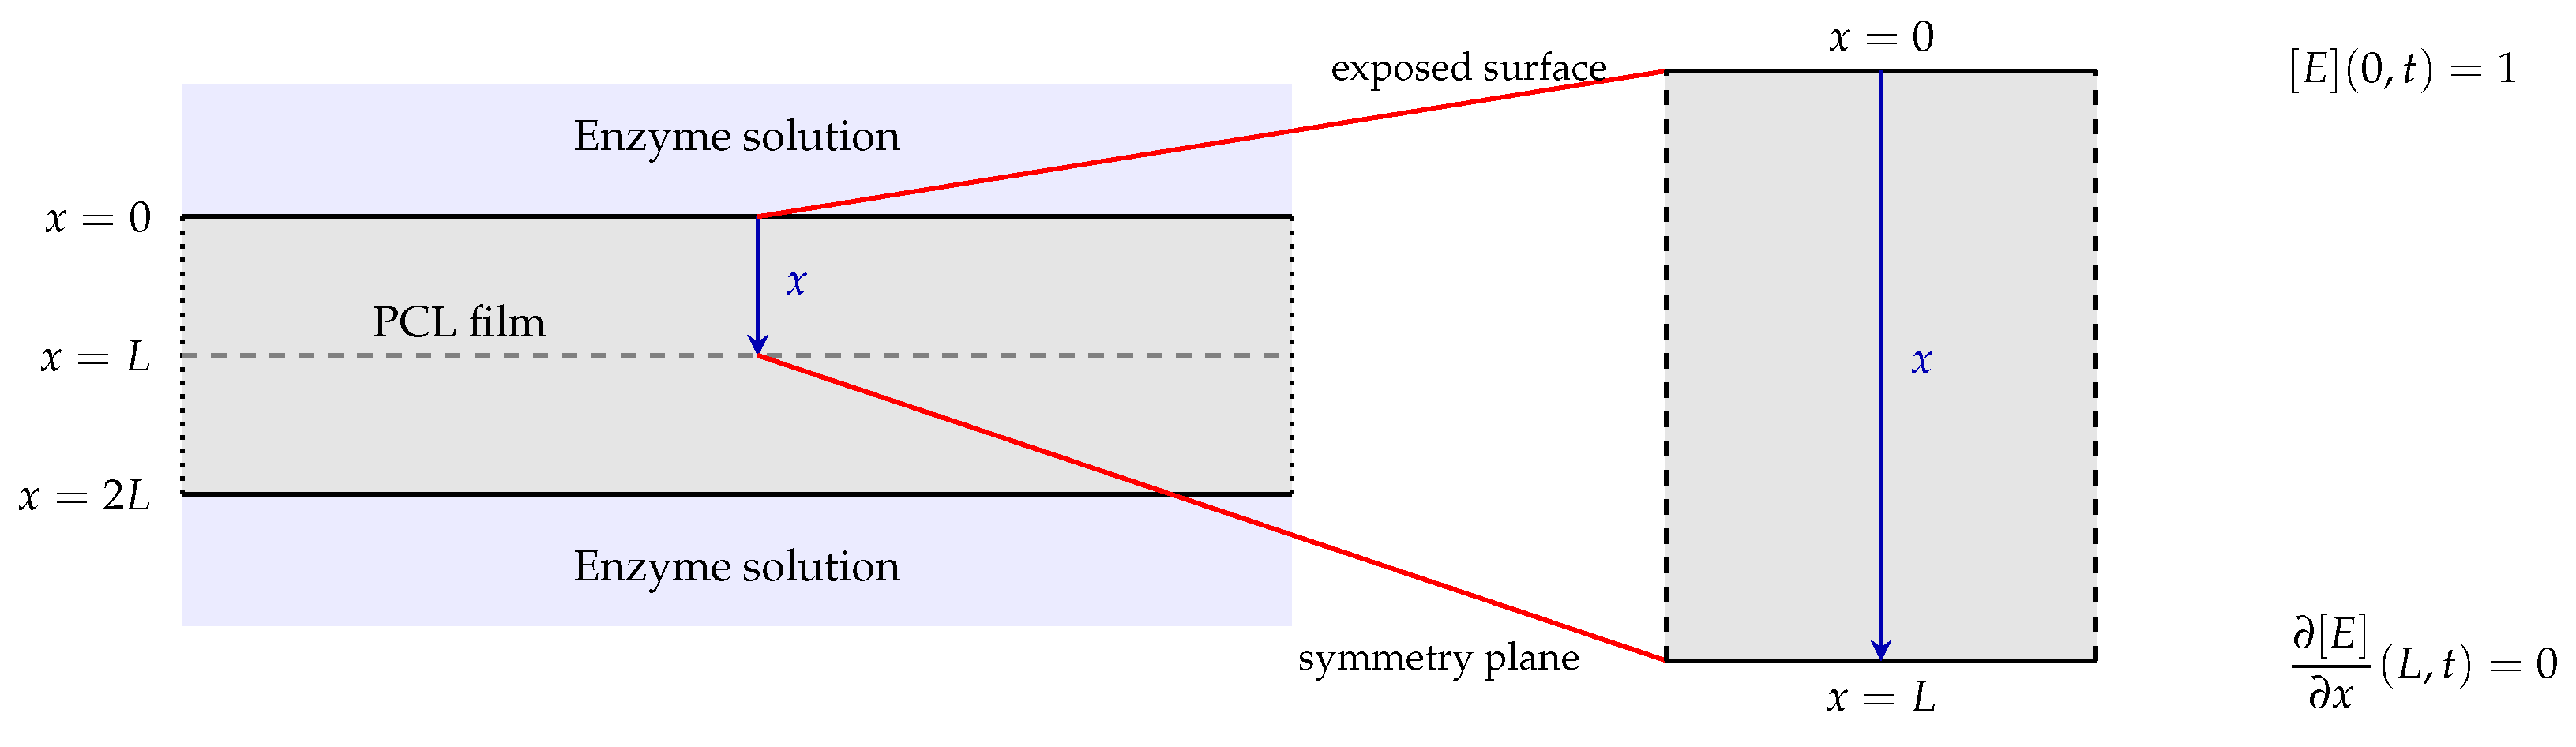
Table 1 were fixed and only the film thickness was varied. The model is solved on a symmetric half-domain,
, where
L is the half-thickness and the full physical film thickness is
.
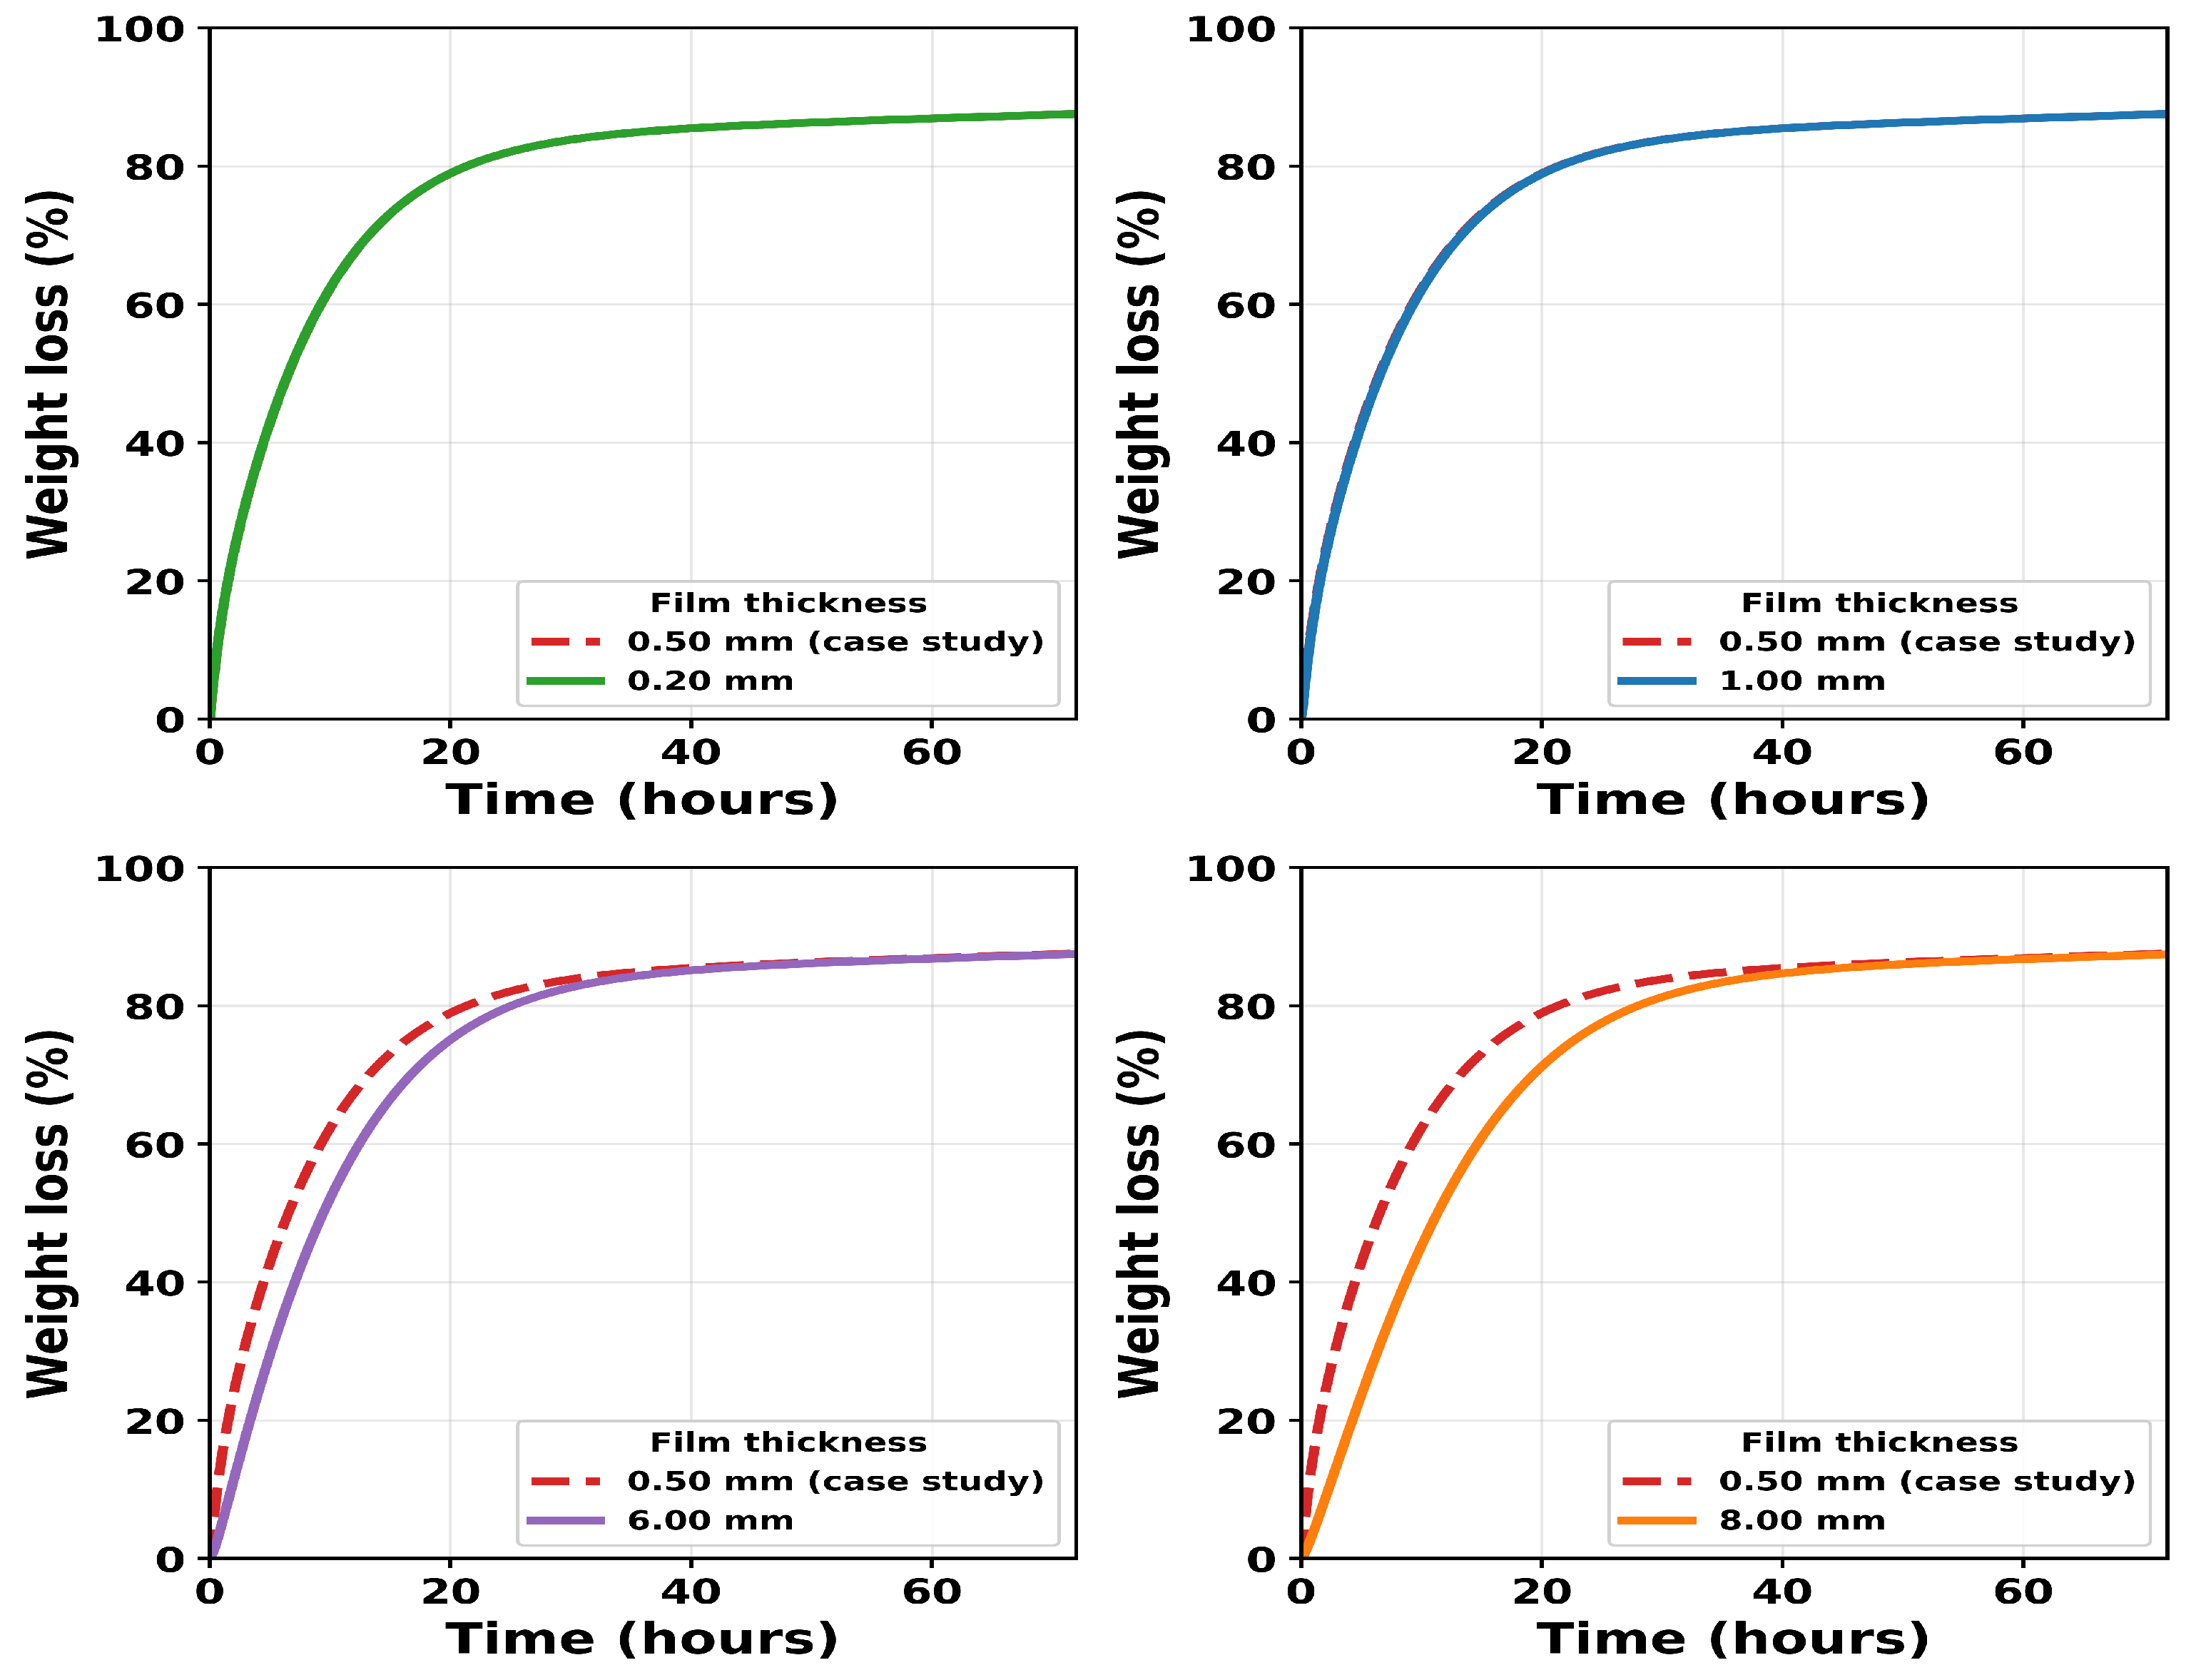
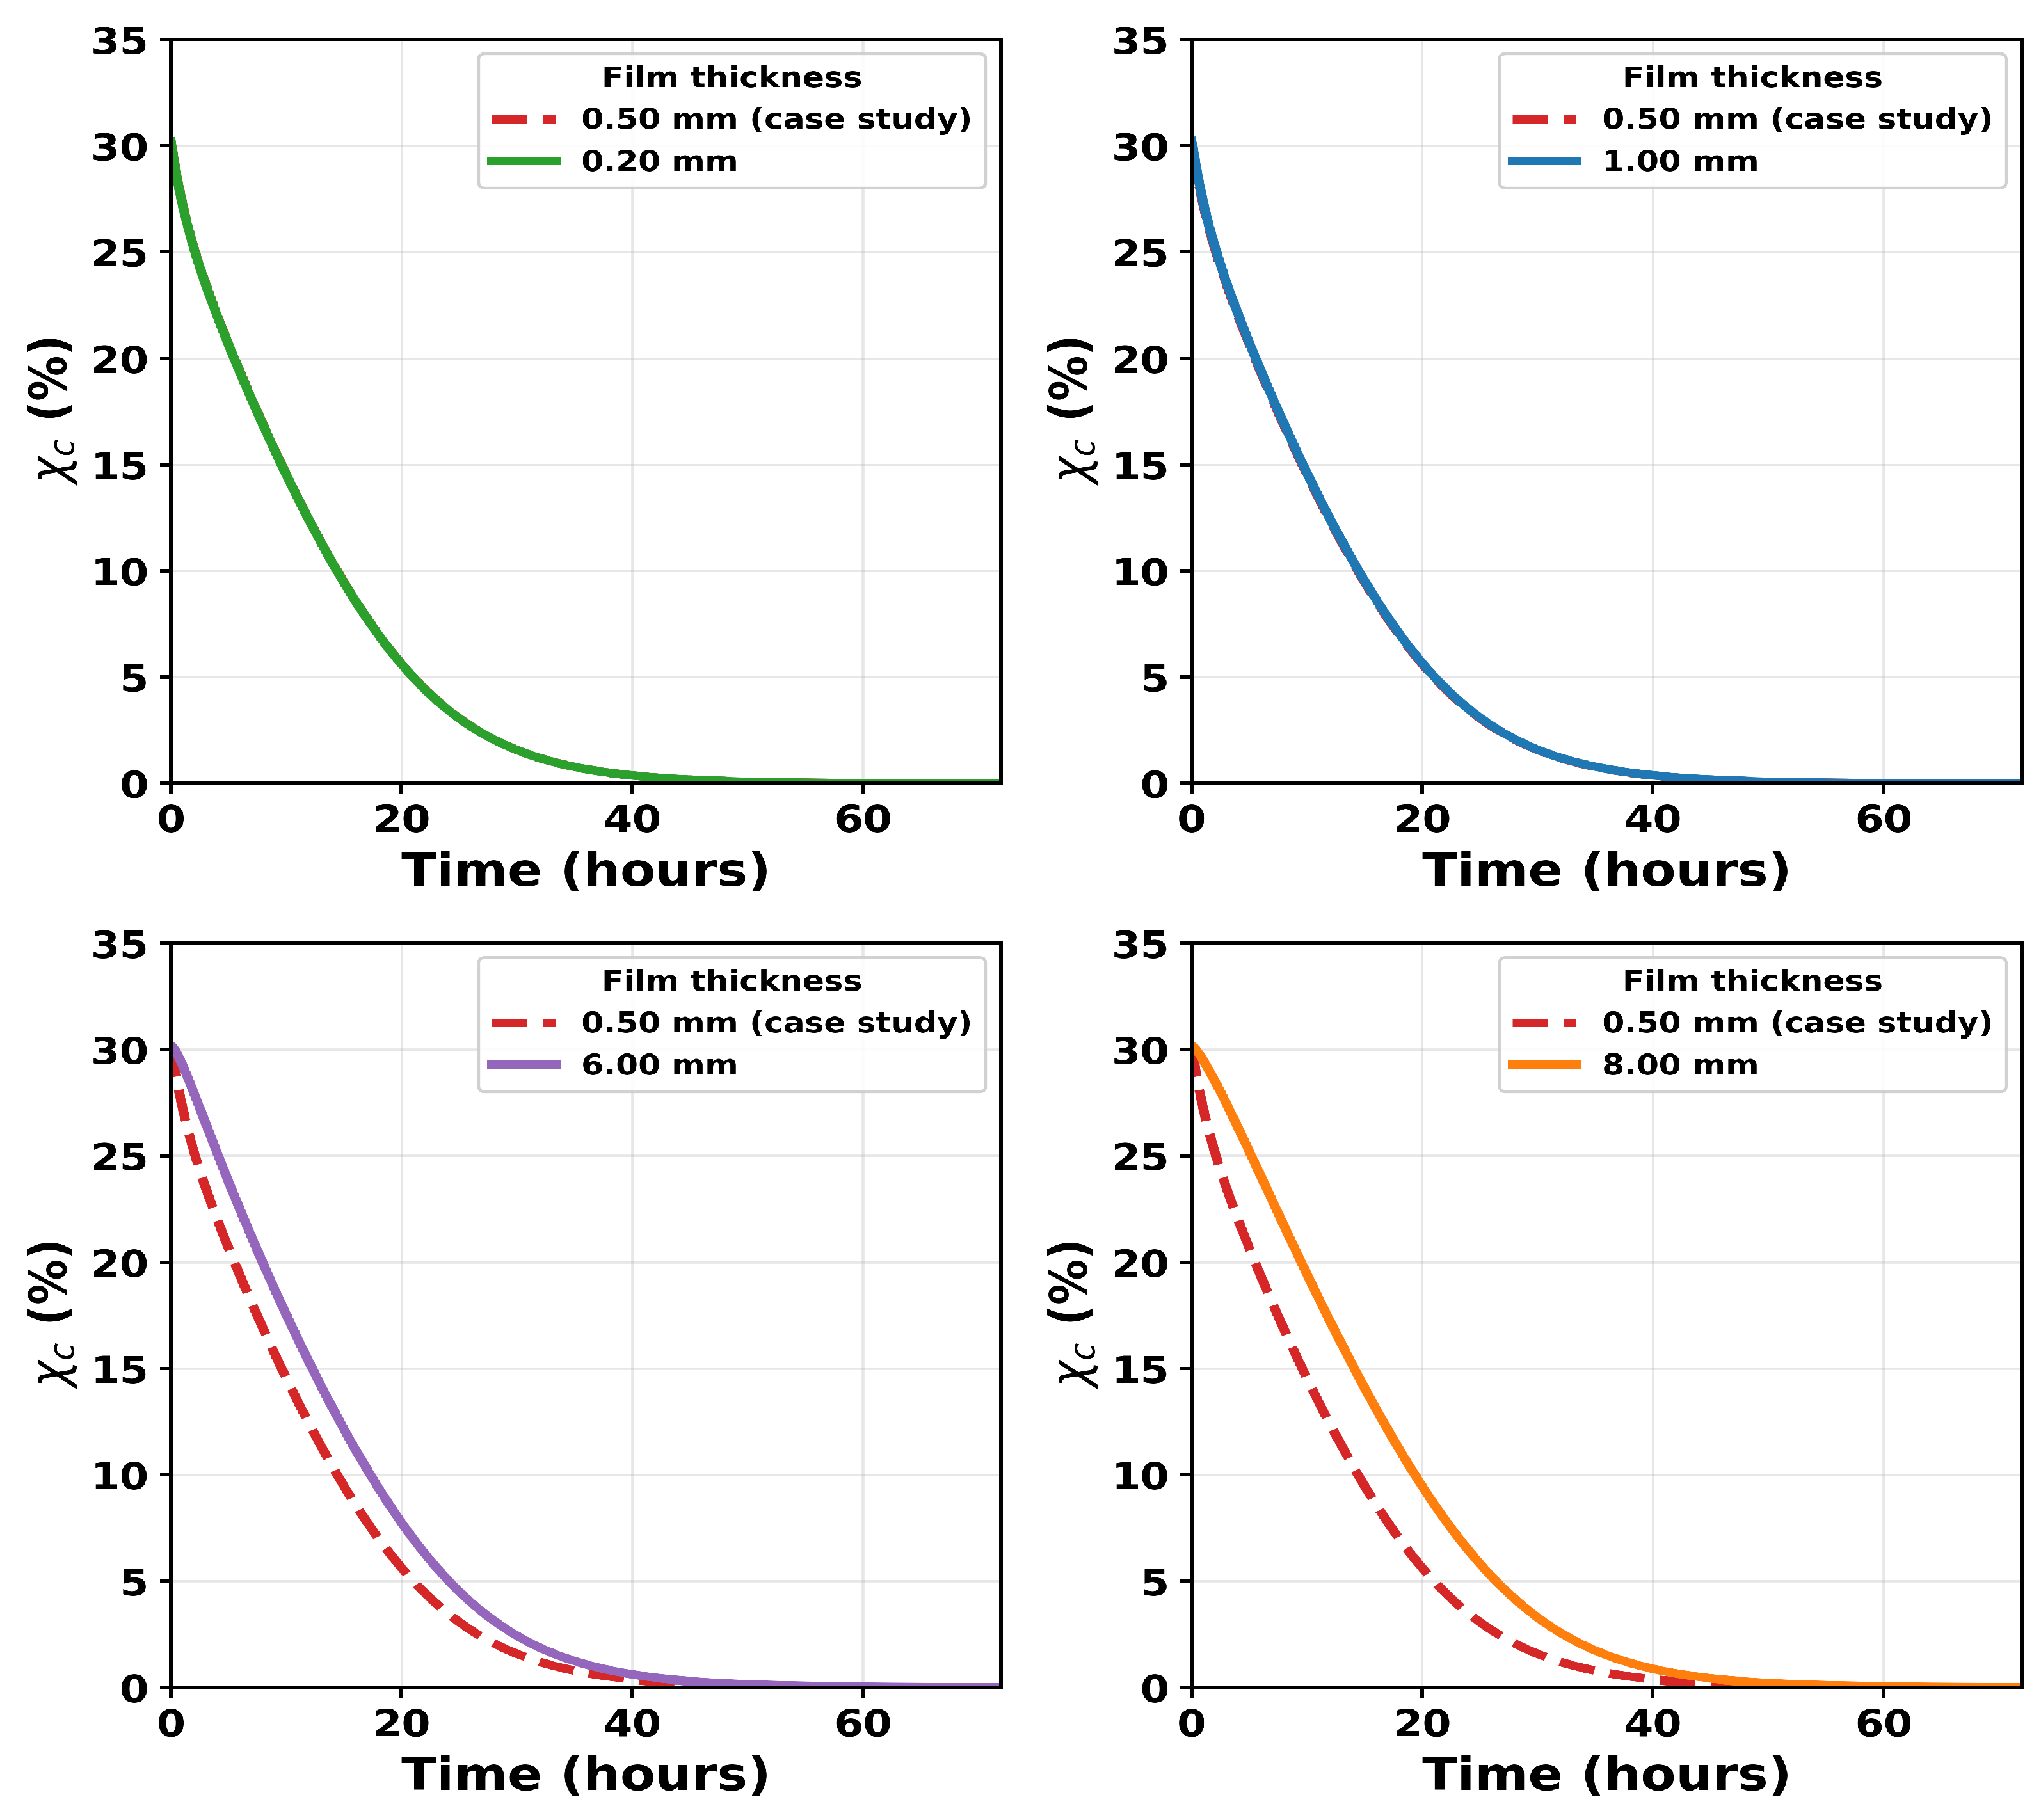
Figure 14 and
Figure 15 show results for
,
,
,
, and
mm, corresponding to full thicknesses of
,
,
,
, and
mm, respectively. The experimental case study of Shi et al. [
16] corresponds to a full thickness of
mm in the model.
To compare reaction and transport, we define Damköhler numbers for the amorphous and crystalline domains:
The Damköhler number is a dimensionless ratio of the catalytic timescale to the diffusion timescale. Since , the amorphous pathway has the shorter characteristic catalytic timescale and therefore governs the onset of diffusion-limited behaviour. The thickness dependence is thus primarily controlled by .
For the thinner films (0.20, 0.50, and 1.00 mm), the predicted weight-loss and crystallinity curves are nearly identical to those of the case study. This indicates reaction-limited behaviour, where enzyme diffusion across the film is much faster than catalytic degradation and the enzyme concentration remains approximately uniform throughout the film. In this regime, the diffusion timescale
is small (approximately
–
h). It should be noted that the uncertainty in
is relatively high (
Figure 8c), so these values should be interpreted as indicative rather than precise.
As thickness increases, the predictions deviate progressively from the case-study curve in both mass loss and crystallinity. Weight loss slows and crystallinity declines more gradually because the enzyme must diffuse further before degradation and amorphisation can proceed in the film interior. At mm (full thickness mm), h, so diffusion is no longer negligible relative to the catalytic timescale and approaches unity. This marks the transition to transport-influenced behaviour.
Below a critical thickness, mass loss and crystallinity evolution are insensitive to film geometry because enzyme diffusion across the film is rapid relative to the catalytic timescale and the film is effectively enzyme-saturated. Above this thickness, further increases in L progressively slow both mass loss and crystallinity evolution because the time required for the enzyme to diffuse into the bulk becomes significant relative to the reaction timescale. To our knowledge, this geometry-dependent transition has not been directly demonstrated experimentally for the enzymatic degradation of PCL, and the present model predictions therefore provide motivation for multi-thickness degradation experiments to validate this behaviour.
In addition to the bulk crystallinity
, the local crystallinity is defined as
which represents the crystalline fraction of the remaining polymer at position
x and time
t. To further examine the internal evolution of the polymer microstructure, the spatial distribution of crystallinity
was evaluated across the film thickness (
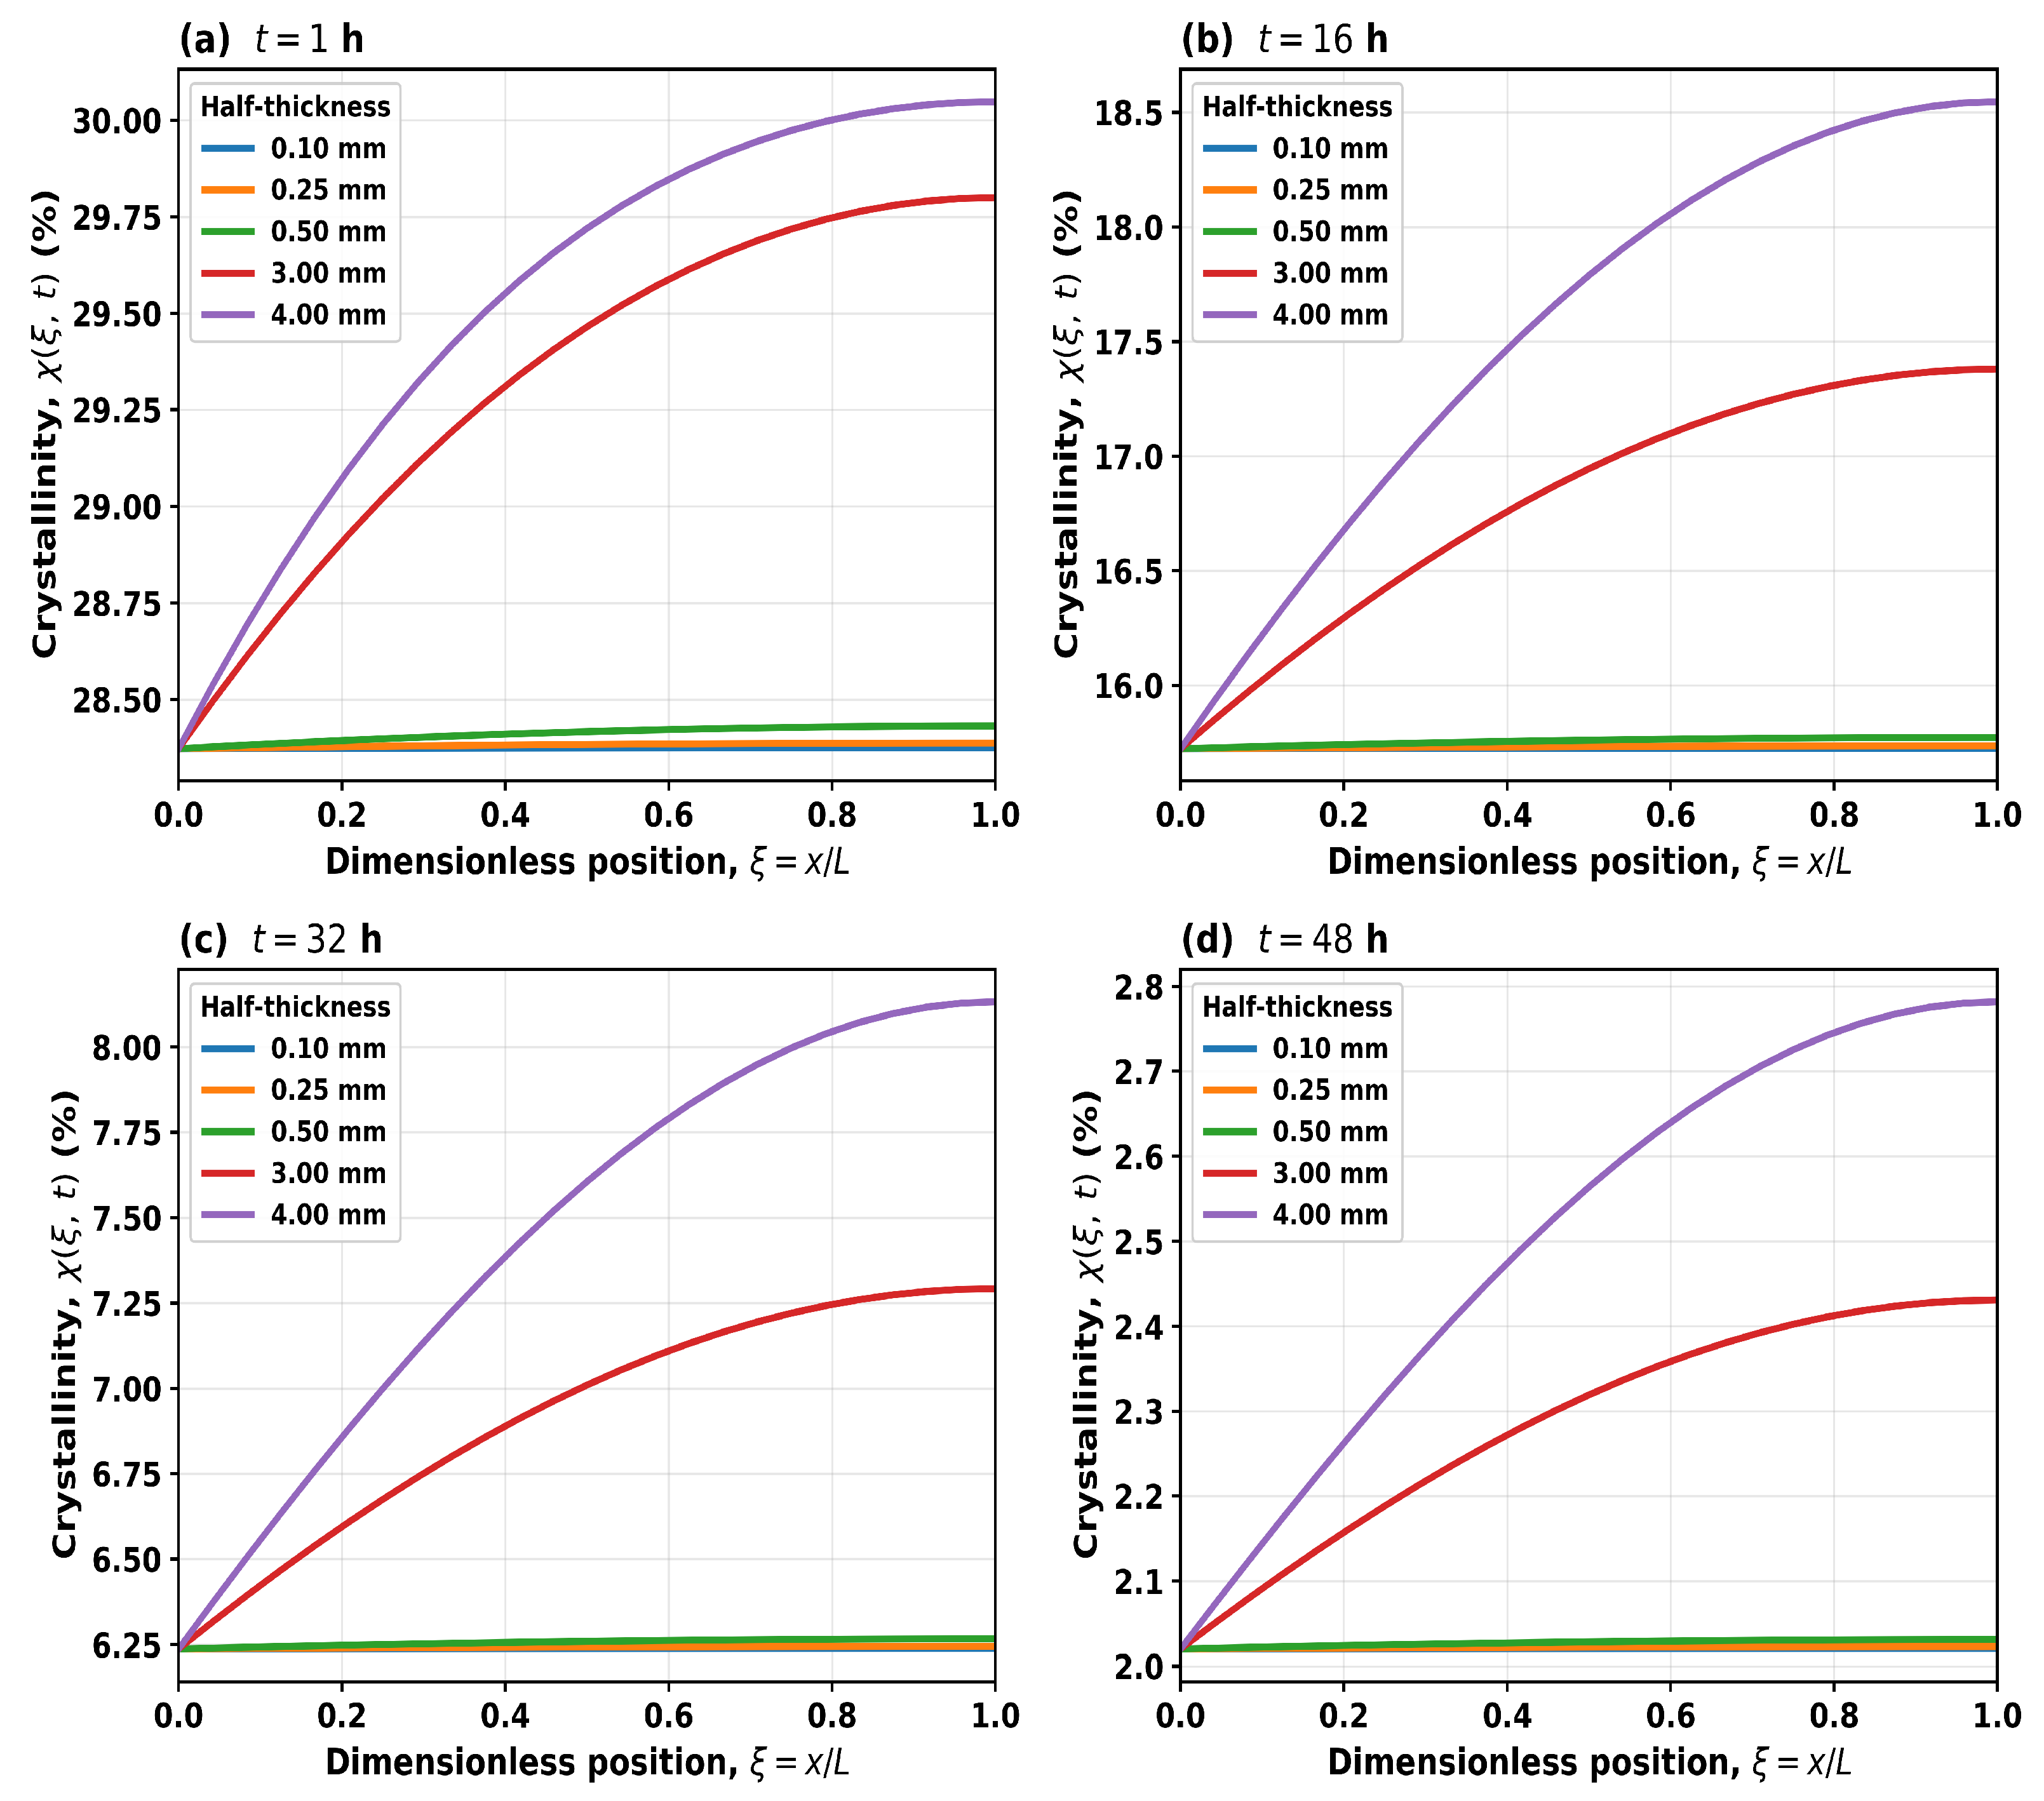
Figure 16). For thin films (
mm), the crystallinity profiles remain nearly uniform across the domain at all times, indicating that enzyme diffusion is sufficiently rapid to maintain an approximately homogeneous enzyme concentration, consistent with a reaction-limited regime.
In contrast, thicker films (
mm) exhibit spatial gradients in
, with higher crystallinity retained in the interior (
) compared to the surface (
). This behaviour reflects a lower enzyme concentration in the core relative to the surface at early stages of degradation, rather than a complete absence of enzyme in the bulk. As degradation progresses, these differences diminish, leading to more uniform profiles at later times. The magnitude of the spatial gradients increases with film thickness, consistent with increased diffusion timescales and corresponding changes in
. These spatial profiles therefore provide mechanistic insight into the transition from reaction-limited to transport-influenced degradation, as also reflected in the global metrics presented in
Figure 14 and
Figure 15.
5. Discussion
This study addresses a key gap in enzymatic degradation modelling of semicrystalline polymers. Existing enzymatic models can reproduce mass-loss trends, but they usually treat the polymer as a single homogeneous state. As a result, they cannot resolve state-selective degradation, evolution of the crystalline fraction over time, or the coupling between transport and microstructural change. The objective of the present work was to overcome this limitation by developing a reaction–diffusion model in which crystalline and amorphous regions are represented separately, and enzyme mobility depends on porosity which increases as degradation proceed. The results show that this framework can reproduce both mass loss and evolution of the crystalline fraction and can therefore address mechanistic questions that cannot be resolved from mass-loss data alone. In semicrystalline polymers, the same mass-loss profile may arise from different underlying mechanisms, including preferential degradation of the amorphous state, more balanced attack on both states, or disruption of crystalline domains before complete hydrolysis. By incorporating crystallinity as a second response, the model distinguishes between these possibilities and provides a more informative description of the degradation mechanism. The amorphisation rate estimated from the data supports the interpretation that Candida antarctica lipase does not act only on the amorphous fraction.
The model also provides a mechanistic explanation for the experimentally observed degradation profile, supported by good agreement with both the weight-loss and crystallinity data. The main discrepancy is localised around 24 h, where the model does not reproduce the short plateau in the crystalline fraction seen in the experimental data. This plateau, which is absent from the weight-loss data, may be due to heterogeneity in the accessibility of the crystalline regions, with those with more loosely packed lamellae being disrupted more quickly by the enzyme. Alternatively, as degradation produces highly mobile short-chain oligmers, these may form new crystalline regions which temporarily offset the amorphisation process.
The posterior summaries indicate that the kinetic parameters are better constrained by the data than the diffusion parameter. This is consistent with the case-study geometry, since the thin films used by Shi et al. [
16] operate in a regime where enzyme transport is rapid relative to catalytic degradation. Under such conditions, the mass loss and crystalline fraction measurements carry little information about the transport timescale. This has a clear implication for designing future experiments with the aim of accurate identification of both reaction and diffusion parameters. In such cases, it would be beneficial to conduct the degradation experiment on a thicker film, which will ensure the timescale for enzyme diffusion is significant relative to the timescale for the degradation reaction. The sensitivity analysis reveals how the relative importance of kinetic mechanisms shifts across the degradation timeline. Catalytic degradation of the amorphous state is the dominant main effect at early stages, while enzyme binding becomes increasingly significant at later stages through its interaction with the catalytic step. These results provide mechanistic insight into which mechanisms govern each stage of degradation.
The thickness study identifies a transition between reaction-limited and transport-influenced degradation. Below a certain threshold thickness, the predicted weight-loss and crystallinity curves are almost unchanged as thickness varies, showing that enzyme diffusion is fast relative to reaction and that geometry has little influence on the overall degradation timescale. For thicknesses above this threshold, enzyme penetration into the interior becomes limiting, and the model predicts slower mass loss and a more gradual decline in crystallinity as a result. Since the design thickness of a bioresorbable film would be determined by mechanical requirements, these predictions are relevant to anticipating how a given geometry will behave in service. This includes both the rate of mass loss and the evolution of the crystalline fraction, which together govern how the mechanical properties of the device change over time during resorption.
The one-dimensional formulation is appropriate for the thin-film geometry studied here, where through-thickness gradients dominate, and lateral variations at the edges can be neglected. In thicker or more compact geometries, or whenever edge effects and lateral transport are significant, a two-dimensional or three-dimensional model would be needed. The linear porosity–diffusivity relation is also a simplifying approximation of how the porosity of the film evolves during degradation. While the assumption that the soluble products are cleared instantaneously is justified for thin film, and well-mixed systems of [
16], this may not hold in thicker geometries or in vivo, where local product accumulation could engage product-inhibition kinetics [
25,
28,
38]. The optimal degradation condition depends on the specific application and is governed by a combination of material properties and enzymatic conditions. In particular, geometry influences transport: thinner films tend to allow rapid enzyme penetration and may exhibit bulk degradation, whereas thicker materials are more likely to show more surface-localised behaviour. However, the degradation regime also depends on the enzyme mechanism, as different enzymes (e.g., lipases versus cutinases) can induce markedly different erosion behaviours even for the same material. In addition, material properties such as molecular weight can influence degradation behaviour and may affect the identified kinetic and transport parameters. The present model is calibrated to a specific PCL material and experimental dataset, and the fitted parameters should therefore be interpreted as effective parameters for this system. Extension of the framework to different materials or molecular weights would likely require not only recalibration but also potential reformulation of the model structure to reflect differences in degradation mechanisms. For example, this may include removing the amorphisation step or incorporating additional processes such as recrystallisation, depending on the material behaviour. The Shi et al. [
16] study used a single thin-film geometry, in which enzyme diffusion is fast relative to reaction. Therefore, the data carry little information on the diffusion term, and hence its broader posterior (
Section 3.2). With no thicker-film data available in [
16], the role of thickness was instead explored predictively using the identified parameters (
Section 4.2).
Extension of the model to in vivo settings, where local pH and temperature may vary within physiologically relevant ranges and could modulate enzyme activity, would require explicit coupling of these environmental variables to the reaction kinetics and enzyme transport, and is a natural direction for future work.