
Exploring the Characteristics of Carbon Structures Obtained from LignoBoost Lignin

 , , ,
, , ,  , ,
, ,  and
and
Abstract
1. Introduction
2. Materials and Methods
2.1. Reagents
2.2. Obtaining of LCM
2.3. Characterization of LCMs
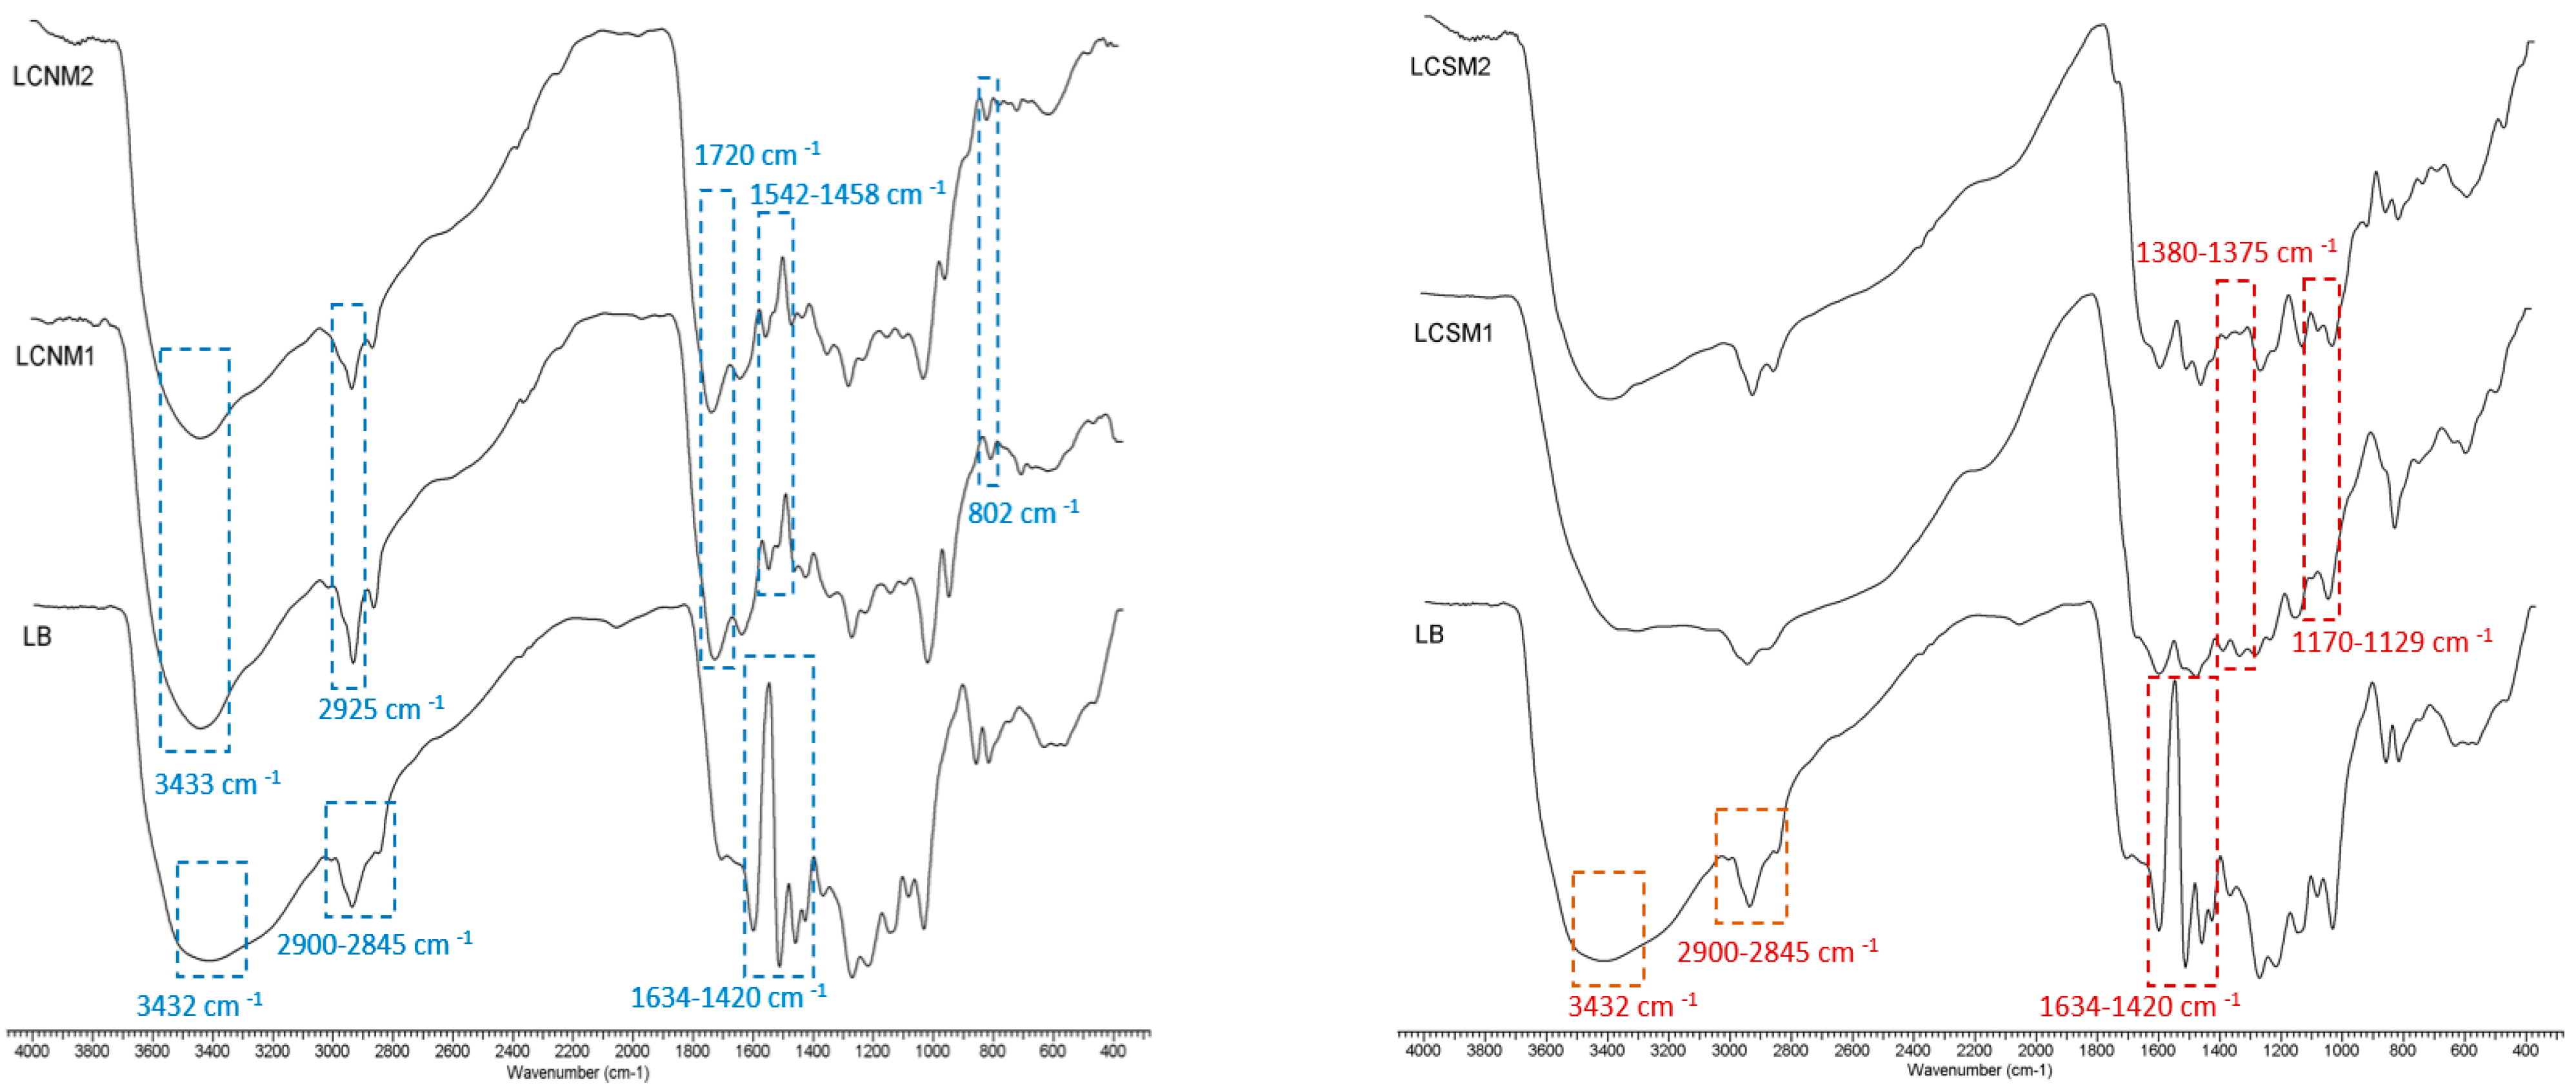
2.3.1. Fourier Transform Infrared Spectroscopy (FTIR)
2.3.2. X-Ray Photoelectron Spectrometry (XPS)
2.3.3. Dynamic Light Scattering (DLS) and Zeta Potential
2.3.4. Dynamic Vapor Sorption (DVS)
2.3.5. X-Ray Diffraction
2.3.6. Fluorescence Properties
2.3.7. Fluorescence Imaging
2.3.8. Scanning Transmission Electron Microscopy (STEM)
3. Results
3.1. FTIR Spectra
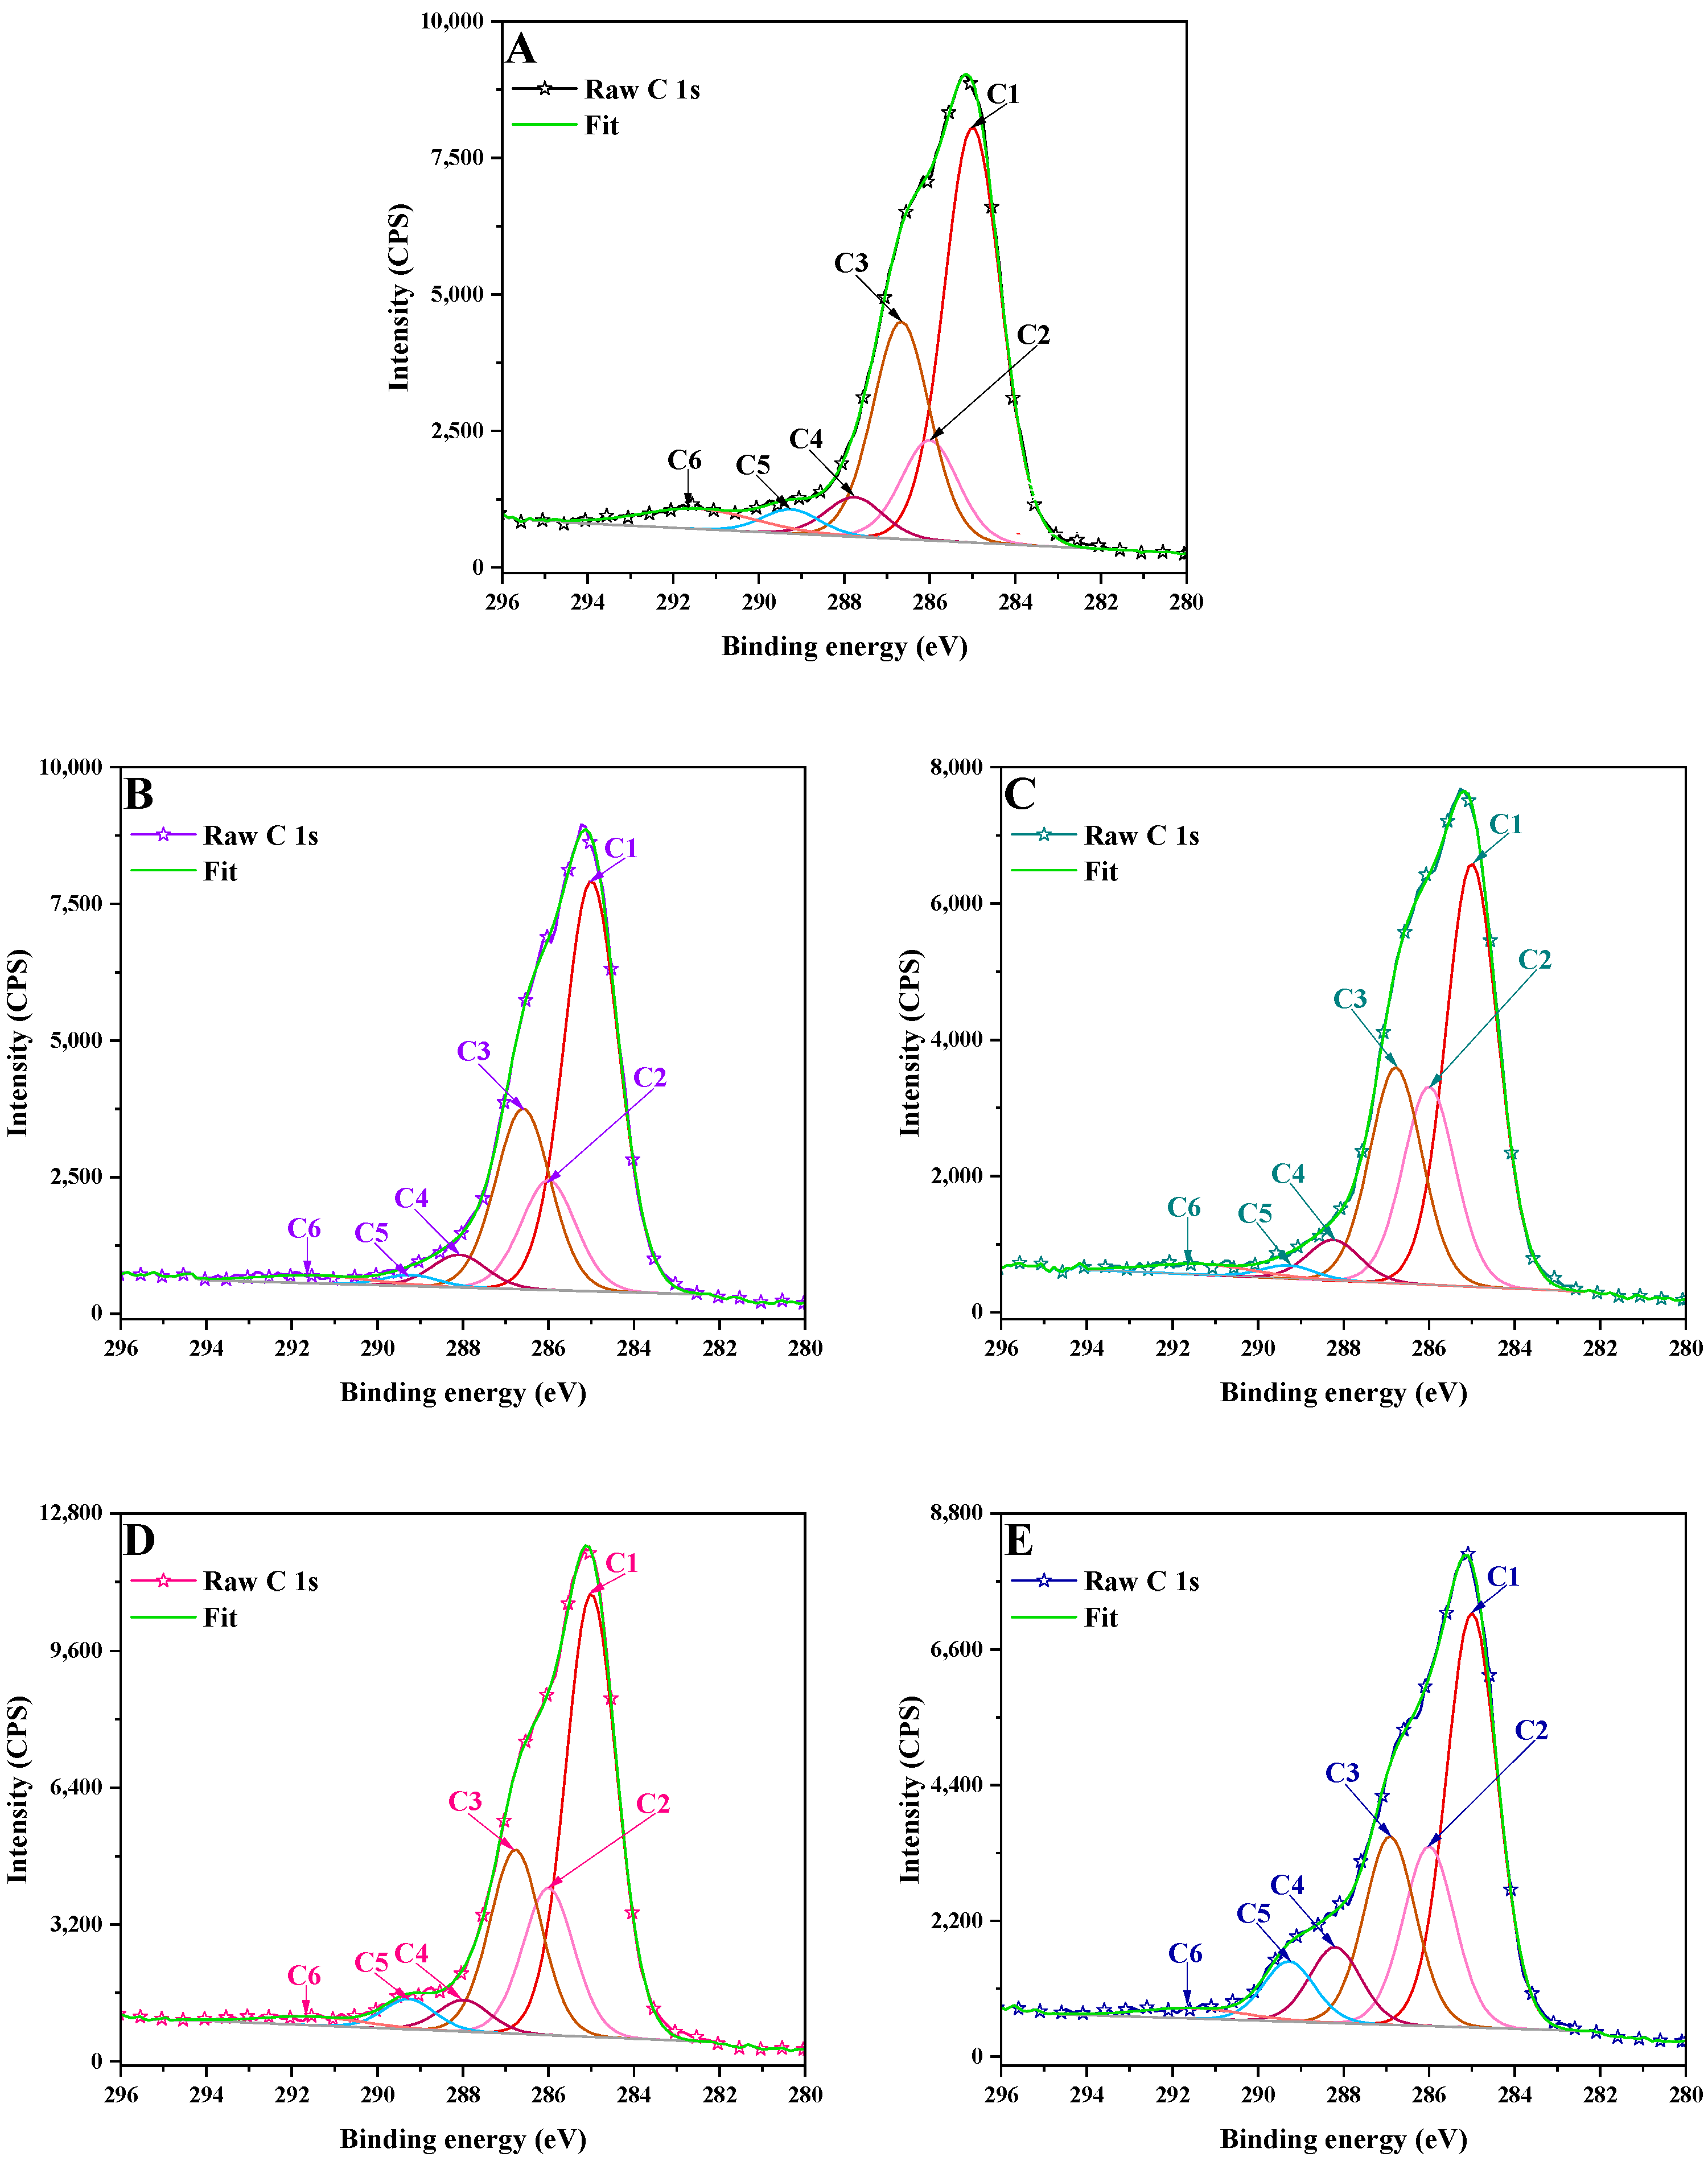
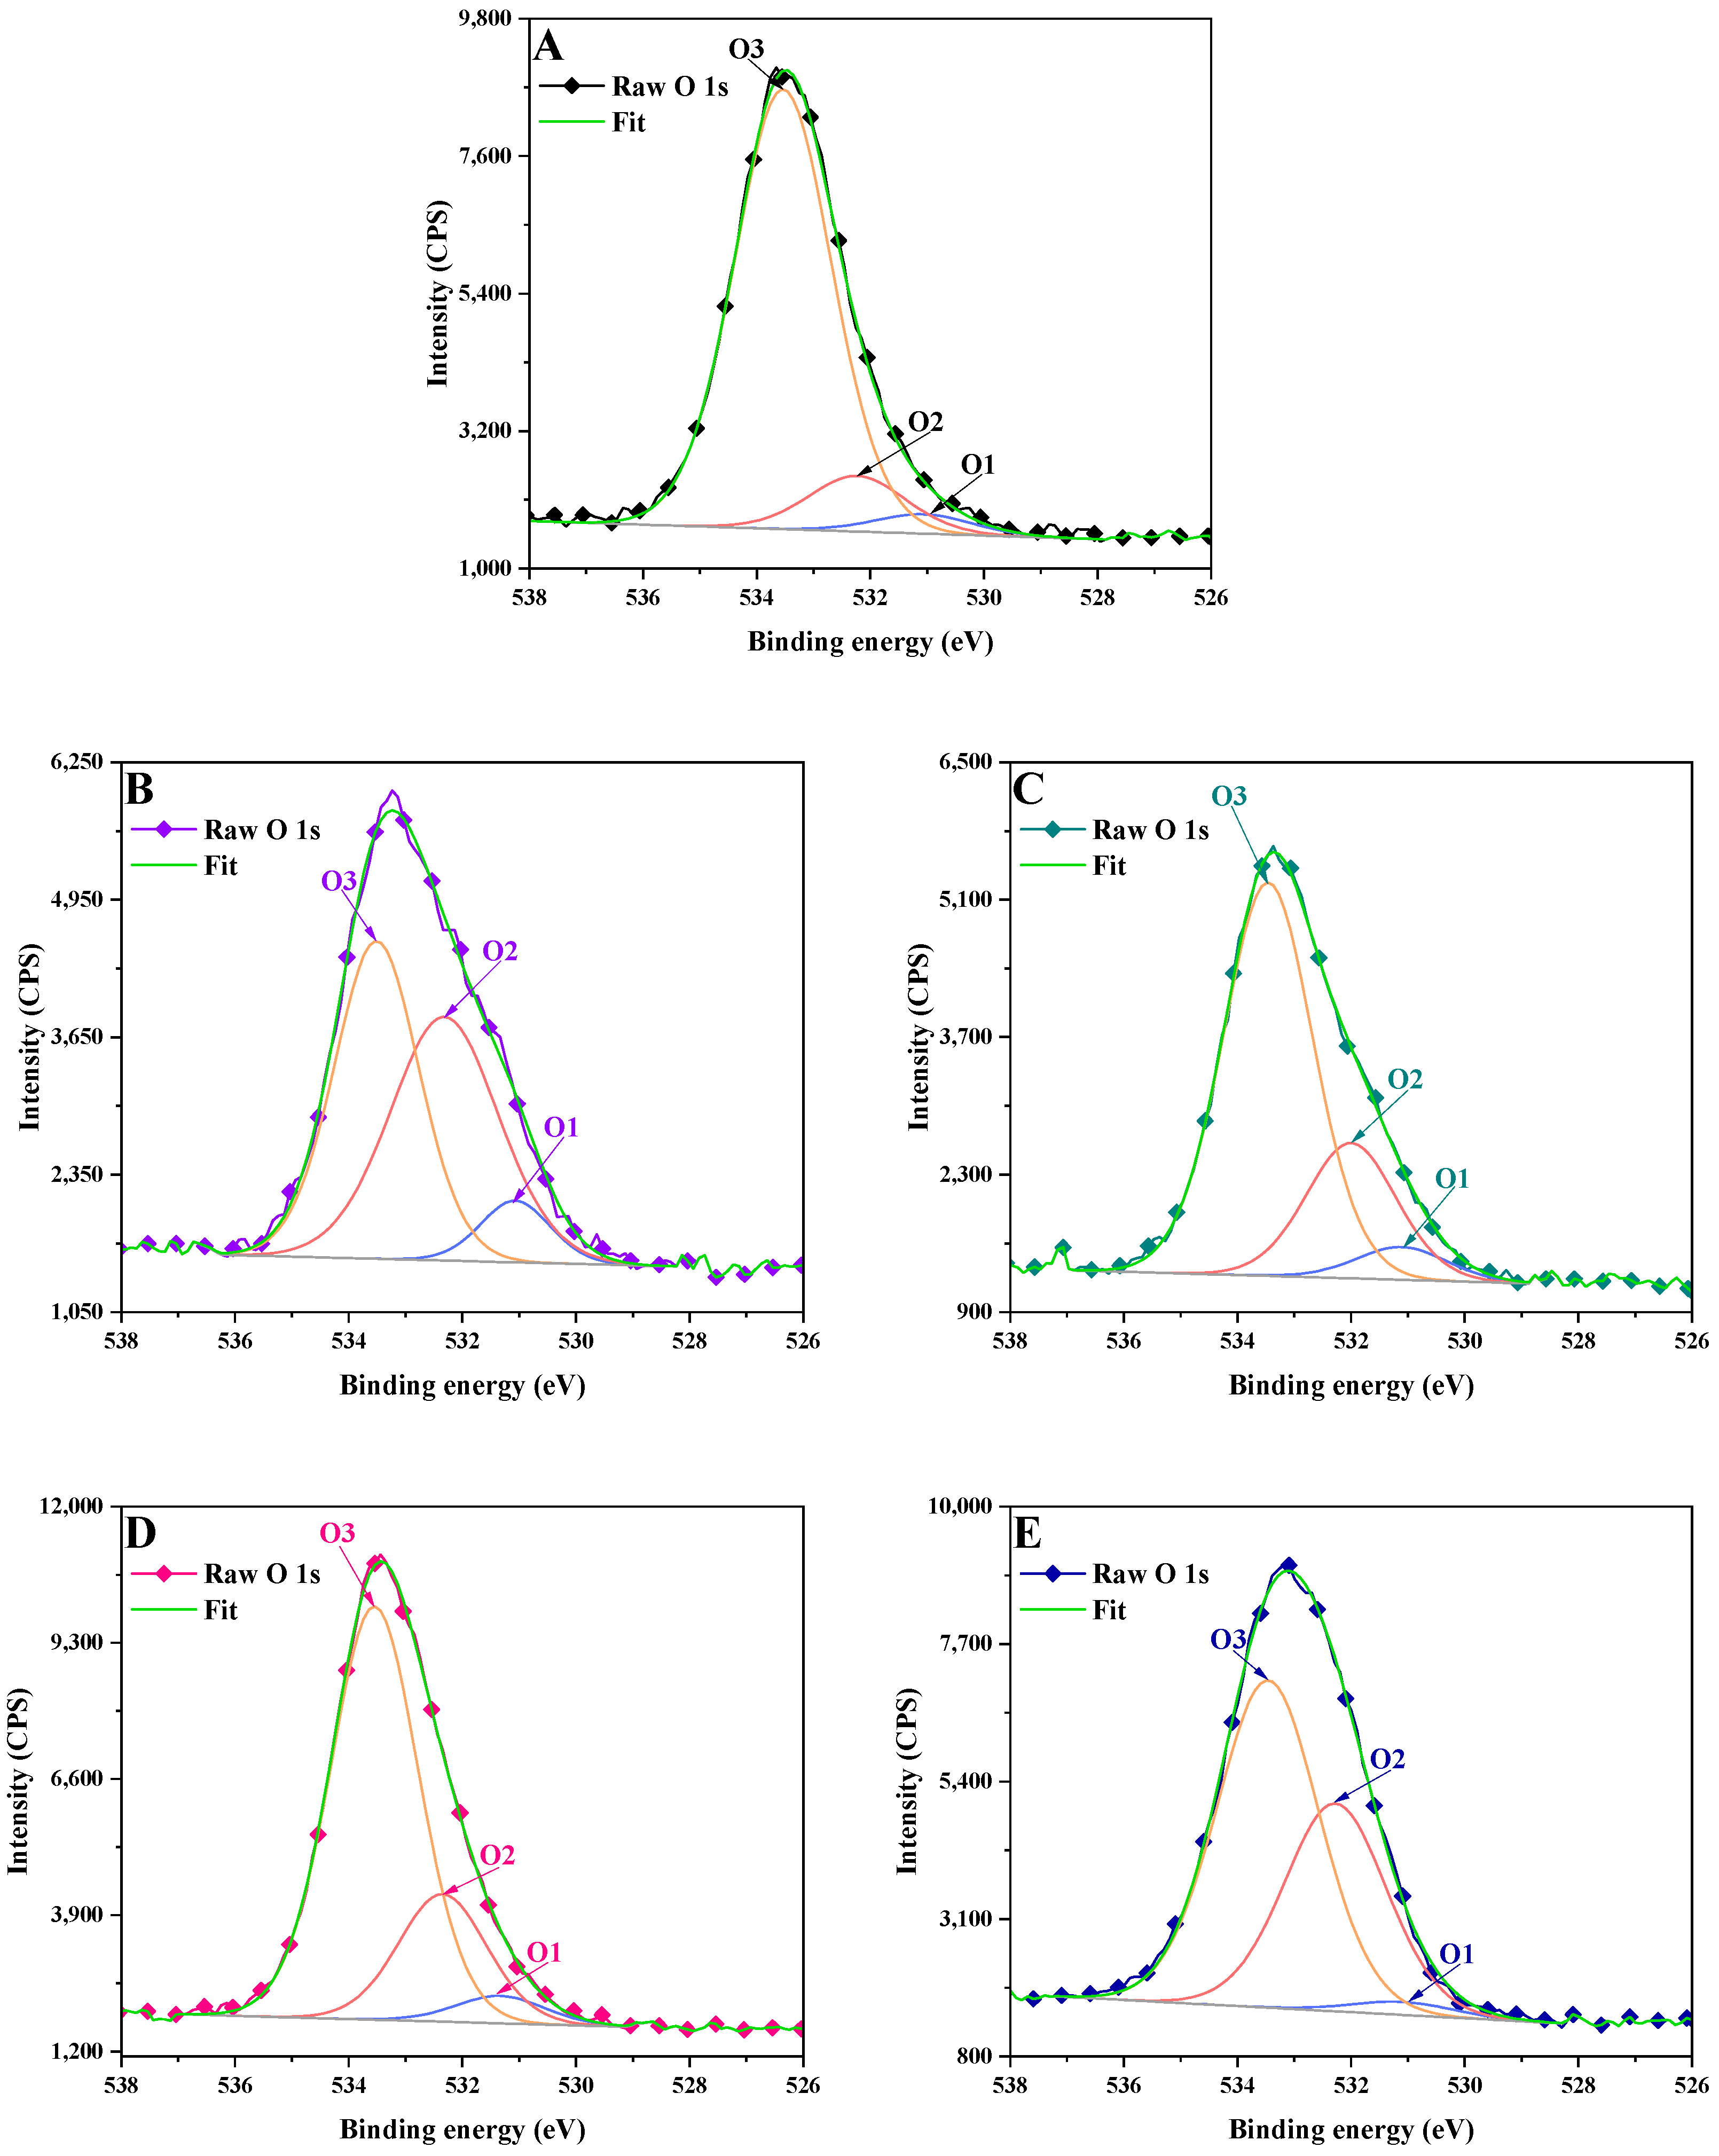
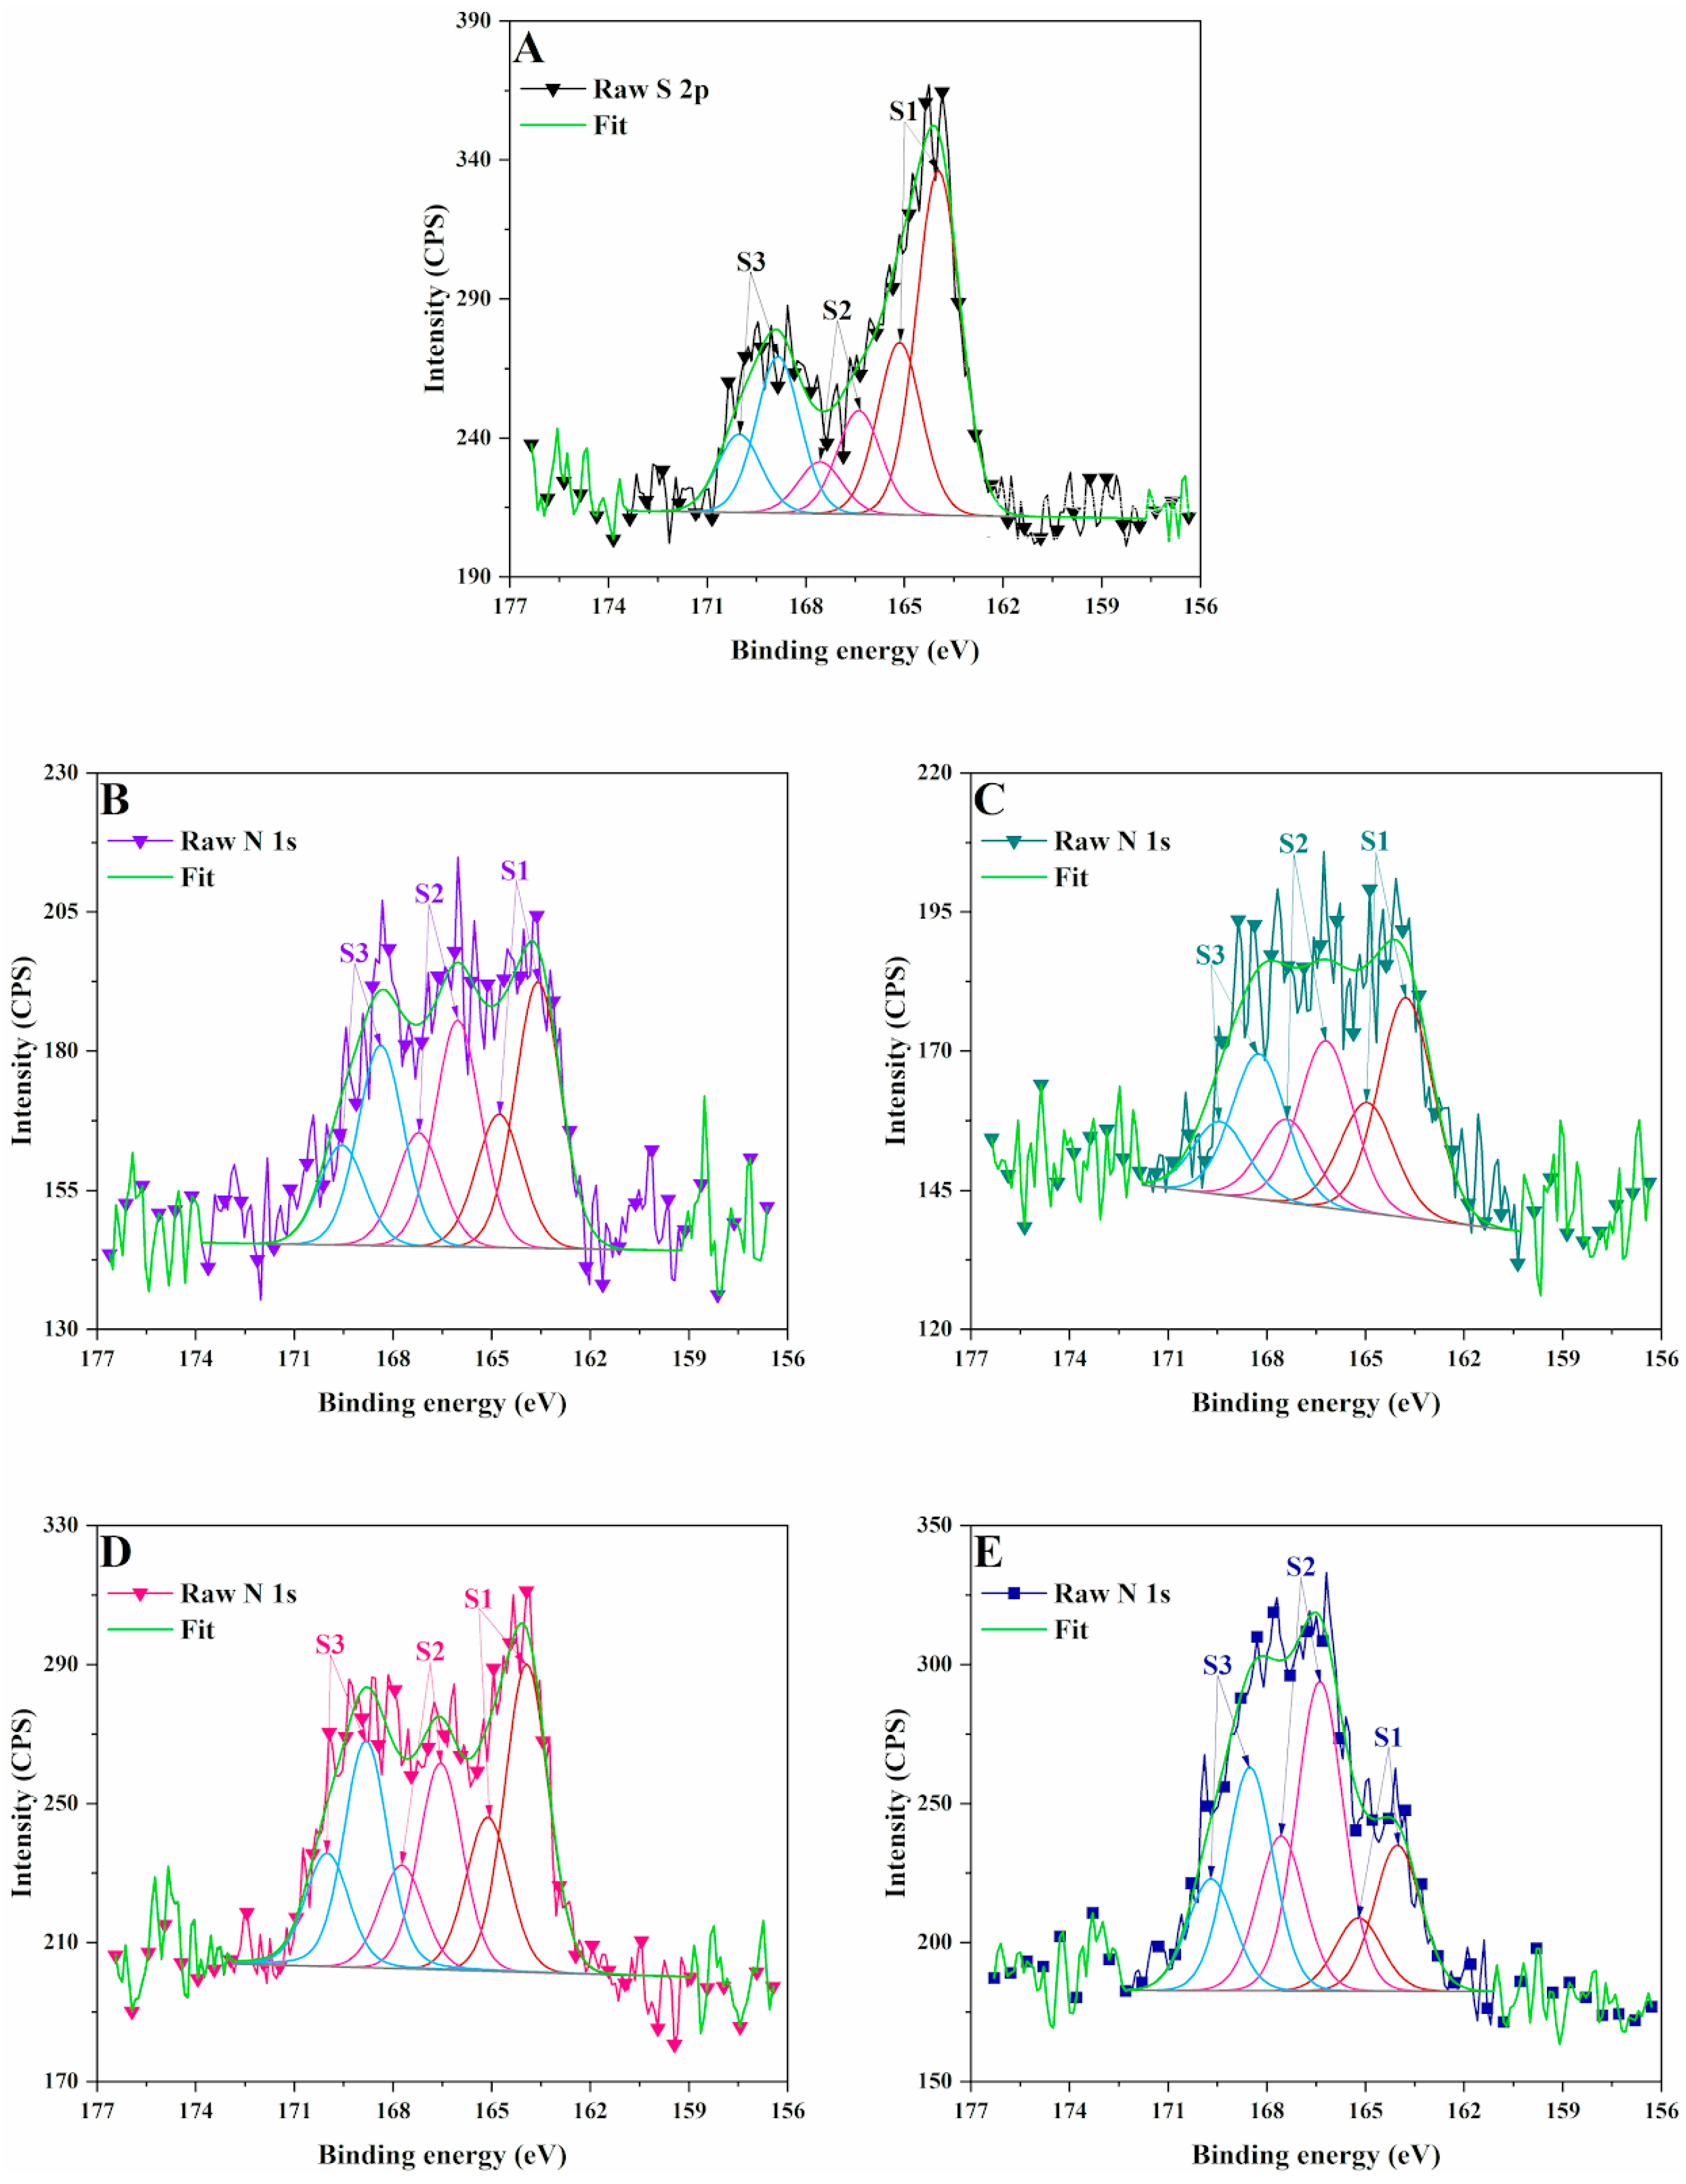
3.2. X-Ray Photoelectron Spectrometry (XPS)
3.3. Dynamic Light Scattering
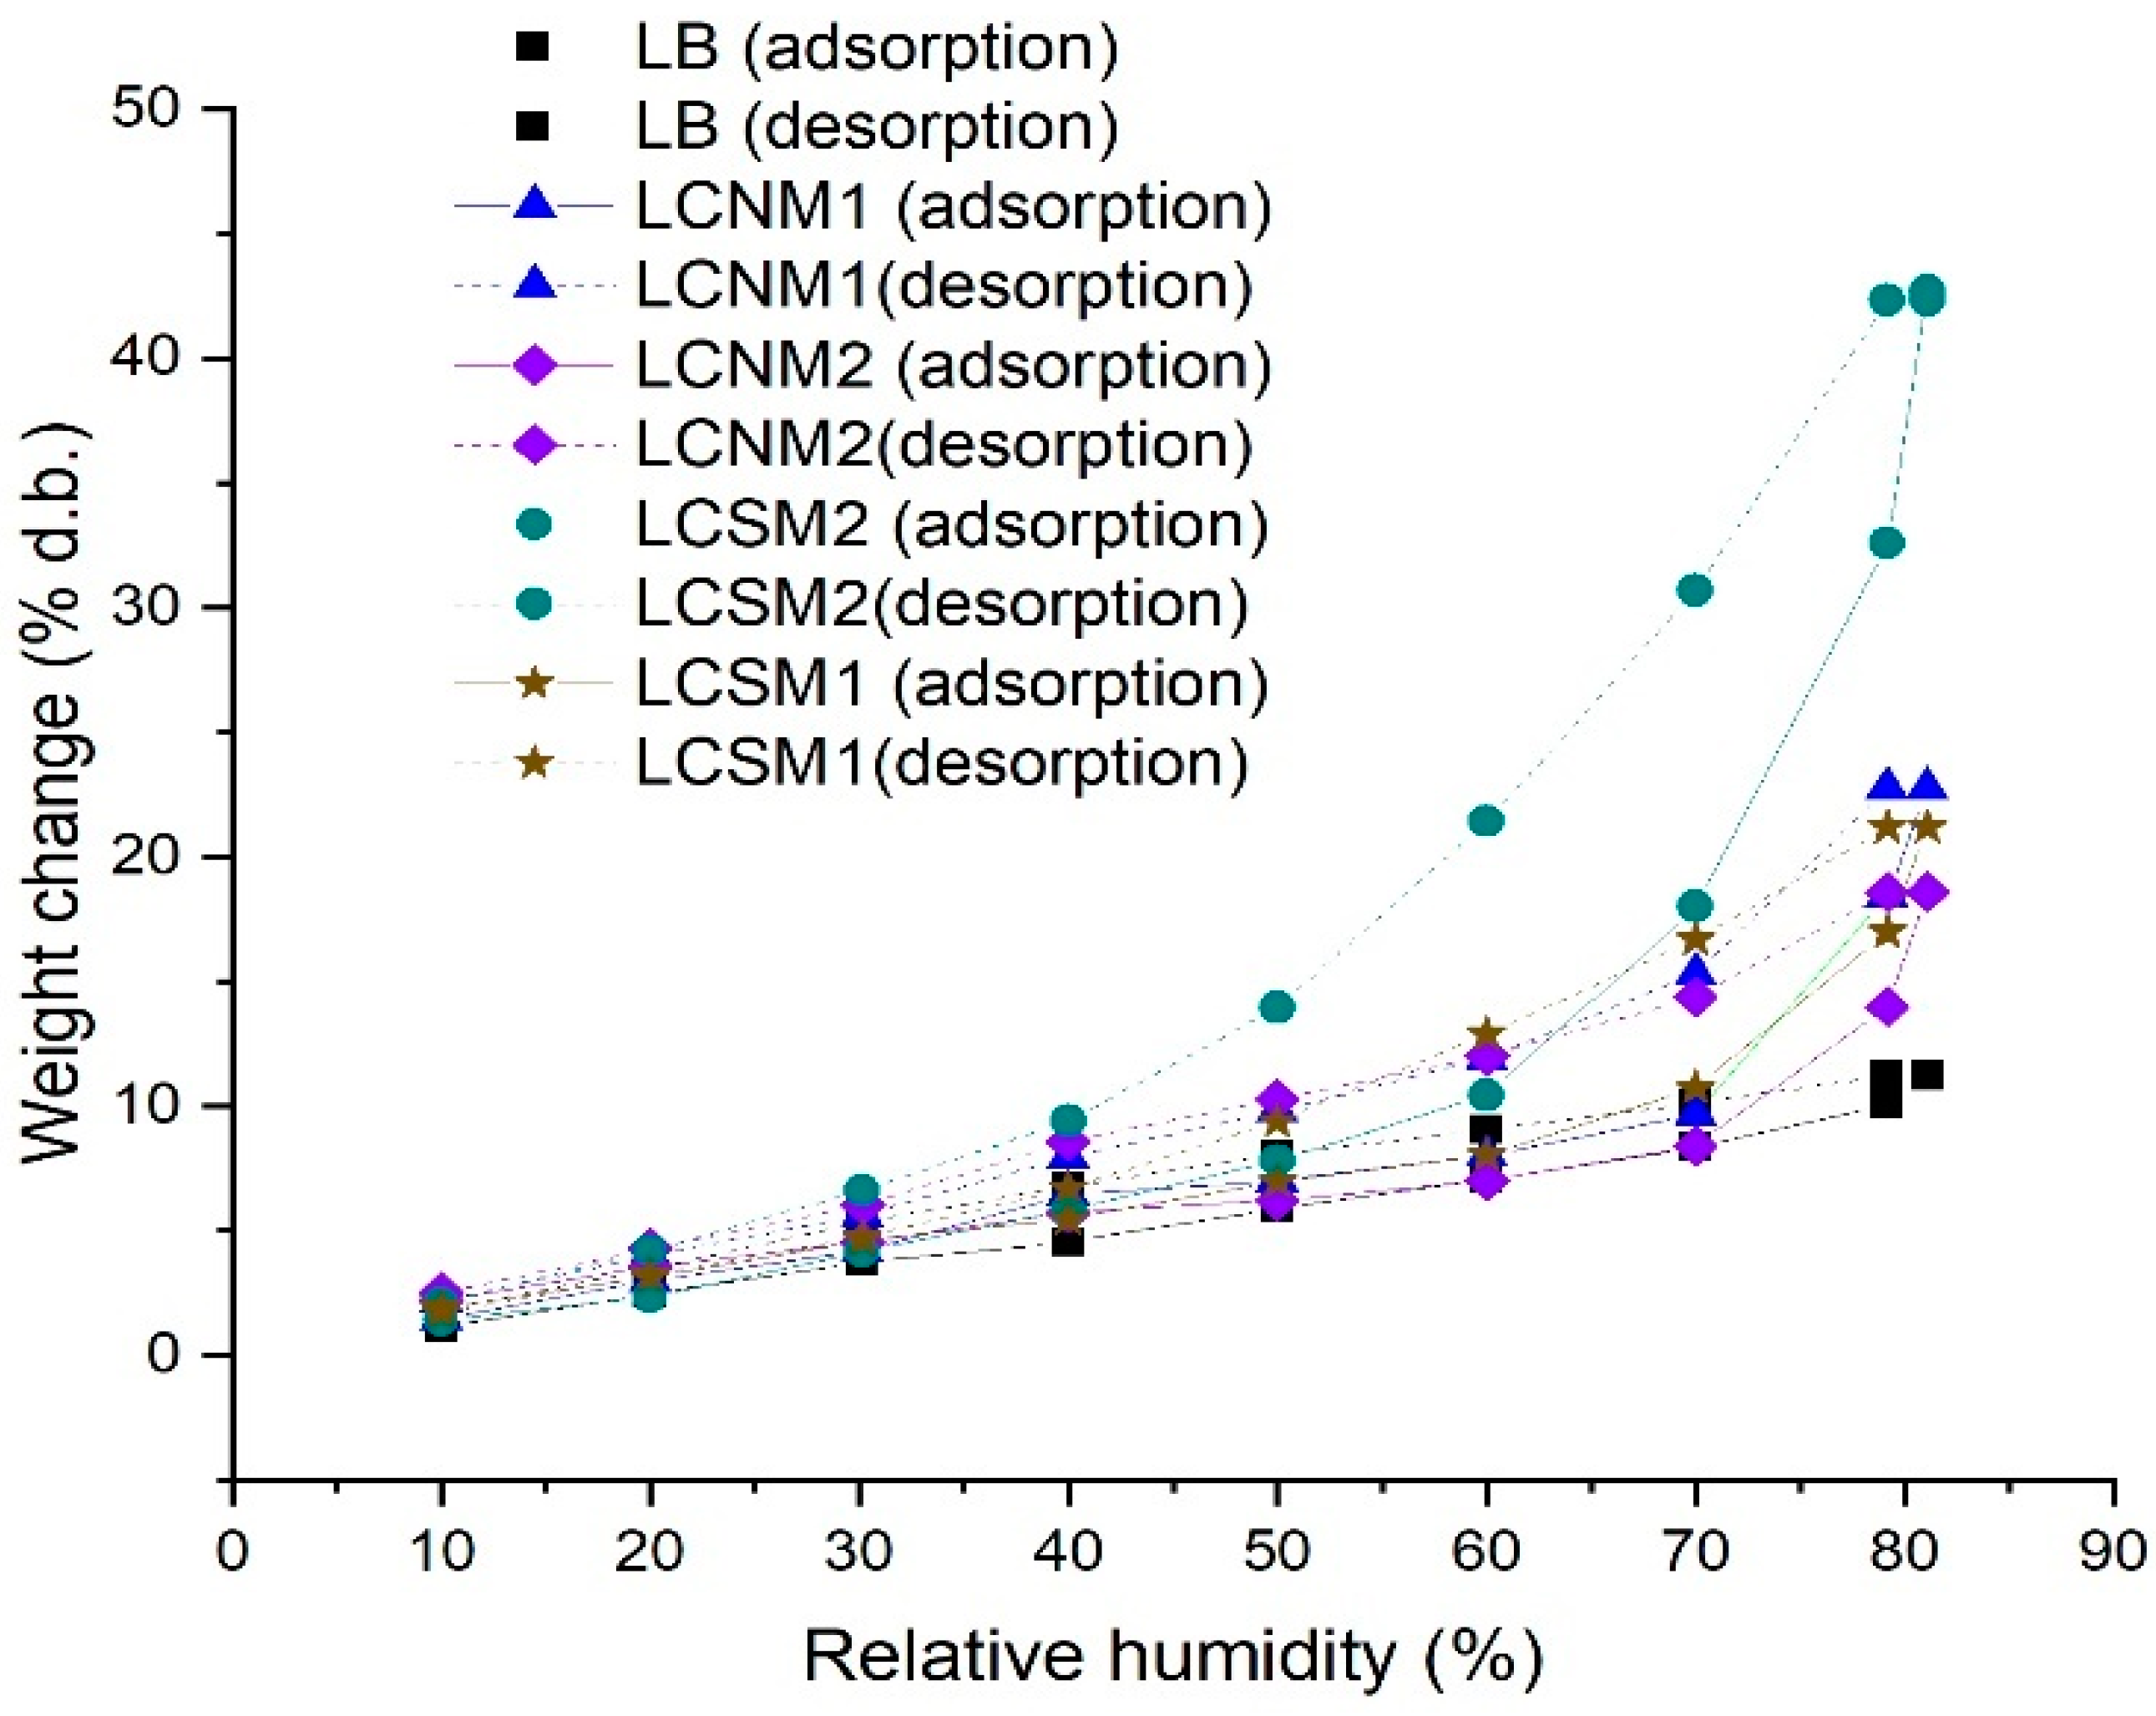
3.4. Dynamic Vapor Sorption
3.5. X-Ray Diffraction
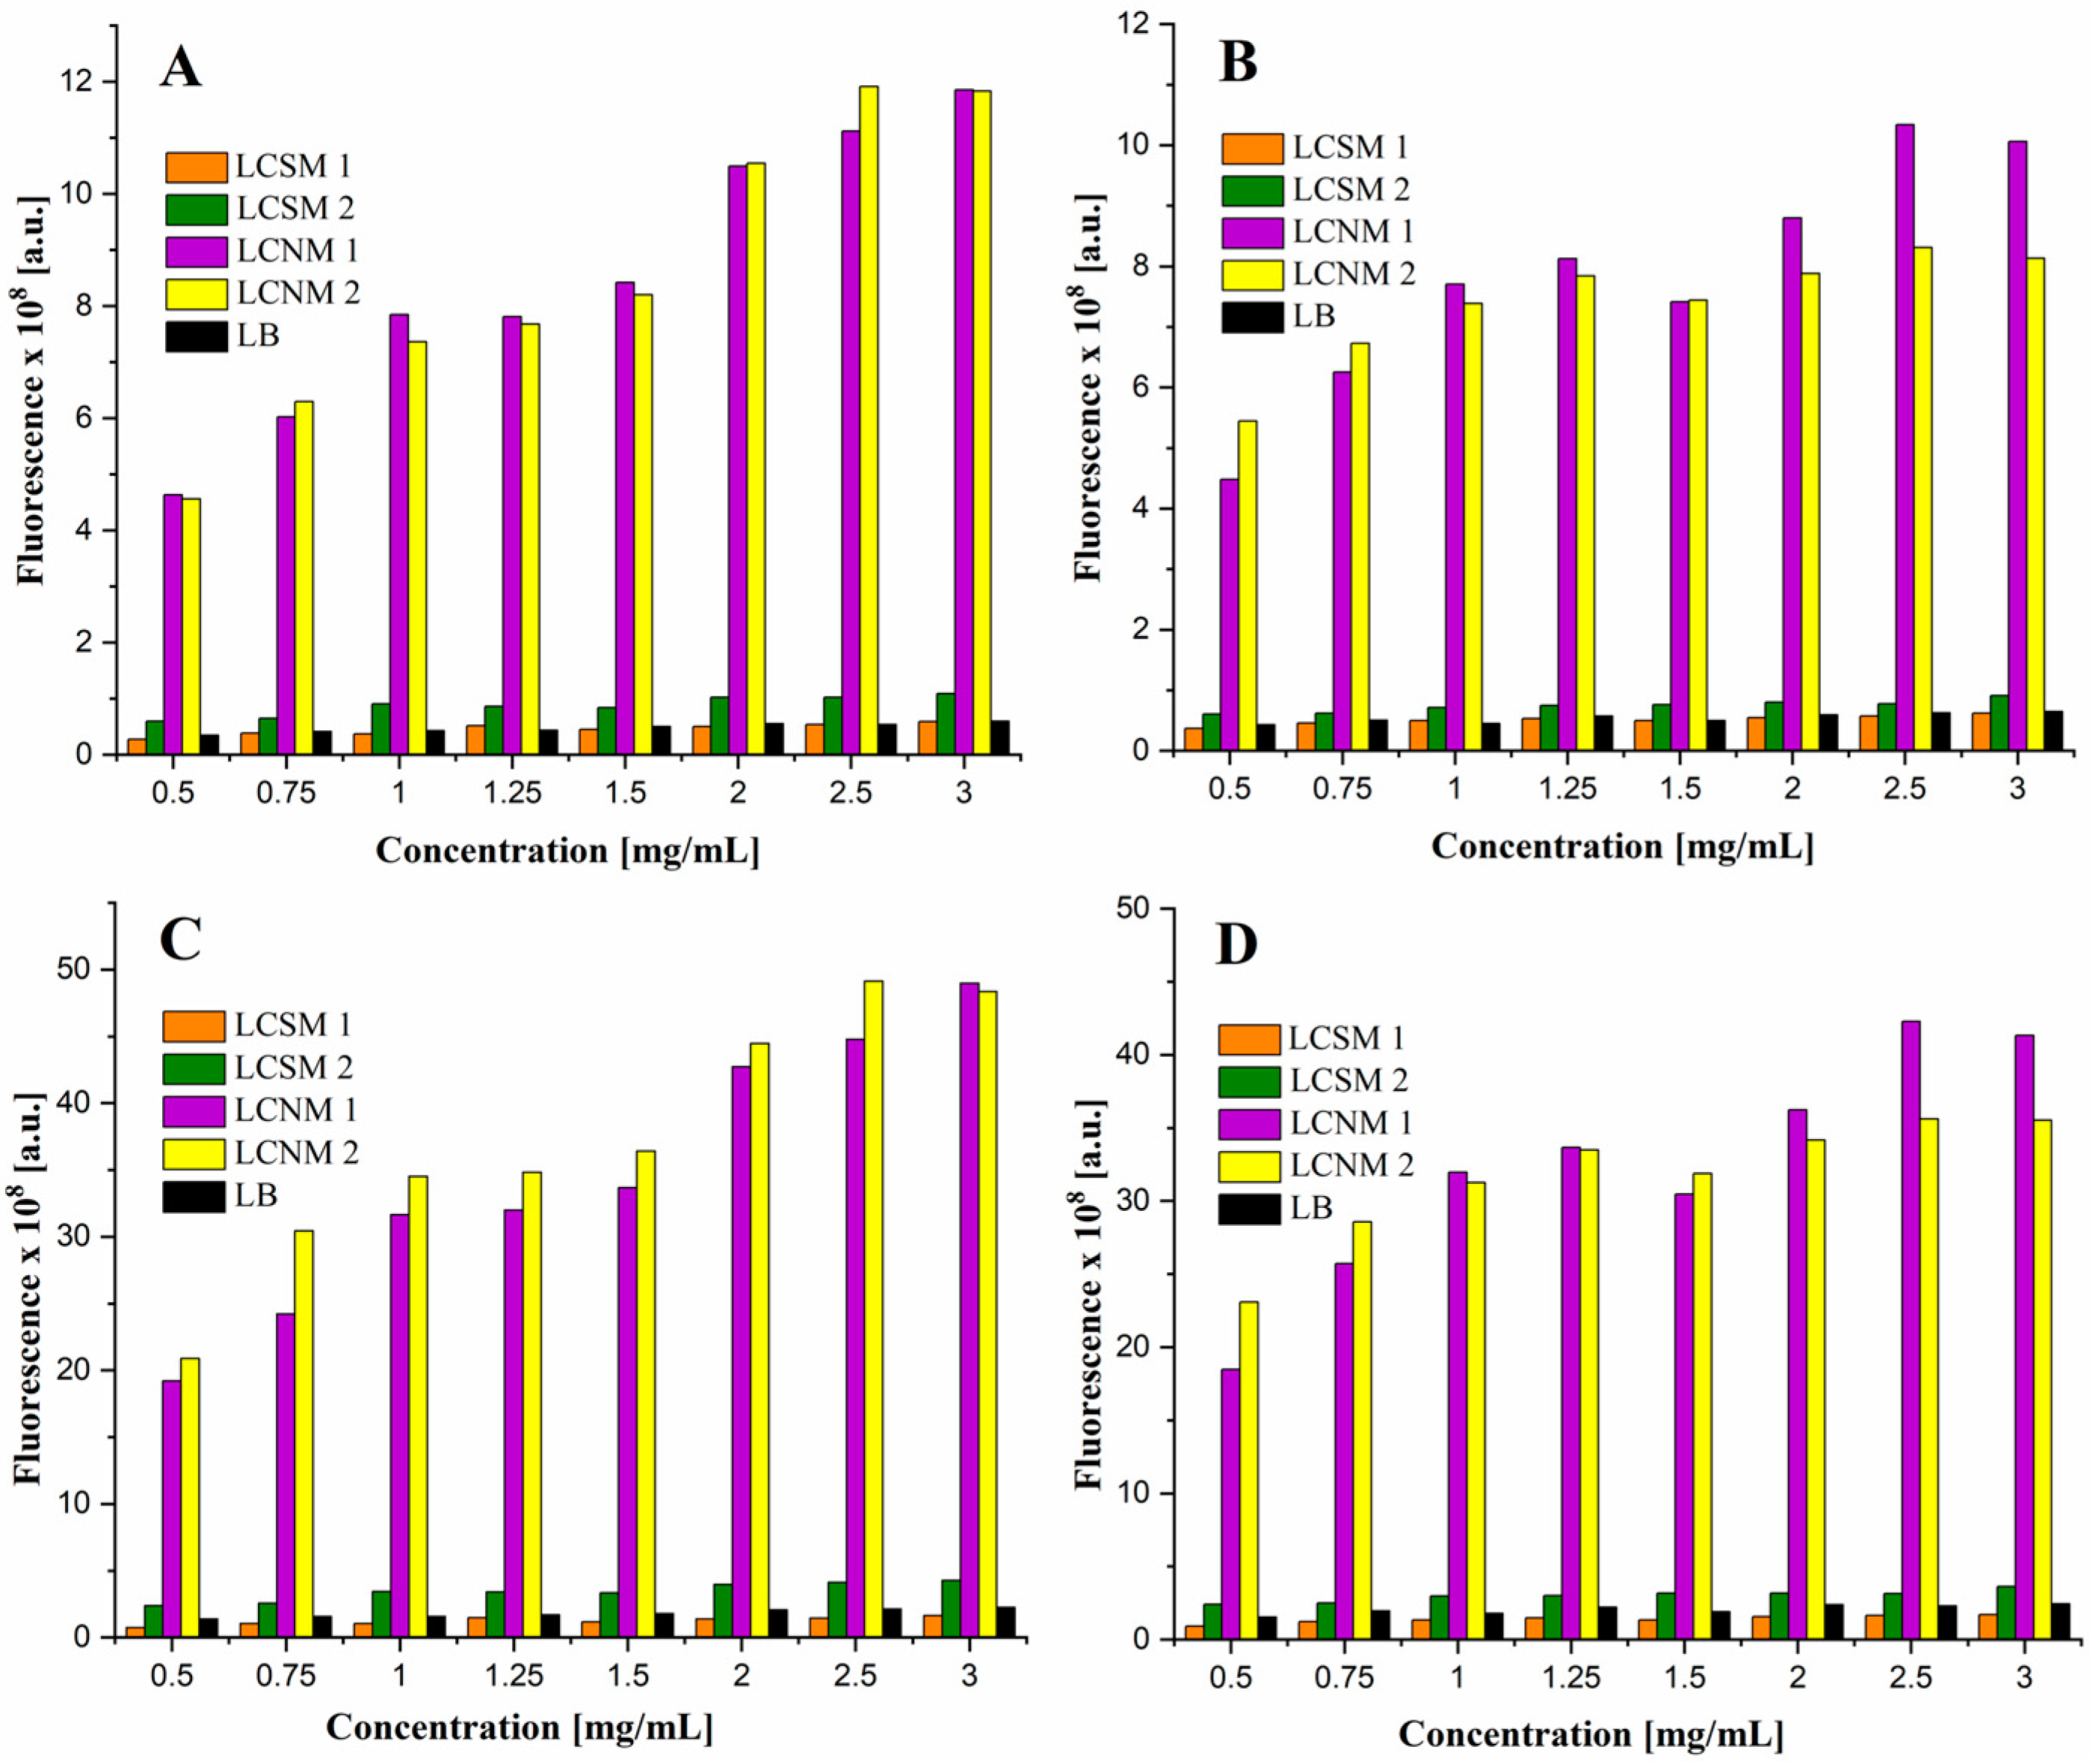
3.6. Fluorescence Properties
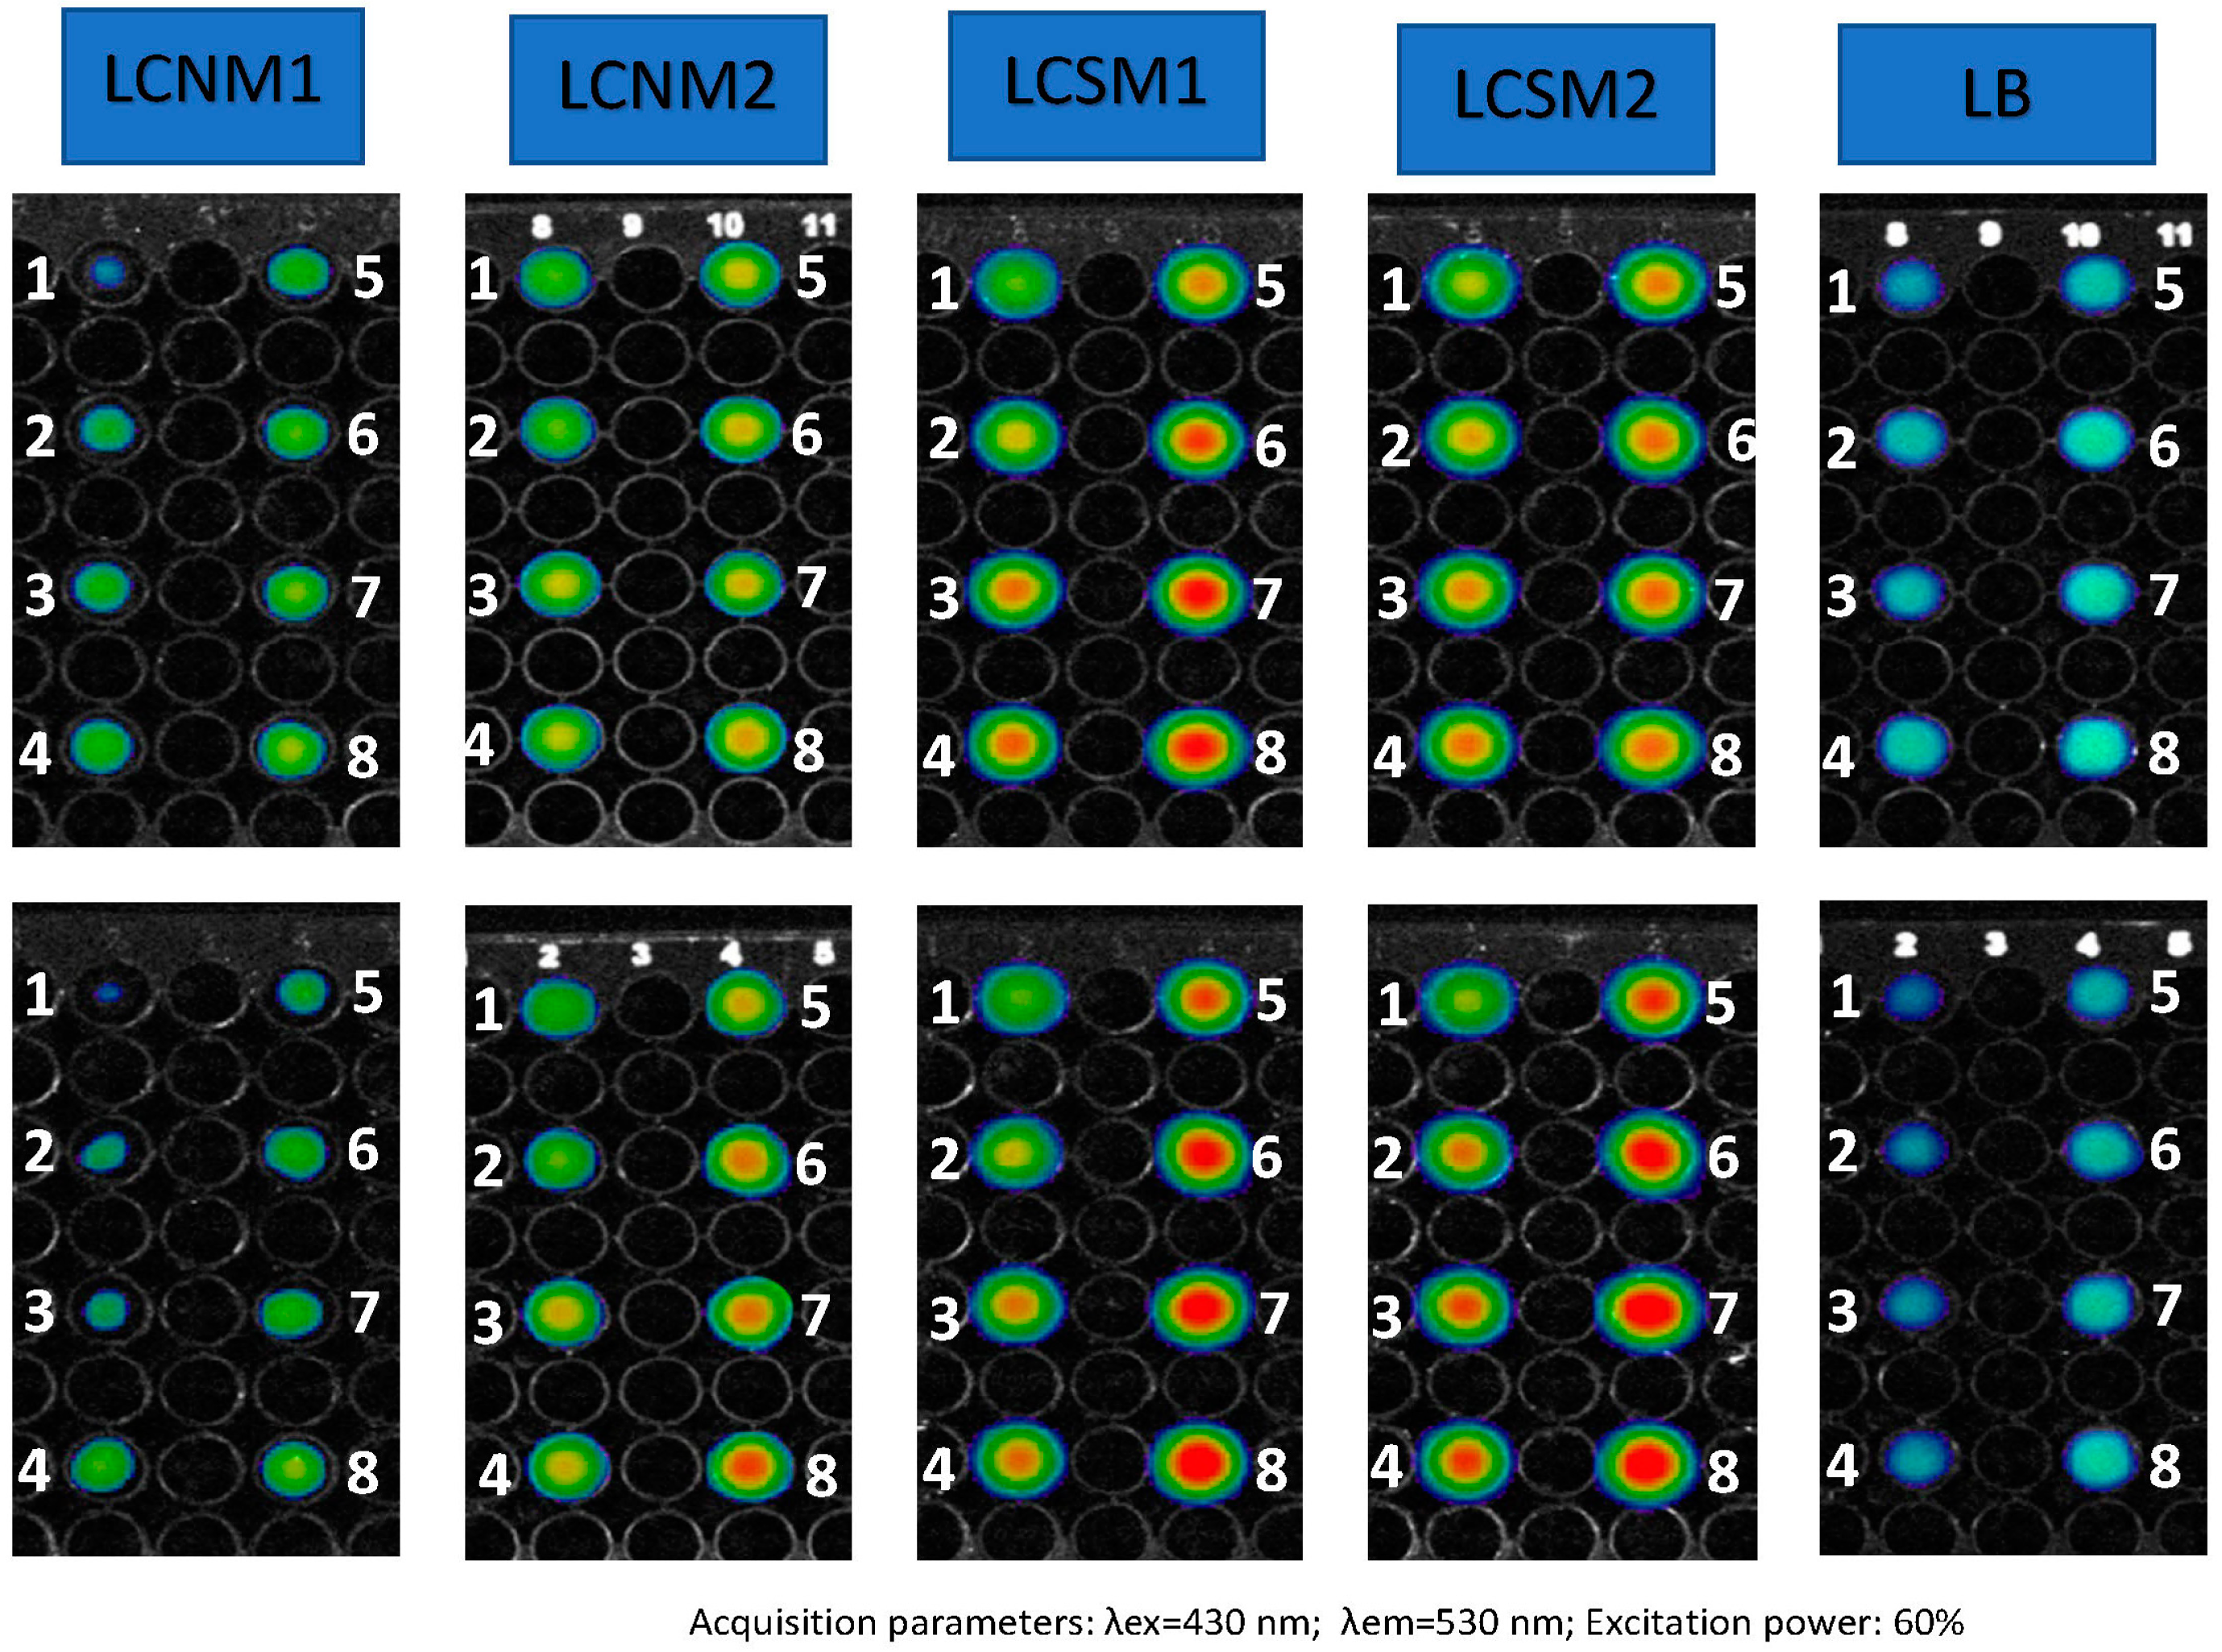
3.7. Fluorescence Imaging
3.8. STEM Images
4. Conclusions
Author Contributions
Funding
Institutional Review Board Statement
Data Availability Statement
Conflicts of Interest
References
- Spiridon, I. Extraction of lignin and therapeutic applications of lignin-derived compounds: A review. Environ. Chem. Lett. 2020, 18, 771–785. [Google Scholar] [CrossRef]
- Mäki, E.; Saastamoinen, H.; Melin, K.; Matschegg, D.; Pihkola, H. Drivers and barriers in retrofitting pulp and paper industry with bioenergy for more efficient production of liquid, solid and gaseous biofuels: A review. Biomass Bioenergy 2021, 148, 106036. [Google Scholar] [CrossRef]
- Ma, C.; Kim, T.-H.; Liu, K.; Ma, M.-G.; Choi, S.-E.; Si, C. Multifunctional lignin-based composite materials for emerging applications. Front. Bioeng. Biotechnol. 2021, 9, 708976. [Google Scholar] [CrossRef] [PubMed]
- Wang, S.; Bai, J.; Innocent, M.T.; Wang, Q.; Xiang, H.; Tang, J.; Zhu, M. Lignin-based carbon fibers: Formation, modification and potential applications. Green Energy Environ. 2022, 7, 578–605. [Google Scholar] [CrossRef]
- Yao, M.; Bi, X.; Wang, Z.; Yu, P.; Dufresne, A.; Jiang, C. Recent advances in lignin-based carbon materials and their applications: A review. Int. J. Biol. Macromol. 2022, 223, 980–1014. [Google Scholar] [CrossRef]
- Si, M.Y.; Zhang, J.; He, Y.Y.; Yang, Z.Q.; Yan, X.; Liu, M.R.; Zhuo, S.N.; Wang, S.; Min, X.B.; Gao, C.J.; et al. Synchronous and rapid preparation of lignin nanoparticles and carbon quantum dots from natural lignocellulose. Green Chem. 2018, 20, 3414–3419. [Google Scholar] [CrossRef]
- Wang, M.; Liu, X.; Song, P.; Wang, X.; Xu, F.; Zhang, X. Transformation of lignosulfonate into graphene-like 2D nanosheets: Self-assembly mechanism and their potential in biomedical and electrical applications. Int. J. Biol. Macromol. 2019, 128, 621–628. [Google Scholar] [CrossRef]
- Xue, B.; Yang, Y.; Sun, Y.; Fan, J.; Li, X.; Zhang, Z. Photoluminescent lignin hybridized carbon quantum dots composites for bioimaging applications. Int. J. Biol. Macromol. 2019, 122, 954–961. [Google Scholar] [CrossRef]
- Yin, C.; Chen, L.; Niu, N. Nitrogen-doped carbon quantum dots fabricated from cellulolytic enzyme lignin and its application to the determination of cytochrome c and trypsin. Anal. Bioanal. Chem. 2021, 413, 5239–5249. [Google Scholar] [CrossRef]
- Lin, S.; Lai, C.; Huang, Z.; Liu, W.; Xiong, L.; Wu, Y.; Jin, Y. Sustainable synthesis of lignin-derived carbon dots with visible pH response for Fe3+ detection and bioimaging. Spectrochim. Acta A Mol. Biomol. Spectrosc. 2023, 302, 123111. [Google Scholar] [CrossRef]
- Ding, Z.; Li, F.; Wen, J.; Wang, X.; Sun, R. Gram-scale synthesis of single-crystalline graphene quantum dots derived from lignin biomass. Green Chem. 2018, 20, 1383–1390. [Google Scholar] [CrossRef]
- Chen, Z.; Xia, M.; Gao, Y.; Ma, W.; Chen, Y.; Wang, X.; Chen, H.; Yang, H. Study of the effect of nitric acid on the structure and optical properties of alkali lignin-based carbon dots. Carbon Capture Sci. Technol. 2024, 12, 100218. [Google Scholar] [CrossRef]
- Zhou, P.; Xu, J.; Hou, X.; Dai, L.; Zhang, J.; Xiao, X.; Huo, K. Heteroatom-engineered multicolor lignin carbon dots enabling bimodal fluorescent off-on detection of metal-ions and glutathione. Int. J. Biol. Macromol. 2023, 253, 126714. [Google Scholar] [CrossRef] [PubMed]
- Tomani, P. The lignoboost process. Cellul. Chem. Technol. 2010, 44, 53–58. [Google Scholar]
- Amit, T.A.; Roy, R.; Raynie, D.E. Thermal and structural characterization of two commercially available technical lignins for potential depolymerization via hydrothermal liquefaction. Curr. Res. Green Sustain. Chem. 2021, 4, 100106. [Google Scholar] [CrossRef]
- Vandarkuzhali, S.A.A.; Jeyalakshmi, V.; Sivaraman, G.; Singaravadivel, S.; Krishnamurthy, K.R.; Viswanathan, B. Highly fluorescent carbon dots from Pseudo-stem of banana plant: Applications as nanosensor and bio-imaging agents. Sens. Actuators B 2017, 252, 894–900. [Google Scholar] [CrossRef]
- Liu, Y.; Tang, Y.; Xu, Q.; Cao, Y.; Wei, J.; Liang, Z.; Jiang, X.; Wu, Y.; Guo, C. Solvothermal regulation of fluorescence quantum yield of carbon dots derived from biomass for zebrafish imaging. J. Lumin. 2024, 271, 120583. [Google Scholar] [CrossRef]
- Wang, R.; Xia, G.; Zhong, W.; Chen, L.; Chen, L.; Wang, Y.; Min, Y.; Li, K. Direct transformation of lignin into fluorescence switchable graphene quantum dots and their application in ultrasensitive profiling of a physiological oxidant. Green Chem. 2019, 21, 3343–3352. [Google Scholar] [CrossRef]
- Jiang, C.; Wang, X.; Qin, D.; Da, W.; Hou, B.; Hao, C.; Wu, J. Construction of magnetic lignin-based adsorbent and its adsorption properties for dyes. J. Hazard. Mater. 2019, 369, 50. [Google Scholar] [CrossRef]
- Song, Y.; Xia, X.; Xiao, Z.; Zhao, Y.; Yan, M.; Li, J.; Li, H.; Liu, X. Synthesis of N,S co-doped carbon dots for fluorescence turn-on detection of Fe2+ and Al3+ in a wide pH range. J. Mol. Liq. 2020, 386, 20663. [Google Scholar] [CrossRef]
- Gan, J.; Chen, L.; Chen, Z.; Zhang, J.; Yu, W.; Huang, C.; Wu, Y.; Zhang, K. Lignocellulosic biomass-based Carbon dots: Synthesis processes, properties, and applications. Small 2023, 19, 2304066. [Google Scholar] [CrossRef] [PubMed]
- Zhu, Z.; Li, X.; Luo, M.; Chen, M.; Chen, W.; Yang, P.; Zhou, X. Synthesis of carbon dots with high photocatalytic reactivity by tailoring heteroatom doping. J. Colloid Interface Sci. 2022, 605, 330. [Google Scholar] [CrossRef] [PubMed]
- Kong, B.; Yang, T.; Cheng, F.; Qian, Y.; Li, C.; Zhan, L.; Li, Y.; Zou, H.; Huang, C. Carbon dots as nanocatalytic medicine for anti-inflammation therapy. J. Colloid Interface Sci. 2022, 611, 545–553. [Google Scholar] [CrossRef]
- Liu, W.; Ning, C.; Sang, R.; Hou, Q.; Ni, Y. Lignin-derived graphene quantum dots from phosphous acid-assisted hydrothermal pretreatment and their application in photocatalysis. Ind. Crops Prod. 2021, 171, 113963. [Google Scholar] [CrossRef]
- Lu, F.; Xu, J.; Li, Z.; Wang, X.; Zhou, J.; Wang, Y.; Tan, F. Self-synthesized carbon nanotubes exhibiting temperature-responsive effects to “modify” honeycomb lignin-based carbon aerogels for supercapacitor applications. J. Energy Storage 2025, 110, 115348. [Google Scholar] [CrossRef]
- Pandey, F.P.; Rastogi, A.; Singh, S. Optical properties and zeta potential of carbon quantum dots (CQDs) dispersed nematic liquid crystal 4′-heptyl-4-biphenylcarbonitrile (7CB). Opt. Mater. 2020, 105, 109849. [Google Scholar] [CrossRef]
- Matsakas, L.; Gerber, M.; Yu, L.; Rova, U.; Christakopoulos, P. Preparation of low carbon impact lignin nanoparticles with controllable size by using different strategies for particles recovery. Ind. Crops Prod. 2020, 147, 12243. [Google Scholar] [CrossRef]
- Sahoo, N.K.; Jana, G.C.; Aktara, M.N.; Das, S.; Nayim, S.; Patra, A.; Bhattacharjee, P.; Bhadra, K.; Hossain, M. Carbon dots derived from lychee waste: Application for Fe3+ ions sensing in real water and multicolor cell imaging of skin melanoma cells. Mater. Sci. Eng. C 2020, 108, 110429. [Google Scholar] [CrossRef]
- Aldakhil, F.; Alarfaj, N.A.; Al-Tamimi, S.A.; El-Tohamy, M.F. Hydrothermal synthesis of modified lignin-based carbon dots derived from biomass waste for fluorescence determination of valsartan. RSC Adv. 2024, 14, 19969–19982. [Google Scholar] [CrossRef]
- Hou, X.; Xu, J.; Zhou, P.; Dai, L.; Zhang, D.; Xiao, X.; Huo, K. A shining transmutation of lignin into multicolor carbon dots via the dynamic solvent-fractionation engineering. Chem. Eng. J. 2023, 478, 147363. [Google Scholar] [CrossRef]
- Zaini, M.S.; Liew, J.Y.C.; Paiman, S.; Tee, T.S.; Kamarudin, M.A. Solvent-dependent photoluminescence emission and colloidal stability of carbon quantum dots from watermelon peels. J. Fluoresc. 2025, 35, 245–256. [Google Scholar] [CrossRef] [PubMed]
- Huo, S.; Zhang, P.; He, M.; Zhang, W.; Liang, B.; Zhang, M.; Wang, H.; Li, K. Sustainable development of ultrathin porous carbon nanosheets with highly accessible defects from biomass waste for high-performance capacitive desalination. Green Chem. 2021, 23, 8554–8565. [Google Scholar] [CrossRef]
- Liu, Q.; Zhang, N.; Shi, H.; Ji, W.; Guo, X.; Yuan, W.; Hu, Q. One-step microwave synthesis of carbon dots for highly sensitive and selective detection of copper ions in aqueous solution. New J. Chem. 2018, 42, 3097–3101. [Google Scholar] [CrossRef]
- Qiu, Y.; Wang, F.; Ma, X.; Yin, F.; Li, D.; Li, J. Carbon quantum dots derived from cassava stems via acid/alkali-assisted hydrothermal carbonization: Formation, mechanism and application in drug release. Ind. Crops Prod. 2023, 204, 117243. [Google Scholar] [CrossRef]
- Ramanan, V.; Thiyagarajan, S.K.; Raji, K.; Suresh, R.; Sekar, R.; Ramamurthy, P. Outright Green Synthesis of Fluorescent Carbon Dots from Eutrophic Algal Blooms for In Vitro Imaging. ACS Sustain. Chem. Eng. 2016, 4, 4724–4731. [Google Scholar] [CrossRef]
- Jiang, X.; Shi, Y.; Liu, X.; Wang, M.; Song, P.; Xu, F.; Zhang, X. Synthesis of Nitrogen-doped lignin/DES Carbon quantum dots as a fluorescent probe for the detection of Fe3+ ions. Polymers 2018, 10, 1282. [Google Scholar] [CrossRef] [PubMed]
- Robertson, D.; Nousiainen, P.; Pitkänen, L.; Schlapp-Hackl, I.; Rusakov, D.; Humme, M. Carbonisation of lignin in the presence of a eutectic salt mixture: Identifying the lignin properties that govern the characteristics of the resulting carbon material. J. Anal. Appl. Pyrolysis 2024, 183, 106811. [Google Scholar] [CrossRef]
- Zhang, W.; Qiu, X.; Wang, C.; Zhong, L.; Fu, F.; Zhu, J.; Zhang, Z.; Qin, Y.; Yang, D.; Xu, C. Lignin derived carbon materials: Current status and future trends. Carbon Res. 2022, 1, 14. [Google Scholar] [CrossRef]
- Zhu, L.; Shen, D.; Liu, Q.; Wu, C.; Gu, S. Sustainable synthesis of bright green fluorescent carbon quantum dots from lignin for highly sensitive detection of Fe3+ ions. Appl. Surf. Sci. 2012, 565, 150526. [Google Scholar] [CrossRef]
- Kong, J.; Wei, Y.; Zhou, F.; Shi, L.; Zhao, S.; Wan, M.; Zhang, S. Carbon Quantum Dots: Properties, Preparation, and Applications. Molecules 2024, 29, 2002. [Google Scholar] [CrossRef]
- Zhu, L.; Shen, D.; Luo, K.H. Triple-emission nitrogen and boron co-doped carbon quantum dots from lignin: Highly fluorescent sensing platform for detection of hexavalent chromium ions. J. Colloid Interface Sci. 2022, 617, 557–567. [Google Scholar] [CrossRef]
- Newman Monday, Y.; Abdullah, J.; Yusof, N.A.; Abdul Rashid, S.; Shueb, R.H. Facile Hydrothermal and Solvothermal synthesis and characterization of Nitrogen-doped carbon dots from palm kernel sShell precursor. Appl. Sci. 2021, 11, 1630. [Google Scholar] [CrossRef]
- Jia, Z.; Yangm, N.; Wang, S.; Meng, Y.; Sun, Y.; Ye, J.; Li, W.; Xu, S.; Wu, T.; Li, Y.; et al. Organic solvent-assisted ethylenediamine pretreatment to improve the high-value utilization efficiency of corn stalk. Chem. Eng. J. 2024, 495, 153341. [Google Scholar] [CrossRef]
- Park, S.W.; Im, S.H.; Hong, W.T.; Yang, T.K.; Jung, Y.K. Lignin-derived carbon quantum dot/PVA films for totally blocking UV and high-energy blue light. Int. J. Biol. Macromol. 2024, 268, 131919. [Google Scholar] [CrossRef] [PubMed]
- Chen, M.L.; Zhai, J.C.; An, Y.L.; Li, Y.; Zheng, Y.W.; Tian, H.; Shi, R.; He, X.H.; Liu, C.; Lin, X. Solvent-free pyrolysis strategy for the preparation of biomass carbon bots for the selective detection of Fe3+ ions. Front. Chem. 2022, 10, 940398. [Google Scholar] [CrossRef]
- Han, S.; Chang, T.; Zhao, H.; Du, H.; Liu, S.; Wu, B.; Qin, S. Cultivating fluorescent flowers with highly luminescent carbon dots fabricated by a double passivation method. Nanomaterials 2017, 7, 176. [Google Scholar] [CrossRef] [PubMed]
- Dong, Y.; Yang, H.B.; Guo, C.; Shao, J.; Chi, Y.; Li, C.M.; Yu, T. Carbon-based dots Co-doped with nitrogen and sulfur for high quantum yield and excitation-independent emission. Angew. Chem. 2013, 52, 7800–7804. [Google Scholar] [CrossRef]
- Bao, L.; Liu, C.; Zhang, Z.L.; Pang, D.W. Photoluminescence-tunable carbon nanodots: Surface-state energy-gap tuning. Adv. Mater. 2015, 27, 1663. [Google Scholar] [CrossRef]
- Stan, C.S.; Gospei Horlescu, P.; Ursu, L.E.; Popa, M.; Albu, C. Facile preparation of highly luminescent composites by polymer embedding of carbon dots derived from N-hydroxyphthalimide. J. Mater. Sci. 2017, 52, 185–196. [Google Scholar] [CrossRef]
- Yang, Z.; Xu, M.; Liu, Y.; He, F.; Gao, F.; Su, Y.; Wei, H.; Zhang, Y. Nitrogen-doped, carbon-rich, highly photoluminescent carbon dots from ammonium citrate. Nanoscale 2014, 6, 1890–1895. [Google Scholar] [CrossRef]
- Nguyen, H.A.; Srivastava, I.; Pan, D.; Gruebele, M. Unraveling the fluorescence mechanism of carbon dots with sub-single-particle resolution. ACS Nano 2020, 14, 6127–6137. [Google Scholar] [CrossRef] [PubMed]
- Song, T.; Zhao, Y.; Wang, T.; Li, J.; Jiang, Z.; Yang, P. Carbon dots doped with N and S towards controlling emitting. J. Fluoresc. 2020, 30, 81–89. [Google Scholar] [CrossRef] [PubMed]
- Zarrintaj, P.; Manouchehri, S.; Ahmadi, Z.; Saeb, M.R.; Urbanska, A.M.; Kaplan, D.L.; Mozafari, M. Agarose-based biomaterials for tissue engineering. Carbohydr. Polym. 2018, 187, 66–84. [Google Scholar] [CrossRef]
- Gil, H.M.; Price, T.W.; Chelani, K.; Bouillard, J.-S.; Calaminus, S.D.J.; Stasiuk, G.J. NIR-quantum dots in biomedical imaging and their future. iScience 2021, 24, 102189. [Google Scholar] [CrossRef]
- Christoph, E.; Yu, L.; Newby, S.D.; Rivera Orsini, M.A.; Scroggins, J.; Keffer, D.J.; Harper, D.P.; Dhar, M. Novel Kraft softwood lignin-derived Carbon quantum dots: Synthesis, characterization, and in vitro cytocompatibility. Nanomaterials 2024, 14, 1029. [Google Scholar] [CrossRef]
- Ayilliath, S.K.; Nair, S.R.; Lakshmi, G.C.; Kunnatheery, S. Functionalised graphene quantum dots for cholesterol detection in human blood serum. J. Fluoresc. 2021, 31, 847–852. [Google Scholar] [CrossRef]


| Code | Acid | Solvent | Thermal Treatment |
|---|---|---|---|
| LCNM1 | HNO3 | Acetone | Autoclave, 95 °C, 50 mbar, 8 h |
| LCNM2 | HNO3 | Ethanol | Autoclave, 95 °C, 50 mbar, 8 h |
| LCSM1 | H2SO4 | Acetone | Autoclave, 95 °C, 50 mbar, 8 h |
| LCSM2 | H2SO4 | Ethanol | Autoclave, 95 °C, 50 mbar, 8 h |
| Sample | Element (wt%) | |||
|---|---|---|---|---|
| C 1s | O 1s | S 2p | N 1s | |
| LB | 75.29 | 22.68 | 2.03 | - |
| LCNM1 | 72.80 | 18.77 | 0.42 | 8.02 |
| LCNM2 | 76.31 | 17.34 | 0.28 | 6.08 |
| LCSM1 | 73.77 | 22.35 | 3.88 | - |
| LCSM2 | 68.43 | 27.87 | 3.71 | - |
| Sample | C 1s | |||||||||||
|---|---|---|---|---|---|---|---|---|---|---|---|---|
| C1 | C2 | C3 | C4 | C5 | C6 | |||||||
| C=C/C–C/C–H | C–SO/C=N | C–OH/C–N | C=O/C–O–C | O–C=O | π-π* | |||||||
| At. Conc. (%) | BE (eV) | At. Conc. (%) | BE (eV) | At. Conc. (%) | BE (eV) | At. Conc. (%) | BE (eV) | At. Conc. (%) | BE (eV) | At. Conc. (%) | BE (eV) | |
| LB | 49.59 | 285 | 11.98 | 286 | 25.97 | 286.7 | 4.72 | 287.8 | 2.90 | 289.3 | 4.83 | 291.4 |
| LCNM1 | 53.96 | 285 | 14.42 | 286 | 23.76 | 286.6 | 4.29 | 288.1 | 1.45 | 289.2 | 2.10 | 291.5 |
| LCNM2 | 46.38 | 285 | 21.71 | 286 | 23.65 | 286.8 | 4.46 | 288.2 | 1.45 | 289.3 | 2.36 | 291.3 |
| LCSM1 | 51.93 | 285 | 17.24 | 286 | 21.56 | 286.8 | 3.70 | 288 | 3.55 | 289.3 | 2.02 | 291.5 |
| LCSM2 | 44.10 | 285 | 19.13 | 286 | 20.05 | 286.9 | 8.08 | 288.2 | 6.41 | 289.3 | 2.23 | 291.5 |
| Sample | O 1s | |||||
|---|---|---|---|---|---|---|
| O1 | O2 | O3 | ||||
| –C=O/C–O–O–C | O=C–O– | –C–OH/ | ||||
| At. Conc. (%) | BE (eV) | At. Conc. (%) | BE (eV) | At. Conc. (%) | BE (eV) | |
| LB | 3.75 | 531.1 | 10.80 | 532.2 | 85.45 | 533.5 |
| LCNM1 | 7.44 | 531.1 | 45.86 | 532.3 | 46.69 | 533.5 |
| LCNM2 | 5.85 | 531.1 | 24.09 | 532 | 70.05 | 533.5 |
| LCSM1 | 4.83 | 531.3 | 22.45 | 532.4 | 72.72 | 533.6 |
| LCSM2 | 2.37 | 531.1 | 37.92 | 532.3 | 59.71 | 533.5 |
| Sample | N 1s | S 2p | ||||||||||
|---|---|---|---|---|---|---|---|---|---|---|---|---|
| N1 | N2 | N3 | S1 | S2 | S3 | |||||||
| Pyridinic N | Graphitic N | N–H/ Quaternary-N | C–S | C–SO2 | C–SO3 | |||||||
| At. Conc. (%) | BE (eV) | At. Conc. (%) | BE (eV) | At. Conc. (%) | BE (eV) | At. Conc. (%) | BE (eV) | At. Conc. (%) | BE (eV) | At. Conc. (%) | BE (eV) | |
| LB | - | - | - | - | - | - | 57.01 | 164.0 | 17.13 | 166.4 | 25.86 | 168.8 |
| LCNM1 | 62.2 | 399.8 | 26.32 | 400.9 | 11.48 | 402.3 | 38.44 | 163.6 | 32.68 | 166.1 | 28.88 | 168.4 |
| LCNM2 | 77.7 | 399.8 | 16.94 | 401.3 | 5.36 | 402.4 | 41.34 | 163.8 | 31.35 | 166.2 | 27.32 | 168.2 |
| LCSM1 | - | - | - | - | - | - | 40.83 | 163.9 | 27.40 | 166.6 | 31.77 | 168.8 |
| LCSM2 | - | - | - | - | - | - | 21.50 | 164.0 | 45.61 | 166.4 | 32.89 | 168.5 |
| Sample | Size (nm) | Zeta Potential (mV) | Conductivity (mS/cm) |
|---|---|---|---|
| LB | 96.20 | 0.54 | 0.029 |
| LCNM1 | 0.25 | 0.89 | 0.103 |
| LCNM2 | 0.54 | 0.029 | |
| LCSM1 | 0.26 | 0.119 | |
| LCSM2 | 1.49 | 0.032 |
| BET Data | |||
|---|---|---|---|
| Material | a Water Sorption Capacity (% d.b.) | a BET Surface Area (m2/g) | a Monolayer (g/g) |
| LB | 11.20 | 181.741 ± 78.046 | 0.051 |
| LCNM1 | 22.40 | 229.917 ± 41.250 | 0.065 |
| LCNM2 | 18.58 | 139.597 ± 07.819 | 0.039 |
| LCSM2 | 42.68 | 140.973 ± 13.475 | 0.040 |
| LCSM1 | 21.17 | 318.095 ± 39.089 | 0.090 |
| Sample | τ1 (ns) | a1 (%) | f1 | τ2 (ns) | a2 (%) | f2 | τ3 (ns) | a3 (%) | f3 | χ2 | <τ> (ns) |
|---|---|---|---|---|---|---|---|---|---|---|---|
| LCNM1 | 2.65 | 41.93 | 0.24 | 0.42 | 18.57 | 0.02 | 8.53 | 39.50 | 0.74 | 1.11 | 6.96 |
| LCNM2 | 2.47 | 46.36 | 0.20 | 0.49 | 19.19 | 0.17 | 9.90 | 34.45 | 0.61 | 1.00 | 7.49 |
| LCSM1 | 2.76 | 44.93 | 0.24 | 0.43 | 12.55 | 0.02 | 8.53 | 42.52 | 0.74 | 1.06 | 7.02 |
| LCSM2 | 2.70 | 32.72 | 0.28 | 0.41 | 41.72 | 0.05 | 8.15 | 25.55 | 0.66 | 1.11 | 6.19 |
Disclaimer/Publisher’s Note: The statements, opinions and data contained in all publications are solely those of the individual author(s) and contributor(s) and not of MDPI and/or the editor(s). MDPI and/or the editor(s) disclaim responsibility for any injury to people or property resulting from any ideas, methods, instructions or products referred to in the content. |
© 2025 by the authors. Licensee MDPI, Basel, Switzerland. This article is an open access article distributed under the terms and conditions of the Creative Commons Attribution (CC BY) license (https://creativecommons.org/licenses/by/4.0/).
Share and Cite
Coroabă, A.; Apostol, I.; Dascălu, I.A.; Bele, A.; Marangoci, N.L.; Doroftei, F.; Uritu, C.M.; Spiridon, I. Exploring the Characteristics of Carbon Structures Obtained from LignoBoost Lignin. Polymers 2025, 17, 1221. https://doi.org/10.3390/polym17091221
Coroabă A, Apostol I, Dascălu IA, Bele A, Marangoci NL, Doroftei F, Uritu CM, Spiridon I. Exploring the Characteristics of Carbon Structures Obtained from LignoBoost Lignin. Polymers. 2025; 17(9):1221. https://doi.org/10.3390/polym17091221
Chicago/Turabian StyleCoroabă, Adina, Irina Apostol, Ioan Andrei Dascălu, Adrian Bele, Narcisa Laura Marangoci, Florica Doroftei, Cristina Mariana Uritu, and Iuliana Spiridon. 2025. "Exploring the Characteristics of Carbon Structures Obtained from LignoBoost Lignin" Polymers 17, no. 9: 1221. https://doi.org/10.3390/polym17091221
APA StyleCoroabă, A., Apostol, I., Dascălu, I. A., Bele, A., Marangoci, N. L., Doroftei, F., Uritu, C. M., & Spiridon, I. (2025). Exploring the Characteristics of Carbon Structures Obtained from LignoBoost Lignin. Polymers, 17(9), 1221. https://doi.org/10.3390/polym17091221