3.1. Phase and State Diagram of TFD/PVP Blends
ASDs of TFD and PVP containing 10 wt.%, 30 wt.%, 49 wt.%, 70 wt.%, and 90 wt.% TFD were prepared by a 10 h co-milling at room temperature (see
Section 2.2). In order to study the homogeneity and the stability of these ASDs, samples were analysed by temperature modulated differential scanning calorimetry (MDSC). A first heating to 180 °C at 5 °C.min
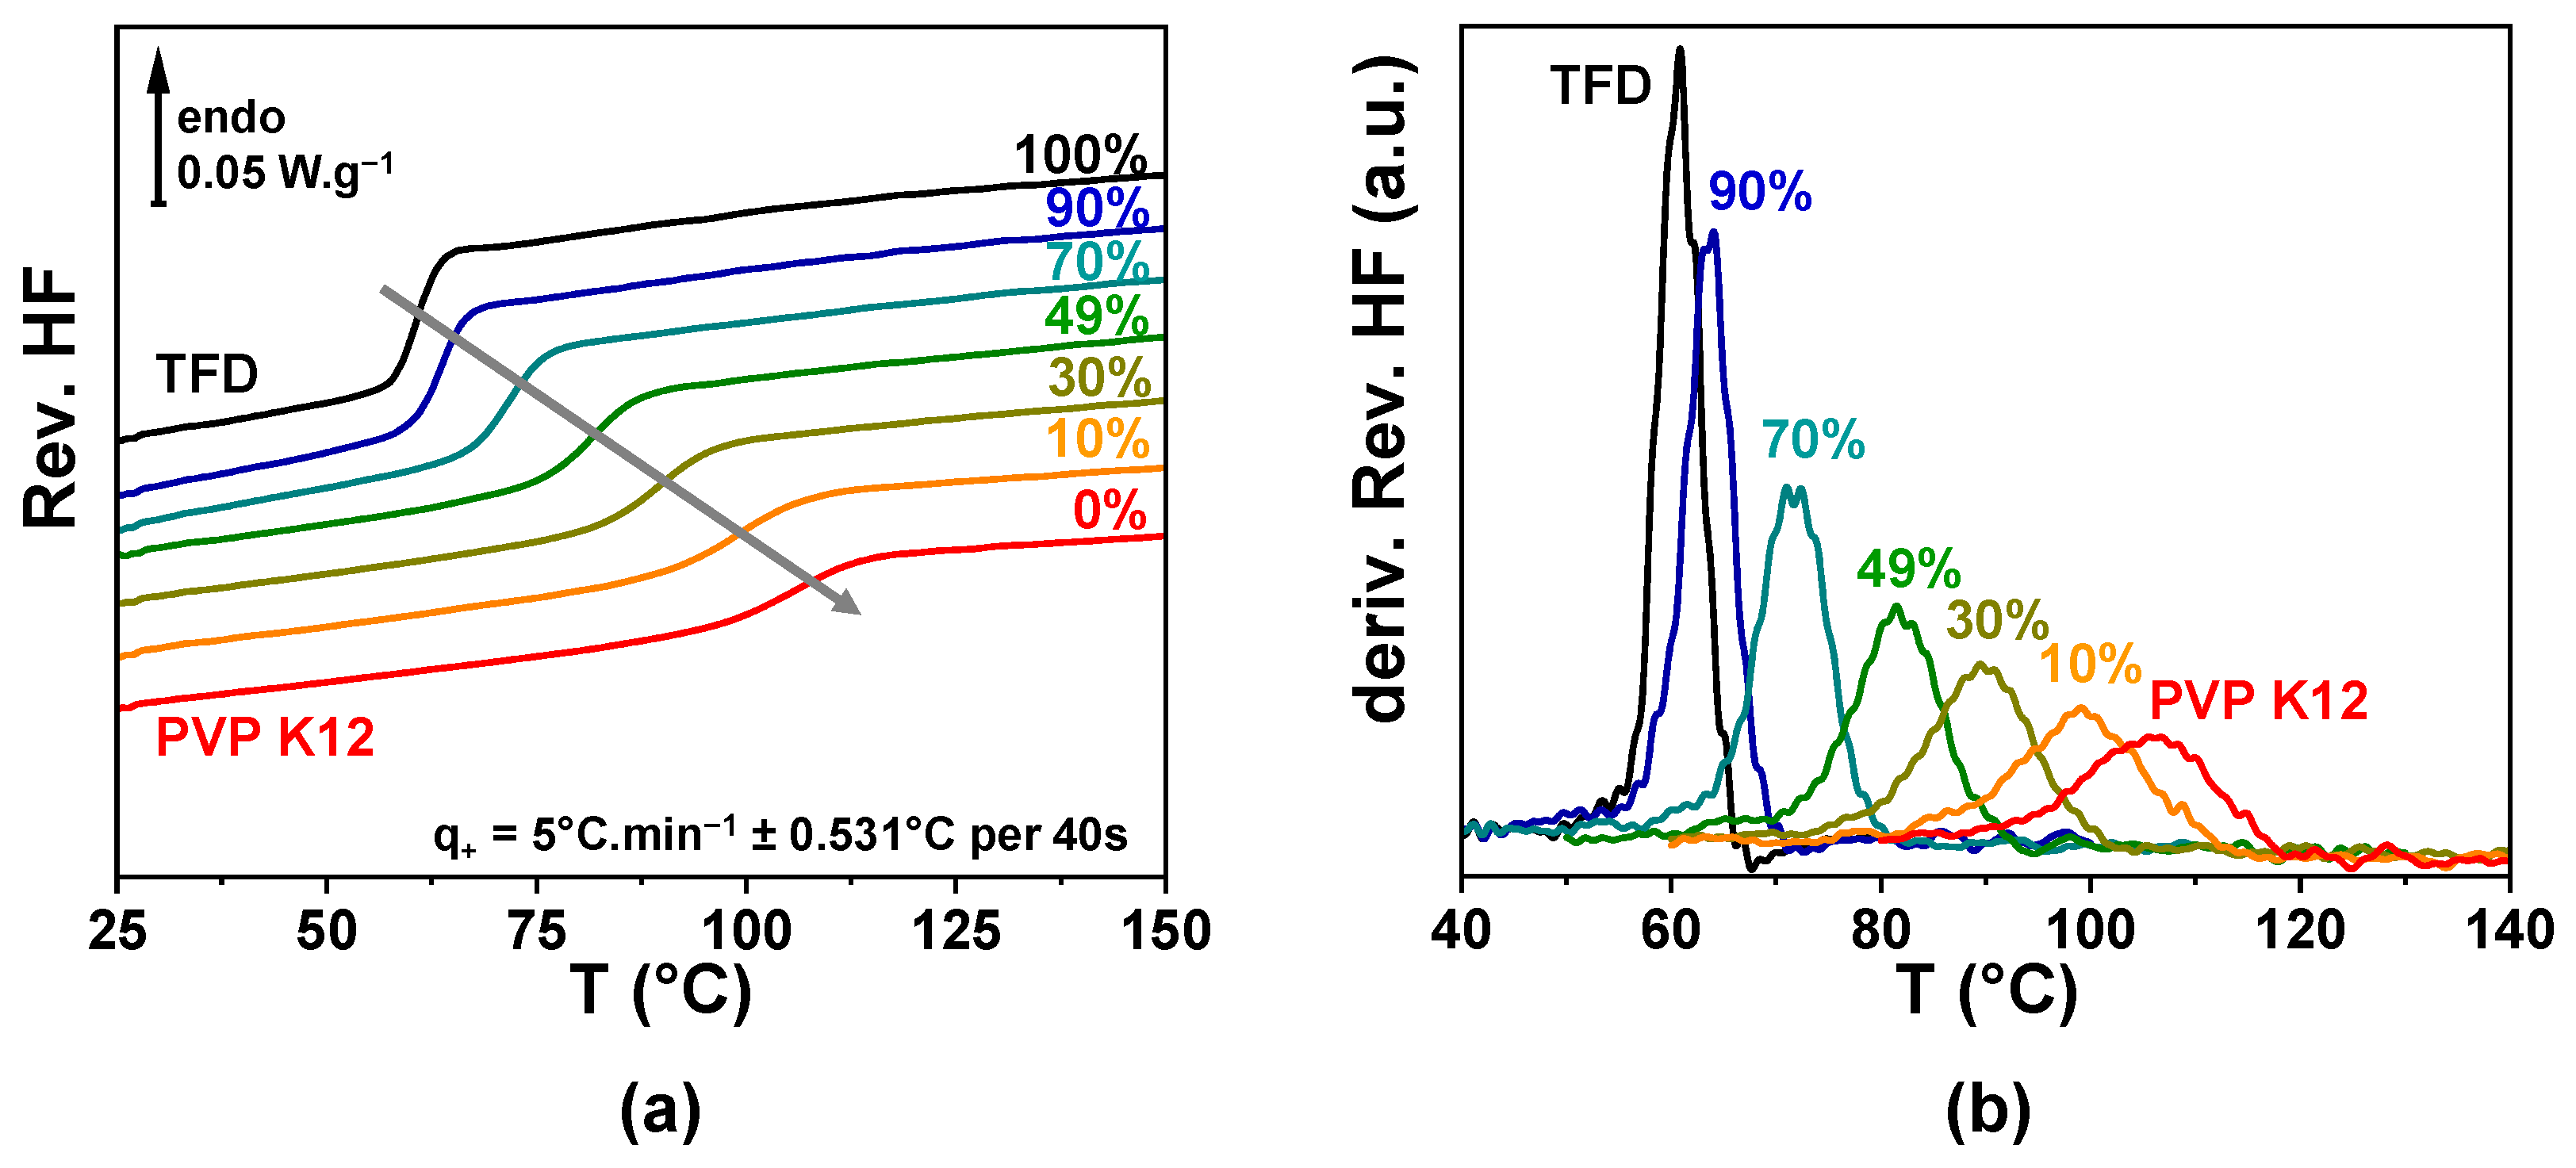
−1 ± 0.531 °C per 40 s was recorded. However, the glass transition temperature range proved challenging to analyse as different phenomena occur at the same time, inherent to the milled nature of the samples: On one hand, a small loss of adsorbed water appears between room temperature and 75 °C and, on the other hand, a poor thermal conductivity can create some artefacts on thermograms when it is modified by the softening and spreading of powder grains. The analysis of the glass transition temperature range was, thus, realised on a second heating of the sample (after a quench down to room temperature). The reversible heat flows recorded for the different ASDs are reported in
Figure 1a and the corresponding temperature derivatives in
Figure 1b. Whatever the TFD content, only a single
Cp-jump characteristic of the glass transition can be observed (single peak on the derivative signals), which indicates that TFD and PVP are mixed at the molecular level in all the concentration range. A single glass transition is usually considered as the mark of a homogeneous mixing at the molecular scale of the compounds. This
Cp-jump shifts towards higher temperatures as the fraction of PVP in the blend increases, while its magnitude decreases and its width increases. Therefore, the features of the glass transition of the ASD shift from the ones of amorphous TFD towards the ones of PVP with the composition of the blend (see
Table 1).
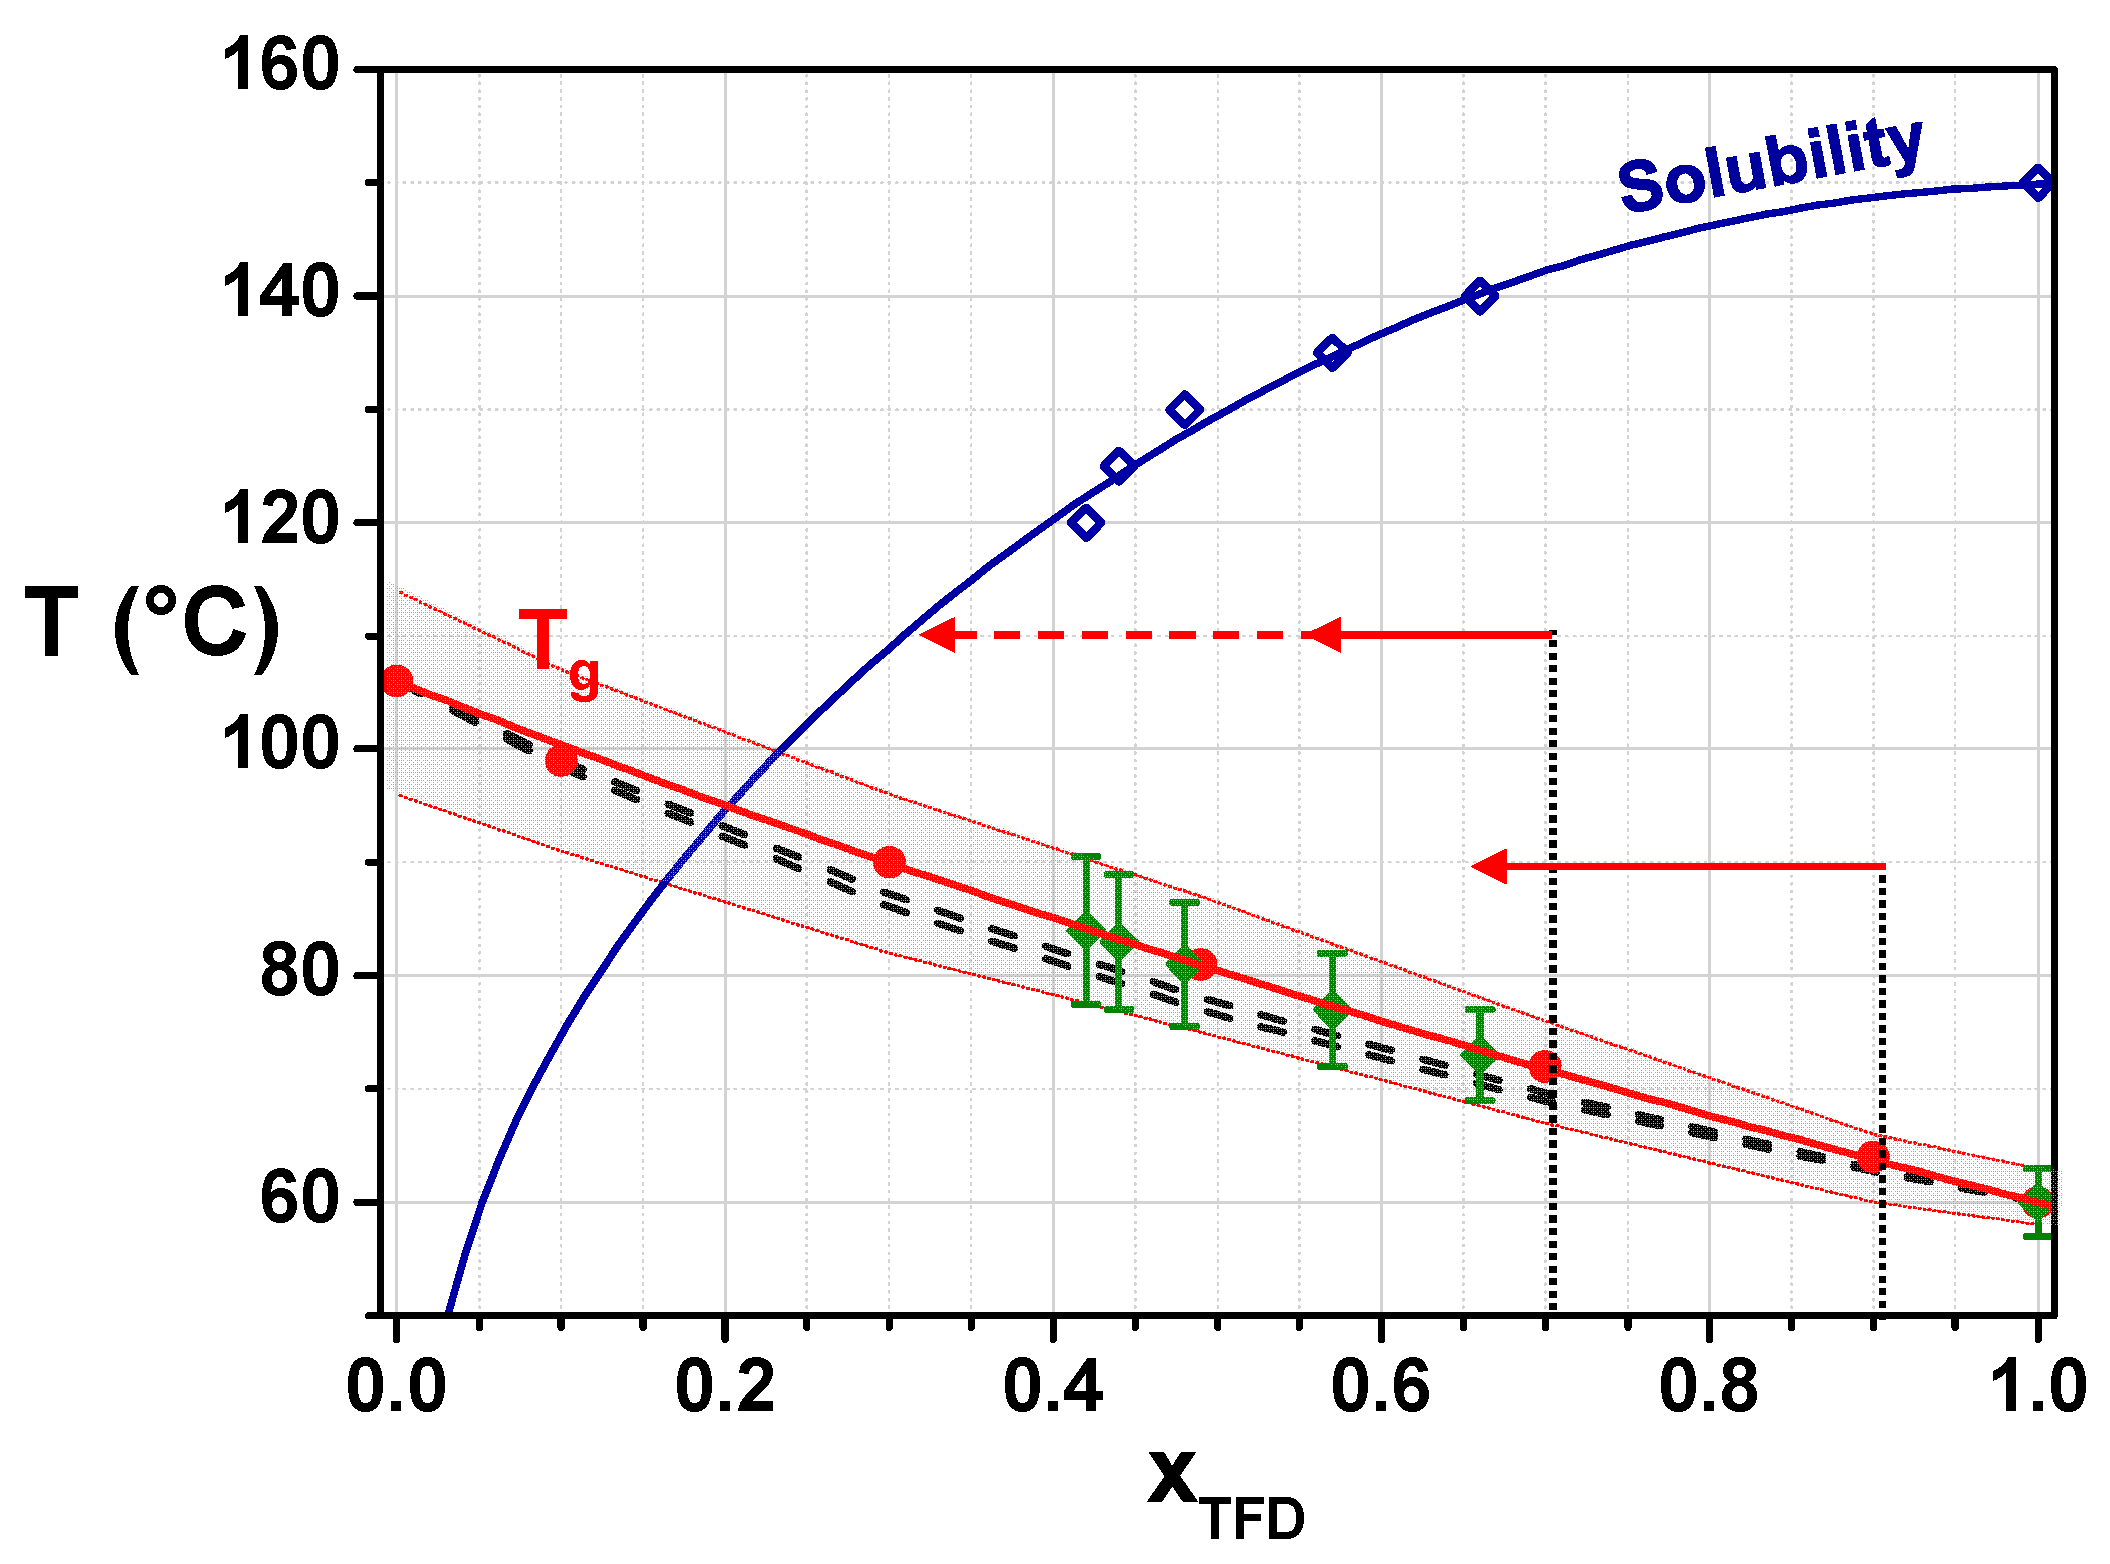
The evolution of the glass transition temperature,
Tg, midpoint, of the ASD with the TFD weight fraction,
xTFD, is reported in
Figure 2 (filled circles). It can be fitted using the Gordon–Taylor equation [
22]:
where
Tg,TFD and
Tg,PVP are the
Tg, midpoint values of, respectively, pure TFD and PVP K12,
xTFD is the weight fraction of TFD, and
KGT is a fitting parameter. The best fit is obtained with
KGT = 0.76 ± 0.02 and is reported in
Figure 2 (red solid line). In the framework of the Couchman–Karasz formalism [
23], the fitting parameter should be equal, in the case of a regular solution, to the ratio of the magnitudes of the
Cp-jump associated with the glass transition of pure PVP and TFD:
With
ΔCpPVP = 0.34 ± 0.02 J.g
−1.°C
−1 and
ΔCpTFD = 0.56 ± 0.01 J.g
−1.°C
−1, the value
KCK = 0.61 ± 0.05 is found. It is slightly lower than the value of
KGT, which results in ASD’s
Tg values predicted in the case of an athermal solution being slightly lower than the experimental ones (see
Tg, pred values in
Table 1 and dashed lines in
Figure 2 corresponding to
KCK min = 0.56 and
KCK max = 0.66). This small deviation indicates the development of weak attractive interactions between TFD and PVP molecules [
6].
As far as the thermal stability of the ASD produced by co-milling is concerned, only the thermogram (recorded on the first heating up to 180 °C) of the blend containing 90 wt.% TFD showed an exotherm of re-crystallisation (between 110 °C and 137 °C) followed by the endotherm of dissolution of re-crystallised TFD into the PVP matrix at higher temperatures. Since TFD amorphised by milling, contrary to the glass obtained by quench from the melt, re-crystallises on heating due to residual nuclei left by milling [
17], it indicates that the PVP matrix allows to prevent the re-crystallisation of TFD (or more precisely the growth of nuclei) on heating at 5 °C.min
−1 up to 70 wt.% TFD in the blend. One can add that, when the ASD containing 90 wt.% TFD is annealed at 90 °C for 8 h, the thermogram recorded on the isotherm shows an exotherm of re-crystallisation extending over 250 min, whereas, in the same conditions, complete re-crystallisation of TFD amorphised by a 20 h milling is achieved in 50 min (see
Figure S1). Only 10 wt.% PVP is, thus, sufficient to multiply by five the time needed for re-crystallisation. Moreover, the comparison of the enthalpy of crystallisation measured for the ASD,
ΔHcr = 58 ± 1 J.g
−1 of TFD (
ΔHcr = 52 ± 1 J.g
−1 of ASD), with the one of milled TFD,
ΔHcr = 76 ± 1 J.g
−1, reveals that only 76 wt.% of the TFD contained in the ASD re-crystallises. It then remains a stable amorphous blend that contains 68 wt.% TFD. This result suggests that co-milling 90 wt.% TFD and 10 wt.% PVP leads to the formation of an ASD supersaturated with TFD. On heating, the excess TFD re-crystallises until the limit of solubility is reached.
In order to establish the evolution of the solubility of TFD into PVP with increasing temperatures, the method developed by Latreche and co-workers [
19] has been used (see
Section 2.4).
Figure 3 presents the thermograms (reversible heat flows) of blends saturated with TFD obtained after 5 h of annealing at
Ta values ranging from 120 °C to 140 °C in 5 °C increments. A shift in the glass transition to lower temperatures is observed with increasing
Ta, indicating the enrichment of TFD of the remaining amorphous phase. The glass transition temperatures and the corresponding reached TFD saturation concentrations are reported in
Figure 2 (respectively, filled and open diamonds) and in
Table 2. It should be noted that below
Ta = 120 °C, the dissolution is so slow that equilibrium cannot be reached in a reasonable time.
Despite the few available points, a tentative fit of the solubility limit by the Flory–Huggins model [
24] has been performed:
where
Tm and Δ
Hm are, respectively, the melting temperature and enthalpy of TFD (
Tm = 150 ± 1 °C, Δ
Hm = 54.2 ± 0.5 kJ.mol
−1),
R is the gas constant (
R = 8.314 J.mol
−1),
ϕTFD is the volume fraction of TFD,
λ is the molar volume ratio of PVP to TFD, and
χ is the Flory–Huggins parameter describing the interactions between the two compounds.
ϕTFD is calculated from the densities of TFD and PVP K12 (
ρTFD = 1.05 g.cm
−3 obtained by molecular dynamics simulations and
ρPVP = 1.17 g.cm
−3 from Matsumoto et al. [
25]):
λ is calculated from the densities of TFD and PVP K12 and their molar masses,
MTFD = 471.7 g.mol
−1 and
Mw PVP = 2500 g.mol
−1:
The value
χ = −2.3 ± 0.1 has been obtained for the Flory–Huggins parameter. The negative value suggests the development of attractive interactions between TFD and PVP K12. For the system Indomethacin/PVP K12, Sun et al. [
26] and Mahieu et al. [
27] have respectively reported the values
χ = −8.2 ± 0.6 and
χ = −8.6 ± 0.7. For Nifedidine/PVP K12, Sun et al. [
26] reported the value
χ = −2.5 ± 0.2 and established that interactions between Indomethacin and PVP were stronger (H-bonds) than the ones developing between Nifedipine and PVP K12. In the system Curcumin/PVP K12, the value
χ = −5.54 ± 0.15 [
28] was reported and associated with quite strong interactions. The value found for TFD/PVP K12 is quite close to the one found for Nifedipine/PVP K12. This result confirms that weak attractive interactions develop between TFD and PVP in agreement with the evolution of the ASD’s
Tg with the TFD content.
The combination, in
Figure 2, of the phase diagram (solubility curve of TFD in PVP) and the state diagram (
Tg evolution with TFD content) of the TFD/PVP K12 system allows to better comprehend the physical state of this system and its evolution with temperature and time. In
Figure 2, above the solubility curve, the PVP matrix is undersaturated with TFD: The blend is homogeneous (one single phase) and amorphous, and it remains so. Below the solubility curve, the PVP matrix is supersaturated with TFD and the TFD in excess tends to re-crystallise. However, the kinetics depend on the molecular mobility: Below
Tg, its slowing down is such that the re-crystallisation is extremely slow or even blocked. Extrapolation of the solubility curve to room temperature shows that all ASDs formed by co-milling are supersaturated with TFD. Since the milling is performed at room temperature, so almost 40 °C below the glass transition of TFD, it is the milled-induced amorphisation of TFD that occurs at the same time as the mixing with PVP that permits reaching such supersaturated states. When ASDs are heated above
Tg, the release of the molecular mobility allows the re-crystallisation of the TFD in excess. However, due to the relatively slow kinetics of demixing/re-crystallisation, re-crystallisation is only observed on heating at 5 °C·min
−1 for the ASD containing 90 wt.% TFD, which is the ASD that has the lowest
Tg and the largest gap between
Tg and the temperature at which the solubility limit is reached. When the system is given more time, for instance, during the annealing at 90 °C, the TFD in excess re-crystallises and the TFD content remaining in the amorphous blend tends towards the equilibrium saturated concentration. It is interesting to note, however, that according to
Figure 2, this content should be close to 20 wt.%, whereas experimentally, after 8 h, 68 wt.% TFD still remains in the amorphous blend. As TFD re-crystallises and the TFD content remaining in the blend decreases, the temperature difference from
Tg narrows and the molecular mobility is slowed down. This limitation of mobility certainly explains why the demixing/re-crystallisation seems blocked.
3.2. Main Dynamics of TFD/PVP ASDs
In order to investigate the dynamics of ASDs in the supercooled liquid, dielectric relaxation spectroscopy (DRS) experiments have been performed (see
Section 2.5).
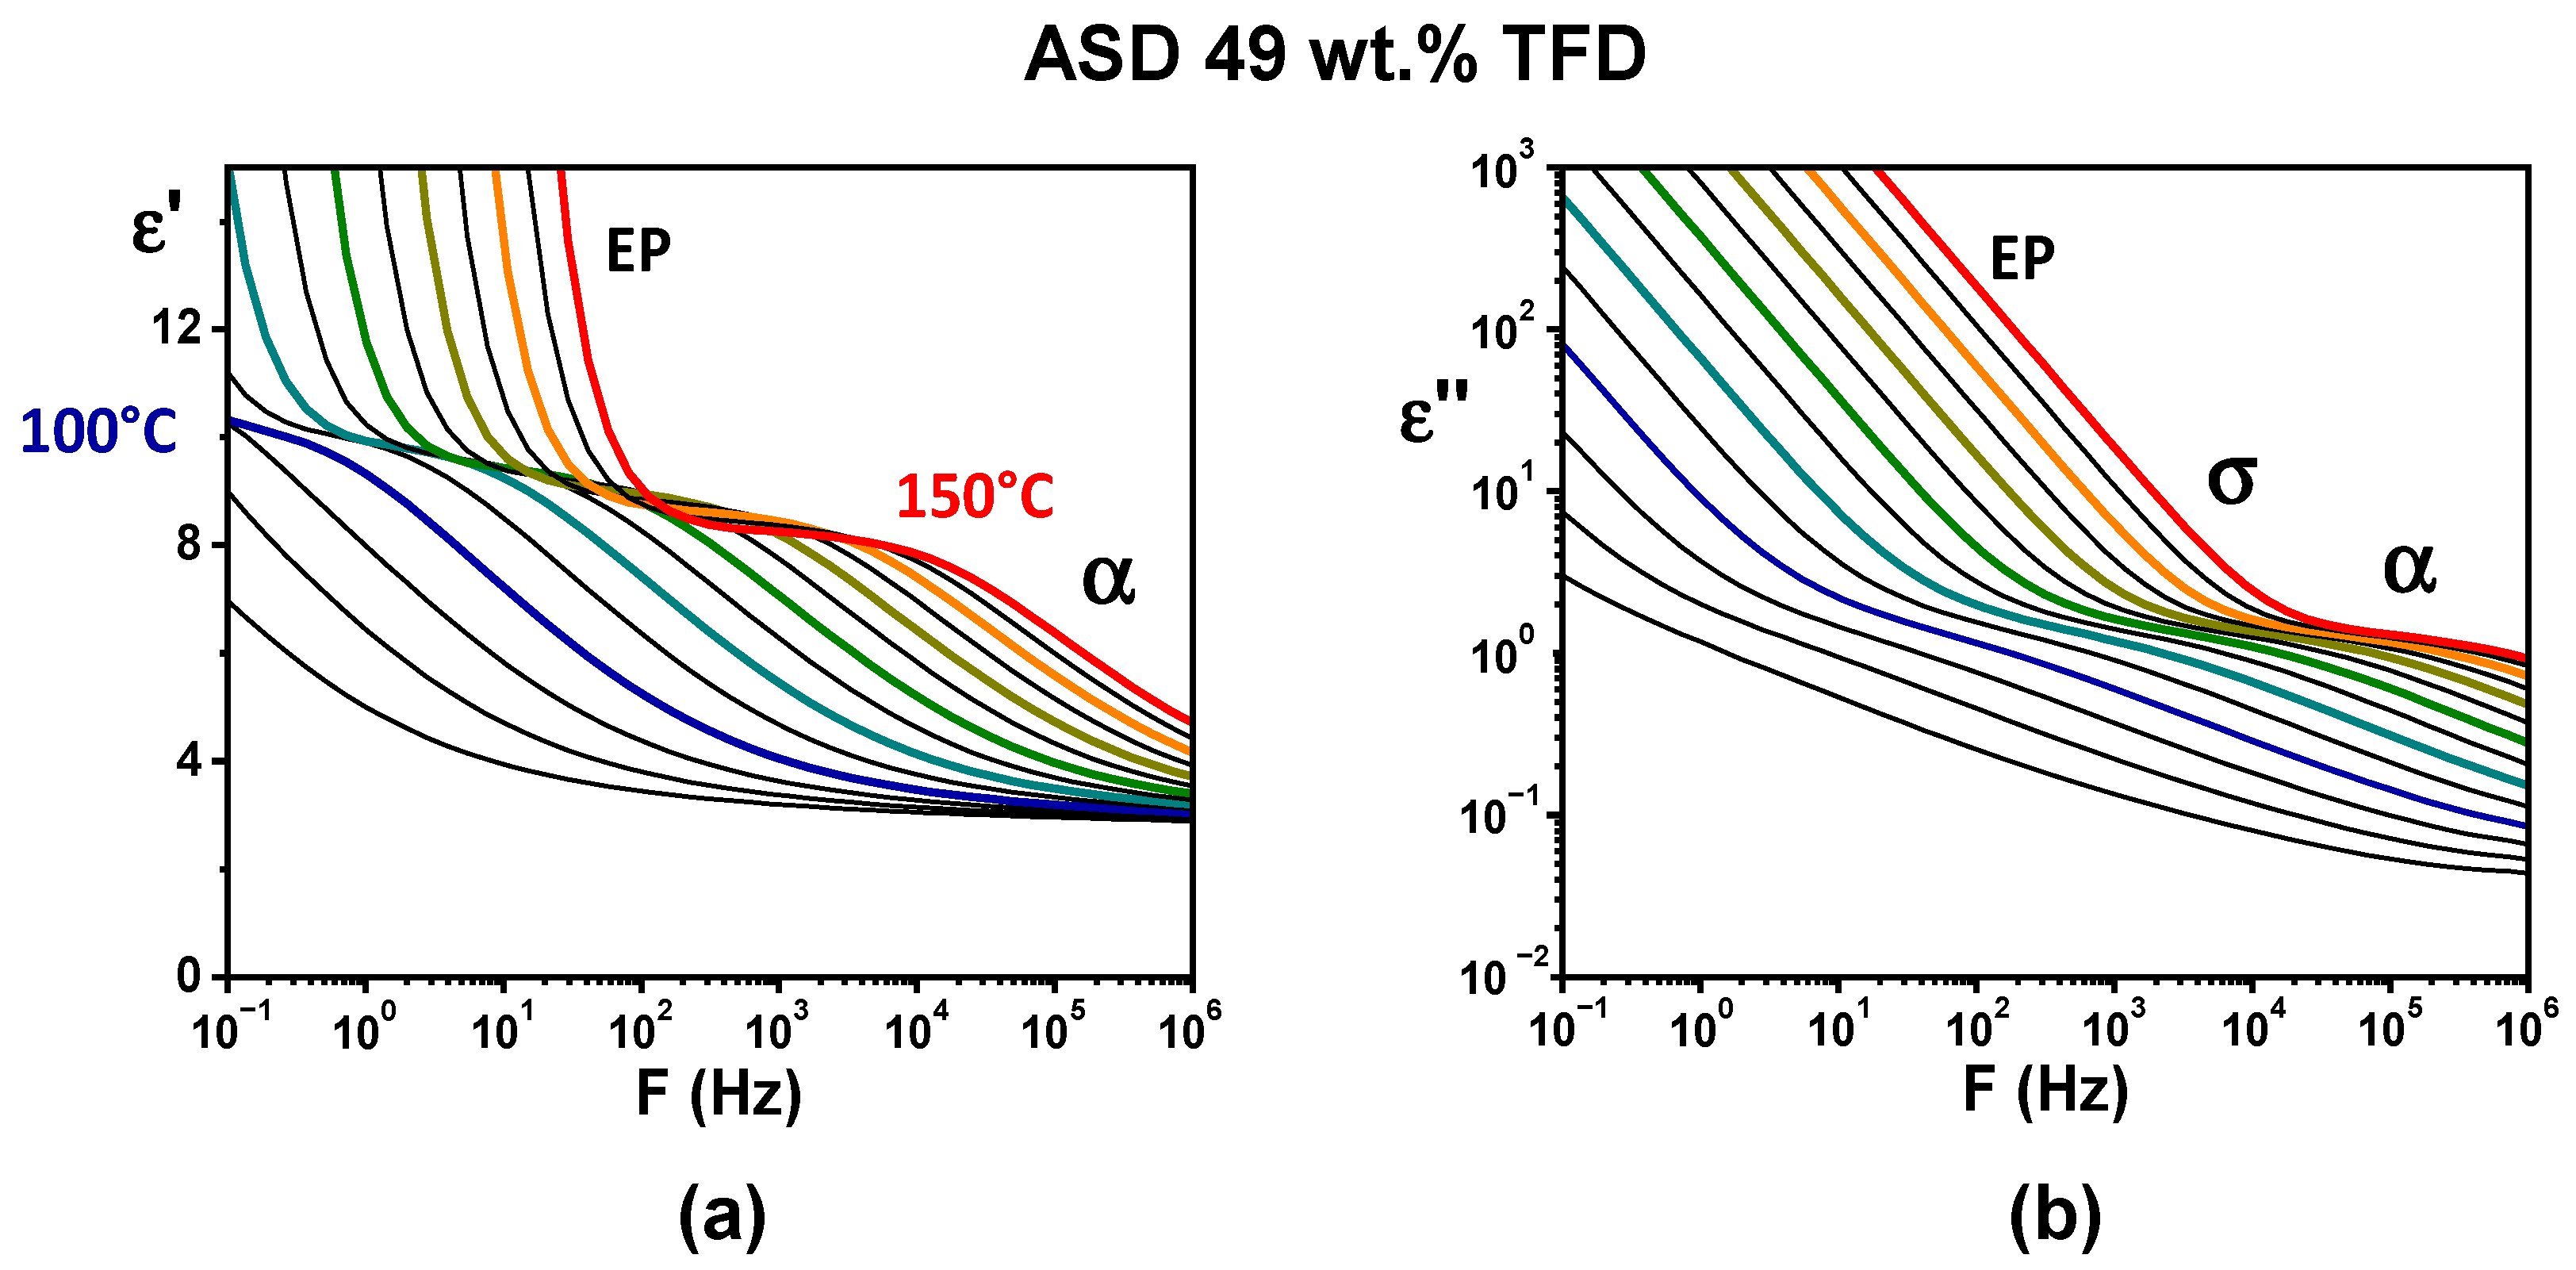
Figure 4 shows the evolution, versus the frequency of the applied electrical field, of the complex permittivity of the ASD containing 49 wt.% TFD recorded for isotherms ranging from 85 °C to 150 °C (real part,
ε′, in
Figure 4a and imaginary part,
ε″, in
Figure 4b). In
Figure 4a, a step-like decrease in
ε′ shifting towards high frequencies for increasing temperature can be seen, which suggests the shift of a relaxation mode. However, a clear observation of a peak on
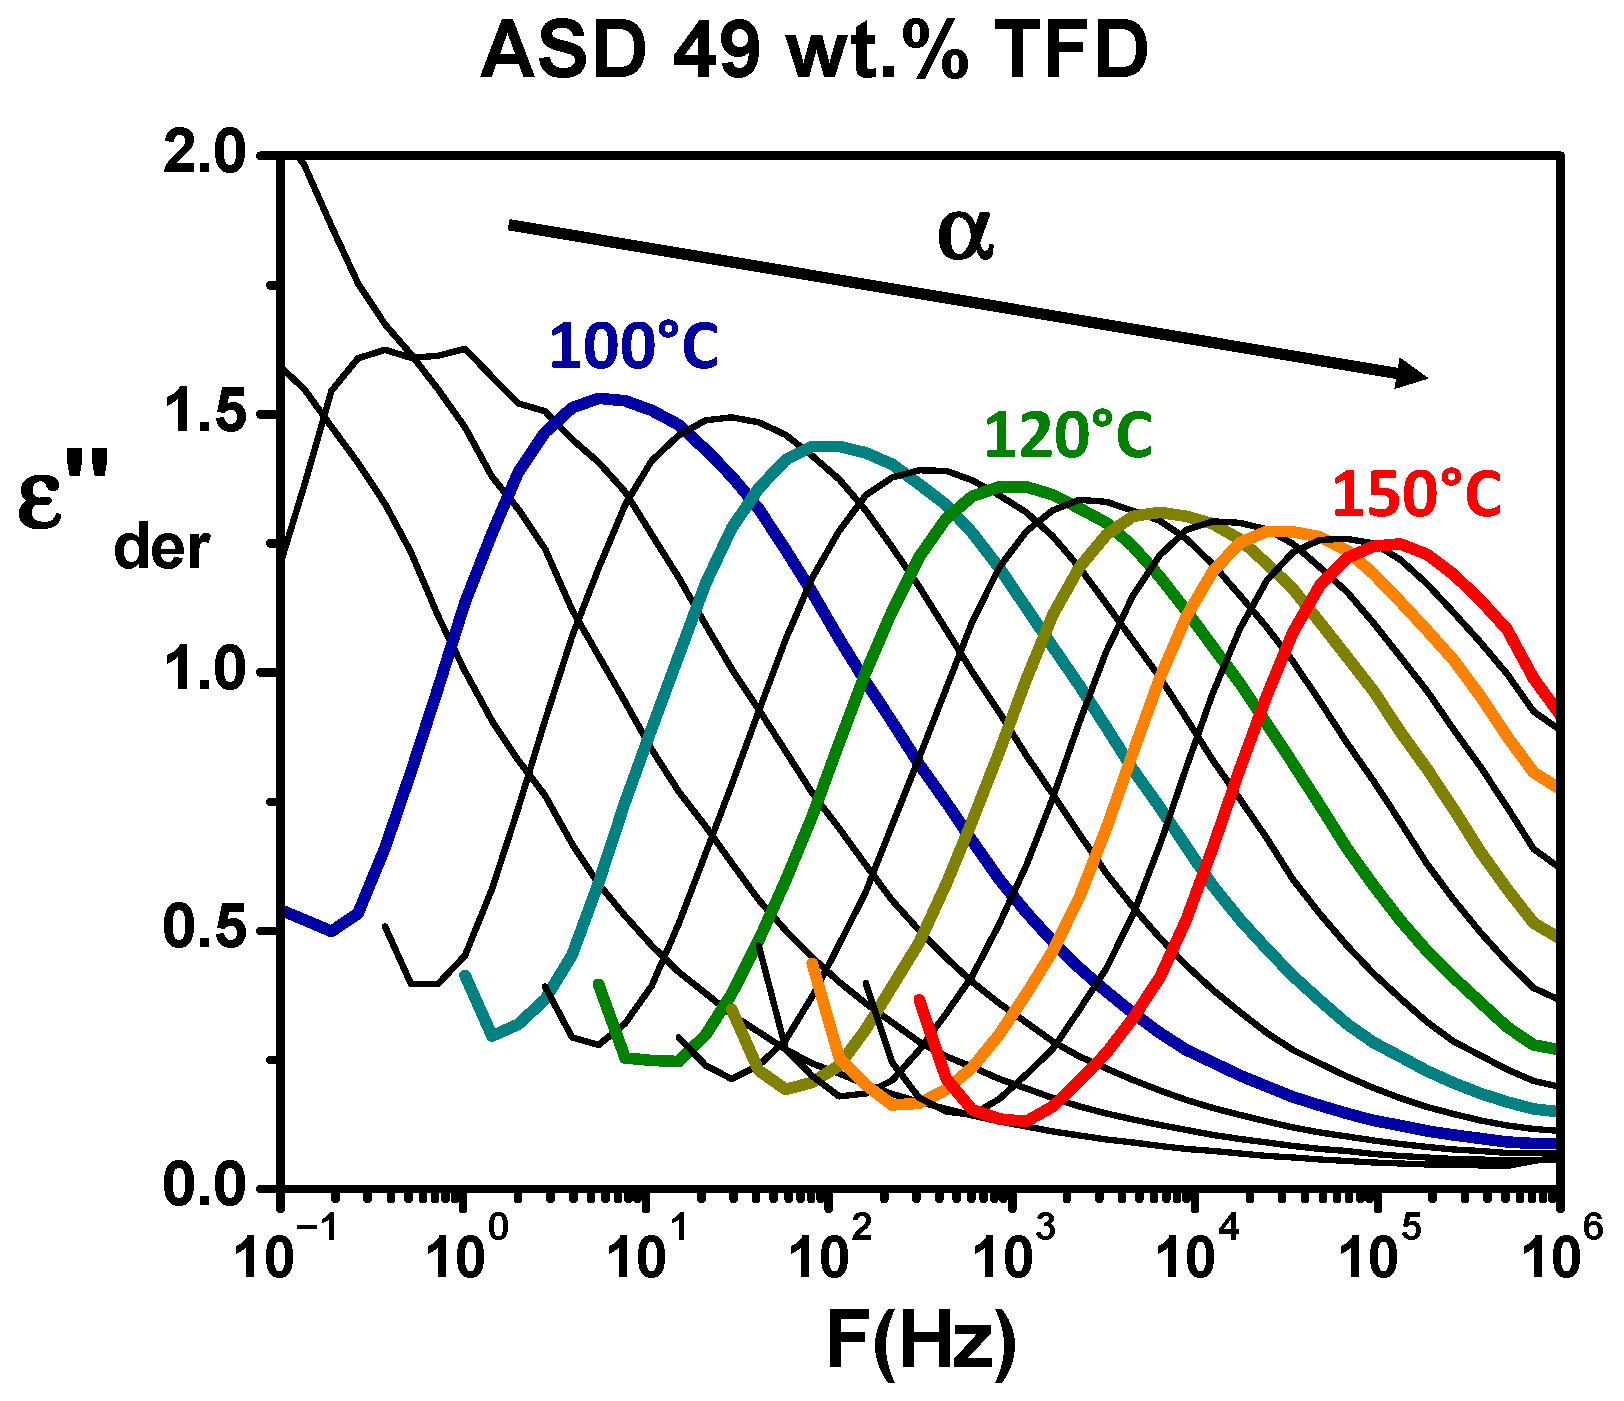
ε″ is prevented by the conductivity (σ) and the electrode polarisation (EP) appearing on lower frequencies. In order to obtain the ohmic-conduction free dielectric loss,
ε″ was calculated from the logarithmic derivative of the real part (denoted
ε″der, see
Section 2.5). The obtained spectra are reported in
Figure 5. Now, the shift towards high frequency with increasing temperature of a peak is clearly visible, revealing the
α (or main) relaxation associated with the dynamic glass transition.
The same type of experiments and analyses have been performed for the ASDs of different TFD contents. Recorded spectra can be seen in the
Supplementary Materials (see Figure S2). It should be pointed out that, in the case of the ASD containing 90 wt.% TFD, re-crystallisation occurs on heating as observed by DSC. Therefore, measurements presented were recorded during a second series of isotherms (after melting), but we checked that the low-temperature recordings were identical to those obtained during the first series before re-crystallisation.
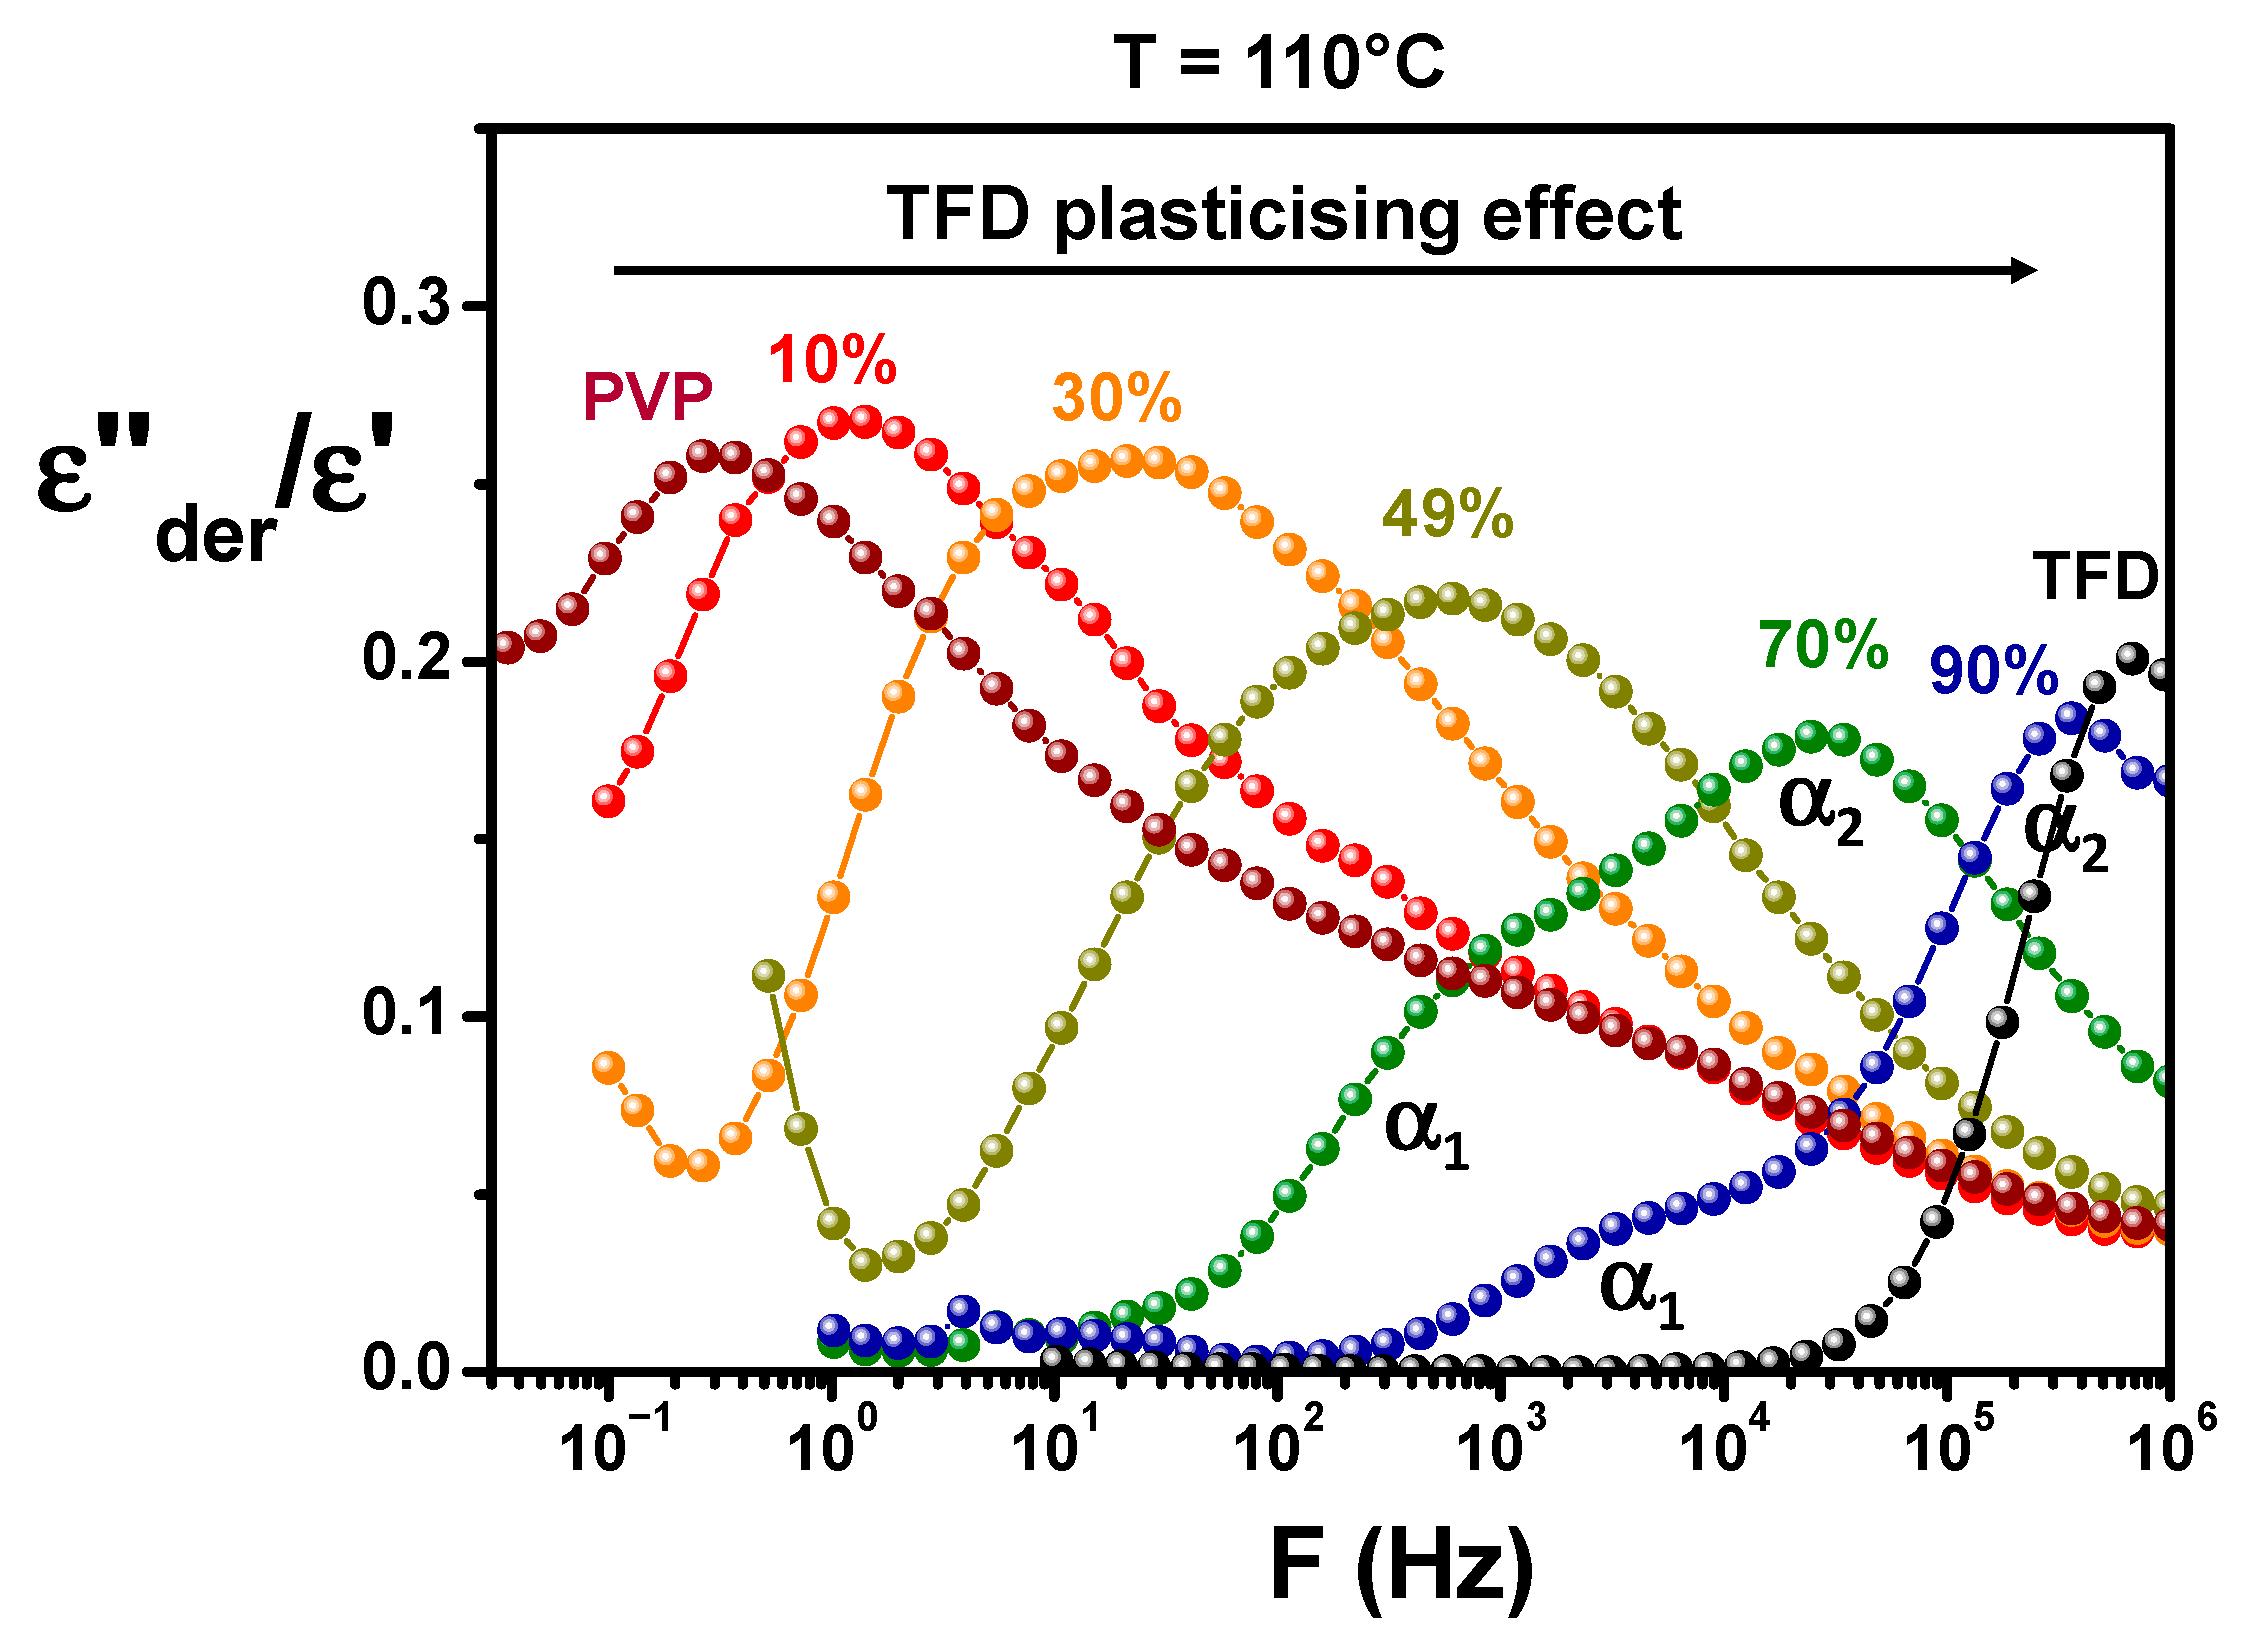
Figure 6 shows the comparison at 110 °C of the ASDs and pure compounds responses. It should be noted that to avoid a difference in the magnitude of spectra induced by a filling of the capacitor formed by the sample and the electrodes that could differ from one sample to another (samples being initially in the form of powder), the values of
ε″der calculated from
ε′ have been normalised by
ε′ values. From the analysis of
Figure 6, it appears, firstly, that, when the content of PVP in the blend increases, the main relaxation appears at lower frequencies, which means the dynamics is slowed down. It clearly shows the anti-plasticising effect of PVP on TFD/PVP blends already observed by MDSC. Secondly, the magnitude of the
α relaxation tends to decrease as the TFD content increases, in agreement with the relative magnitudes of pure compounds relaxation. Lastly, one can observe a change in the shape of the relaxation mode with the ASD composition. For a TFD content of 10 wt.%, the shape of the mode closely resembles that of pure PVP and is mainly marked by a broadening of the high frequency flank of the peak above 500 Hz corresponding to the overlapping with a secondary relaxation mode of PVP. This broadening can also be observed, to a lesser extent, for the ASD containing 30 wt.% TFD. However, independently of this effect, it can be seen that, when the TFD content increases (the PVP content decreases), the mode broadens (particularly visible for 49 wt.% TFD) and splits into two components with the appearance of an increasingly pronounced shoulder on the low-frequency side (70 wt.% and 90 wt.% TFD). It should be underlined that this shoulder is not an artefact resulting from the mathematical treatment of data. Indeed, for ASD containing 90 wt.% TFD, a slight shoulder can be detected (see
Figure S3a) on the low-frequency side of the relaxation mode on the
ε″(
F) spectra recorded at the highest temperatures where the conductivity and electrode polarisation are more decoupled from the main relaxation (for example, at 100 °C) and it appears in the same frequency range as the low-frequency component observed on
ε″der(
F) (~10
4 Hz at 110 °C). Therefore, although hardly visible on
ε″(
F) recordings due to partial overlap with the conductivity phenomenon, this component exists and is clearly revealed when the conductivity is suppressed by the mathematical treatment yielding
ε″der(
F). Moreover, the analysis of the complex dielectric modulus
M*(
ω) = 1/
ε*(
ω) shows that the shoulder can also be detected on the evolution versus frequency of the imaginary part
M″ not sensitive to electrode polarisation: It appears on the low-frequency side of the mode on recordings at the highest temperatures where the conductivity peak is more decoupled from the main relaxation (see
Figure S3c). Therefore, the shoulder observed at low frequencies on the
ε″der(
F) spectra for the ASDs with a high TFD content (70 wt.%, 90 wt.% TFD) is a genuine relaxation mode and not an artefact resulting from the mathematical treatment of data or from the flow of free charge carriers.
The relaxation time associated with this main relaxation has been determined from the frequency of the peak maximum for pure PVP and ASDs containing 10 wt.%, 30 wt.%, and 49 wt.% TFD. In this latter case, although the broadening of the mode suggests the dissociation into two components, they are too close to one another to be deconvoluted. For ASDs containing 70 wt.% and 90 wt.% TFD,
ε″der(
F) spectra were fitted with two HN functions (see
Section 2.5) allowing to extract the value of the relaxation time associated with the
α1 and
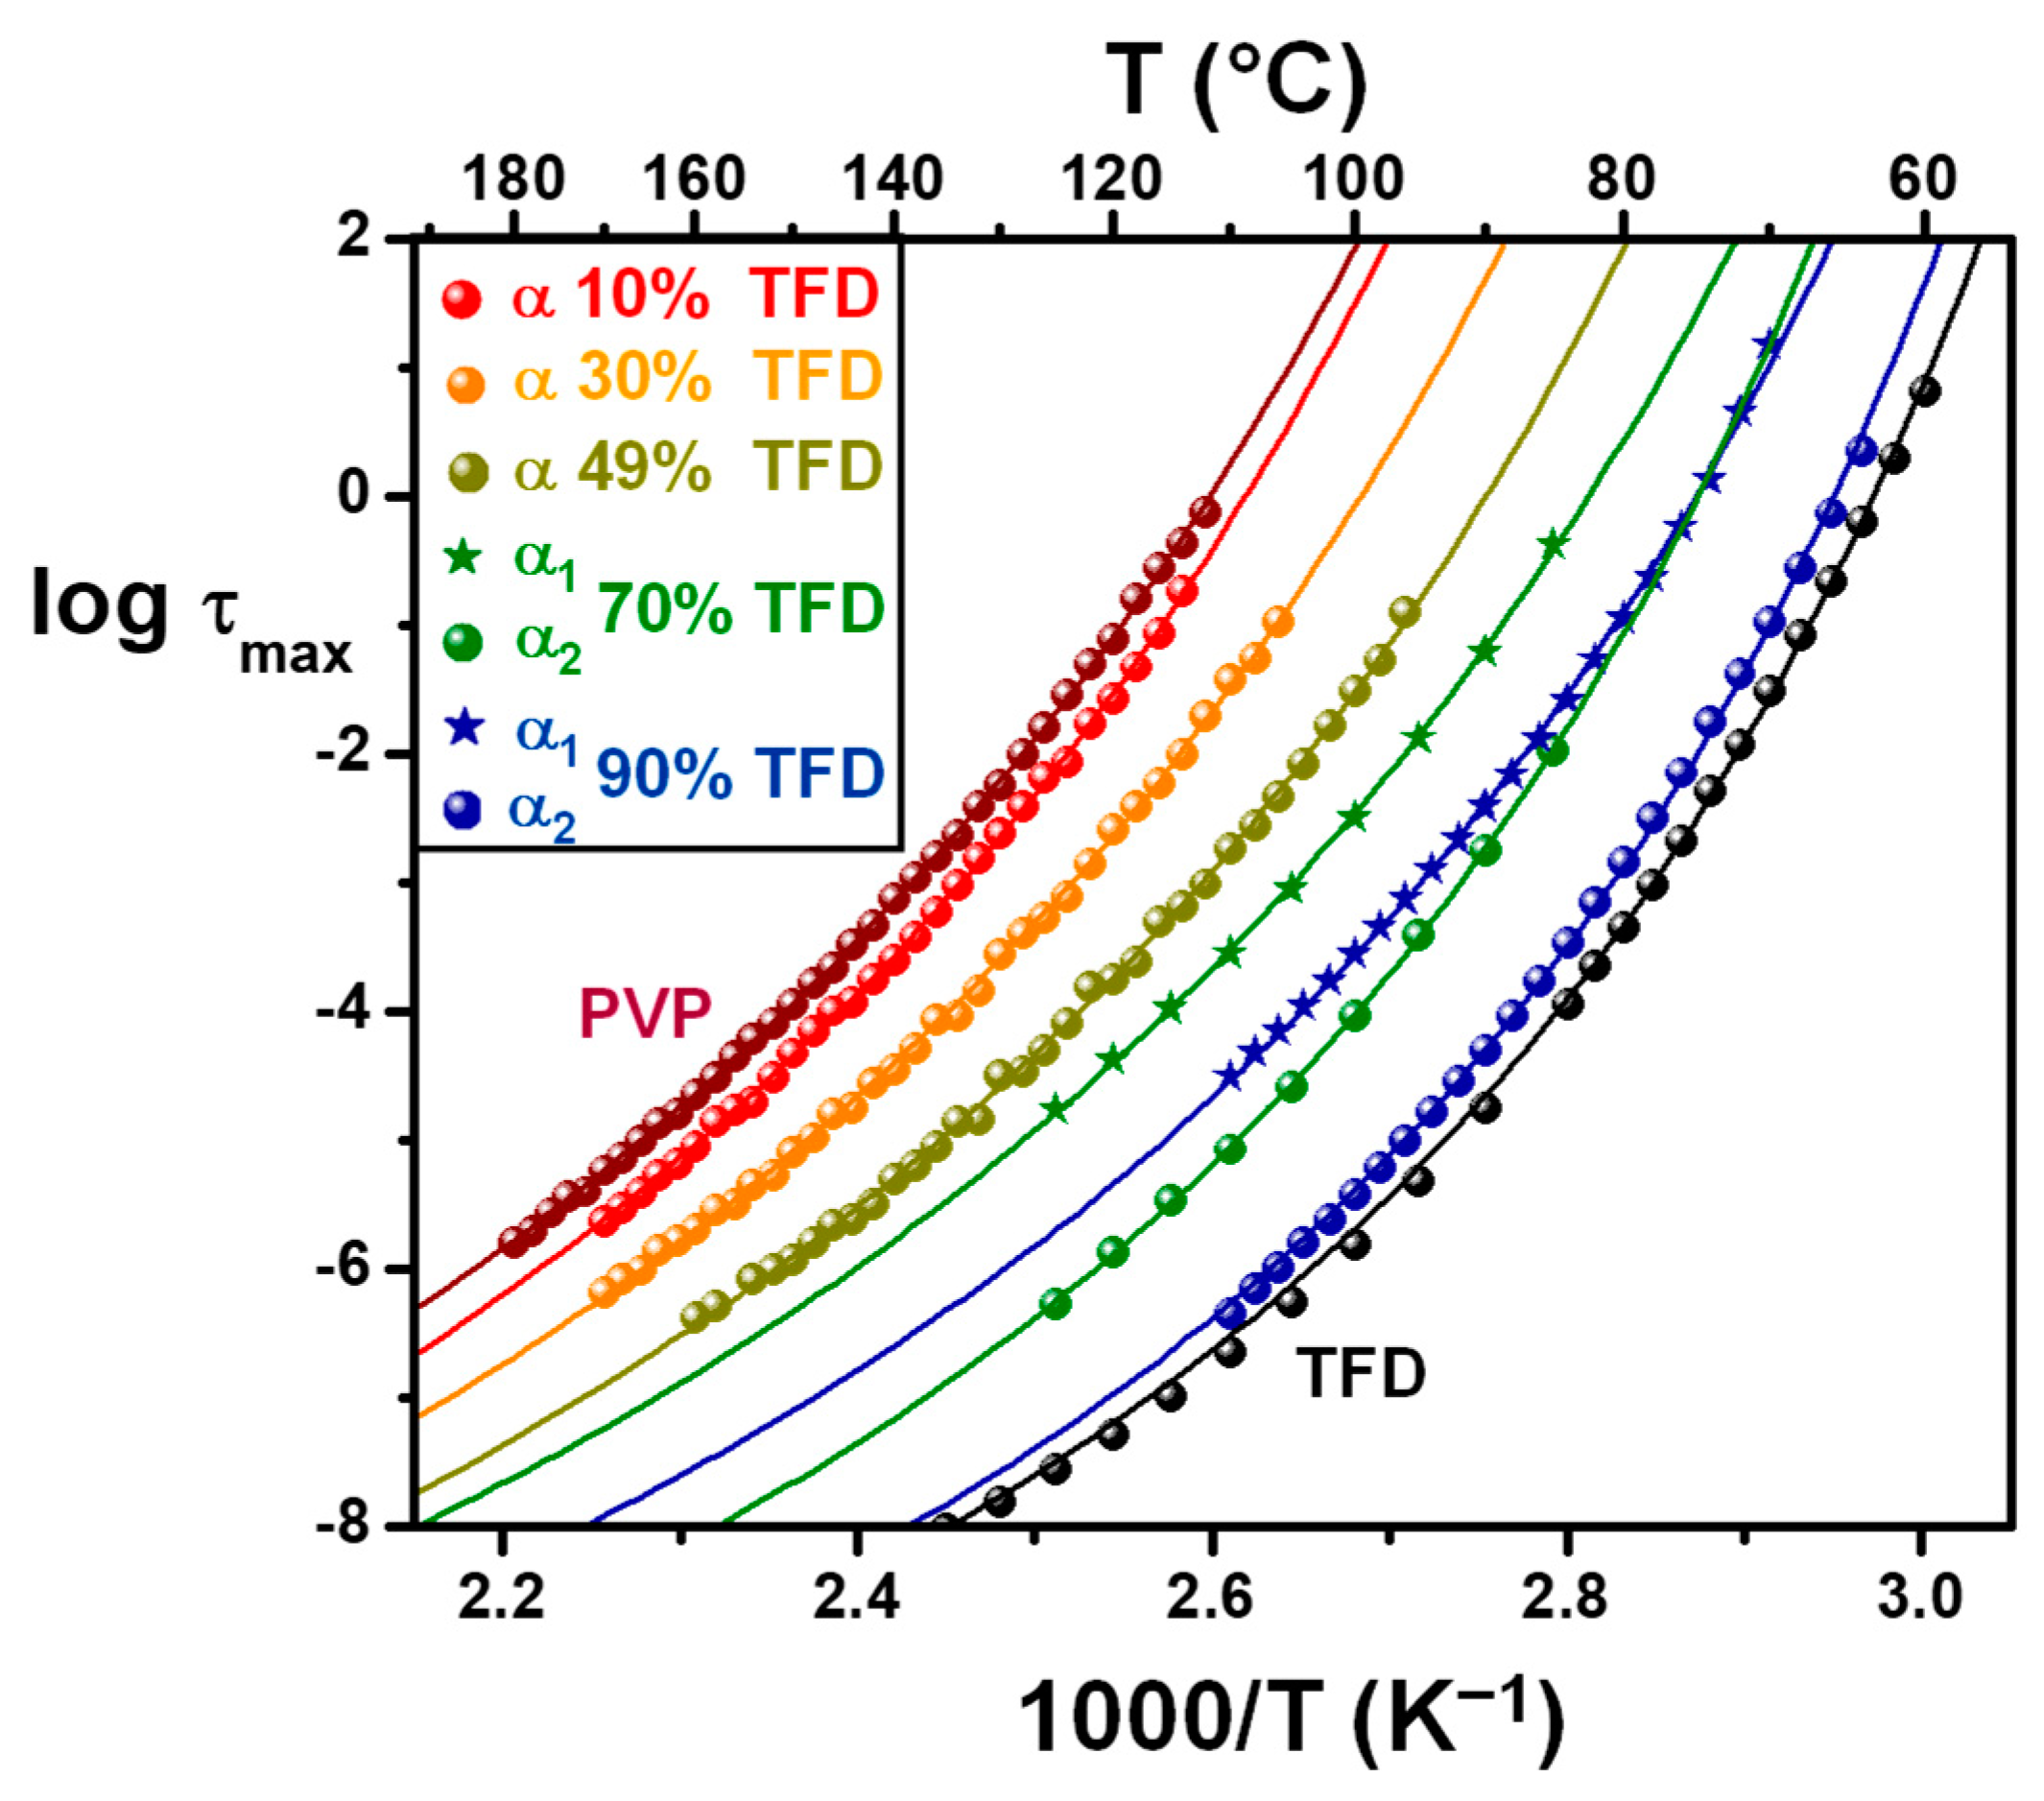
α2 modes corresponding, respectively, to the low- and high-frequency components. The temperature evolutions of these relaxation times are reported in an Arrhenius diagram in
Figure 7, along with the evolution of the relaxation time of the
α mode of pure PVP and pure TFD previously published in [
17]. These evolutions are clearly non-linear, and they have been fitted by a Vogel–Tammann–Fulcher–Hesse (VTFH) law [
29,
30,
31]:
where
τ∞ would be the relaxation time at infinite temperature,
T0 is the so-called Vogel temperature at which the relaxation time would diverge, and
B is a parameter that accounts for the curvature of the evolution. Owing to the lack of points for some blends, especially at low frequencies, and in order to compare the behaviour laws, the value of log
τ∞ has been fixed to −14 for all evolutions. The obtained values of
B and
T0 are reported in
Table 3.
Usually, the temperature at which the relaxation time characteristic of the
α relaxation of a glass-forming liquid reaches 100 s corresponds to the glass transition temperature. The extrapolation at
τ = 100 s of the VTFH fits of the relaxation times of the ASDs relaxation modes are reported in
Table 3 (
Tg, DRS). The values deduced from the extrapolation of the VTFH fits of the
α modes or the
α2 components are in good agreement with the
Tg values deduced from the MDSC experiments (see
Table 1) since
Tg, DRS either corresponds to the
Tg, onset for blends with the higher TFD contents (usually the case of small molecules) or is included in the
Tg, onset −
Tg, midpoint interval for blends with the higher PVP contents (the glass transition being larger for polymers) (see
Table 1 and
Figure 2). The degree of the departure of the temperature evolution of the relaxation time from an Arrhenius behaviour is usually quantified by the fragility index
m, defined as follows [
32,
33,
34]:
The fragility index can vary between 16, when there is no deviation from the Arrhenius law (liquids classified as strong [
35]) and 170, for the most important deviations [
36] (liquids classified as fragile [
35]). The calculated fragility indexes are reported in
Table 3: As the TFD content increases, they vary between the two extreme values
m = 70 (moderately fragile) and
m = 114 (very fragile) for, respectively, pure PVP and TFD. Since the value of the pre-exponential factor
τ∞ was fixed at 10
−14 s, the evolution of
m with the TFD content is directly linked to the difference
Tg, DRS −
T0 (approximately equal to the ratio
Tg/
m) according to Angell [
37].
The temperature evolution of the relaxation time of the
α1 component of ASDs containing 70 wt.% and 90 wt.% is well described by a VTFH law and the obtained values of the fitting parameters are well in line with those of
α modes or
α2 components, which supports well that this relaxation mode can be attributed to a dynamic glass transition. The findings for ASDs with 70 wt.% and 90 wt.% TFD of two modes,
α1 and
α2, associated with wide amplitude motions points out a heterogeneity of the main dynamics. This heterogeneity of the dynamics suggests a structural heterogeneity of ASDs. It can indicate that, for TFD content higher than 70 wt.%, the TFD/PVP blends are heterogeneous and consist of two amorphous phases of different compositions, each having its own main dynamics (
α1 and
α2) characterised by a relaxation time. It is challenging to determine the TFD content of each phase, but an estimate can be made by comparing the evolution of the relaxation times associated with
α1 and
α2 modes. For example, for the ASD with 90 wt.% TFD, one can observe in
Figure 7 that the
α1 mode is very close to the
α2 mode of the ASD with 70 wt.% TFD. This suggests that, in this blend, two amorphous phases coexist: one (
α2) containing around 90–95 wt.% TFD and another (
α1) containing slightly less than 70 wt.% TFD. It is not possible to determine the proportion of each phase in the blend but given the relative amplitudes of
α1 and
α2 modes, the former is very much in the minority. As for the ASD with 70 wt.% TFD, the comparison of the results obtained for the
α1 with the other
α or
α2 modes suggests that one phase (
α2) contains around 70 wt.% TFD while the other (
α1) contains around 60 wt.% TFD, the proportion of the latter although in the minority being quite important.
The striking point is that the thermodynamic investigation of the ASDs by MDSC did not reveal any heterogeneity since a single
Cp-jump was observed whatever the TFD content. Furthermore, no sign of a second glass transition was detected on the signal derivative (see
Figure 1). In addition, the application of a specific MDSC protocol allowing a dynamic study (heat capacity spectroscopy) revealed no heterogeneity of the dynamics, in particular for the ASDs with 70 wt.% and 90 wt.% TFD. However, previous studies have already reported the lack of reliability of a distinctive single glass transition as an indicator of the homogeneity of ASDs [
38]. Here, DRS appears as a technique more sensitive to structural heterogeneities than the thermodynamic techniques. Since the two
Tg, DRS deduced from the extrapolation at
τ = 100 s of the
α1 and
α2 components are included in the temperature range where the
Cp-jump develops, one explanation could be that this
Cp-jump spreads over a too-limited temperature range to allow a deconvolution of the two glass transitions. Another explanation could be that the dielectric probe (dipolar moments) is more sensitive to structural heterogeneities than the thermodynamic probe (heat flow exchanges) allowing to reveal them. These results emphasise the need of techniques other than the conventional DSC to assess the homogeneity of ASDs.
3.3. Mobility, Stability, and Solubility Relationships
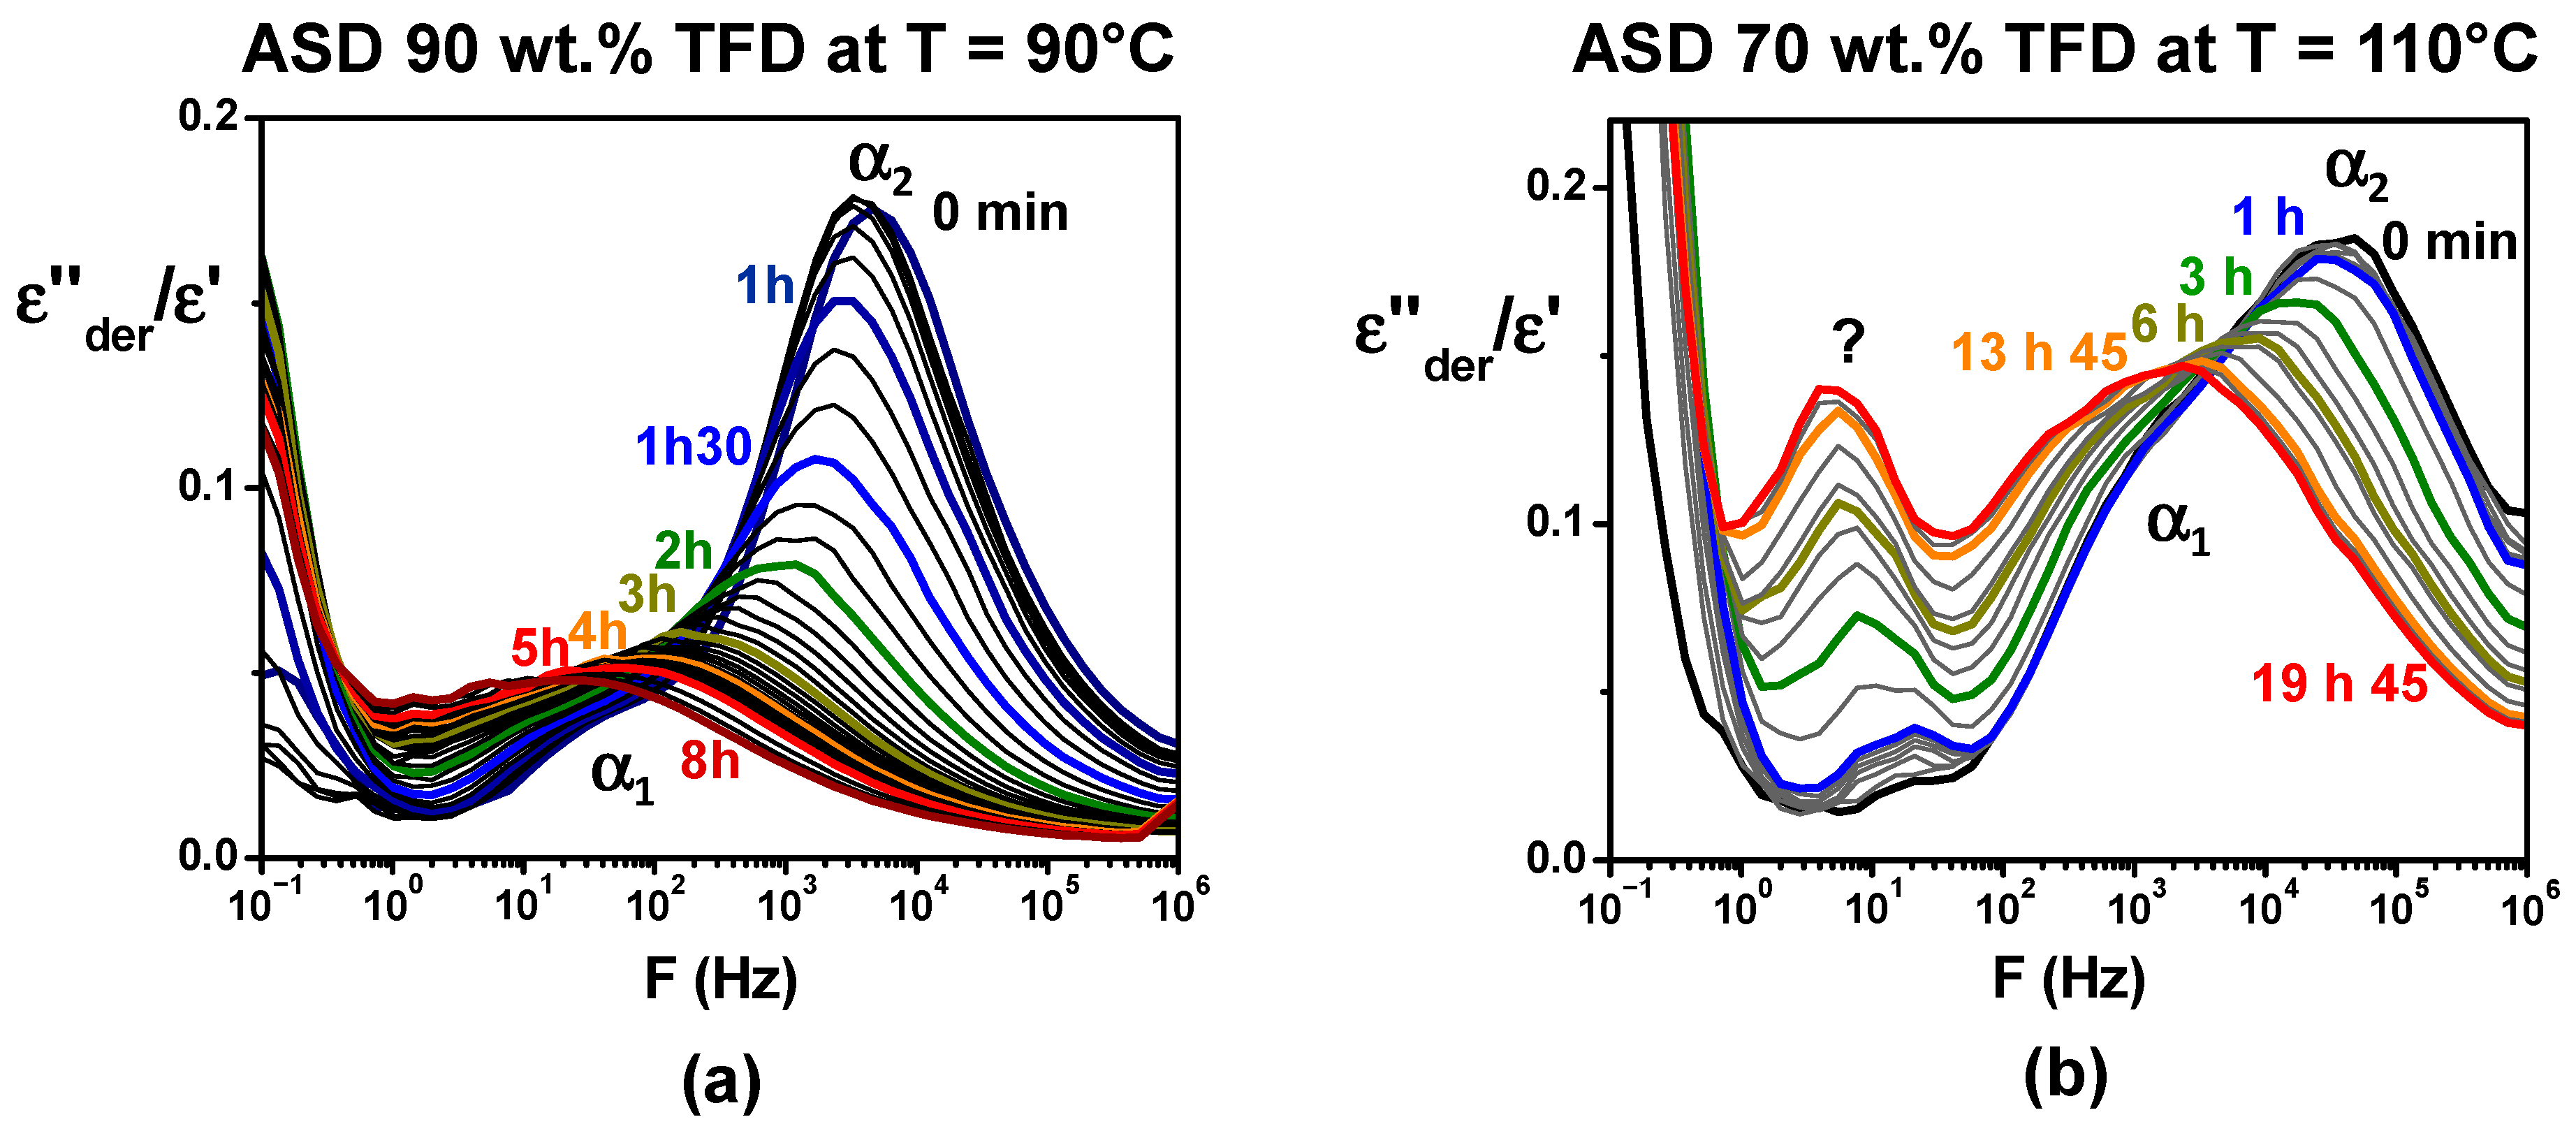
As previously mentioned, re-crystallisation of the ASD containing 90 wt.% TFD was observed during heating on a first series of recordings by DRS. We took the opportunity of such behaviour to gain information on the impact of the re-crystallisation on the main dynamics by following, for that blend, the evolution over time of the dielectric permittivity on successive recordings at 90 °C. The corresponding
ε″der/
ε′ ratios are reported versus frequency in
Figure 8a. It should be noted that this ratio is reported, rather than
ε″der, since it suppresses amplitude variations that could be induced by the softening of powder grains during the annealing. A sharp decrease in the
α2 component magnitude is quickly observed, indicating a re-crystallisation of TFD, while the maximum of the mode simultaneously shifts towards low frequency as the TFD content of the corresponding remaining amorphous phase decreases. The
α1 mode is less affected, resulting in the merging of both components, which indicates a homogenisation of the TFD content within the amorphous blend. After 2 h, the decrease in amplitude continues, albeit less significantly, and the continuous shift towards low frequency is mainly observed. After 8 h, it leads to a broad relaxation mode appearing on
ε″der(F) at 14 Hz, corresponding to log
τ = −1.94. The normalisation by
ε′ of
ε″der induces a shift in relaxations towards higher frequencies as the normalisation by
ε′ of
ε″ (tan
δ) does. By plotting this value in the Arrhenius diagram (T = 90 °C) of
Figure 7, we can roughly estimate that the remaining amorphous phase contains around 65 wt.% TFD. It is interesting to note that during the DSC monitoring of the re-crystallisation at 90 °C, we found that after 15 h, the remaining amorphous phase contained 68 wt.% TFD. The dielectric spectroscopy results are, therefore, consistent with those obtained by DSC: During an isotherm at 90 °C, the TFD re-crystallises until the remaining amorphous phase contains approximately 65–70 wt.% TFD. The same type of study was also carried out on the ASD containing 70 wt.% TFD.
Figure 8b shows the evolution over time of
ε″der/
ε′ recorded at 110 °C. As previously, the spectra evolve, though more slowly. The magnitude of the
α2 component decreases (mainly over the first 6 h) and the mode shifts towards the
α1 mode that evolves slower. It leads to a broad mode, which indicates the partial re-crystallisation of TFD and the depletion in TFD of the remaining amorphous phase. Another striking fact is the simultaneous appearance and development of a new peak at lower frequencies. It is, however, difficult, without a complete investigation of its temperature evolution, to assess whether it is an
α relaxation associated with a new phase. After 20 h at 110 °C, it is difficult to distinguish the
α2 and
α1 components, but shoulders reminiscent of these components appear around 2.8 kHz and 270 Hz, while the additional peak appears at 5 Hz. It corresponds, respectively, to log
τ = −3.58, log
τ = −3.14, and log
τ = −1.4. By plotting these values on the Arrhenius diagram in
Figure 7, we can estimate that the remaining blend contains mainly between 50 wt.% and 60 wt.% TFD (with a few of another phase containing 30 wt.% TFD when considering the additional peak is an
α relaxation). During a similar experiment performed by MDSC, the
Tg of the blend rose from 72 °C (content of 70 wt.% TFD) to 78 °C, which, plotted on the Gordon–Taylor diagram in
Figure 2, corresponds to a TFD content of 55 wt.%, in good agreement with DRS results. Lastly, an isothermal study at 110 °C carried out by DRS and MDSC for the ASD with 49 wt.% TFD showed that in that case, there was no change over 36 h.
According to the phase diagram established in
Figure 2, at 110 °C, the equilibrium concentration of TFD in PVP is estimated to be 30 wt.%; therefore, during an isotherm at 110 °C, ASDs initially containing 49 wt.% and 70 wt.% TFD should both re-crystallise until the remaining blends reach a TFD concentration of 30 wt.%. However, the DRS results show that, for the former, the TFD content does not change and for the latter, it also tends towards a concentration close to 50 wt.%. One can note, however, that, when the new peak is considered as an
α relaxation, the associated phase actually contains 30 wt.% TFD. At 90 °C, the TFD equilibrium concentration in PVP is estimated to be 15 wt.%. However, as the TFD concentration decreases, the temperature of the glass transition of the blend increases, so it is expected that the TFD content will not fall below 45 wt.%–50 wt.% (corresponding to the temperature of the ending of the
Cp-jump) (see
Figure 2) because the mobility (diffusion) of TFD in PVP will be blocked. Here, again, the TFD content reached during an isotherm at 90 °C is higher (estimated content of 65 wt.%–70 wt.%). The driven amorphous solid dispersions obtained by co-milling, therefore, re-crystallise less than predicted by the solubility limit, despite long isotherms, and remain supersaturated for a longer time. This is particularly the case for the ASD with 50 wt.% TFD, which does not evolve at 110 °C for 36 h). This suggests that re-crystallisation (growth of nuclei left by milling) is blocked by a too-slow mobility (particularly of the PVP chains) at the temperatures tested, despite being 25–35 degrees higher than
Tg, end. In a study carried out on Indomethacin/PVP blends with PVP of different molar masses, it was shown by Mohapatra et al. that viscosity seems to be a key factor in the stability of ASDs [
13]. Furthermore, Sahoo and co-workers recently related the ability of a polymer to prevent the crystallisation of the drug to the critical polymer concentration,
C*, defined in the polymer solution theory, below which polymer chains tend to exclude one another [
39]. The authors suggested that, above
C*, the crystallisation of the drug could be limited by the limited gaps between polymer chains. Another explanation they invoked could be the rapid increase in the viscosity occurring for polymer concentrations exceeding
C*. It would, therefore, be interesting to perform viscosity measurements of the TFD/PVP ASDs. Such an investigation of the ASD viscosity evolution could help determine whether there exists a limiting viscosity above which demixing/crystallisation is blocked.


