
Testing Small-Strain Dynamic Characteristics of Expanded Polystyrene Lightweight Soil: Reforming the Teaching of Engineering Detection Experiments


Abstract
1. Introduction
2. Materials and Methods
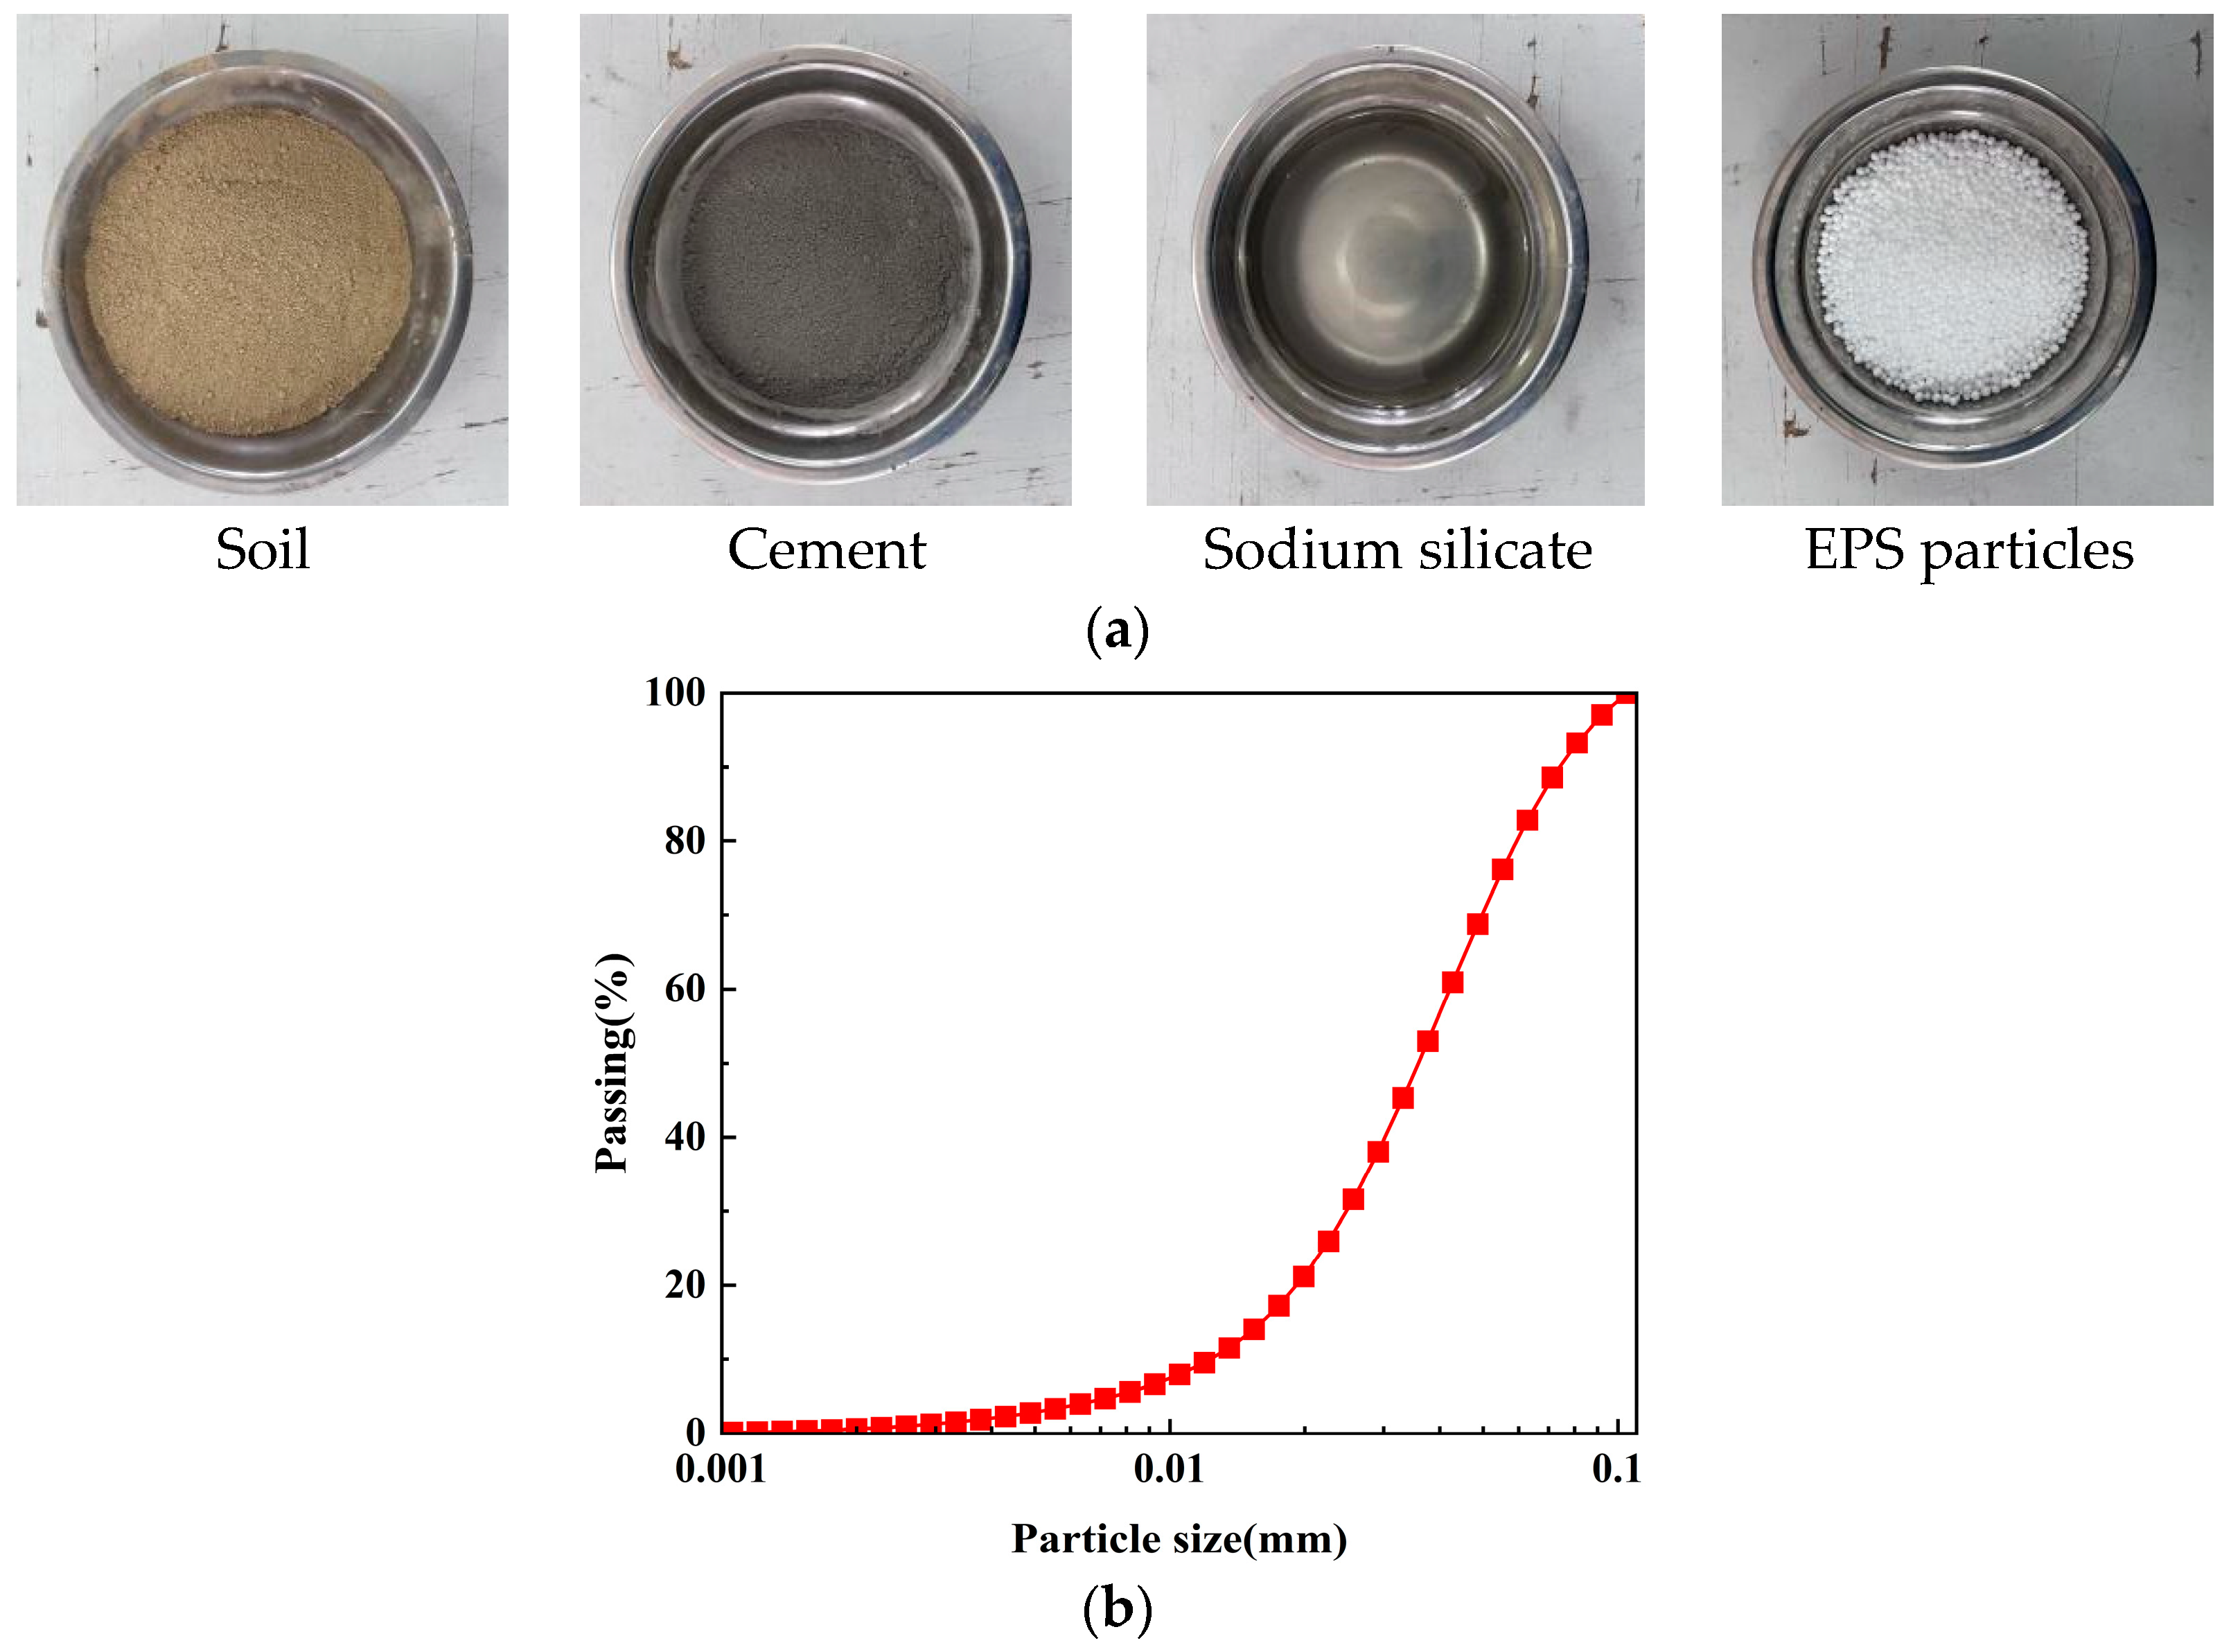
2.1. Materials
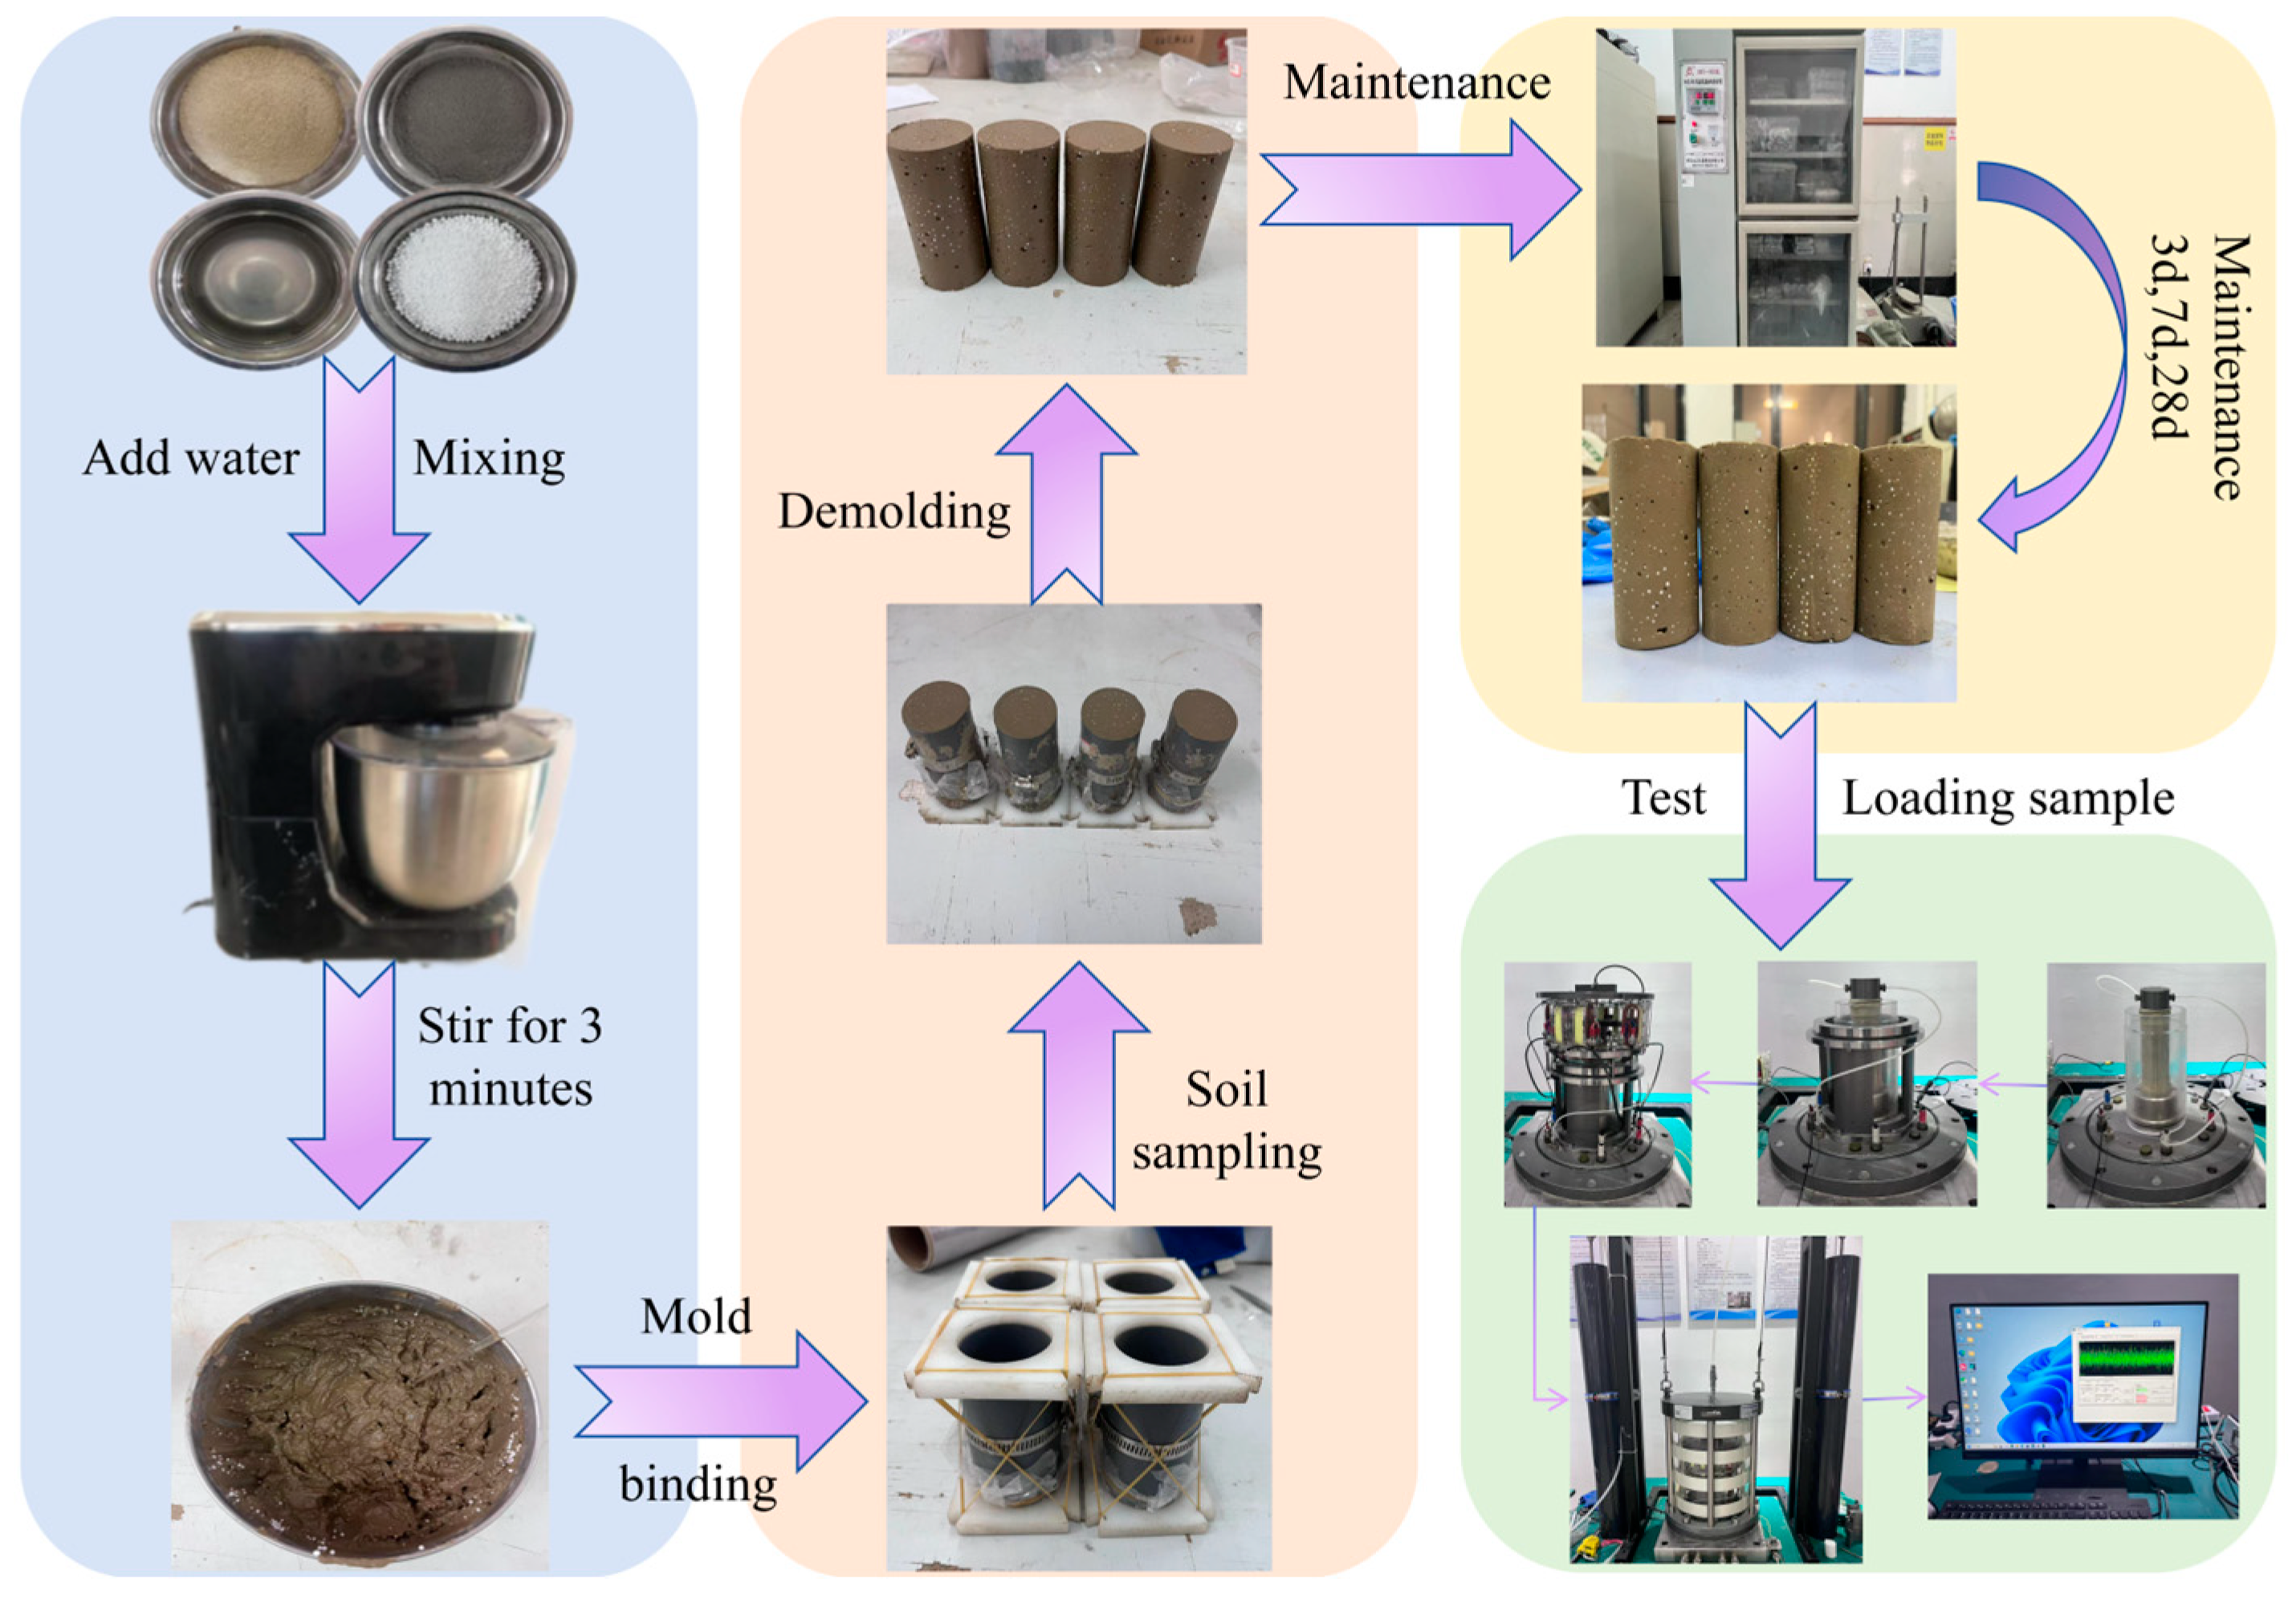
2.2. Specimen Preparation
2.3. Test Program
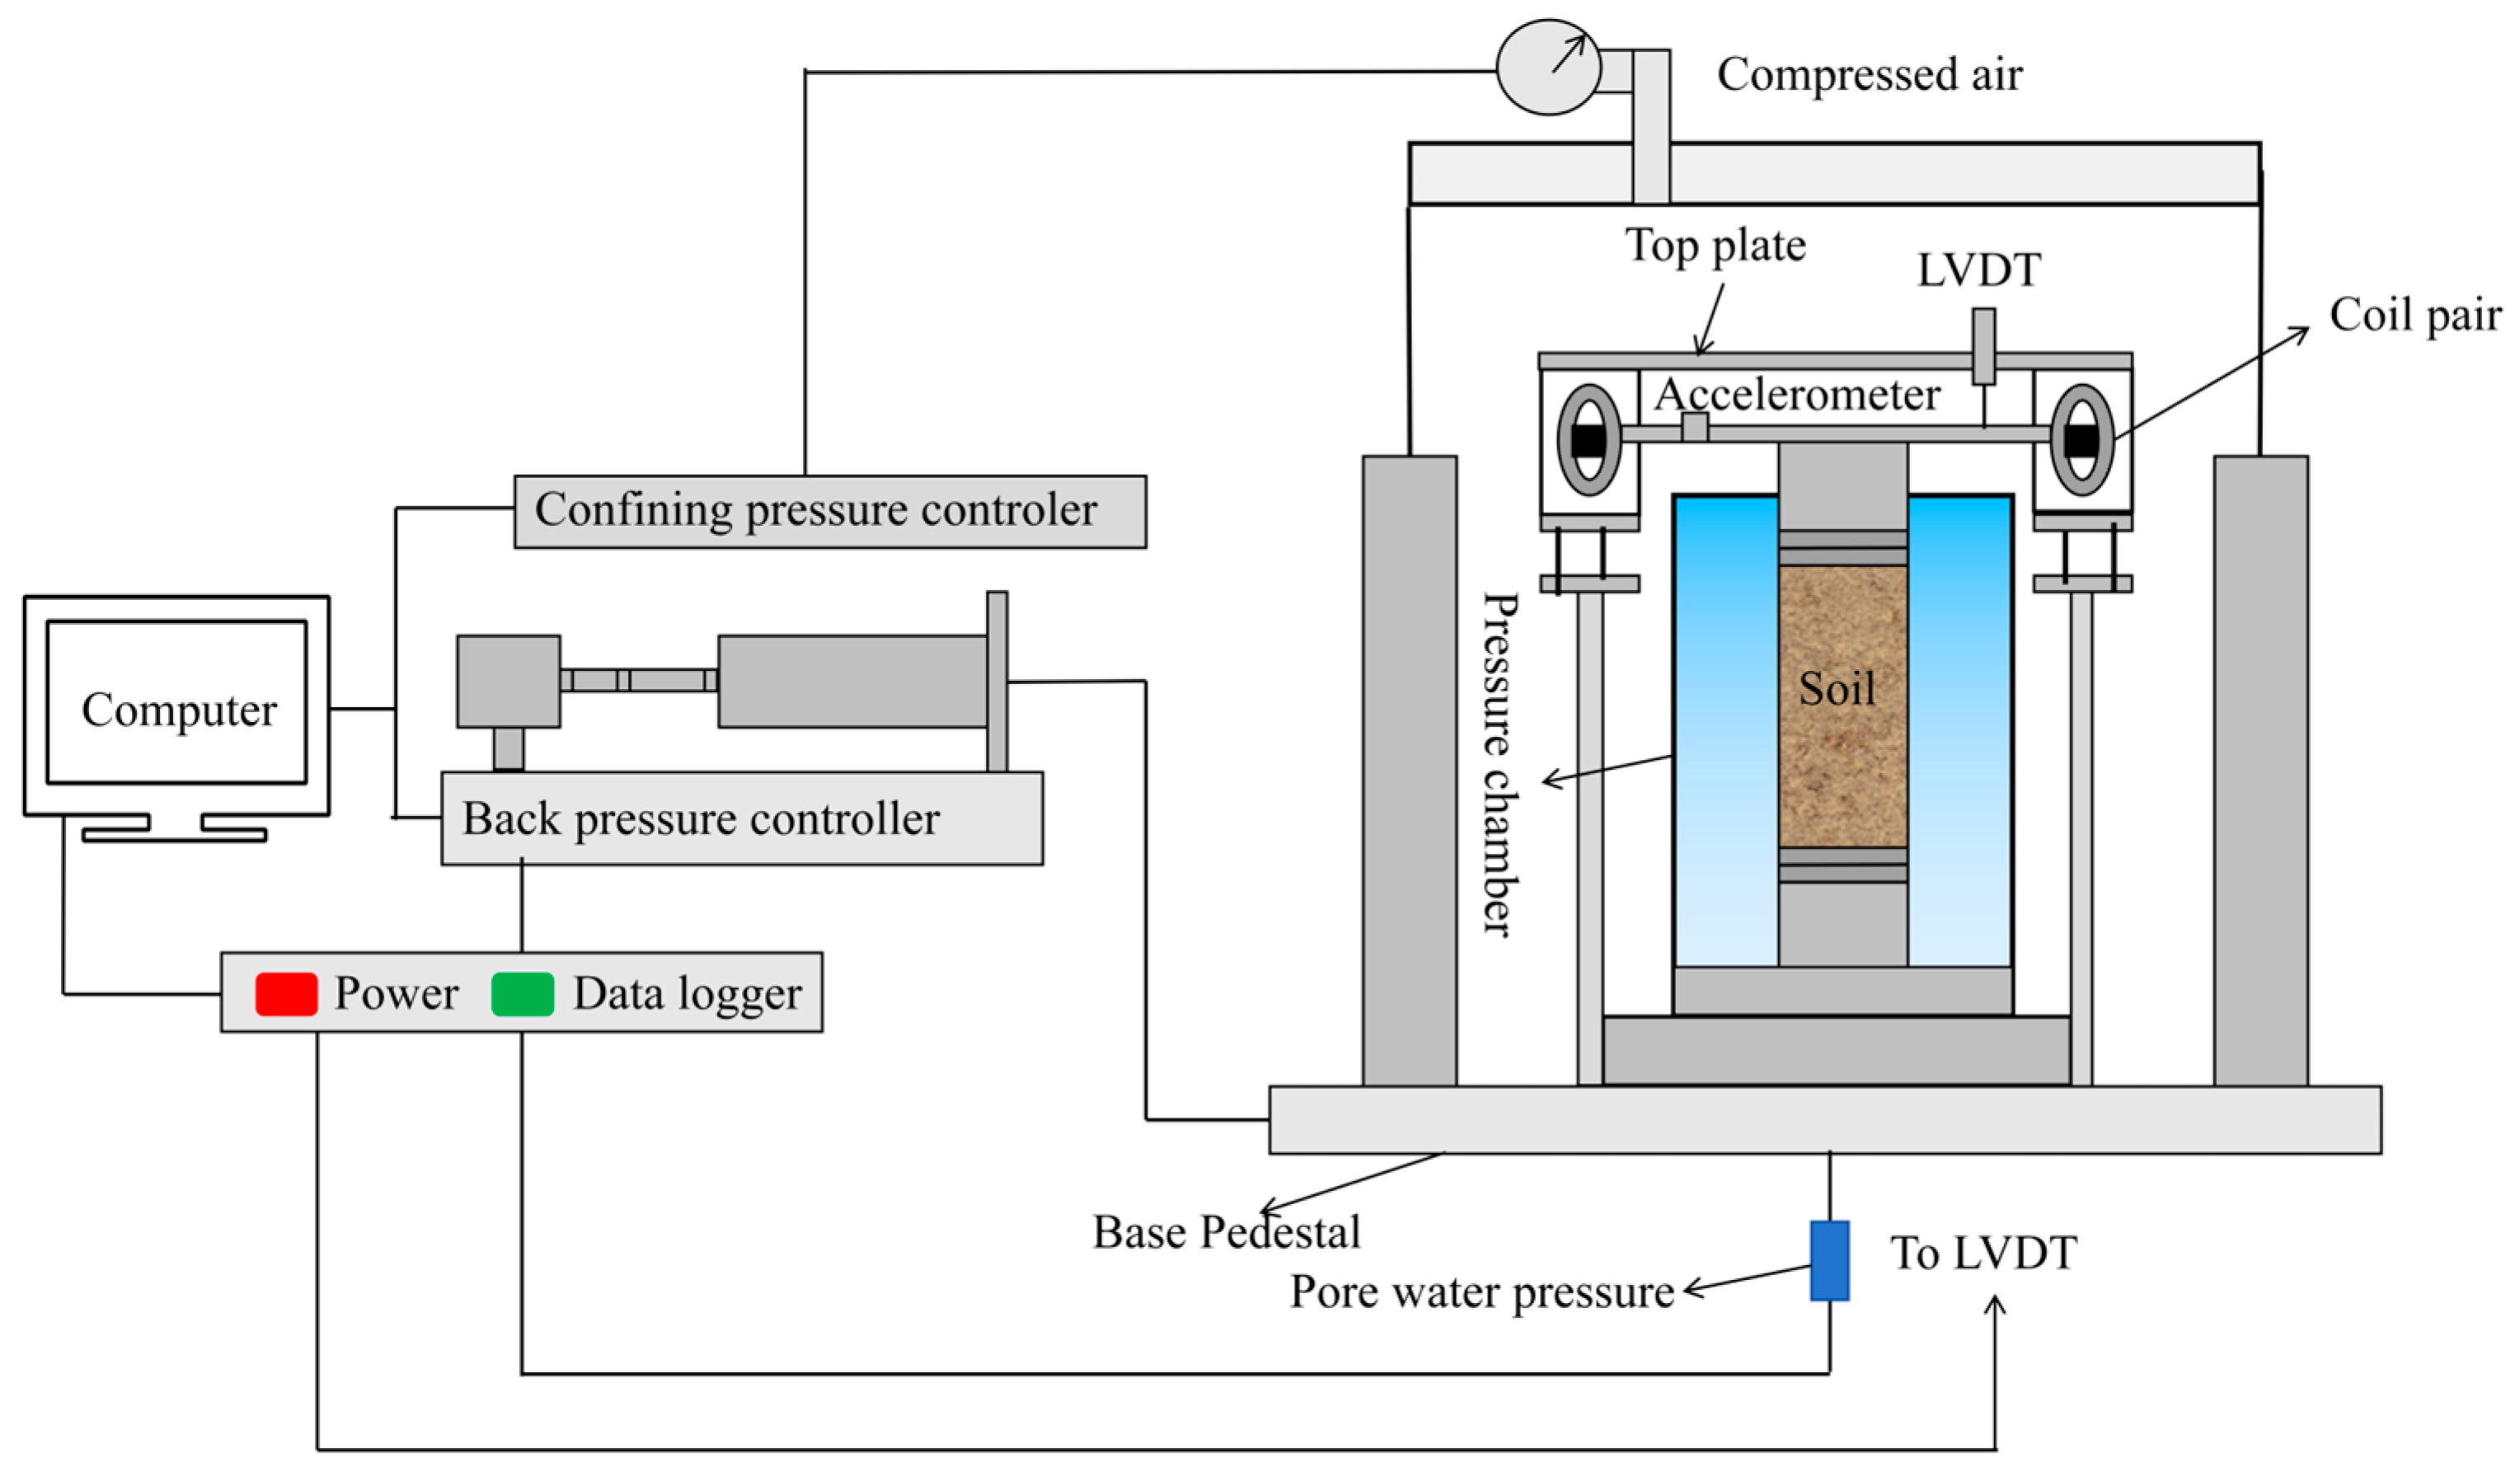
2.3.1. Resonance Column Trialing System
2.3.2. Resonance Column Test Program
2.3.3. Resonance Column Test Procedure
3. Results and Analysis
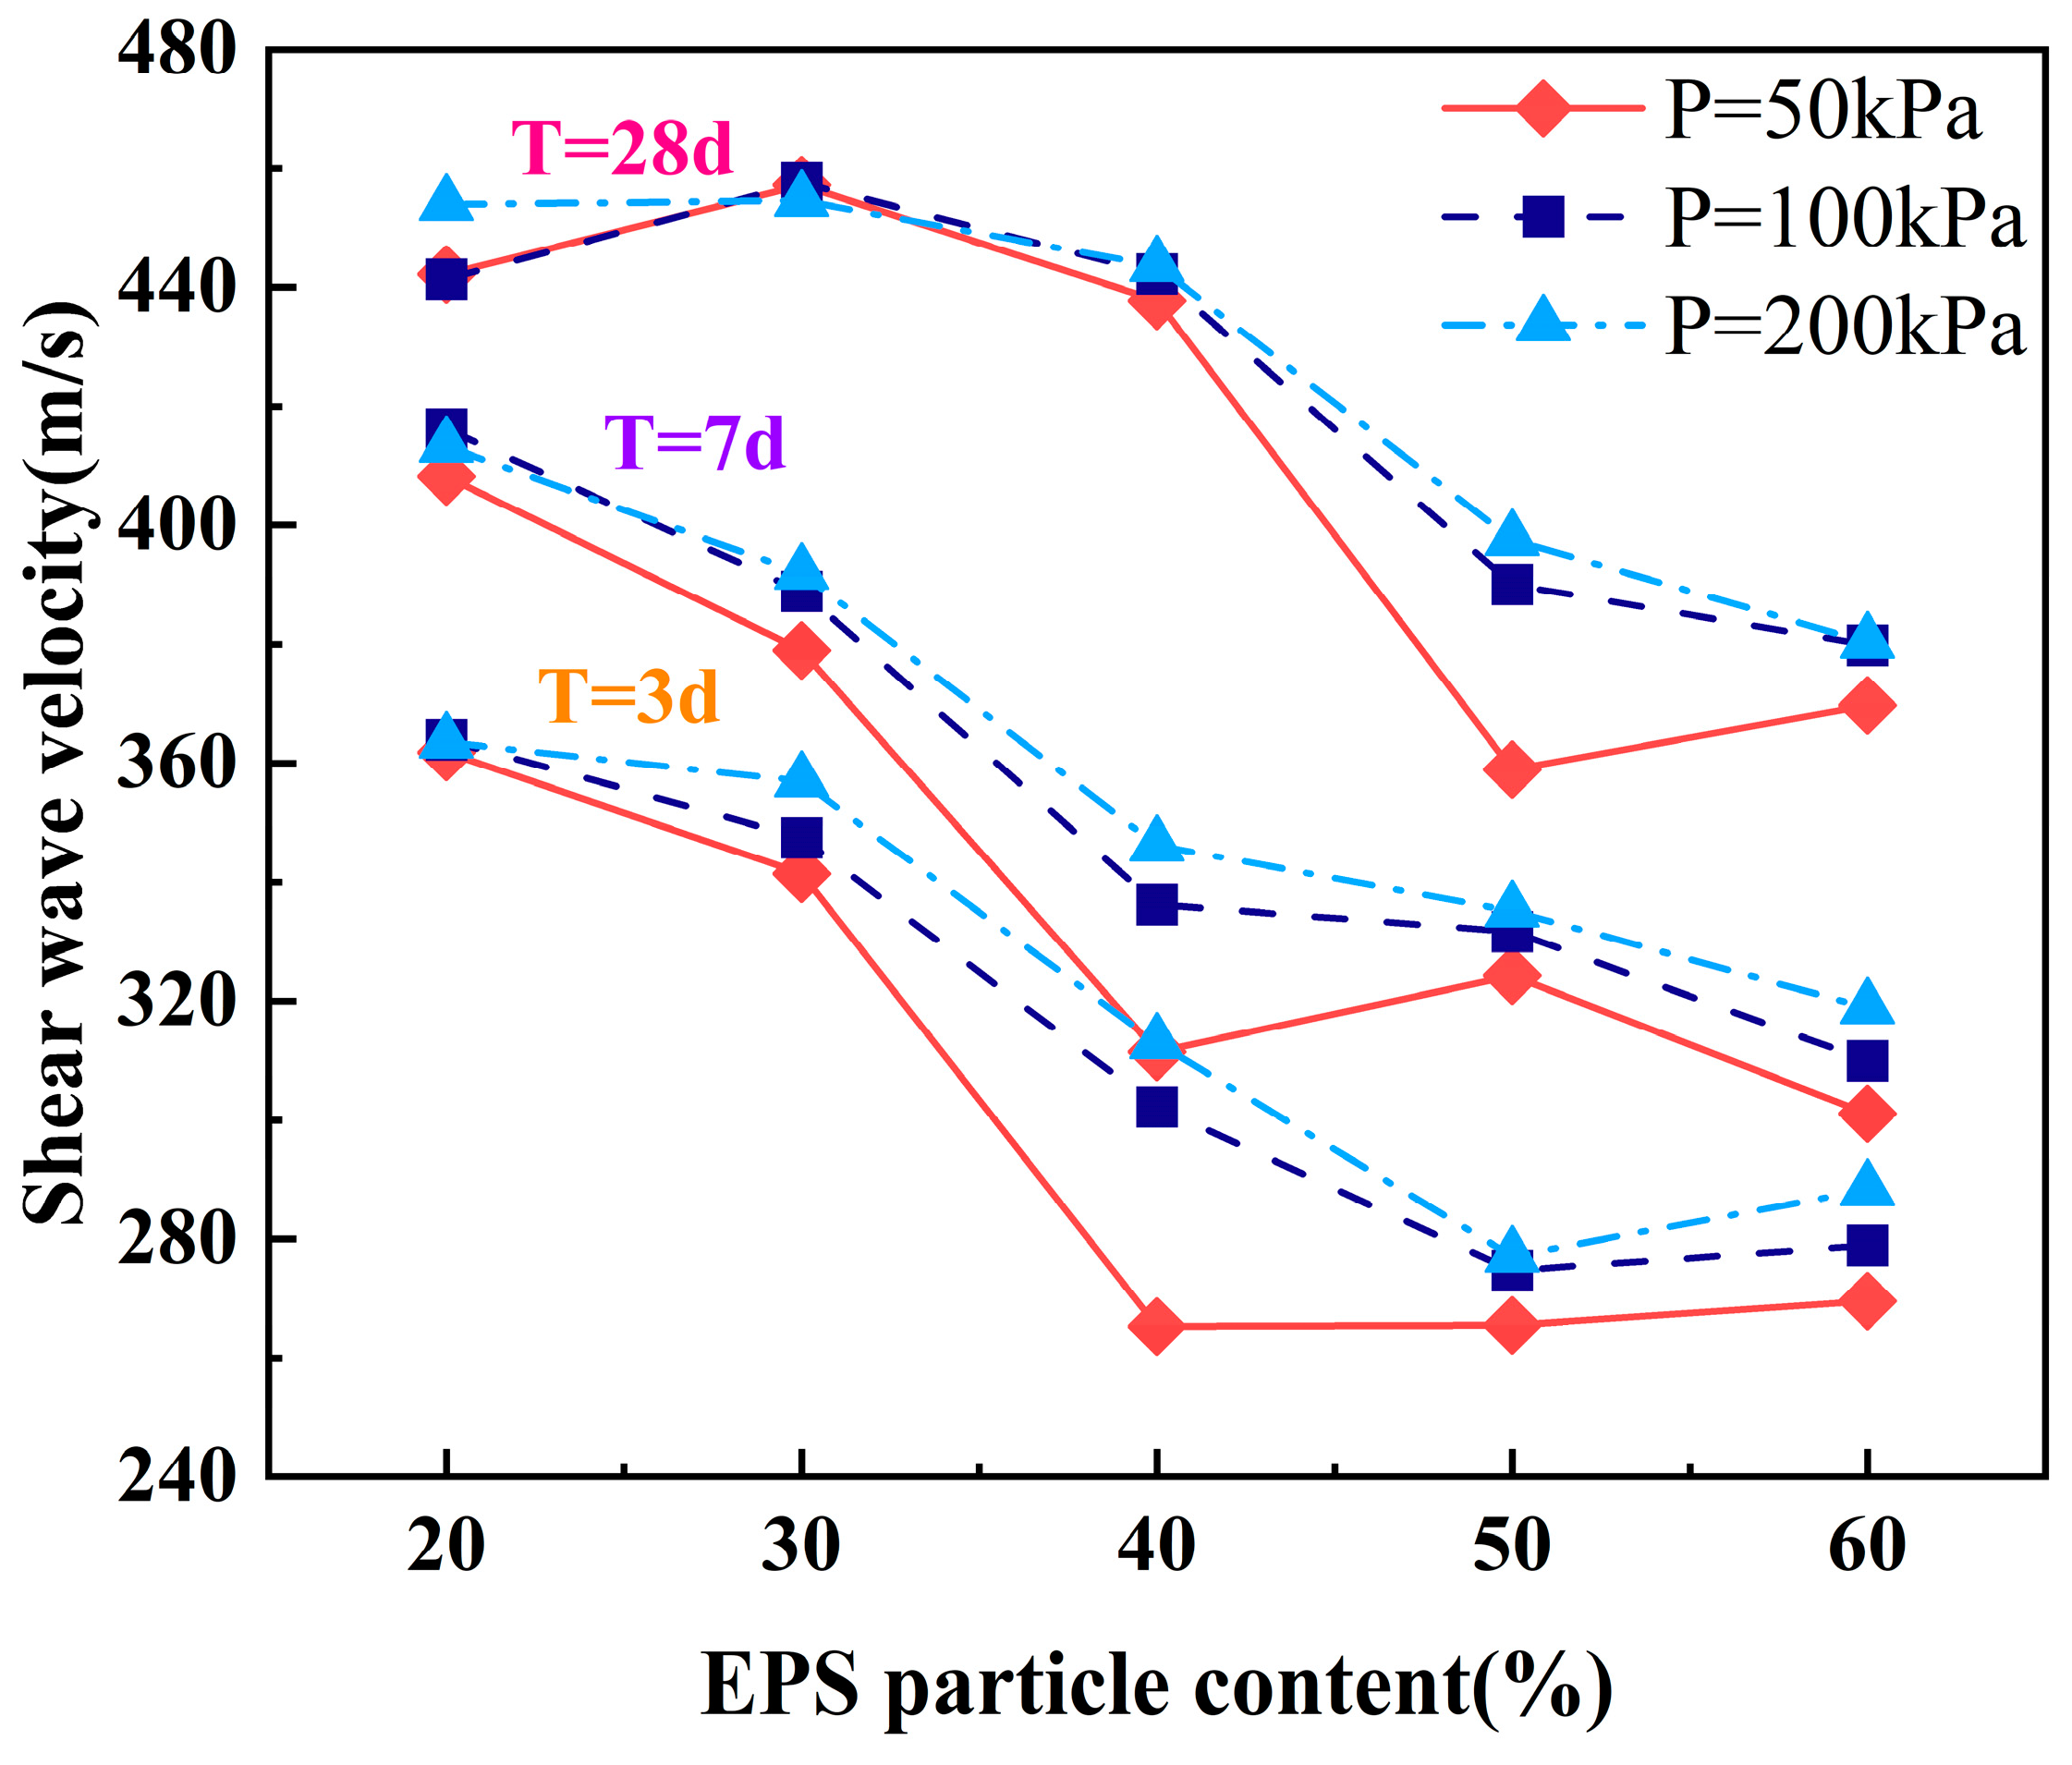
3.1. Density and Shear Wave Velocity of ELS
3.2. Curves of Dynamic Shear Modulus G and Dynamic Shear Strain γ
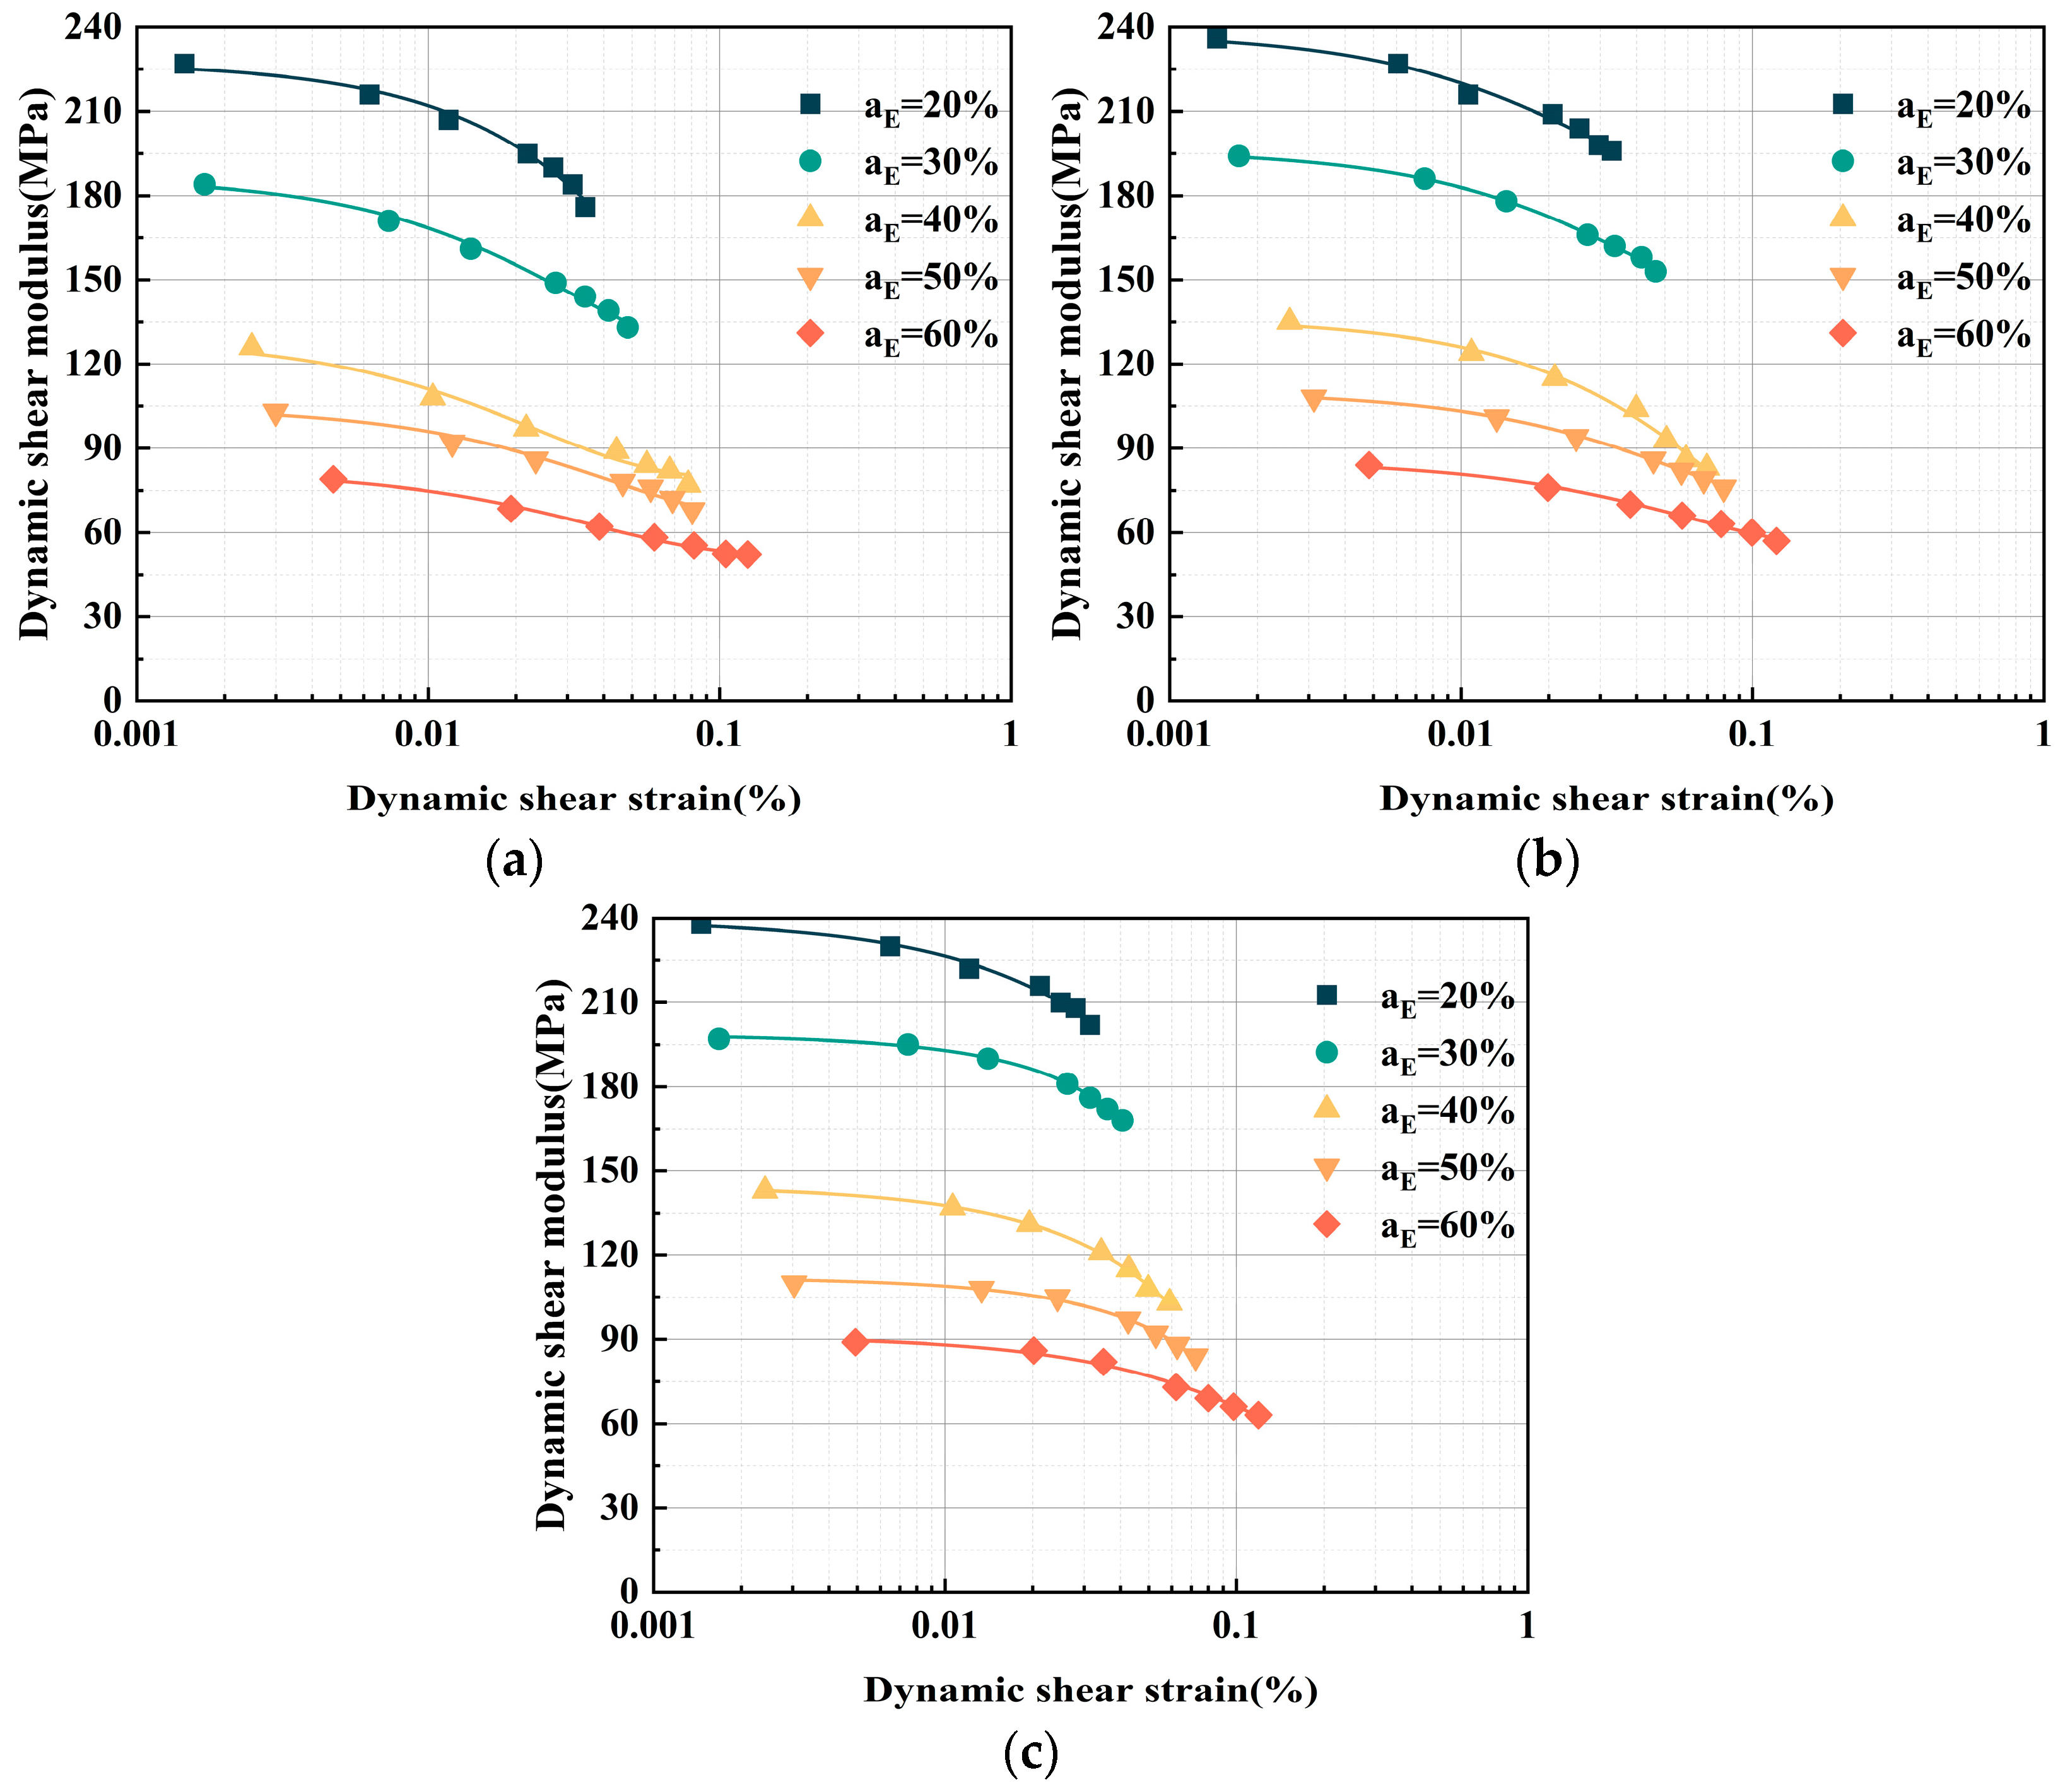
3.2.1. Impact of Adding EPS Particles on the G–γ Relationship Curve
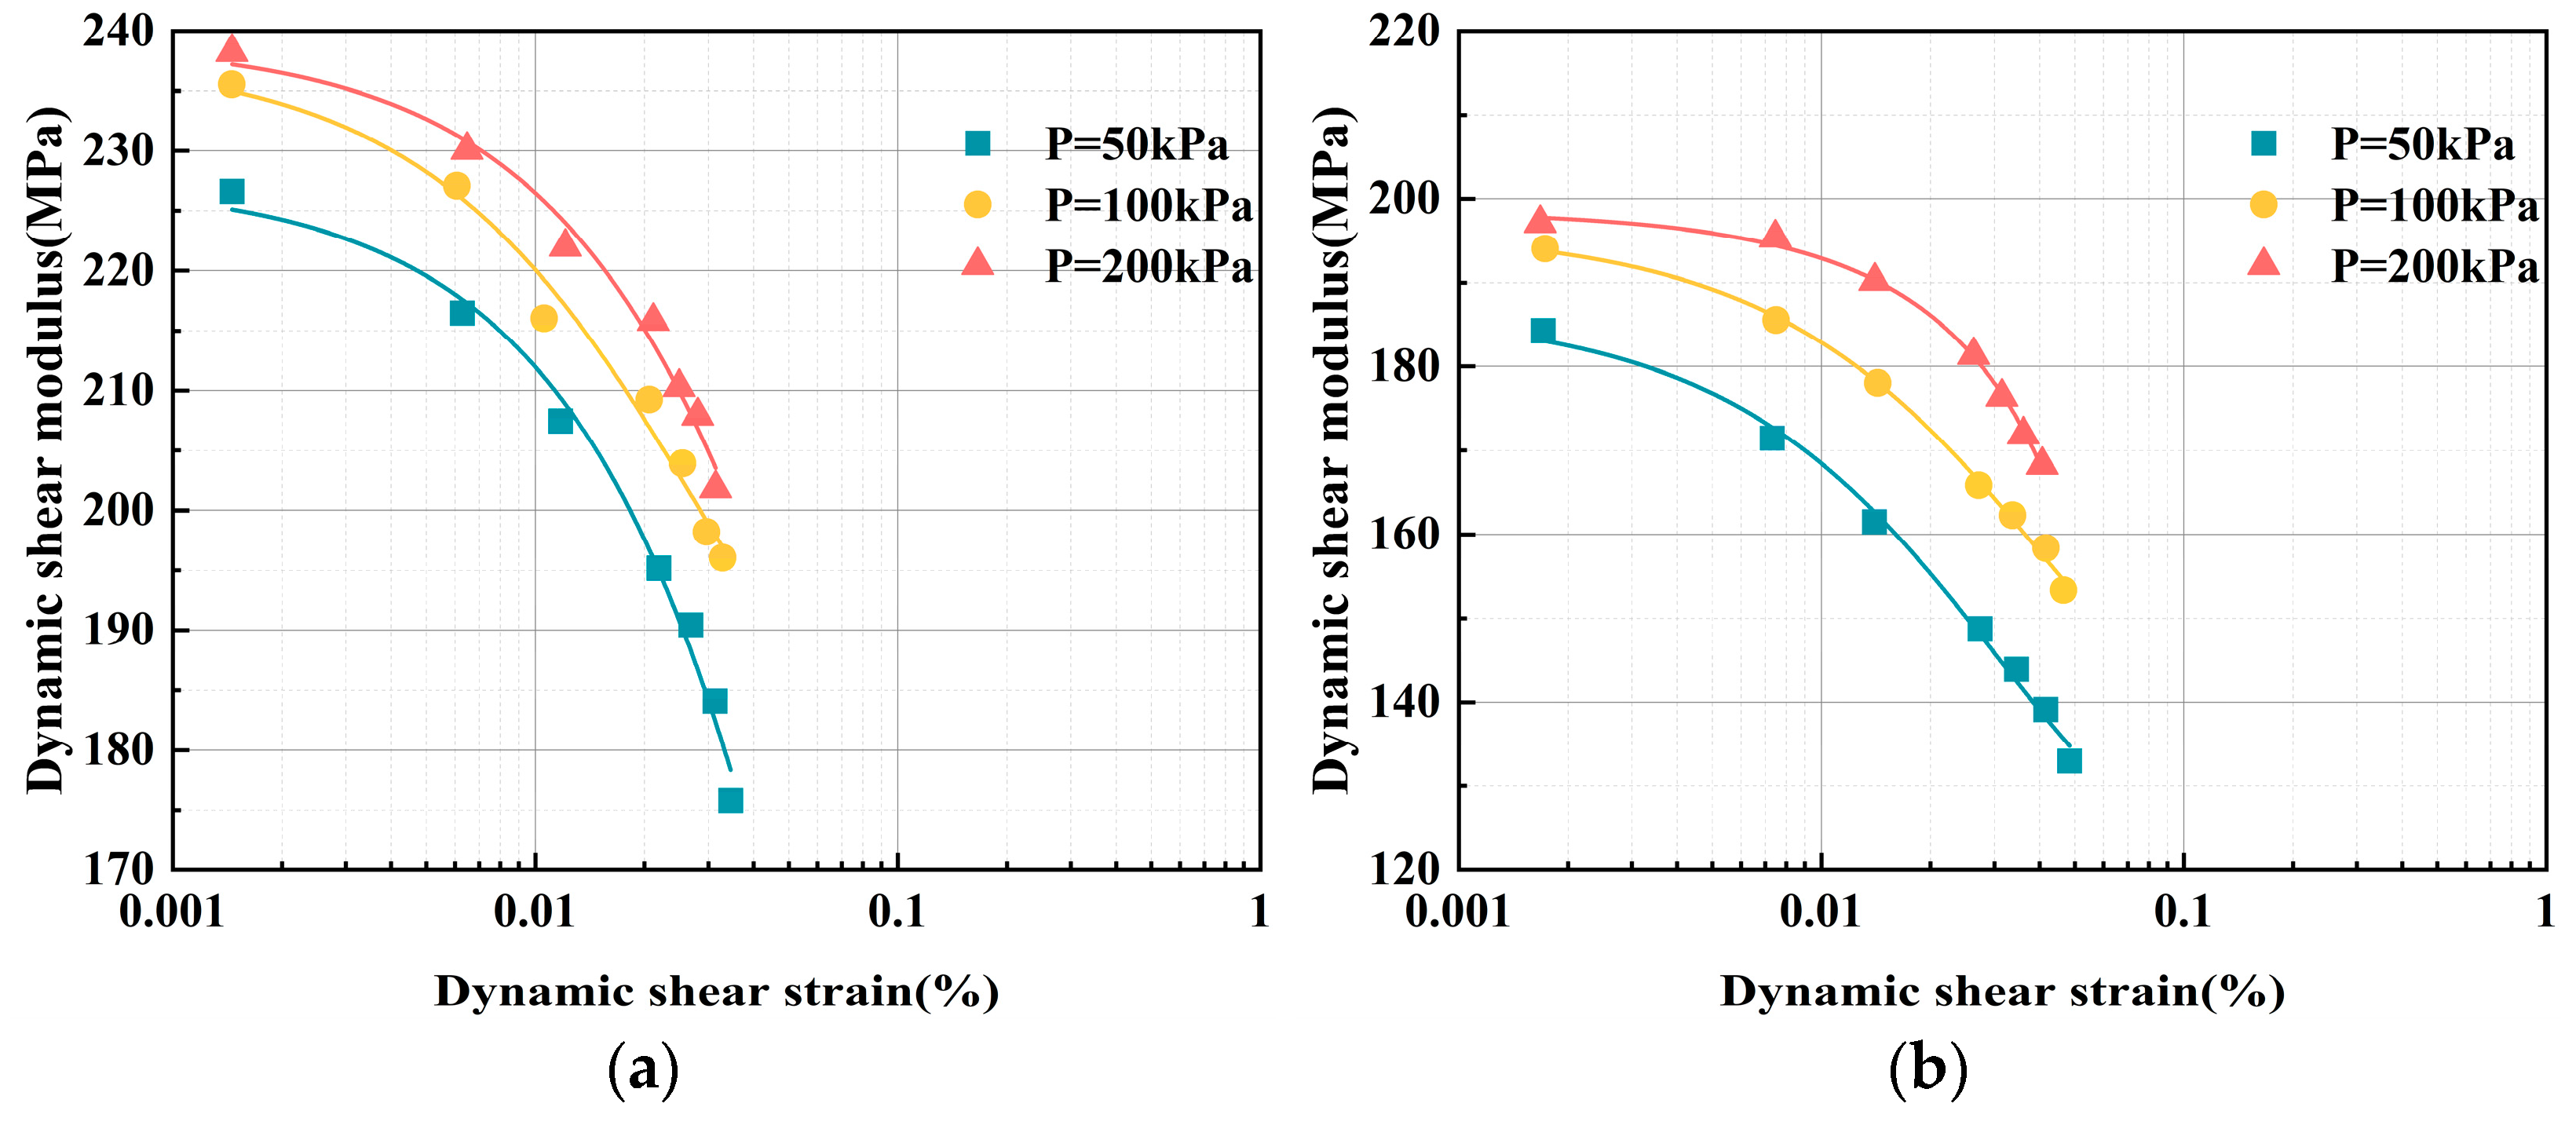
3.2.2. Impact of Confining Pressure on the G–γ Curve
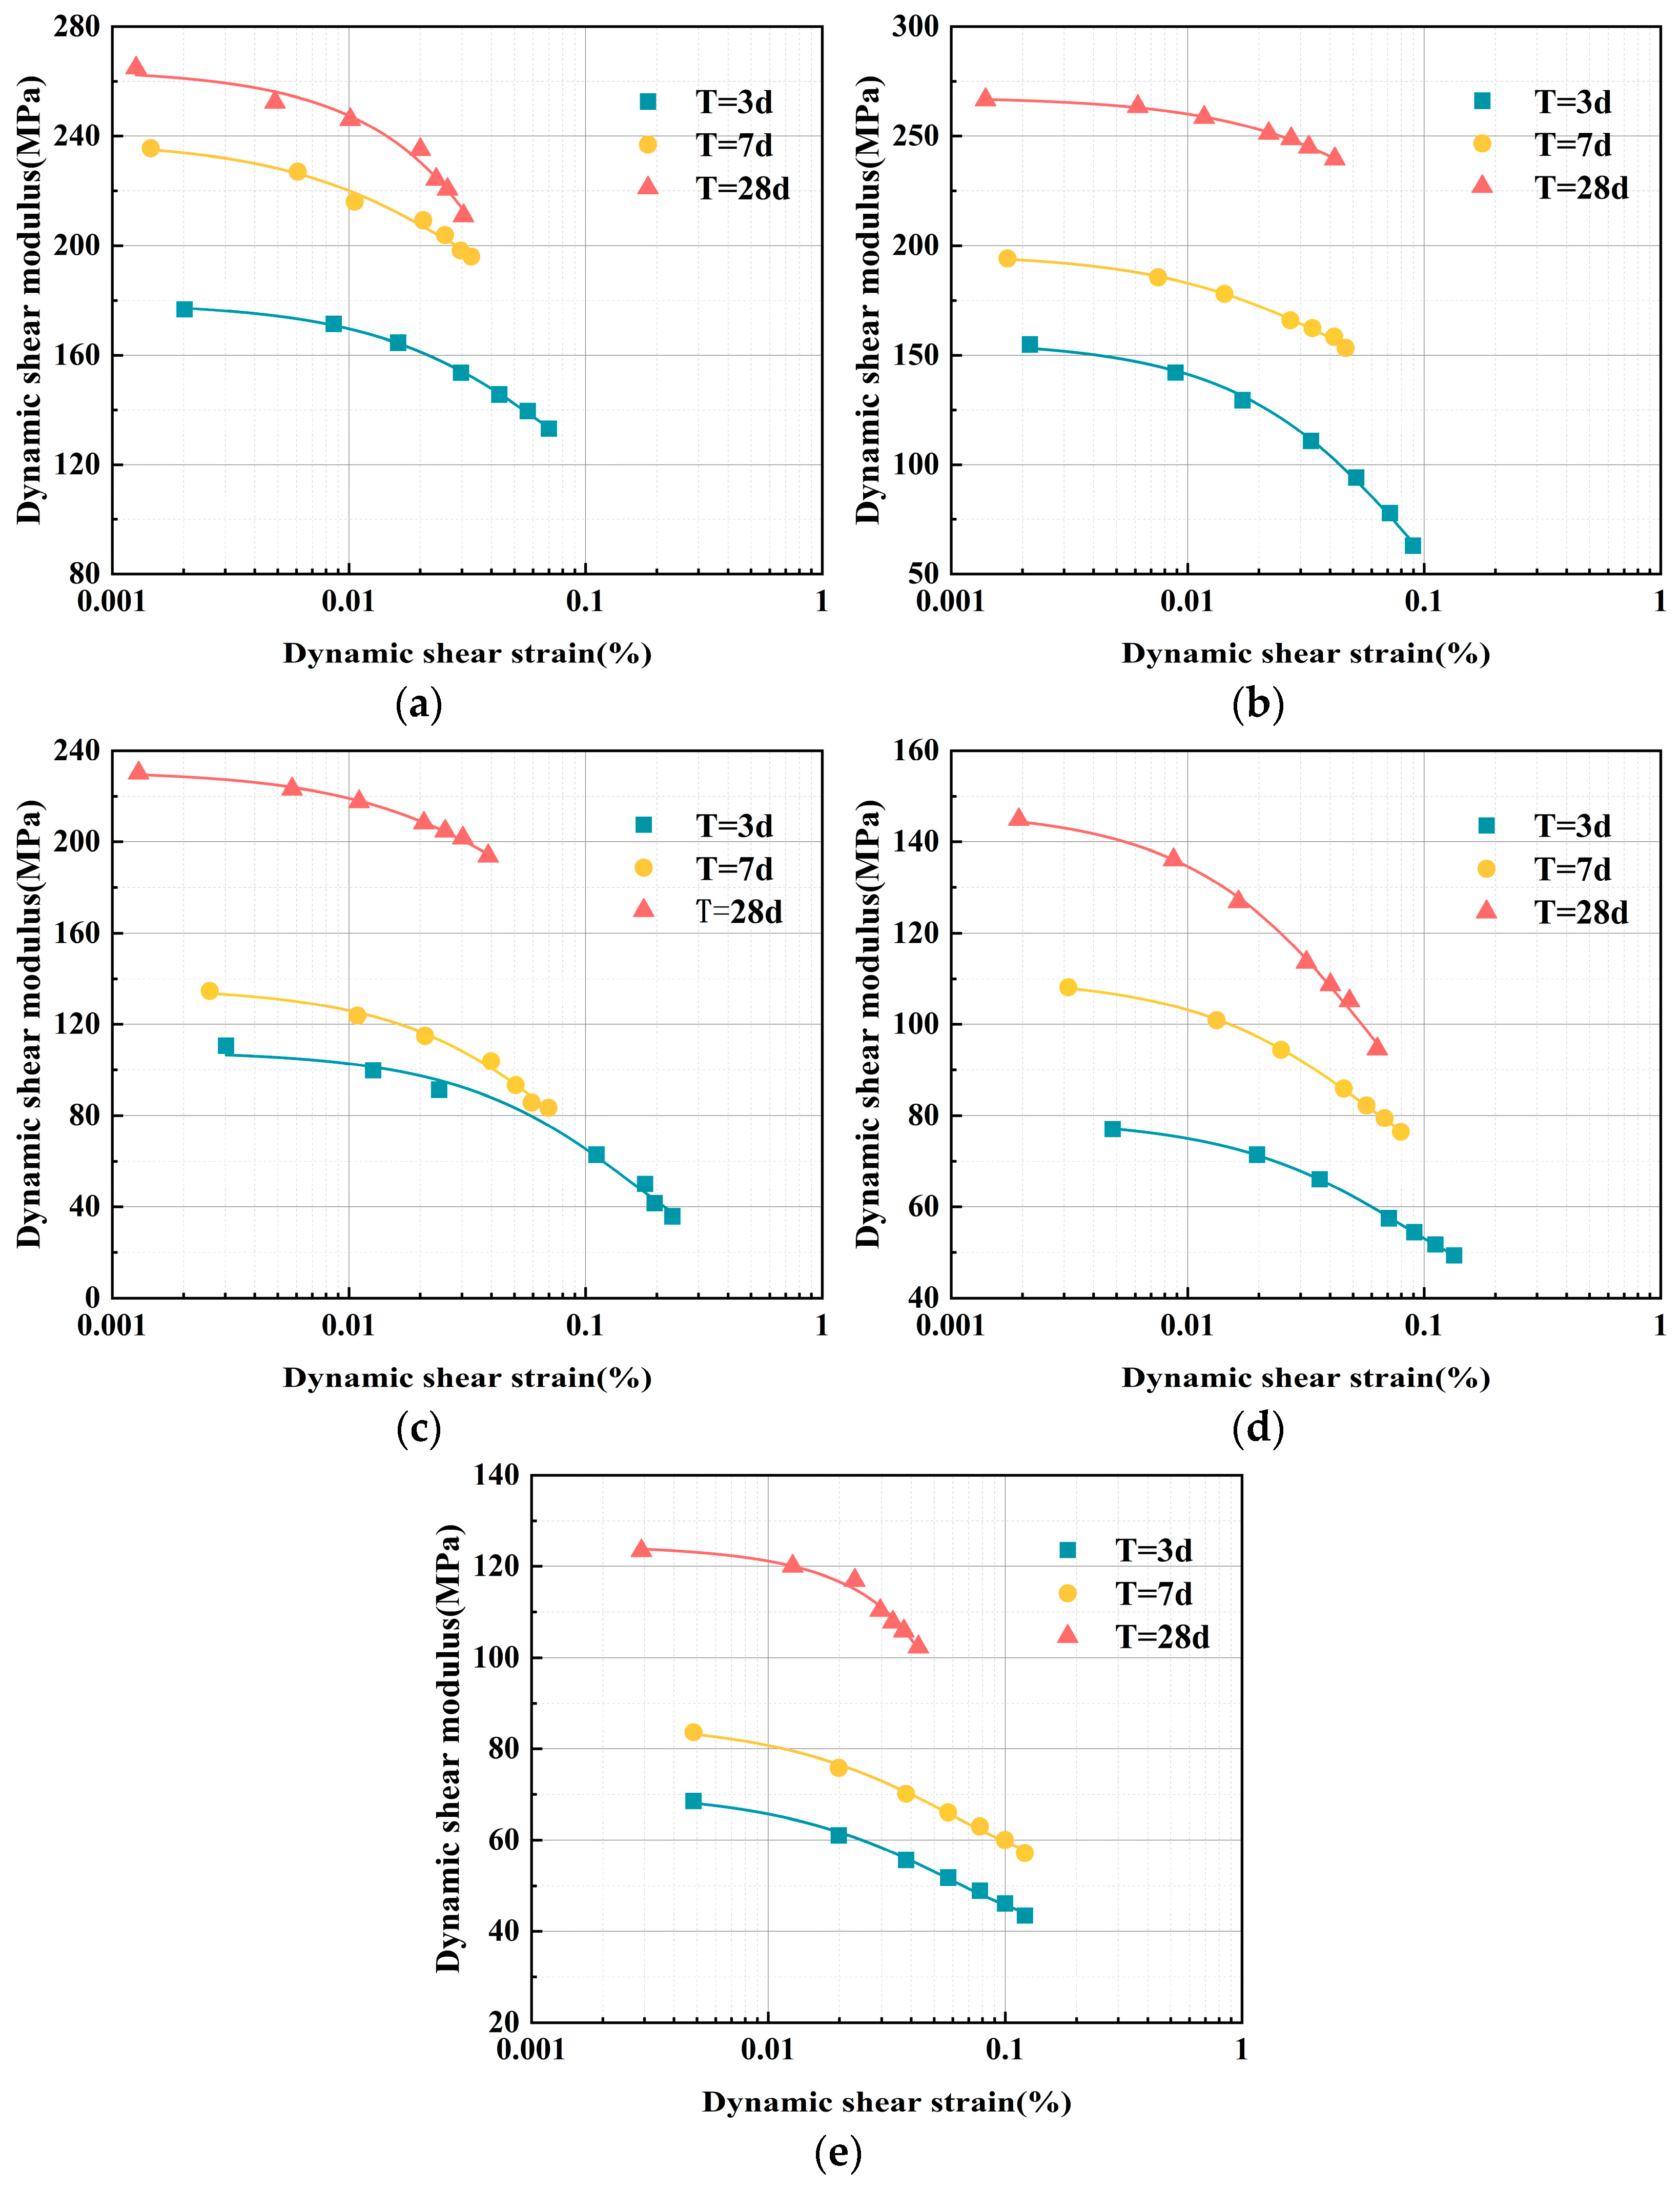
3.2.3. Curing Age Impact on the G–γ Relationship
3.3. Maximum Dynamic Shear Modulus Gmax
3.3.1. Gmax Computation
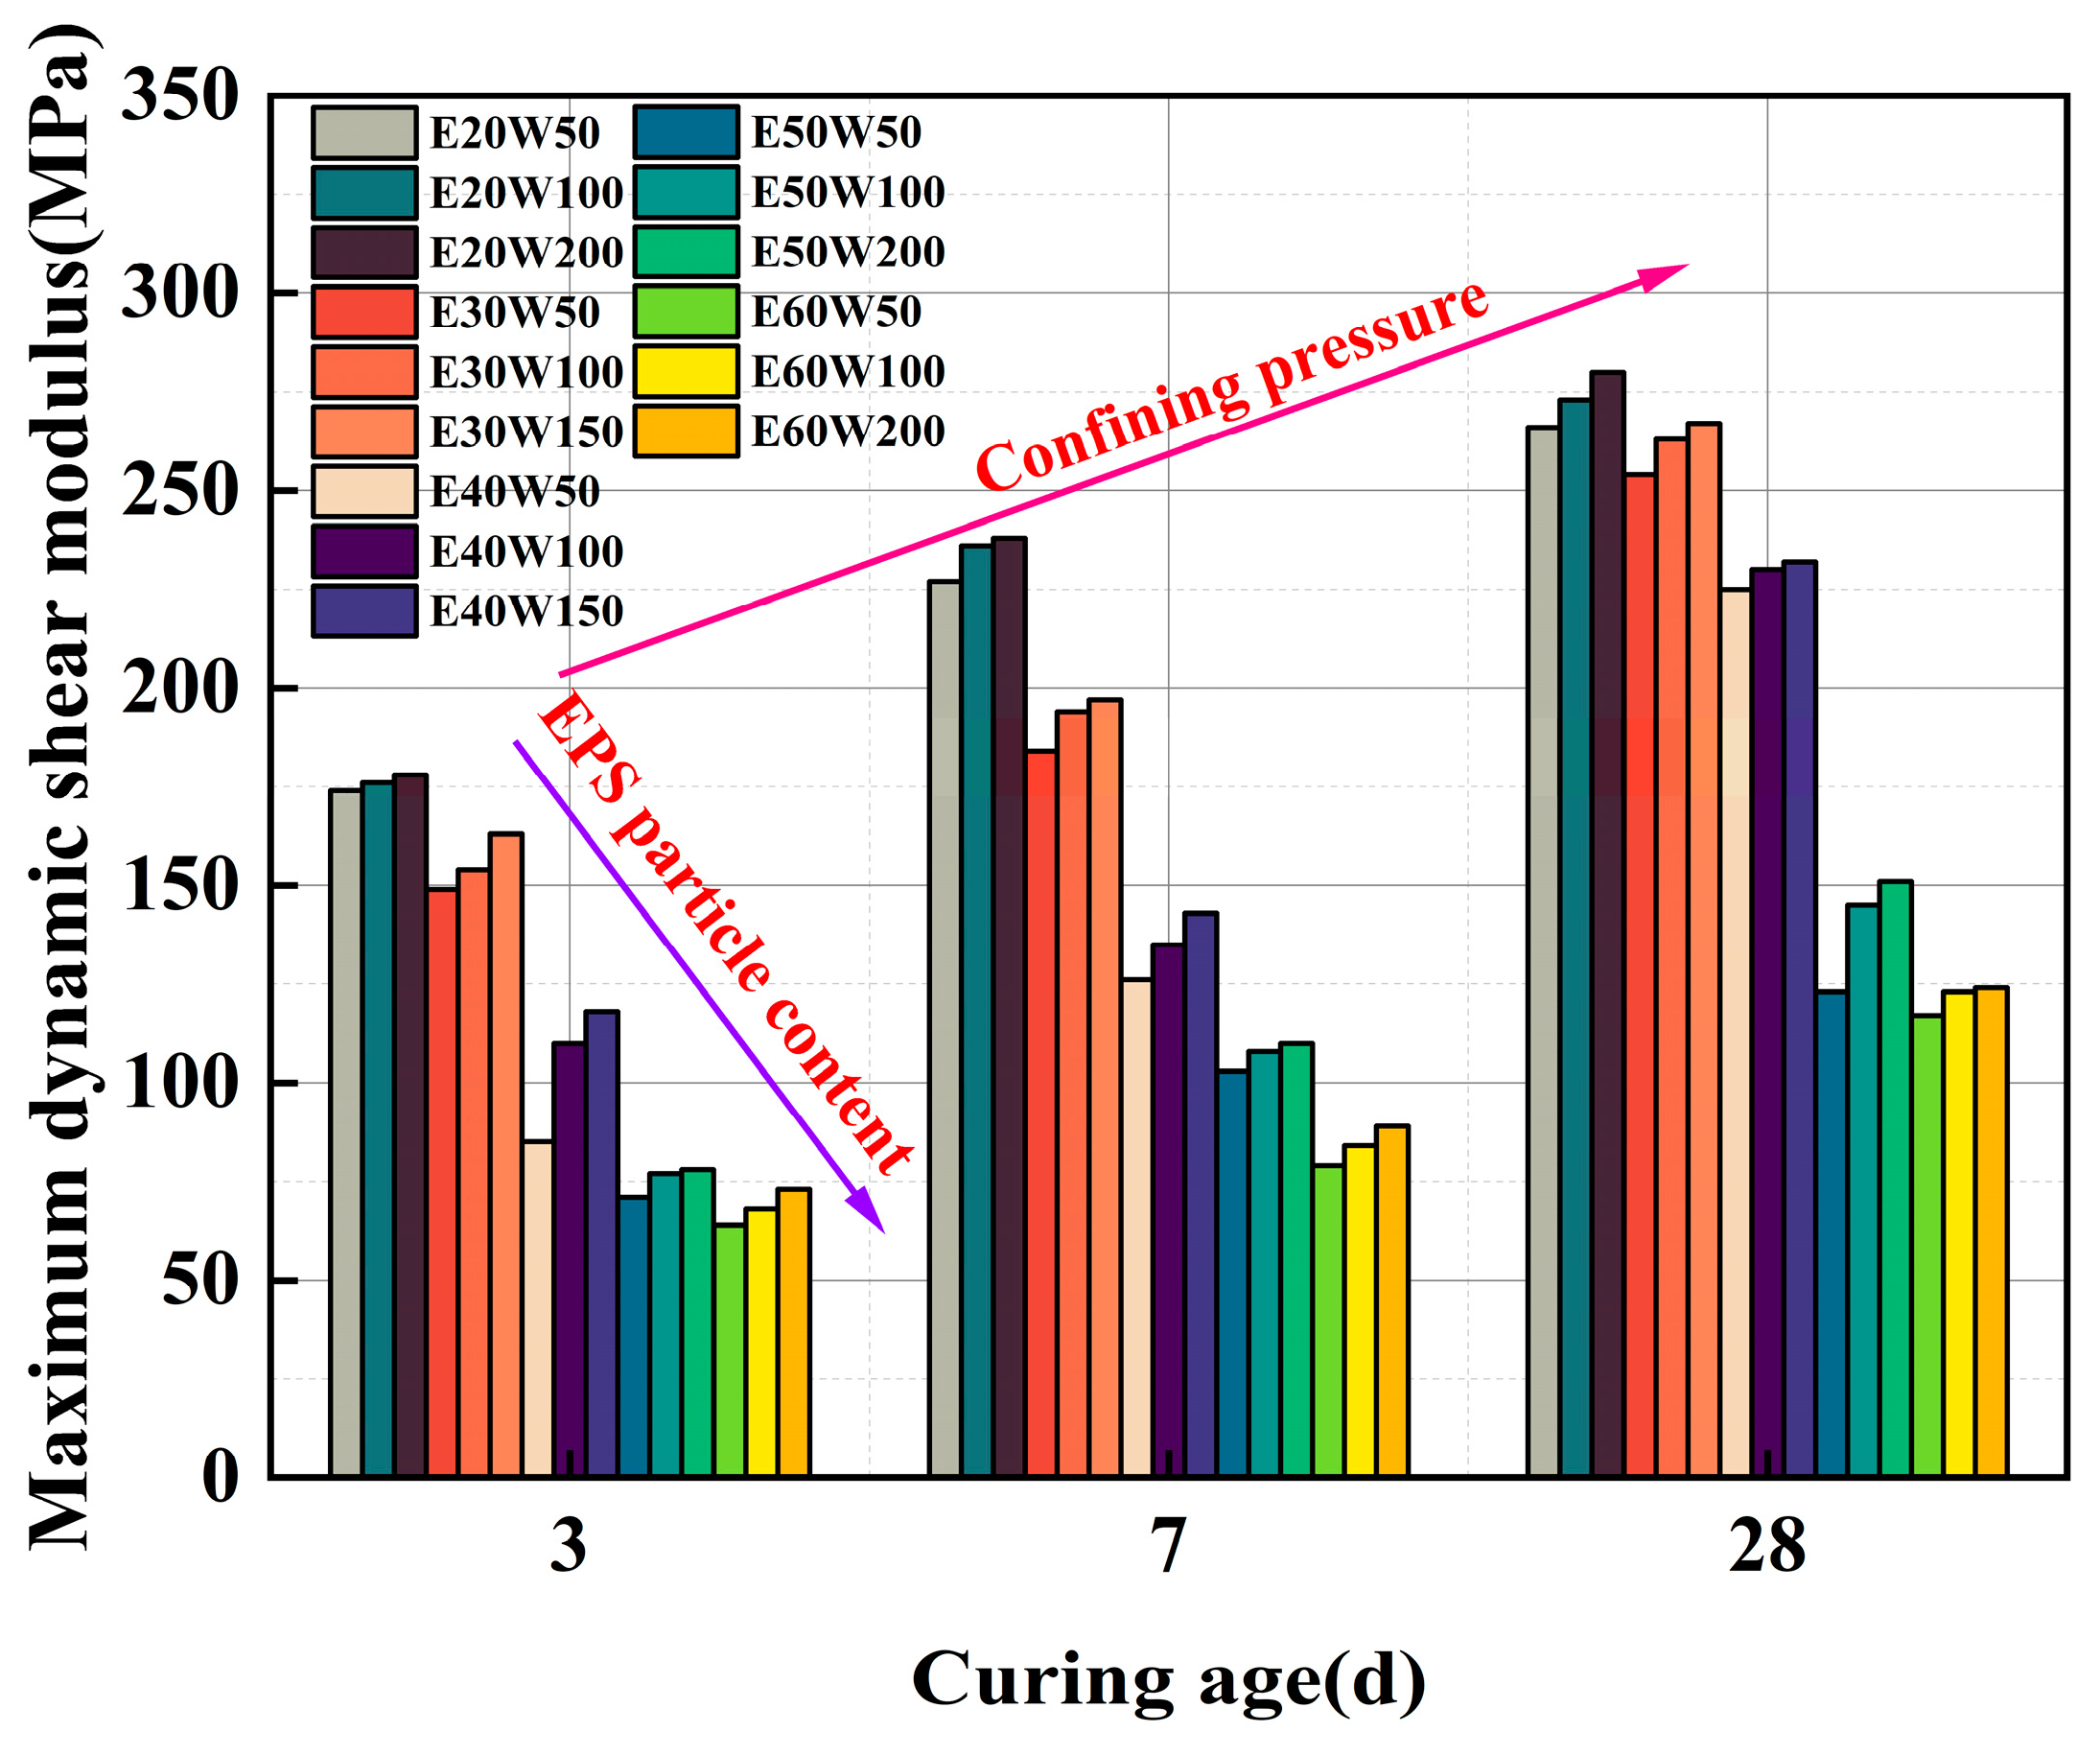
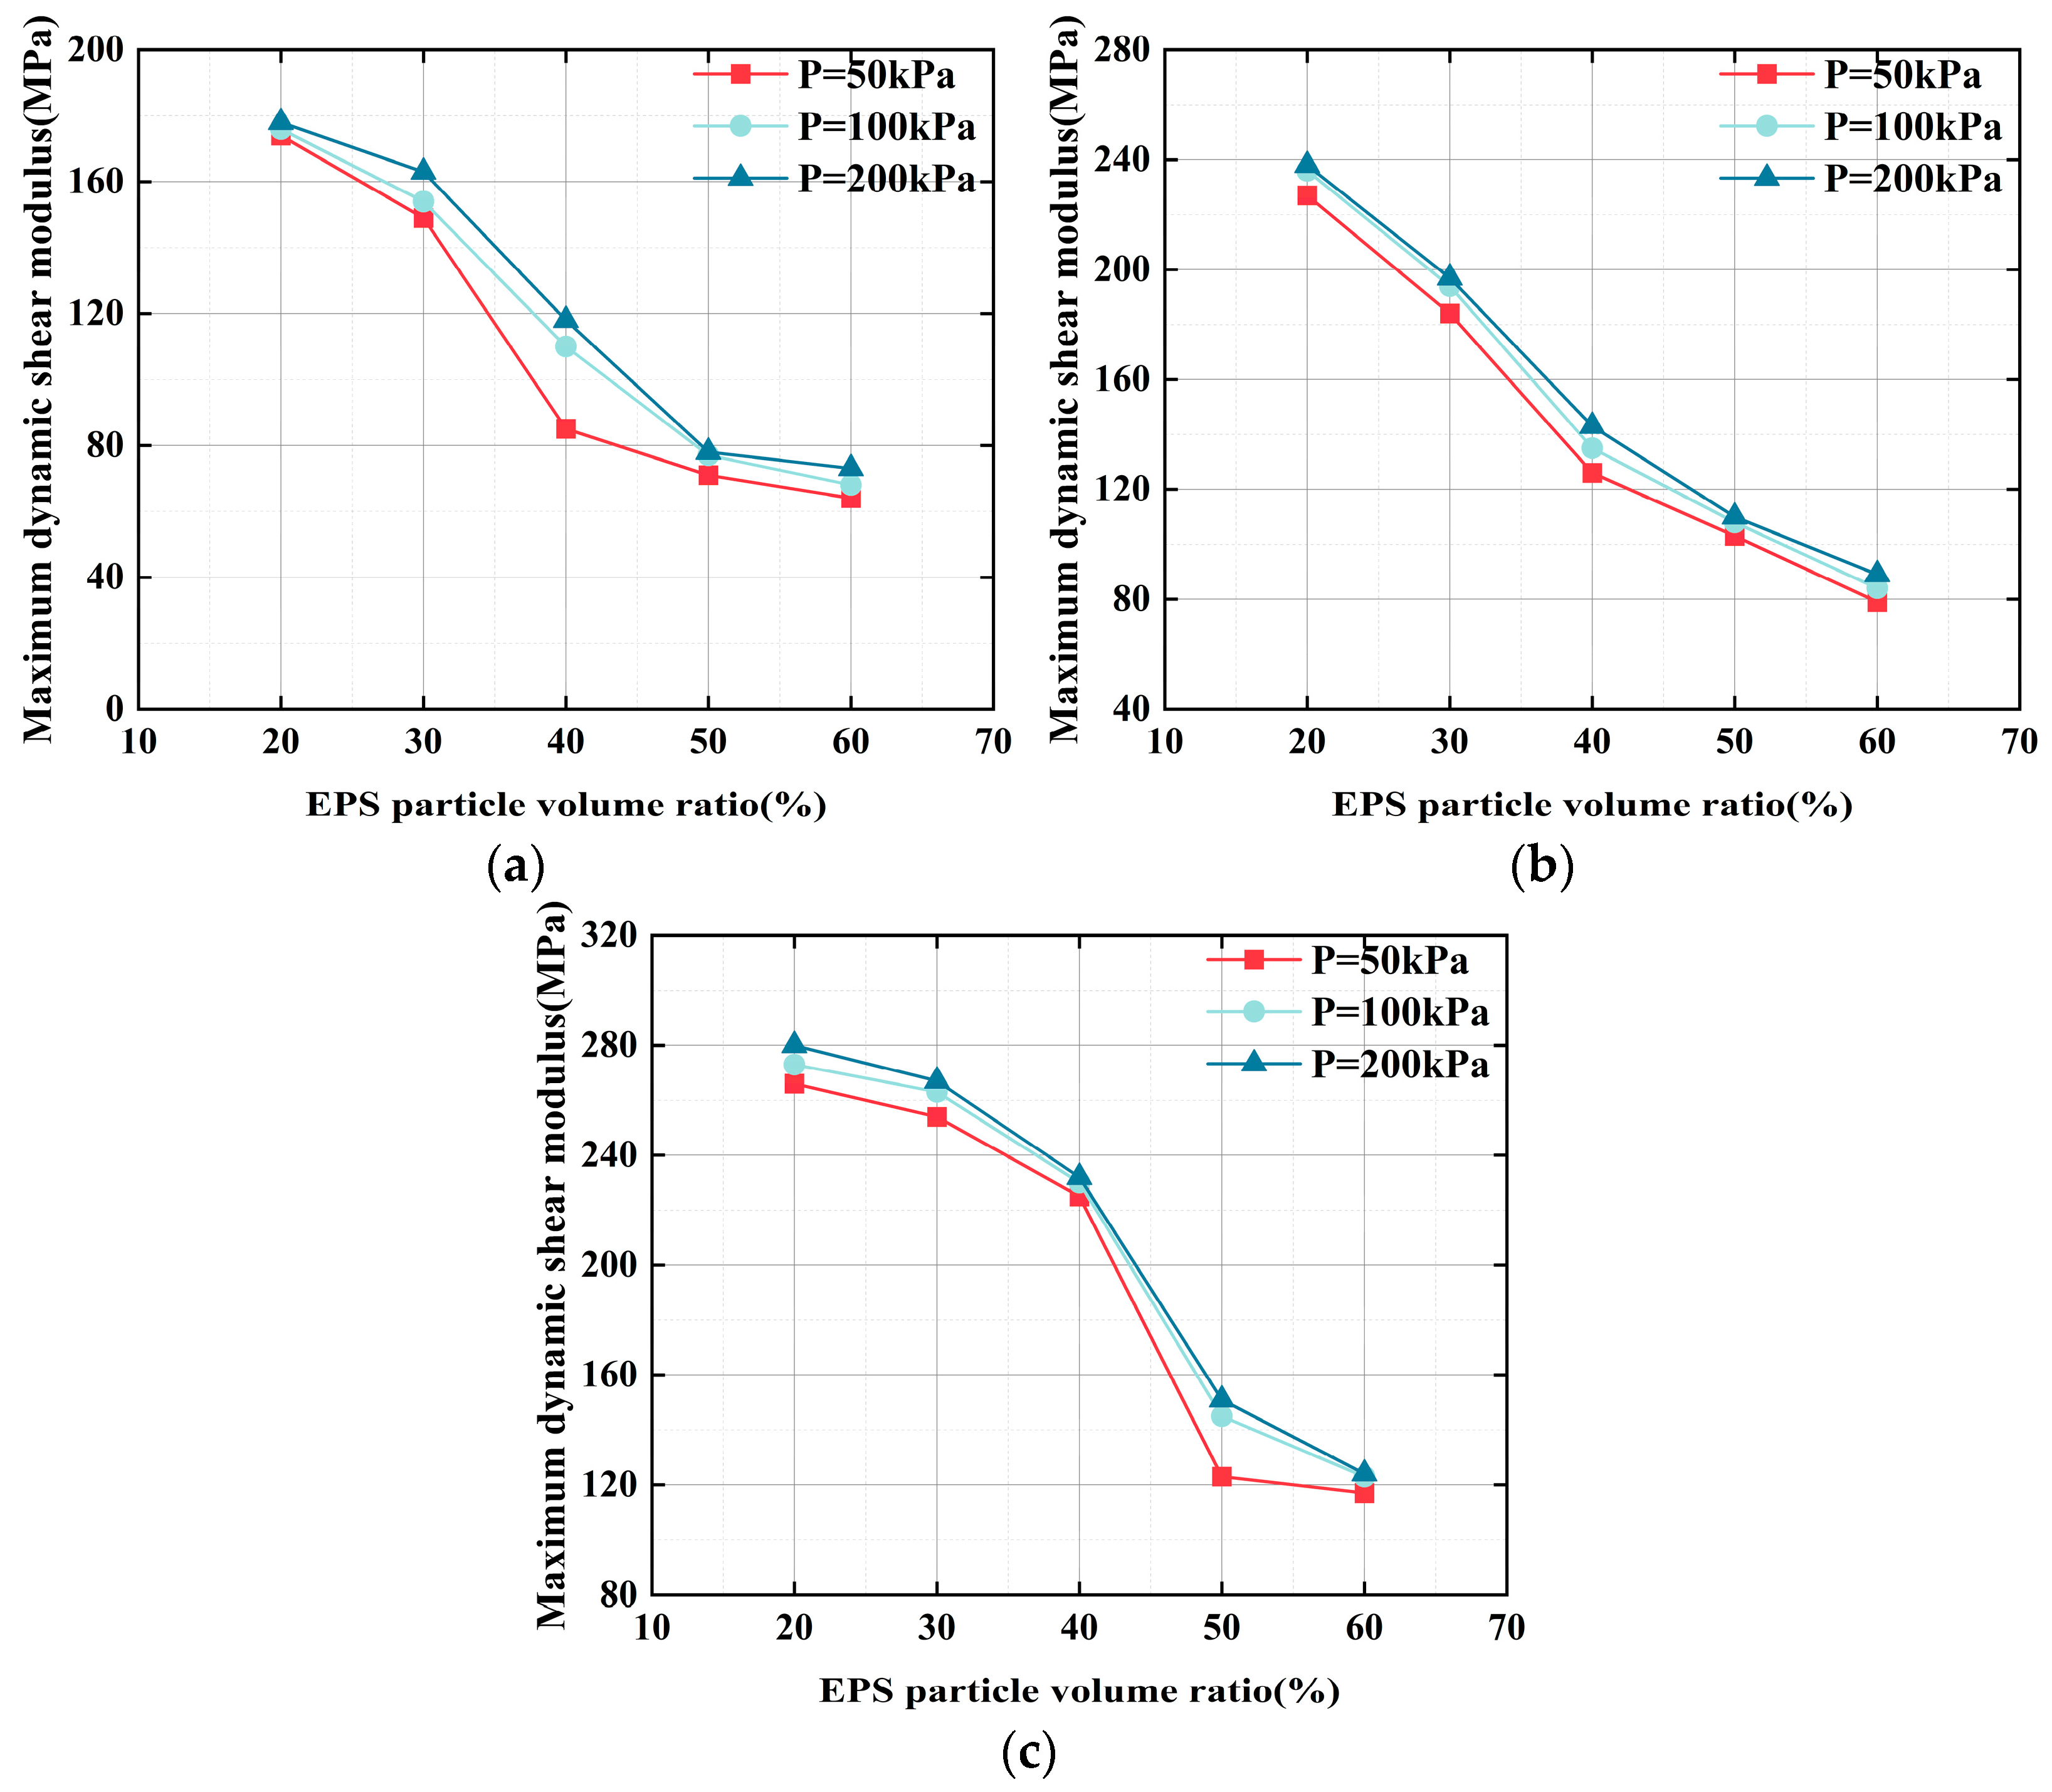
3.3.2. Impact of the EPS Particle Content on Gmax
3.3.3. Impact of Confining Pressure on Gmax
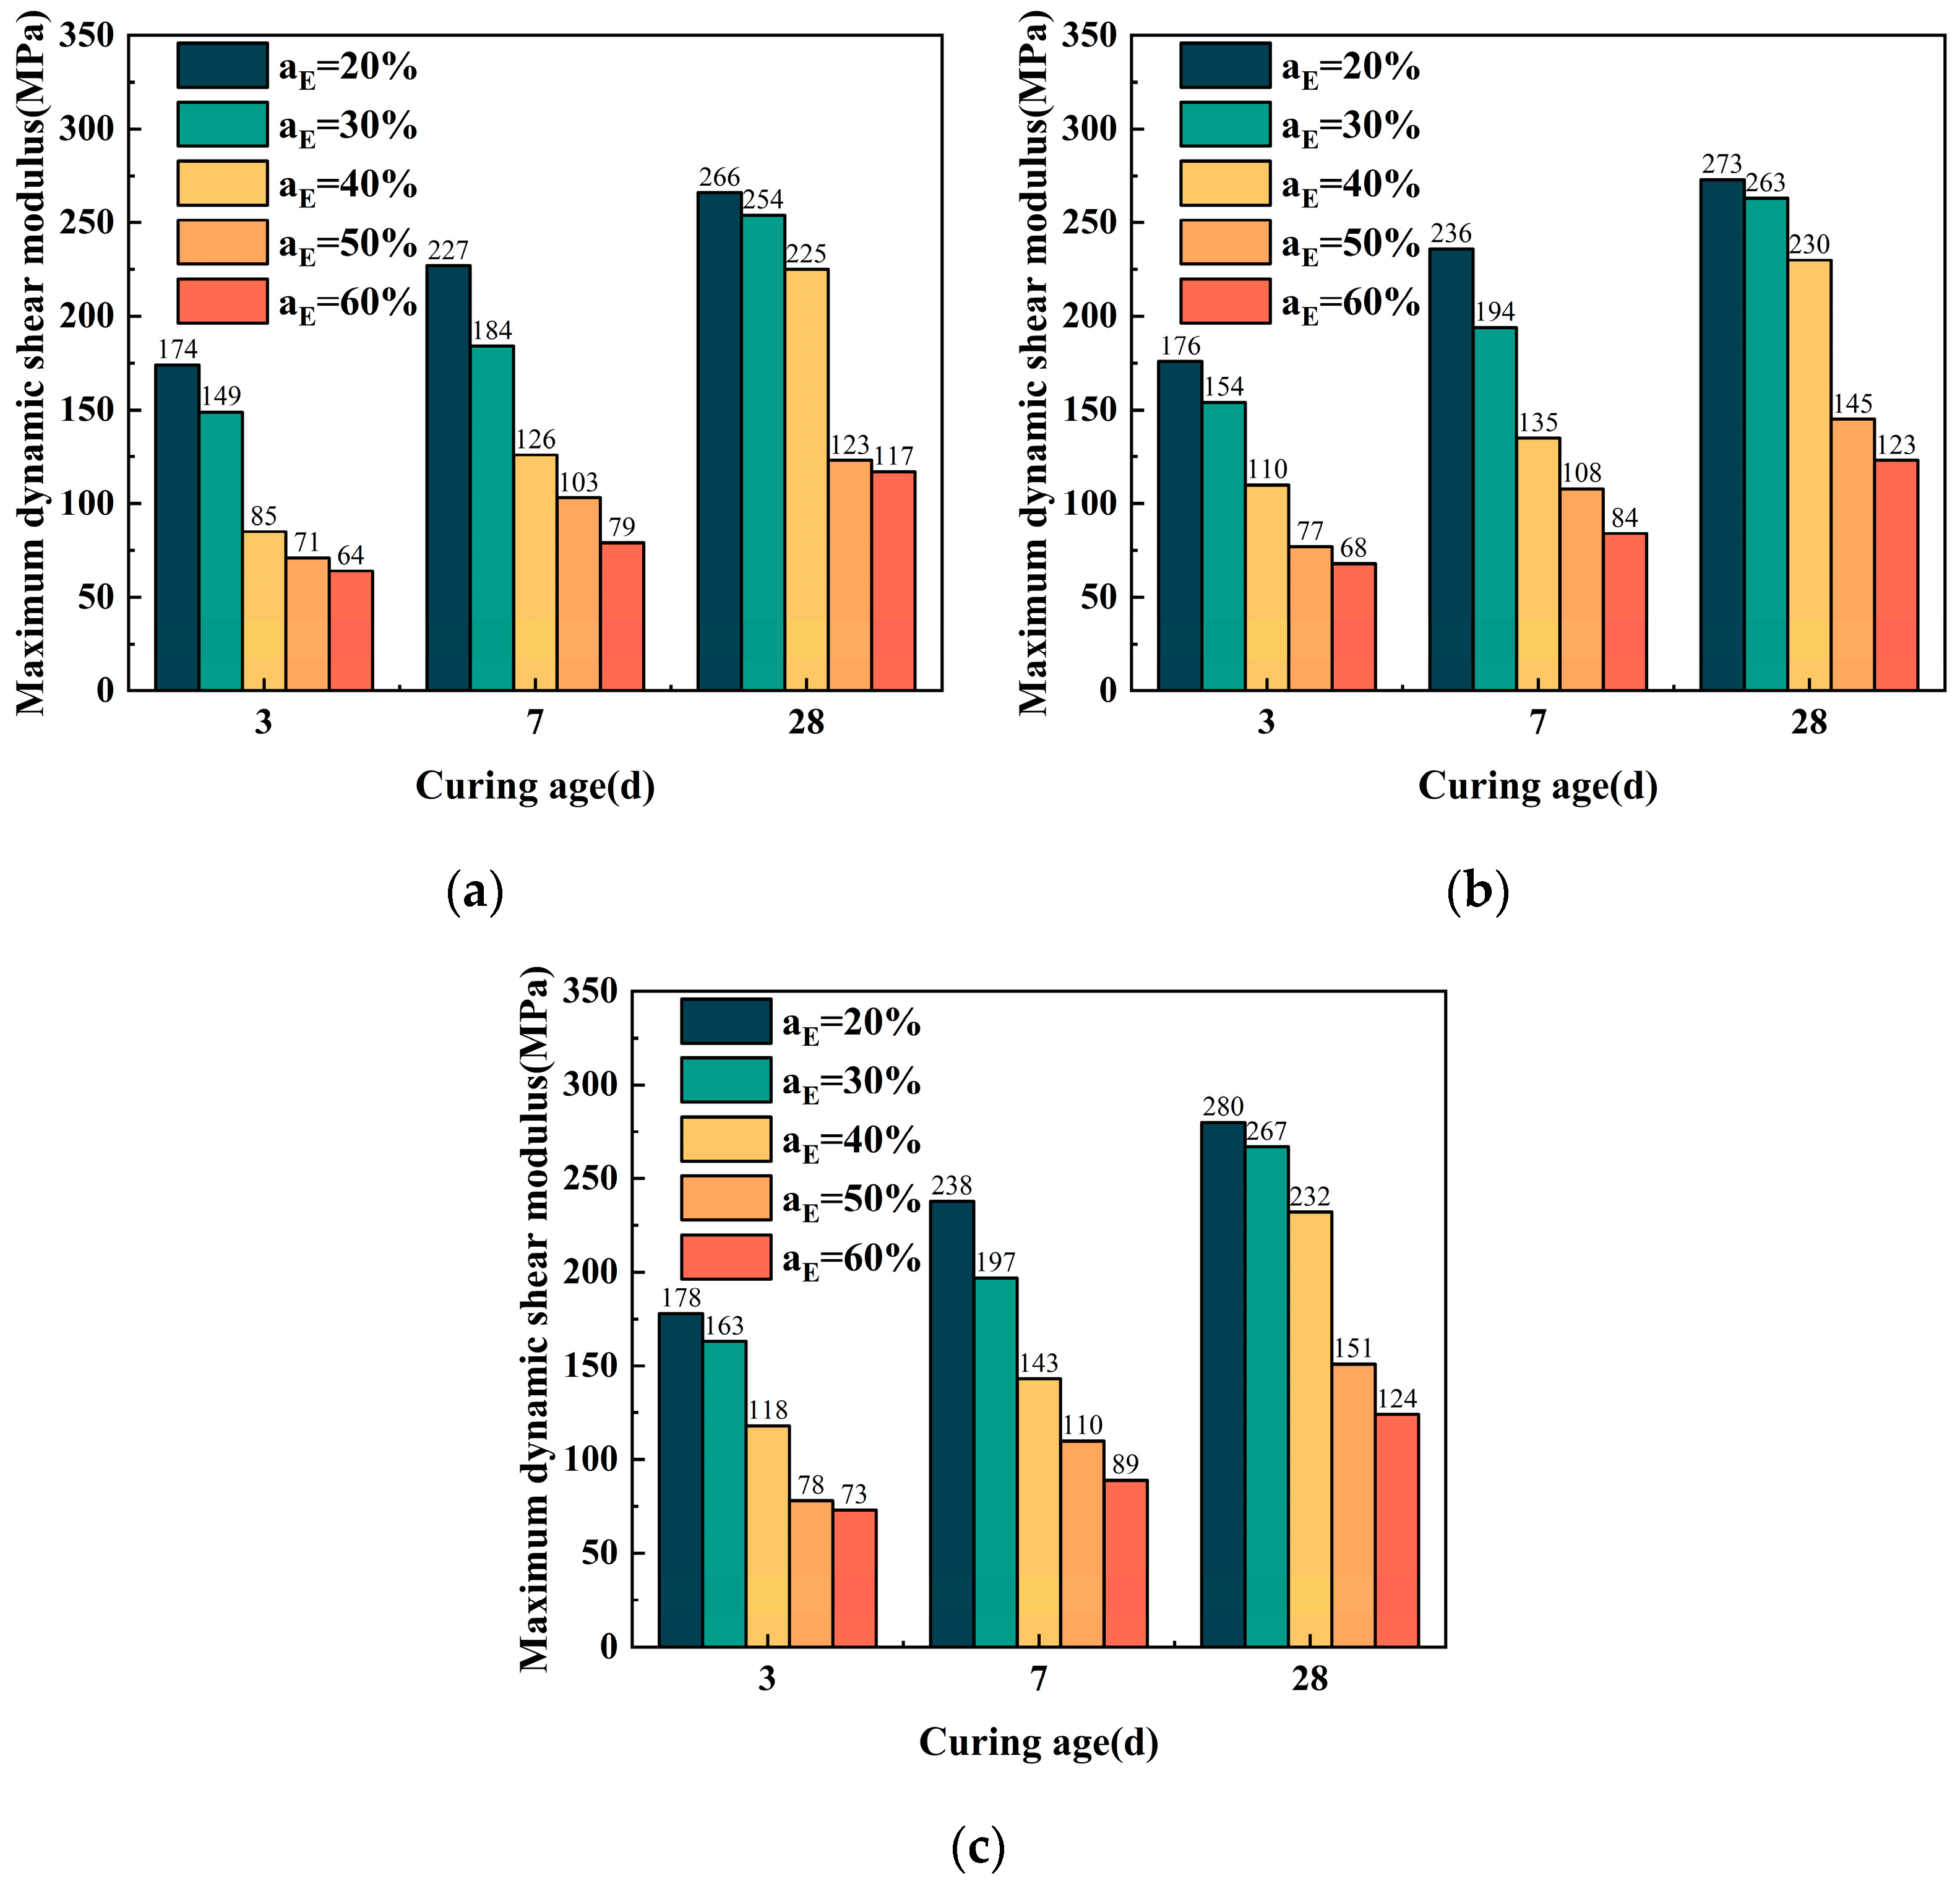
3.3.4. Impact of Curing Age on Gmax
4. Discussion
4.1. Damage Model
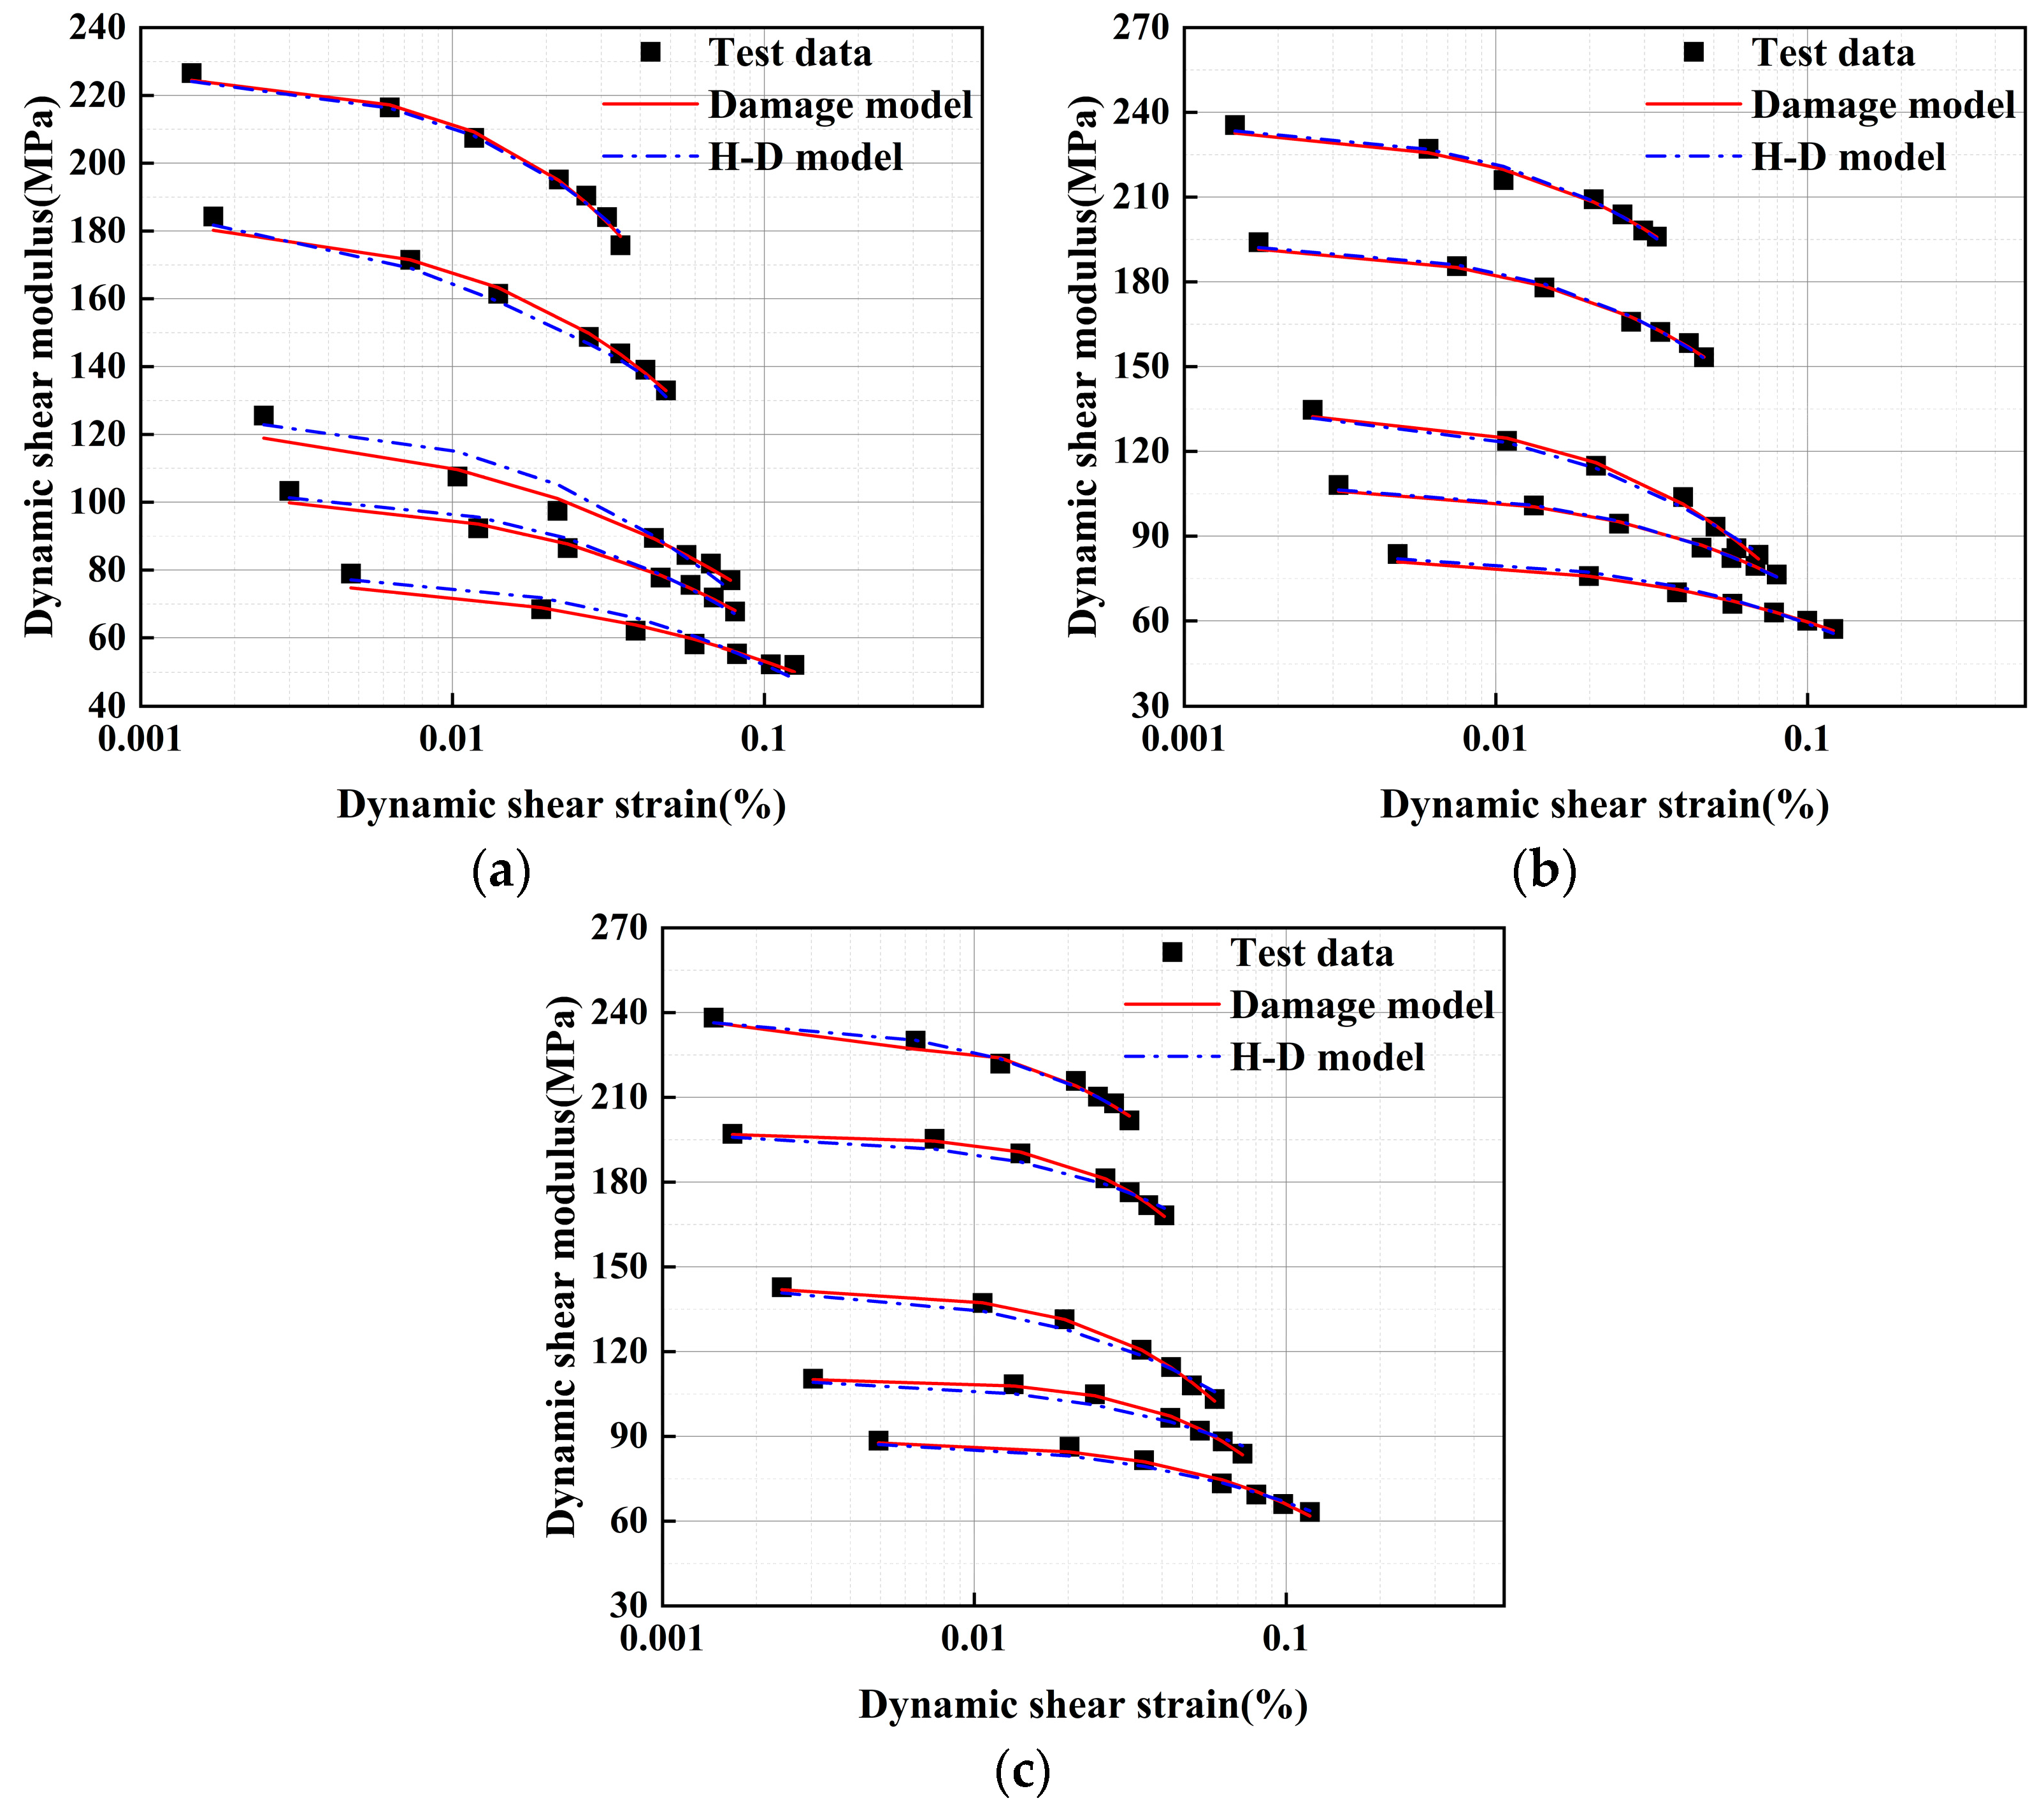
4.2. Model Comparison
4.3. Analysis of Damage Model Parameters
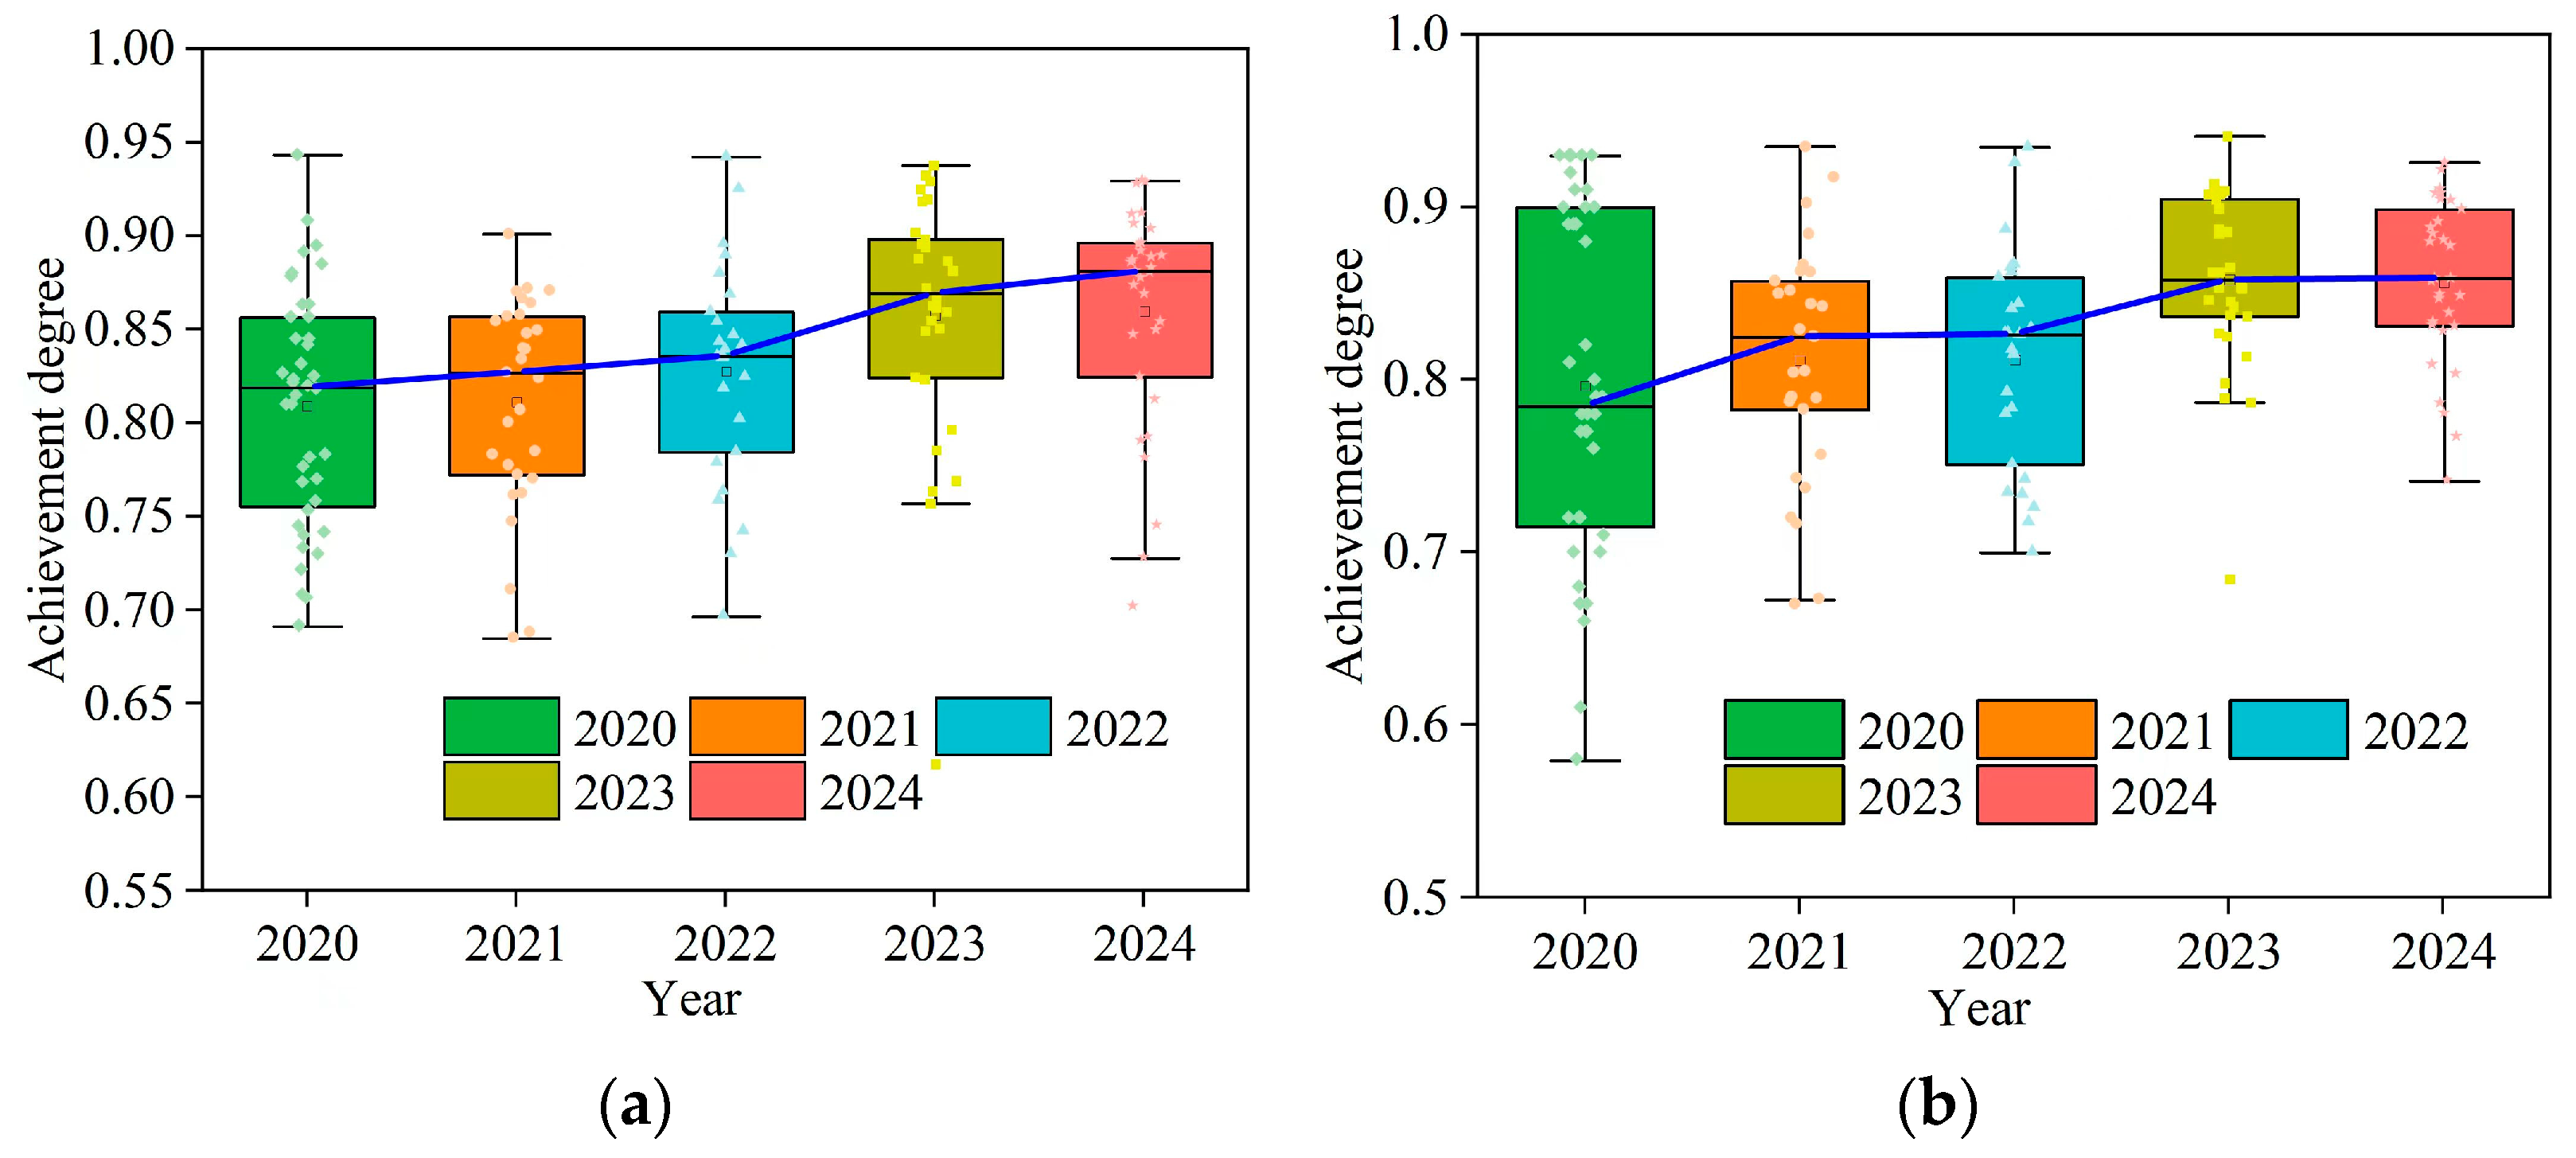
4.4. Effectiveness of Teaching Reform
5. Conclusions
- (1)
- Increasing the EPS particle content reduces the G of ELS. Due to the decreased load-bearing capacity of the internal structure, there is greater relative displacement between the EPS particles. With curing ages of 3, 7, and 28 days and varying confining pressures, Gmax (ranging from 64 MPa to 280 MPa) decreased by 61%, 64%, and 55%, respectively, as the EPS particle content increased. Additionally, the G of ELS decreased with increasing γ across different EPS particle contents.
- (2)
- Elevating confining pressure boosts the G of ELS. Greater confining pressure restricts the lateral displacement of the soil mass, resulting in higher specimen compression and an increase in G with rising confining pressure. At 3, 7, and 28 days of curing, Gmax increased by 15%, 9%, and 8%, respectively, with increasing confining pressure. Furthermore, the G of ELS decreased with increasing γ across various confining pressures.
- (3)
- Extended curing ages enhance the G of ELS. As curing ages increase, the hydration reactions of the binding material become more thorough, resulting in an increase in G with longer curing periods. Under confining pressures of 50, 100, and 200 kPa, Gmax increased by 53%, 55%, and 57%, respectively, with extended curing ages. Likewise, the G of ELS decreased with increasing γ under different curing ages.
- (4)
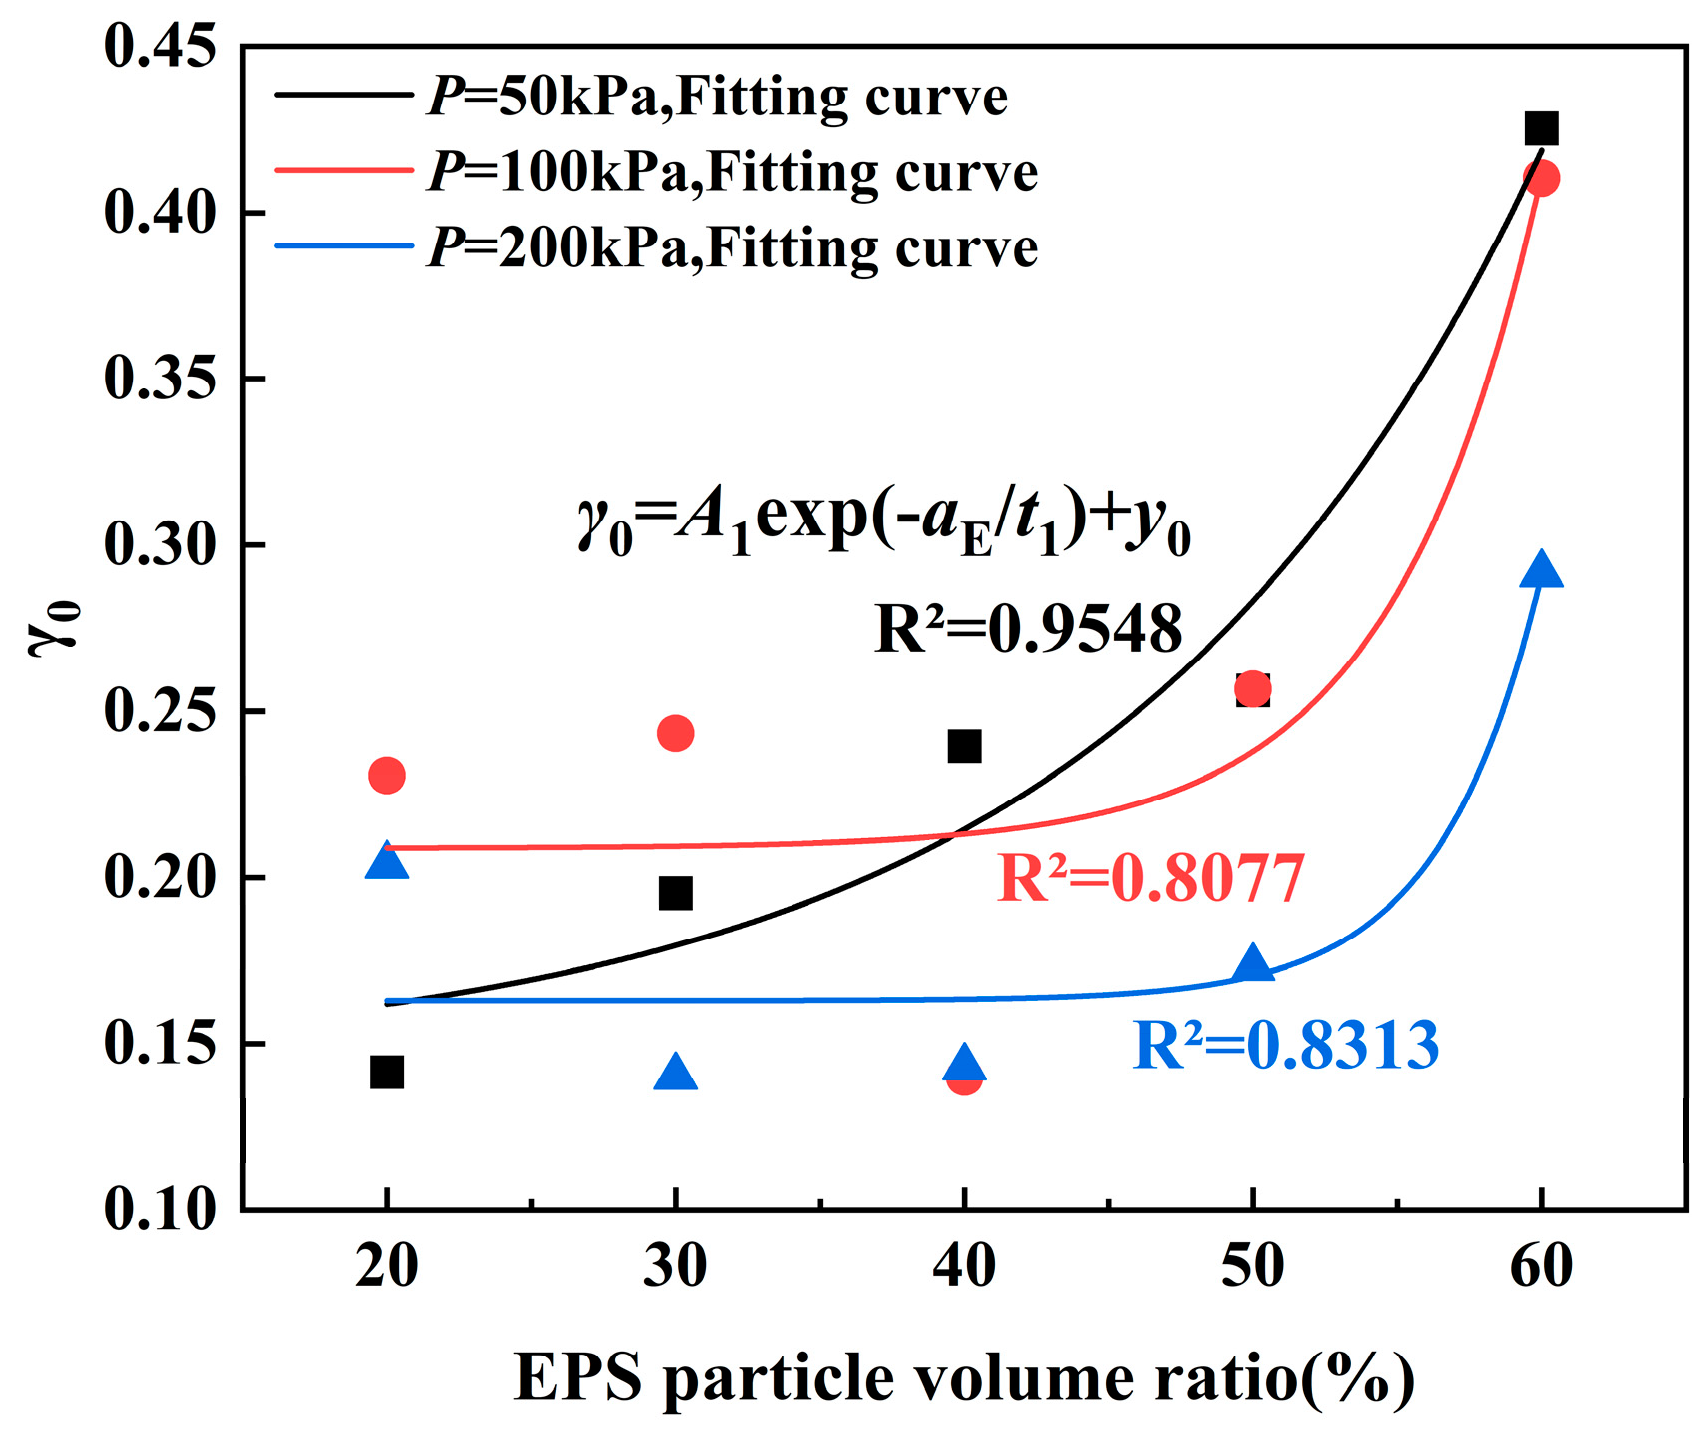
- The reduction in G of ELS with increasing γ at small strains is fundamentally due to the lightweight soil’s structural deterioration. The damage model, incorporating the damage variable D, effectively reflects the attenuation pattern and damage process of the G of ELS at small strains. The parameter γ0 and EPS particle content are functionally related, with γ0 ranging from 0.14 to 0.43. The parameter m0 and confining pressure are also functionally related, with m0 ranging from 0.64 to 1.48.
Author Contributions
Funding
Institutional Review Board Statement
Data Availability Statement
Conflicts of Interest
Glossary
| Abbreviation | Implication |
| EPS | Expanded polystyrene |
| ELS | Expanded polystyrene particles in lightweight soil |
| H-D | Hardin–Drnevich model |
| G | Dynamic shear modulus (MPa) |
| Gmax | Maximum dynamic shear modulus (MPa) |
| ACOi | Achievement degree of each teaching objective |
| Variables | Implication |
| P | Confining pressure (kPa) |
| I | Moment of inertia of the sample (kg·m2) |
| m | Mass (kg) |
| d | Outside diameter (m) |
| I0 | Moment of inertia of the resonant column system (kg·m2) |
| Vs | Shear wave velocity (m/s) |
| f | Resonance frequency obtained from the resonant column test (Hz) |
| H | Specimen’s height (m) |
| β | Torsional vibration frequency equation’s eigenvalue |
| ρ | Density of the specimen (t/m3) |
| aE | EPS particle content (%) |
| γ | Dynamic shear strain (%) |
| G-γ | Dynamic shear modulus and dynamic shear-strain relationship |
| a,b | Empirical constants |
| τ | Dynamic shear stress (kPa) |
| D | Damage variable |
| γ0,m0 | Parameters of Weibull distribution function |
| γr | Reference shear strain (%) |
| R2 | Correlation coefficient |
| xi | Dynamic shear modulus measured from the resonant column test (MPa) |
| Average value of the dynamic shear modulus measured from the test (MPa) | |
| x | Dynamic shear modulus obtained from the model calculations (MPa) |
| A1, t1, y0, g, φ | Model parameters |
| T | Curing age (d) |
| V | Resonance output voltage (Volts) |
| Average score of the jth assessment method for the ith teaching objective on a percentage scale | |
| aj | Proportion of the jth assessment method |
| Support weight of the jth assessment method for the ith teaching objective. | |
| n | Total number of assessment methods |
References
- Zhang, C.; Zhu, Z.; Zhang, Y.; Liu, F.; Yang, Y.; Wan, Y.; Huo, W.; Yang, L. Engineering properties and optimal design of foam lightweight soil composite fly ash: An eco-friendly subgrade material. J. Clean. Prod. 2023, 429, 139631. [Google Scholar] [CrossRef]
- Tao, H.; Zheng, W.; Zhou, X.; Zhang, L.; Li, C.Z.; Yu, Y.; Jiang, P. Study on Dynamic Modulus and Damping Characteristics of Modified Expanded Polystyrene Lightweight Soil under Cyclic Load. Polymers 2023, 15, 1865. [Google Scholar] [CrossRef]
- Zhang, L.; Huang, M.; Fenghao, Y.; Zhang, W. A novel hydrophilic modification method of EPS particles: Conception design and performances in concrete. Cem. Concr. Comp. 2023, 142, 105199. [Google Scholar] [CrossRef]
- Rashid, A.S.A.; Black, J.A.; Kueh, A.B.H.; Mohamad, H.; Noor, N.M. Bearing capacity charts of soft soil reinforced by deep mixing. Proc. Inst. Civ. Eng. 2017, 170, 12–25. [Google Scholar] [CrossRef]
- Zhang, Z.; Li, D.; Wang, J.; Jiang, J. Cascade upcycling polystyrene waste into ethylbenzene over Fe2N@C. Appl. Catal. B Environ. 2023, 323, 122164. [Google Scholar] [CrossRef]
- Kiptum, C.K.; Mwirigi, V.M.; Ochieng, S.O. Comparing compressive strengths of layered and random placement of expanded polystyrene wastes in quarry dust blocks. J. Civ. Eng. Sci. Technol. 2020, 11, 57–63. [Google Scholar] [CrossRef]
- Castellón, J.; Ledesma, A. Development of a new advanced elastoplastic constitutive model that considers soil behavior at small strains. The EPHYSS Model. Int. J. Numer. Anal. Methods Geomech. 2022, 46, 1991–2032. [Google Scholar] [CrossRef]
- Clayton, C.R.I. Stiffness at small strain: Research and practice. Géotechnique 2011, 61, 5–37. [Google Scholar] [CrossRef]
- Chen, G.; Yang, C.; Qu, L.; Tong, X.; Zhang, K.; Zhang, L. Shaking table test and numerical analysis of dynamic response and damage mechanism of a deposit slope with a weak interlayer reinforced by a pile–anchor structure. Structures 2024, 59, 105728. [Google Scholar] [CrossRef]
- Chowdhury, S.; Patra, N.R. Influence of geogrid reinforcement on dynamic characteristics and response analysis of Panki pond ash. Nat. Hazards 2023, 119, 435–461. [Google Scholar] [CrossRef]
- Sun, X.; Qin, X.; Liu, Z.; Yin, Y. Damaging effect of fine grinding treatment on the microstructure of polyurea elastomer modifier used in asphalt binder. Measurement 2024, 242, 115984. [Google Scholar] [CrossRef]
- Sun, X.; Xu, H.; Zheng, X.; Qin, X.; Guo, T.; Gao, J. Microscopic effect and mechanism of spray polyurea modifier on the asphalt binder: Experimental characterization and molecular dynamics simulations. Polymer 2024, 316, 127807. [Google Scholar] [CrossRef]
- El-Sherbiny, R.; Ramadan, S.H.; Elkhouly, M.A. Dynamic properties of sand-EPS bead mixtures. Geosynth. Int. 2018, 25, 456–470. [Google Scholar] [CrossRef]
- Gao, H.; Li, X.; Wang, Z.H.; Stuedlein, A.W.; Wang, Y. Dynamic shear modulus and damping of expanded polystyrene composite soils at low strains. Geosynth. Int. 2019, 26, 436–450. [Google Scholar] [CrossRef]
- Alaie, R.; Chenari, R.J. Dynamic properties of EPS-sand mixtures using cyclic triaxial and bender element tests. Geosynth. Int. 2019, 26, 563–579. [Google Scholar] [CrossRef]
- Bekranbehesht, B.; Rezvani, R.; Payan, M.; Chenari, R.J. Nondestructive Shear Stiffness Evaluation of EPS-Sand Composites Using Quartz and Calcareous Aggregates. J. Mater. Civ. Eng. 2023, 35, 04023174. [Google Scholar] [CrossRef]
- Gao, H.; Bu, C.; Wang, Z.; Shen, Y.; Chen, G. Dynamic characteristics of expanded polystyrene composite soil under traffic loadings considering initial consolidation state. Soil Dyn. Earthq. Eng. 2017, 102, 86–98. [Google Scholar] [CrossRef]
- Zhu, L.; Wen, K.; Tong, R.; Li, M. Dynamic Shear Strength Characteristics of Lightweight Sand-EPS Soil. Sustainability 2022, 14, 7397. [Google Scholar] [CrossRef]
- Lang, L.; Li, F.; Chen, B. Small-strain dynamic properties of silty clay stabilized by cement and fly ash. Constr. Build. Mater. 2020, 237, 117646. [Google Scholar] [CrossRef]
- Li, N.; Jiang, P.; Li, C.; Wang, W. College Teaching Innovation from the Perspective of Sustainable Development: The Construction and Twelve-Year Practice of the 2P3E4R System. Sustainability 2022, 14, 7130. [Google Scholar] [CrossRef]
- JTG 3430-2020; Test Methods of Soils for Highway Engineering. Standardization Administration of China: Beijing, China, 2020.
- GB/T 50123-2019; Standard for Geotechnical Testing Method. Standardization Administration of China: Beijing, China, 2019.
- Li, N.; Pang, Y.; Wang, W.; Wu, E.; Fan, M.; Jiang, P.; Mei, G. Enhancement effect of calcium carbide residue and rice husk ash on soft soil: Small-strain property and micro mechanism. J. Mater. Res. Technol. 2024, 32, 774–791. [Google Scholar] [CrossRef]
- Villacreses, J.P.; Caicedo, B.; Caro, S.; Yépez, F. A novel procedure to determine shear dynamic modulus and damping ratio for partial saturated compacted fine-grained soils. Soil Dyn. Earthq. Eng. 2020, 131, 106029. [Google Scholar] [CrossRef]
- Liu, Z.; Kim, J.; Hu, G.; Hu, W.; Ning, F. Geomechanical property evolution of hydrate-bearing sediments under dynamic loads: Nonlinear behaviors of modulus and damping ratio. Eng. Geol. 2021, 295, 106427. [Google Scholar] [CrossRef]
- Qiu, T.; Huang, Y.; Guadalupe-Torres, Y.; Baxter, C.; Fox, P.J. Effective Soil Density for Small-Strain Shear Waves in Saturated Granular Materials. J. Geotech. Geoenviron. Eng. 2015, 141, 04015036. [Google Scholar] [CrossRef]
- Zhang, C.; Li, D.; Wang, C.; Ma, J.; Zhou, A.; Xiao, P. Effect of confining pressure on shear fracture behavior and surface morphology of granite by the short core in compression test. Theor. Appl. Fract. Mech. 2022, 121, 103506. [Google Scholar] [CrossRef]
- Zhang, M.; Shen, J.; Yang, R.; Ji, H.; Ding, J. Effect of Curing Age on the Microstructure and Hydration Behavior of Oil Well Cement Paste Cured at High Temperature. J. Mater. Civ. Eng. 2021, 33, 04021006. [Google Scholar] [CrossRef]
- Wu, Q.; Xiao, X.; Zhu, E.; Chen, S.; Chen, G.; Du, X. Experimental investigation on dynamic shear modulus of undisturbed marine soils in the east coast of China. Ocean Eng. 2023, 289, 116130. [Google Scholar] [CrossRef]
- Feng, Y.; Qin, D.; Chen, Z.; Li, Y. Multiscale Enhancement Mechanisms of EVA on EPS-Cement Composites. J. Mater. Civ. Eng. 2023, 35, 04023102. [Google Scholar] [CrossRef]
- Dixit, A.; Pang, S.D.; Kang, S.; Moon, J. Lightweight structural cement composites with expanded polystyrene (EPS) for enhanced thermal insulation. Cem. Concr. Comp. 2019, 102, 185–197. [Google Scholar] [CrossRef]
- Gao, Y.; Wang, S.; Chen, C. A united deformation-strength framework for Lightweight Sand–EPS Beads Soil (LSES) under cyclic loading. Soil Dyn. Earthq. Eng. 2011, 31, 1144–1153. [Google Scholar] [CrossRef]
- Maghfouri, M.; Alimohammadi, V.; Gupta, R.; Saberian, M.; Azarsa, P.; Shafigh, P.; Asadi, I.; Roychand, R. Drying shrinkage properties of expanded polystyrene (EPS) lightweight aggregate concrete: A review. Case Stud. Constr. Mater. 2022, 16, e919. [Google Scholar] [CrossRef]
- Ranjbar, M.M.; Mousavi, S.Y. Strength and durability assessment of self-compacted lightweight concrete containing expanded polystyrene. Mater. Struct. 2013, 48, 1001–1011. [Google Scholar] [CrossRef]
- Said, M.; Adam, M.; Arafa, A.E.; Moatasem, A. Improvement of punching shear strength of reinforced lightweight concrete flat slab using different strengthening techniques. J. Build. Eng. 2020, 32, 101749. [Google Scholar] [CrossRef]
- Hou, T.; Cui, Y.; Pan, X.; Luo, Y.; Liu, Q. Characteristics of dynamic shear modulus and damping ratio and the structural formula of EPS particles lightweight soil. Soil Dyn. Earthq. Eng. 2023, 166, 107768. [Google Scholar] [CrossRef]
- Hardin, B.O.; Drnevich, V.P. Shear modulus and damping in soils: Design equations and curves. J. Soil Mech. Found. Div. 1972, 98, 667–692. [Google Scholar] [CrossRef]
- Liao, H.; Fang, Y.; Yao, Z.; Yu, T.; Luo, H.; Zhu, N.; Wang, Y.; Li, M. Effects of fiber and rubber materials on the dynamic mechanical behaviors and damage evolution of shotcrete under cyclic impact load. J. Build. Eng. 2023, 73, 106763. [Google Scholar] [CrossRef]
- Zhao, Y.; Yang, Y.; Ling, X.; Gong, W.; Li, G.; Su, L. Dynamic behavior of natural sand soils and fiber reinforced soils in heavy-haul railway embankment under multistage cyclic loading. Transp. Geotech. 2021, 28, 100507. [Google Scholar] [CrossRef]
- Zou, Z.; Yan, J.; Tang, H.; Wang, S.; Xiong, C.; Hu, X. A shear constitutive model for describing the full process of the deformation and failure of slip zone soil. Eng. Geol. 2020, 276, 105766. [Google Scholar] [CrossRef]
- Zhang, H.; Jin, C.; Wang, L.; Pan, L.; Liu, X.; Ji, S. Research on dynamic splitting damage characteristics and constitutive model of basalt fiber reinforced concrete based on acoustic emission. Constr. Build. Mater. 2022, 319, 126018. [Google Scholar] [CrossRef]
- Yan, J.; Kong, L.; Wang, J. Evolution law of small strain shear modulus of expansive soil: From a damage perspective. Eng. Geol. 2023, 315, 107017. [Google Scholar] [CrossRef]
- Yan, J.; Zou, Z.; Mu, R.; Hu, X.; Zhang, J.; Zhang, W.; Su, A.; Wang, J.; Luo, T. Evaluating the stability of Outang landslide in the Three Gorges Reservoir area considering the mechanical behavior with large deformation of the slip zone. Nat. Hazards 2022, 112, 2523–2547. [Google Scholar] [CrossRef]
- Ueno, K.; Kuroda, S.; Hori, T.; Tatsuoka, F. Elastic shear modulus variations during undrained cyclic loading and subsequent reconsolidation of saturated sandy soil. Soil Dyn. Earthq. Eng. 2019, 116, 476–489. [Google Scholar] [CrossRef]
- Fu, J.; Wang, W.; Tianhong, F.; Wang, X.; Wu, H.; Xu, M. Dynamic characteristics and microscopic mechanism of graphene oxide modified coastal soft soil under small strain. Constr. Build. Mater. 2024, 448, 138257. [Google Scholar] [CrossRef]
- Hou, T.; Pei, Z.; Luo, Y.; Cui, Y. Study on the Dynamic Constitutive Relationship of EPS particles Light Weight Soil Based on Hardin–Drnevich Model. Geotech. Geol. Eng. 2019, 38, 1785–1798. [Google Scholar] [CrossRef]
- Primusz, P.; Tóth, C. Use of the Modified Ramberg-Osgood Material Model to Predict Dynamic Modulus Master Curves of Asphalt Mixtures. Materials 2023, 16, 531. [Google Scholar] [CrossRef] [PubMed]
- Ahn, S.; Ryou, J.; Ahn, K.; Lee, C.; Lee, J.; Jung, J. Evaluation of Dynamic Properties of Sodium-Alginate-Reinforced Soil Using A Resonant-Column Test. Materials 2021, 14, 2743. [Google Scholar] [CrossRef] [PubMed]
- Wu, Q.; Liu, Q.; Zhuang, H.; Xu, C.; Chen, G. Experimental investigation of dynamic shear modulus of saturated marine coral sand. Ocean Eng. 2022, 264, 112412. [Google Scholar] [CrossRef]
- Hang, T.; Fan, H.; Xing, X.; Zhang, L.; Liang, K.; Wu, Q.; Chen, G. Prediction model for small-strain shear modulus of non-plastic fine–coarse-grained soil mixtures based on extreme void ratios. Soil Dyn. Earthq. Eng. 2024, 176, 108279. [Google Scholar] [CrossRef]


| Plastic Limit (%) | Liquid Limit (%) | Plasticity Index | Liquidity Index | Natural Water Content (%) | Specific Gravity |
|---|---|---|---|---|---|
| 23 | 37 | 14 | 0.43 | 29 | 2.88 |
| EPS Particle Content (%) | Cement (%) | Sodium Silicate (%) | Water Content (%) | Curing Age (d) | Confining Pressure (kPa) |
|---|---|---|---|---|---|
| 20, 30, 40, 50, 60 | 20 | 6 | 90 | 3, 7, 28 | 50, 100, 200 |
| Curing Age (d) | Confining Pressure (kPa) | EPS Content (%) | Gmax (MPa) | Gmax Decline Percentage (%) |
|---|---|---|---|---|
| 64–178 | 64 | |||
| 3–28 | 50–200 | 20–60 | 79–238 | 67 |
| 117–280 | 58 |
| Model | Expression | Strain Range | Applicable Type | Reference Source |
|---|---|---|---|---|
| Hardin–Drnevich model | 0.001–1% | Various soil types | Fu [45] Hou [46] | |
| Ramberg–Osgood model | 0.01–5% | Often used on clay and fine-grain soils | Primusz [47] Ahn [48] | |
| Maitin–Davidenkov model | 0.001–10% | Complex soil types | Wu [49] |
| Confining Pressure | EPS Particles Volume Ratio (%) | Damage Model | R2 | H-D Model | R2 | |
|---|---|---|---|---|---|---|
| γ0 (%) | m0 | γr (%) | ||||
| 20 | 0.14139 | 0.86659 | 0.98896 | 0.13142 | 0.98649 | |
| 30 | 0.19530 | 0.80207 | 0.98922 | 0.12134 | 0.98392 | |
| 50 kPa | 40 | 0.23946 | 0.63587 | 0.96294 | 0.11212 | 0.91764 |
| 50 | 0.25624 | 0.75463 | 0.98174 | 0.14869 | 0.97121 | |
| 60 | 0.42529 | 0.64484 | 0.95232 | 0.19515 | 0.90845 | |
| 20 | 0.23067 | 0.98693 | 0.97956 | 0.15903 | 0.97718 | |
| 30 | 0.24339 | 0.87549 | 0.99093 | 0.17341 | 0.99059 | |
| 100 kPa | 40 | 0.13985 | 1.00101 | 0.98968 | 0.11535 | 0.98450 |
| 50 | 0.25658 | 0.87810 | 0.99108 | 0.18476 | 0.99317 | |
| 60 | 0.41034 | 0.76591 | 0.98066 | 0.23946 | 0.97266 | |
| 20 | 0.20365 | 1.01547 | 0.98588 | 0.18551 | 0.98536 | |
| 30 | 0.14004 | 1.47926 | 0.99830 | 0.26403 | 0.95235 | |
| 200 kPa | 40 | 0.14290 | 1.24764 | 0.99807 | 0.16894 | 0.96993 |
| 50 | 0.17282 | 1.46766 | 0.99745 | 0.26495 | 0.94028 | |
| 60 | 0.29132 | 1.14622 | 0.98428 | 0.30510 | 0.96832 | |
| Advantage | ① Low density; lightweight; can ease the uneven subgrade settlement of soft soil. ② In the small strain range (10−6–10−4), it has a high dynamic shear modulus; it can also resist shear deformation. ③ Increasing confining pressure and prolonging curing age can significantly increase dynamic shear modulus and enhance mechanical properties. ④ Combining material science, soil mechanics, and environmental protection principles, it has environmental protection significance. |
| Disadvantage | ① With the increase in the EPS particle content, the dynamic shear modulus (G) and maximum shear modulus (Gmax) decreased significantly, and the mechanical properties decreased. ② In the small strain range, the dynamic shear modulus (G) decreases with the increase in shear strain (γ), indicating that the structure will gradually degenerate during the stress process. |
Disclaimer/Publisher’s Note: The statements, opinions and data contained in all publications are solely those of the individual author(s) and contributor(s) and not of MDPI and/or the editor(s). MDPI and/or the editor(s) disclaim responsibility for any injury to people or property resulting from any ideas, methods, instructions or products referred to in the content. |
© 2025 by the authors. Licensee MDPI, Basel, Switzerland. This article is an open access article distributed under the terms and conditions of the Creative Commons Attribution (CC BY) license (https://creativecommons.org/licenses/by/4.0/).
Share and Cite
Jiang, P.; Wu, X.; Chen, L.; Li, N.; Wu, E. Testing Small-Strain Dynamic Characteristics of Expanded Polystyrene Lightweight Soil: Reforming the Teaching of Engineering Detection Experiments. Polymers 2025, 17, 730. https://doi.org/10.3390/polym17060730
Jiang P, Wu X, Chen L, Li N, Wu E. Testing Small-Strain Dynamic Characteristics of Expanded Polystyrene Lightweight Soil: Reforming the Teaching of Engineering Detection Experiments. Polymers. 2025; 17(6):730. https://doi.org/10.3390/polym17060730
Chicago/Turabian StyleJiang, Ping, Xinghan Wu, Lejie Chen, Na Li, and Erlu Wu. 2025. "Testing Small-Strain Dynamic Characteristics of Expanded Polystyrene Lightweight Soil: Reforming the Teaching of Engineering Detection Experiments" Polymers 17, no. 6: 730. https://doi.org/10.3390/polym17060730
APA StyleJiang, P., Wu, X., Chen, L., Li, N., & Wu, E. (2025). Testing Small-Strain Dynamic Characteristics of Expanded Polystyrene Lightweight Soil: Reforming the Teaching of Engineering Detection Experiments. Polymers, 17(6), 730. https://doi.org/10.3390/polym17060730